GRAINS WAITING ON NEWS
AUDIO COMMENTARY
Poor closes especially in beans
Saw a ton of sales today
Talk that buyers front running
Markets simply waiting for new news
No short term bull stories
Stuck in ranges
Most known factors are priced in
Outlook for corn is strong demand
Outlook for beans is bearish globally
Why I think wheat has “potential”
Not a fan of commercial storage
Ways to spread out your risk
No story for funds to get long here soon
Possible routes instead of paying storage
High input costs lead to less acres?
Remaining overall patient with stuff in bins
Using the right tools if you are selling
Chart breakdowns below*
“Potential” H&S in beans below*
Listen to today’s audio
Miss Our Halloween Sale?
Since you are on a trial, here is extended access.
Want to talk? (605)295-3100
CHARTS
Dec Corn 🌽
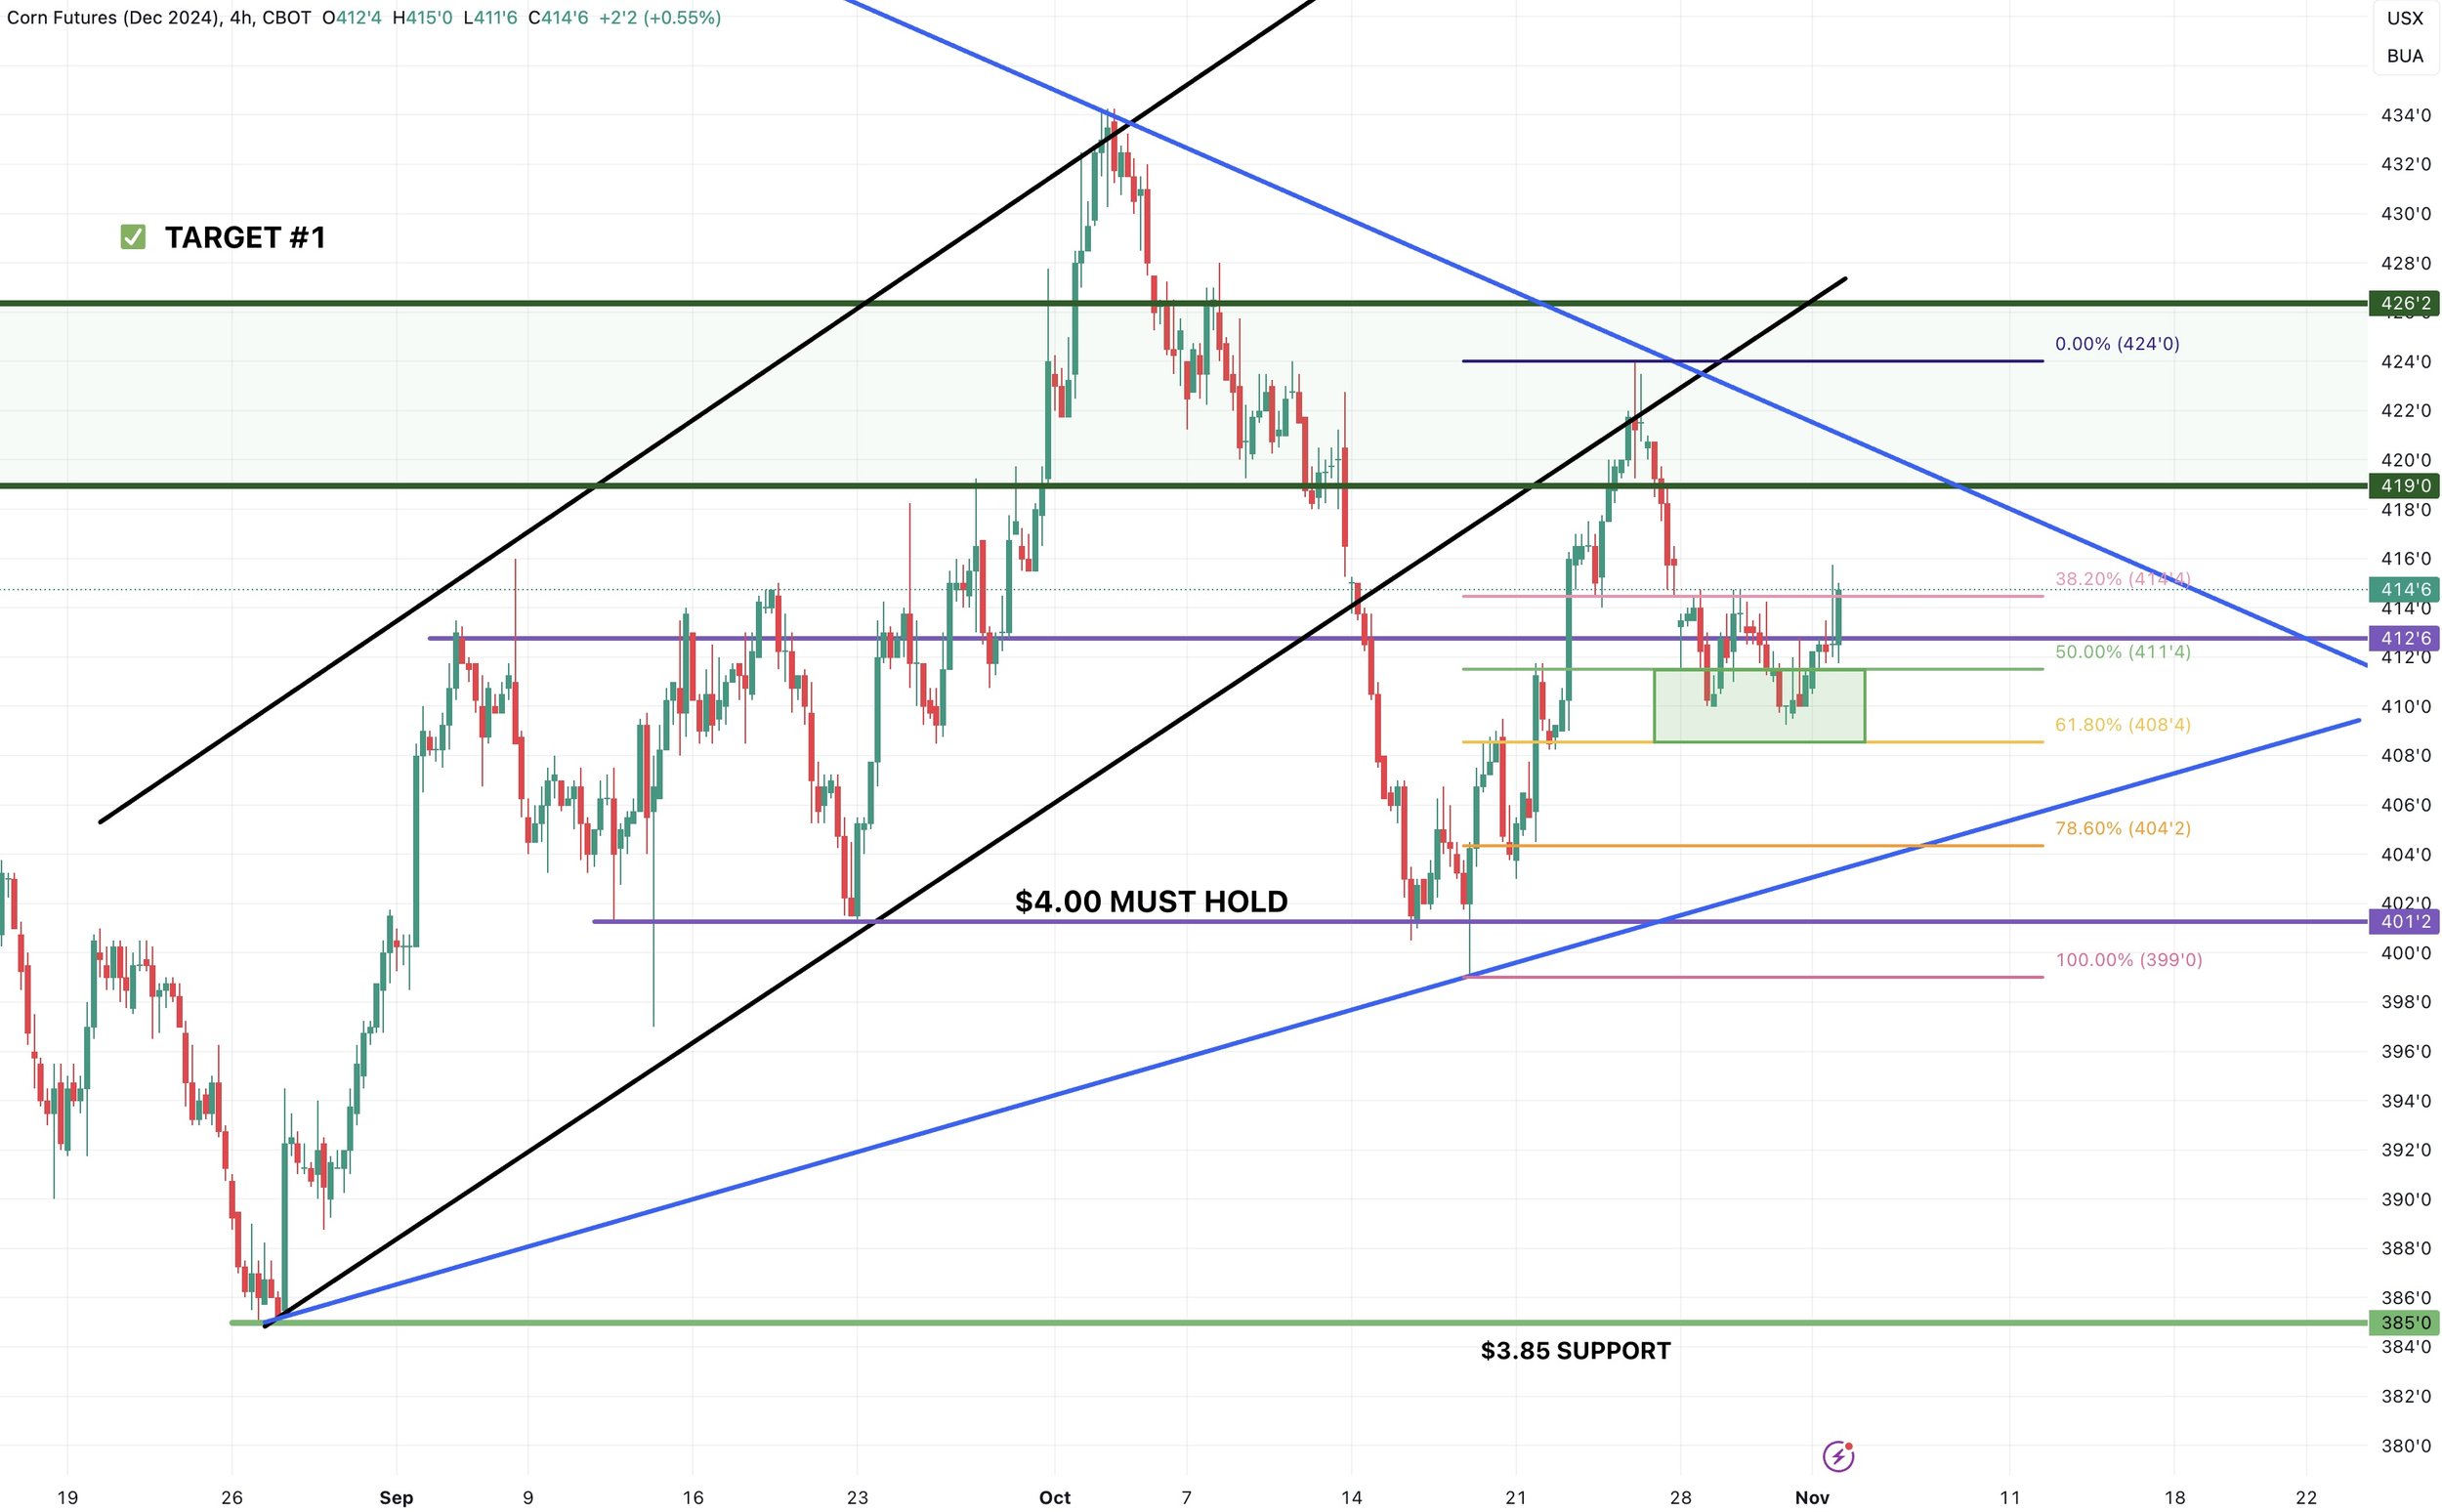
First the 4 hour chart.
Looks pretty good here so far. We are reacting to that green box (50%-61.8% retracement levels). So would be a good spot to bounce if we were going to.
Other than that, $4.00 is a must hold still.
If we break that dark blue downtrend, I like our chances of seeing more upside.
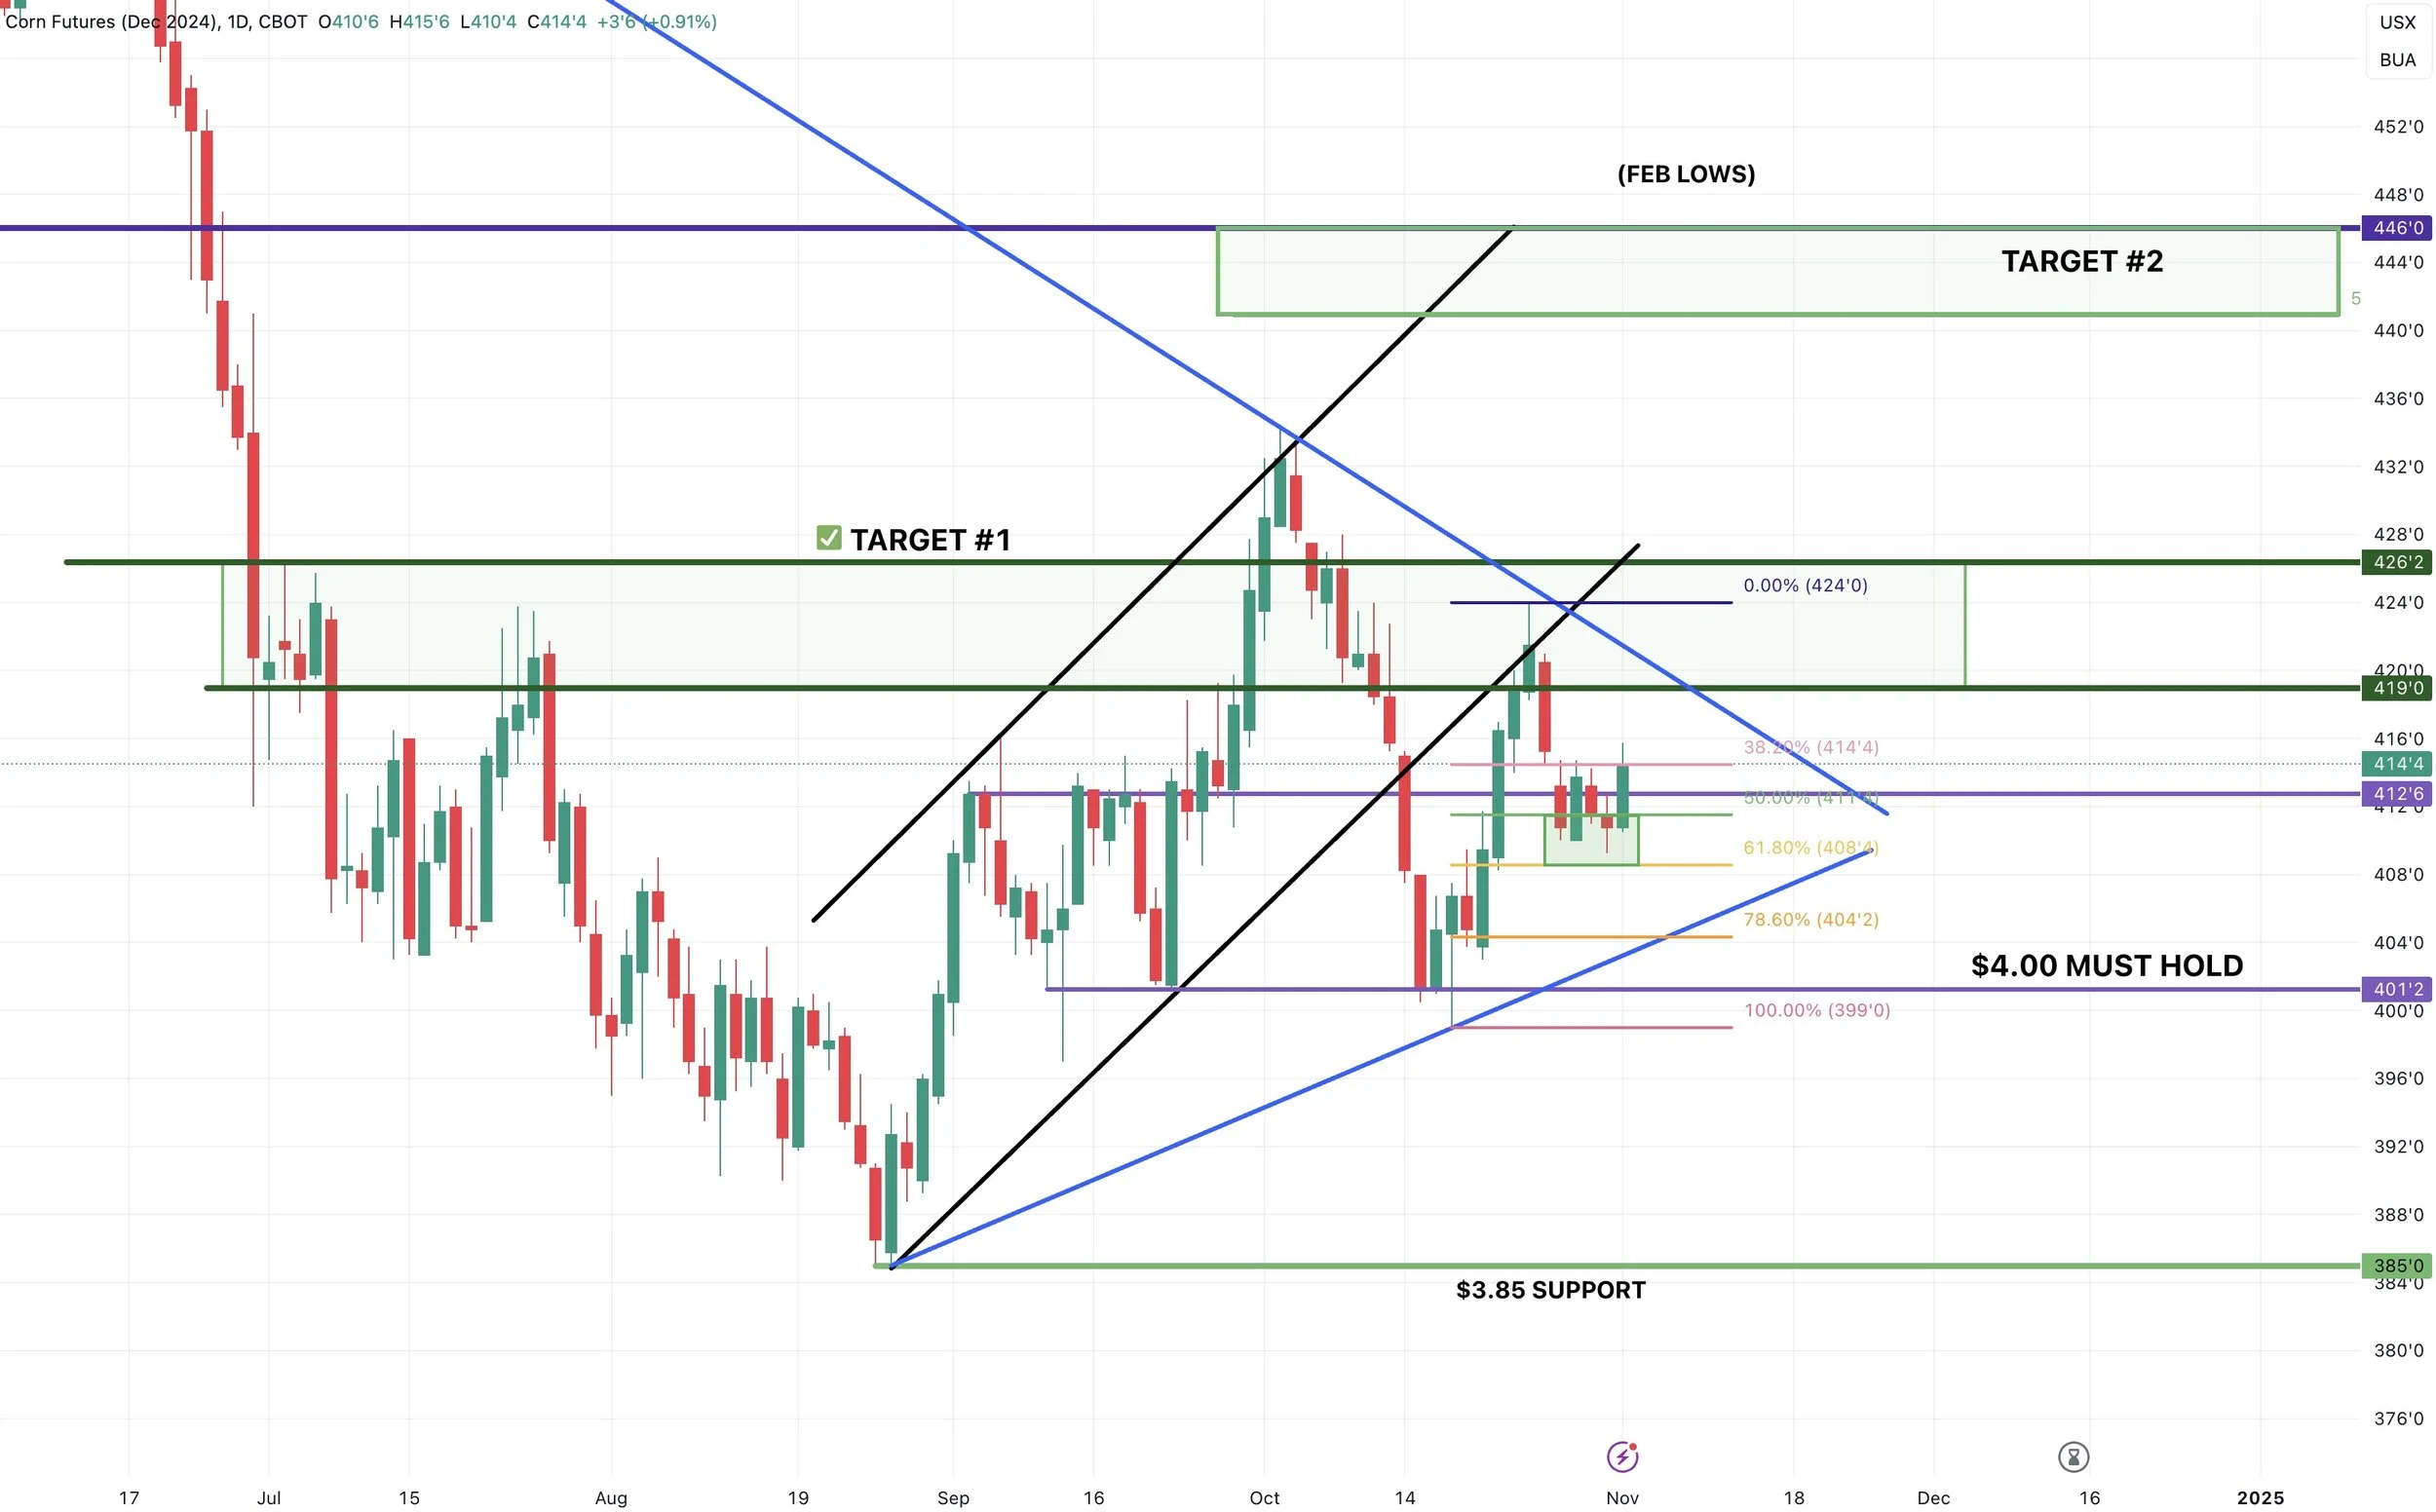
Here is the daily chart.
Jan Beans 🌱
We do have a “potential” head & shoulders pattern on the 4 hour chart.
Again this does not have to happen. But the implied move would take us to $9.40 IF the neckline at $9.76 does not hold.
So right now the levels to watch are $9.76 (must hold)
And $10.14. If we close above there it negates this potential head & shoulders and would look friendly.
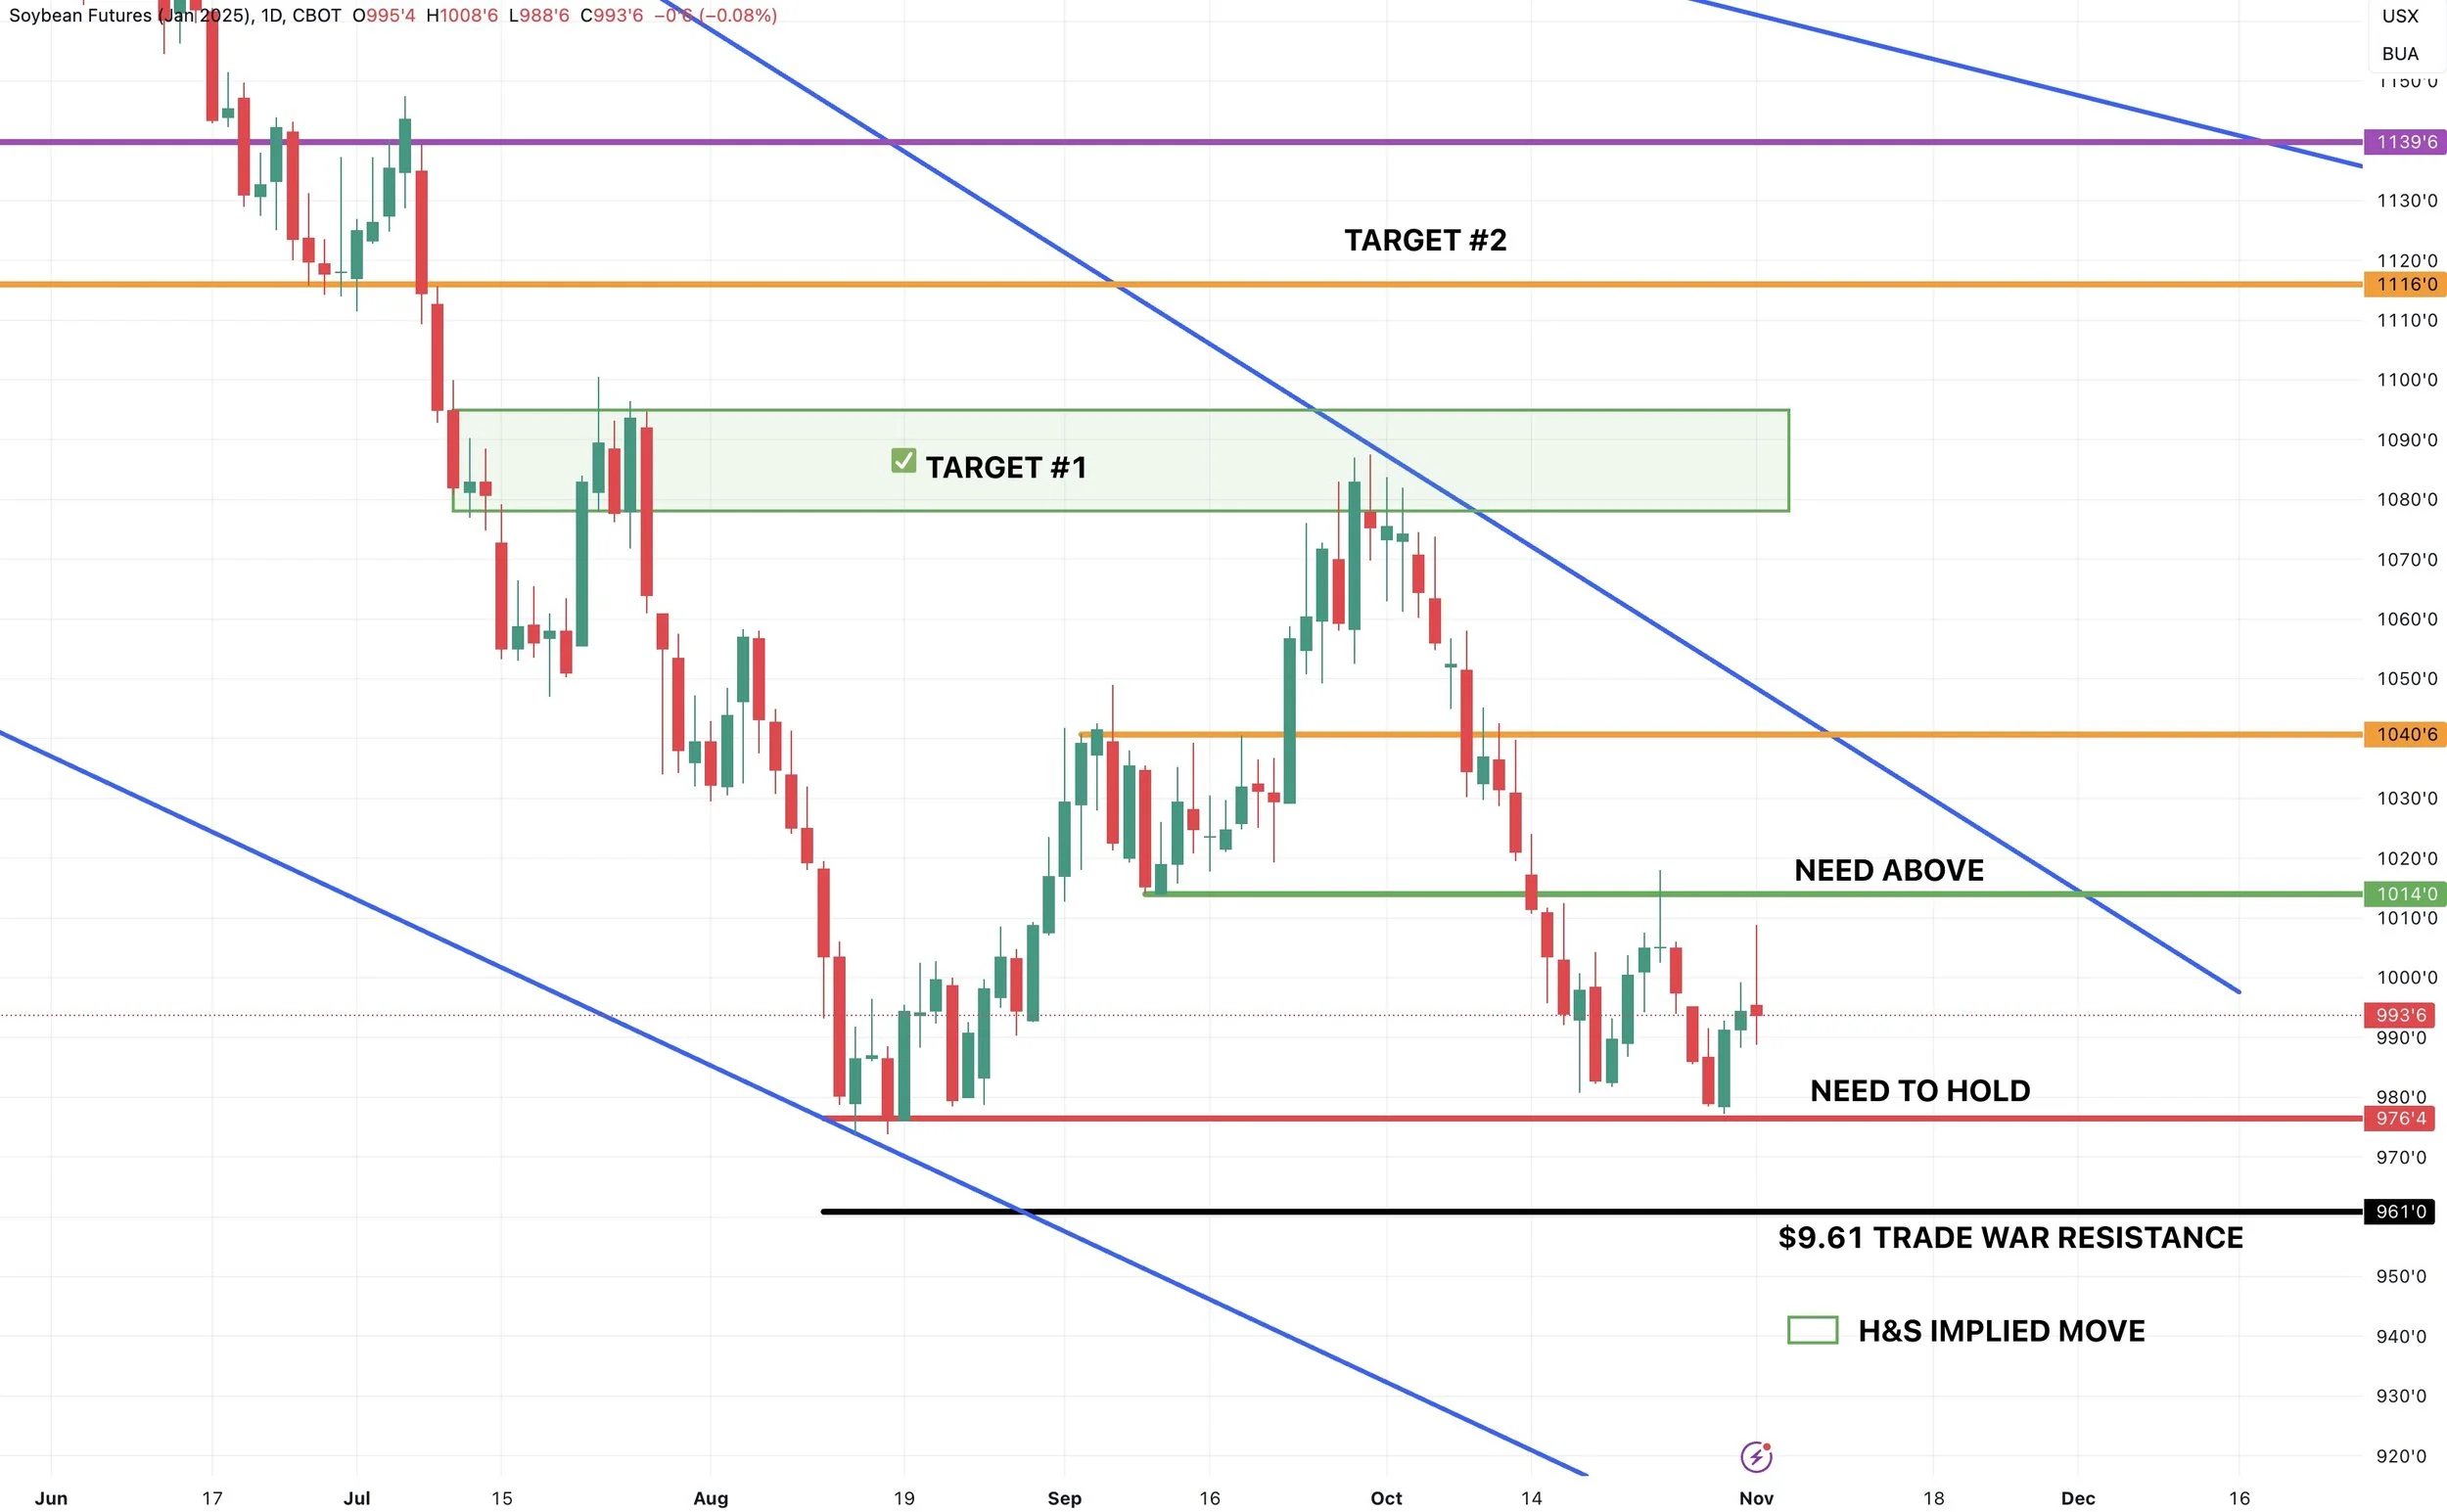
Here is the daily chart.
You cannot see the H&S pattern on the daily.
But you can see how crucial it is that we hold $9.76 and break above $10.14
Dec Chicago Wheat 🌾
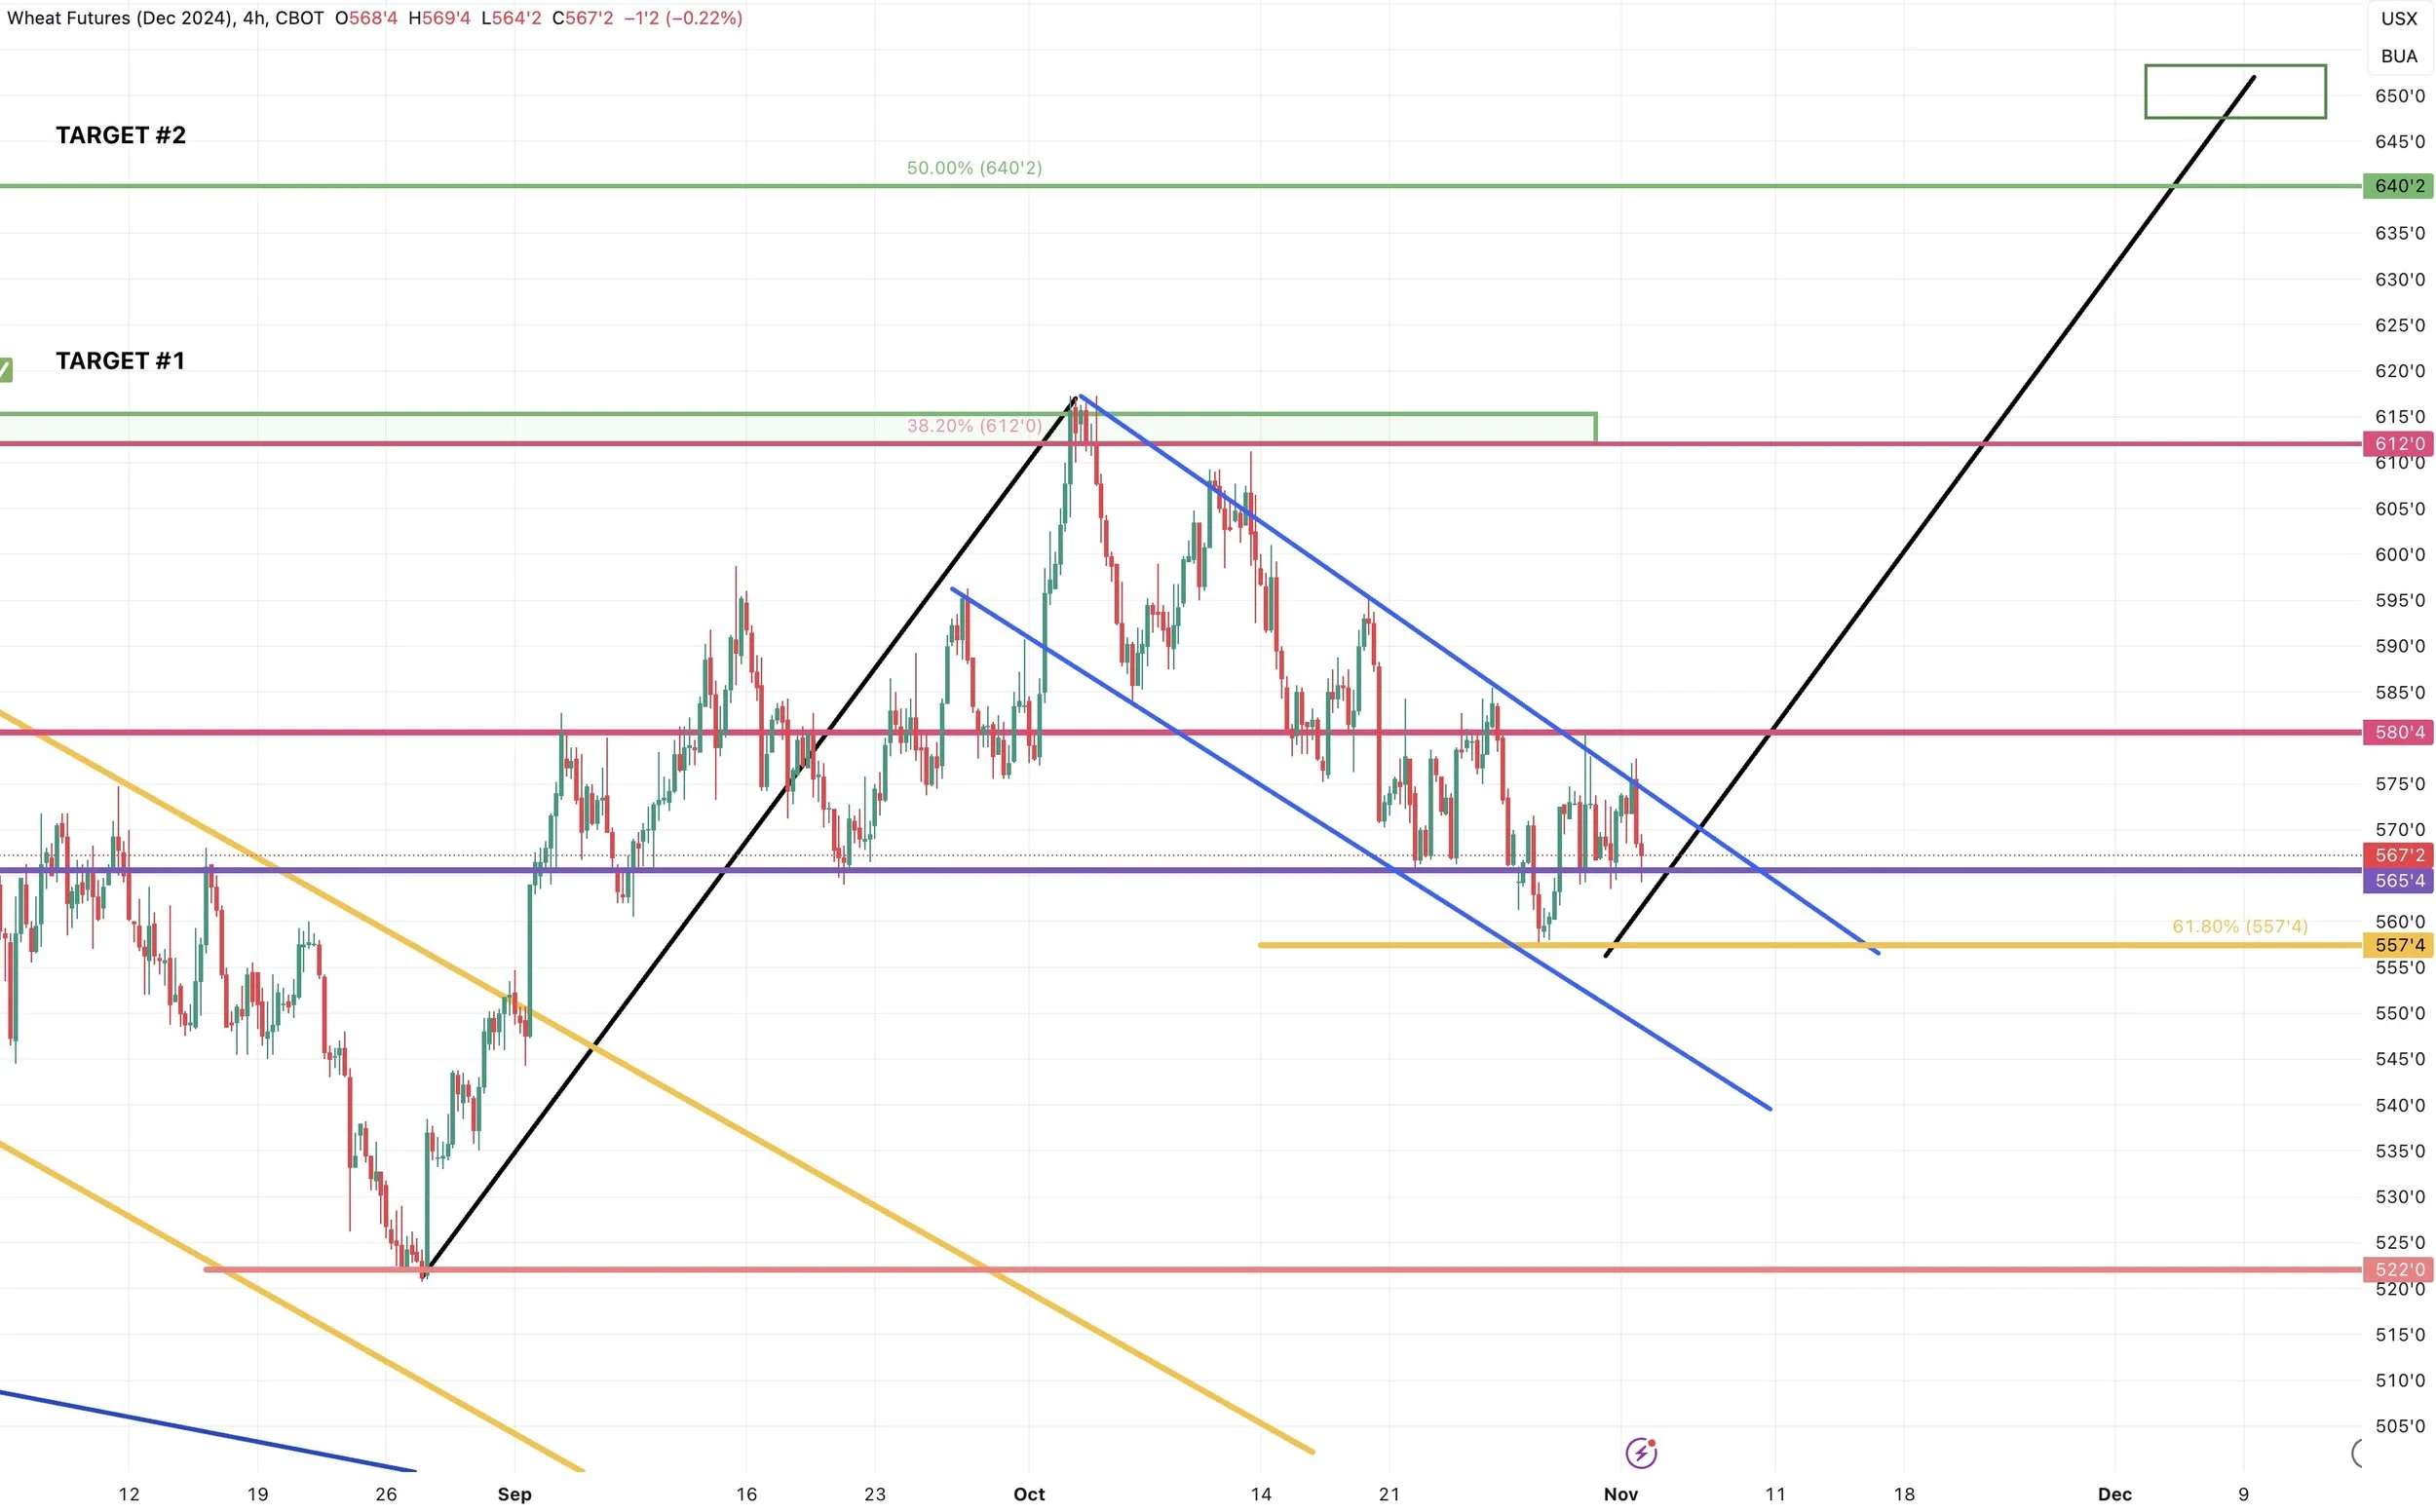
Here is the 4 hour chart.
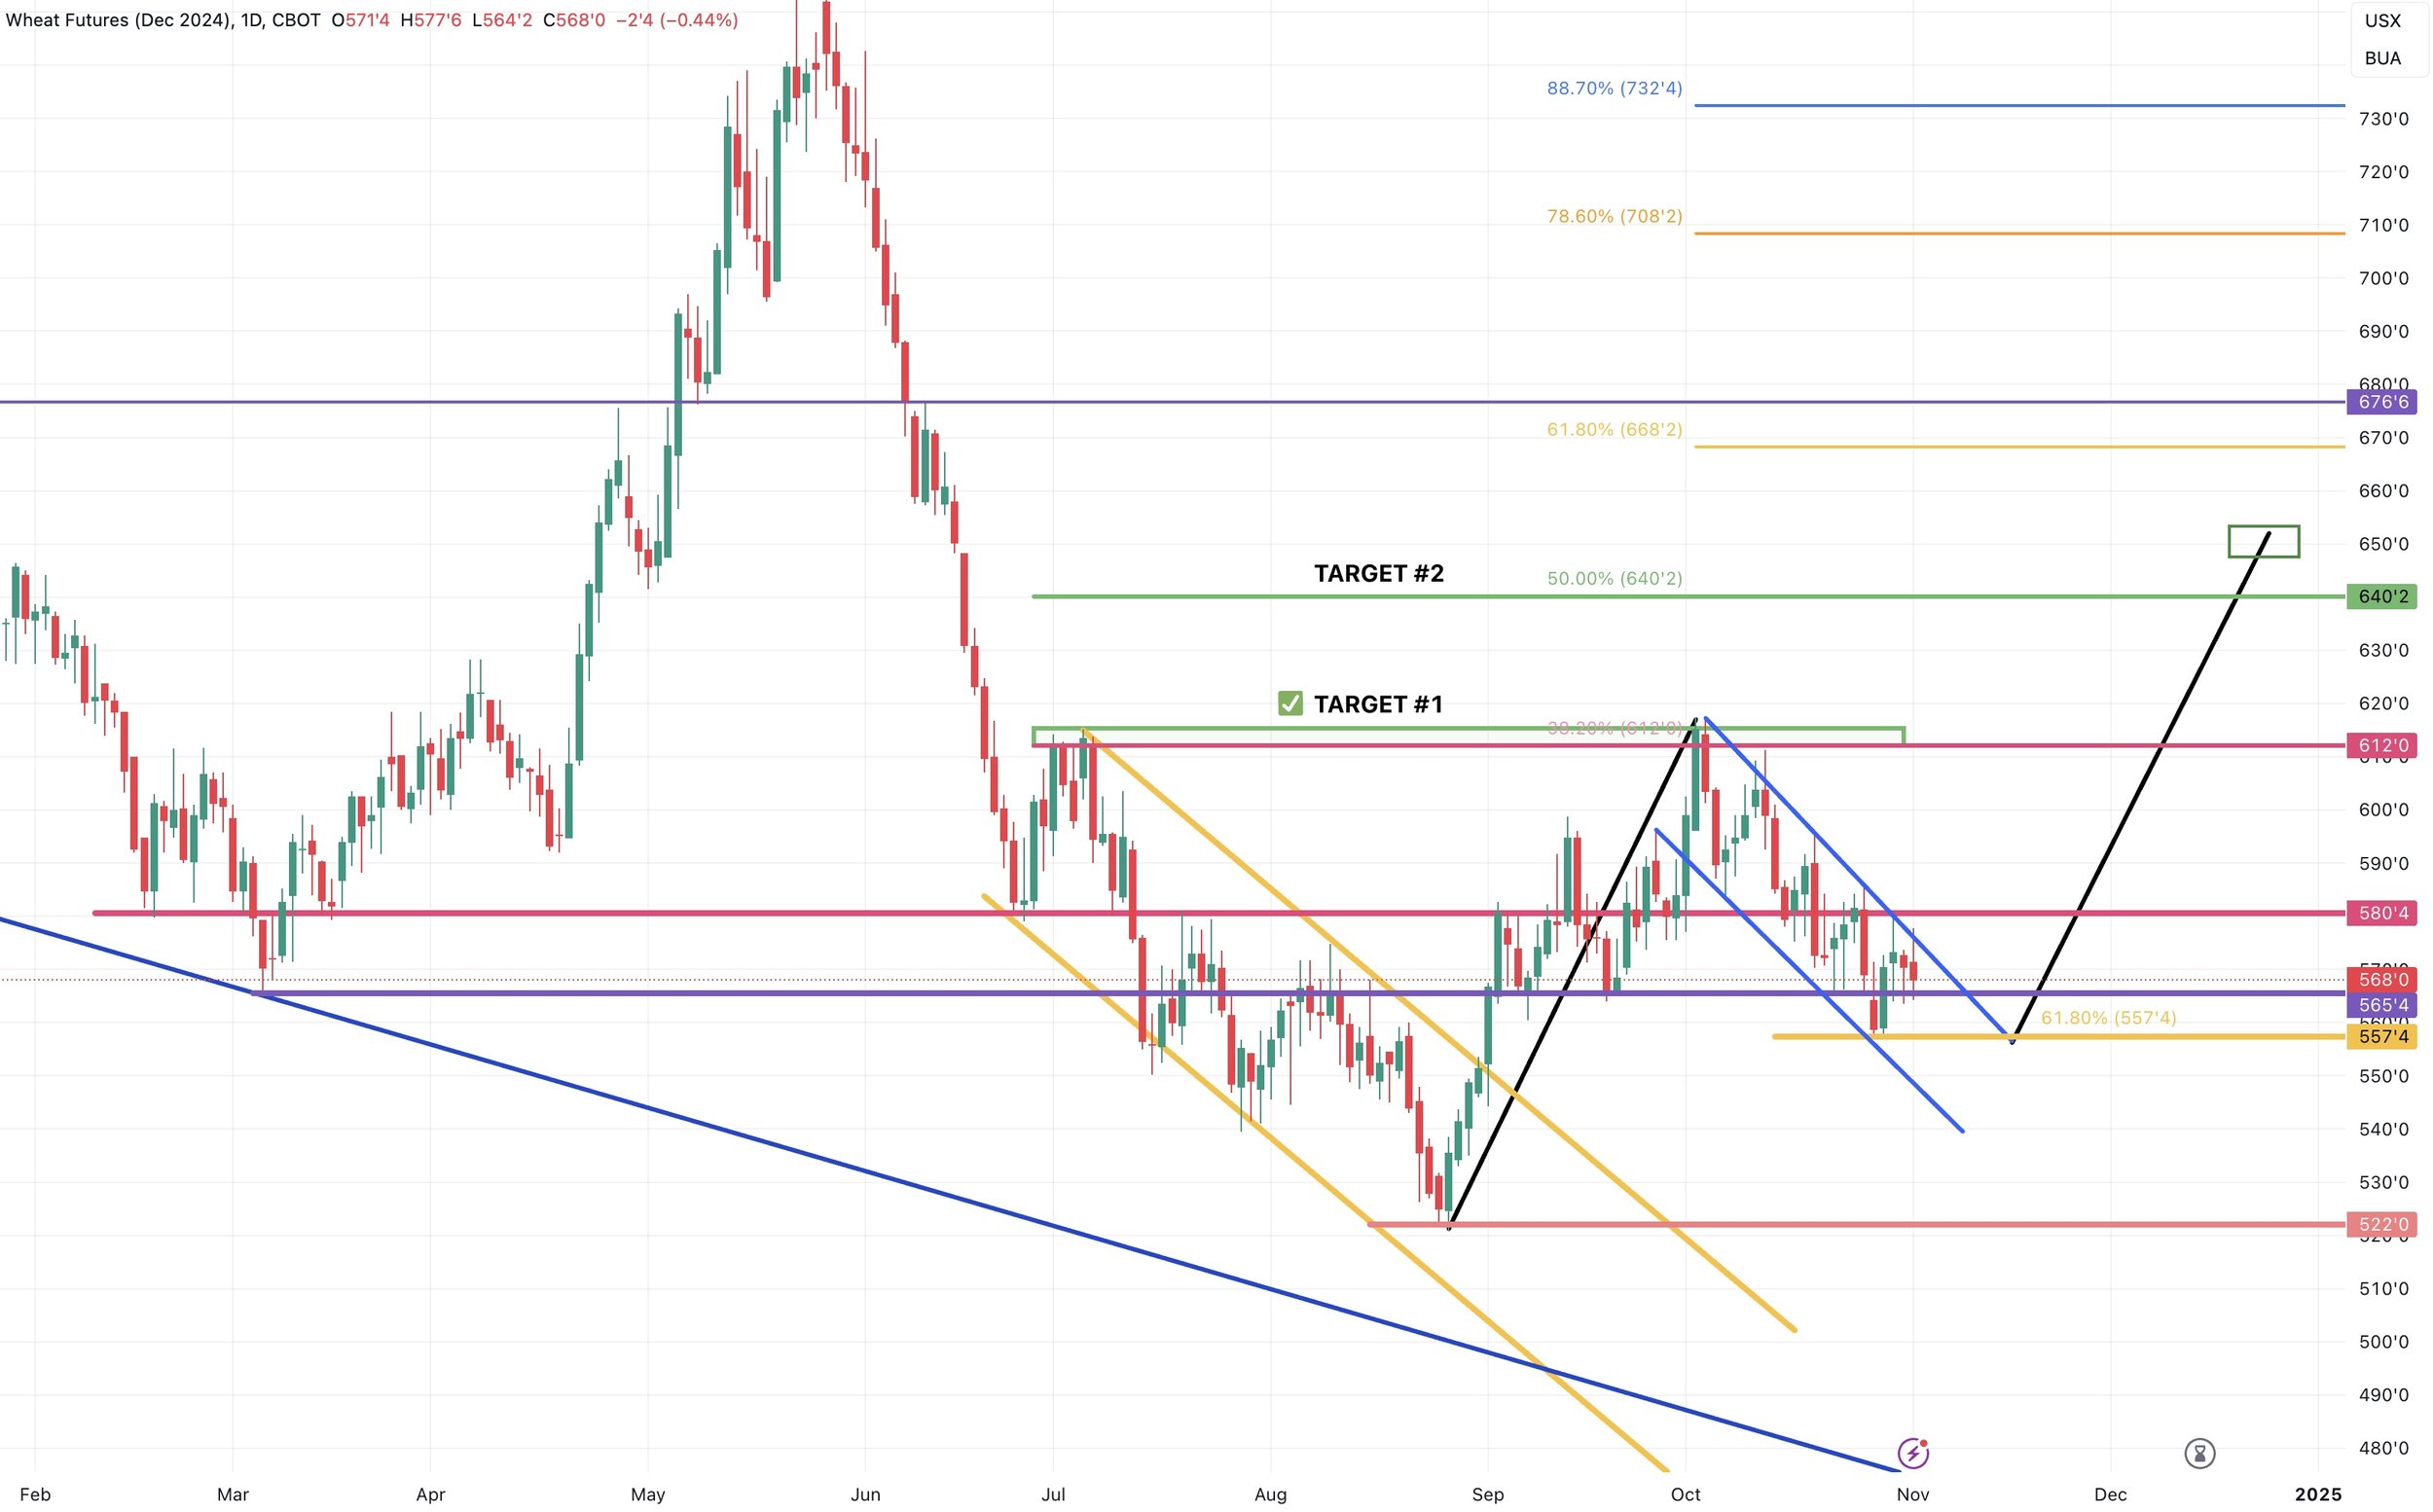
Still have a “potential” bull flag.
We need to bust above that dark blue downtrend if we want more upside.
Looking to the downside, we need to hold $5.57.. if not there is little support beneath. So we would likely get another leg lower.
$5.57 is also the 61.8% retracement level, which is the most common level to retrace to before bouncing. So far have gotten a little reaction to it. But need to hold. This would be a good spot to bounce if we were going to do so.
Here is the daily chart.
Dec KC Wheat 🌾
Here is the 4 hour chart.
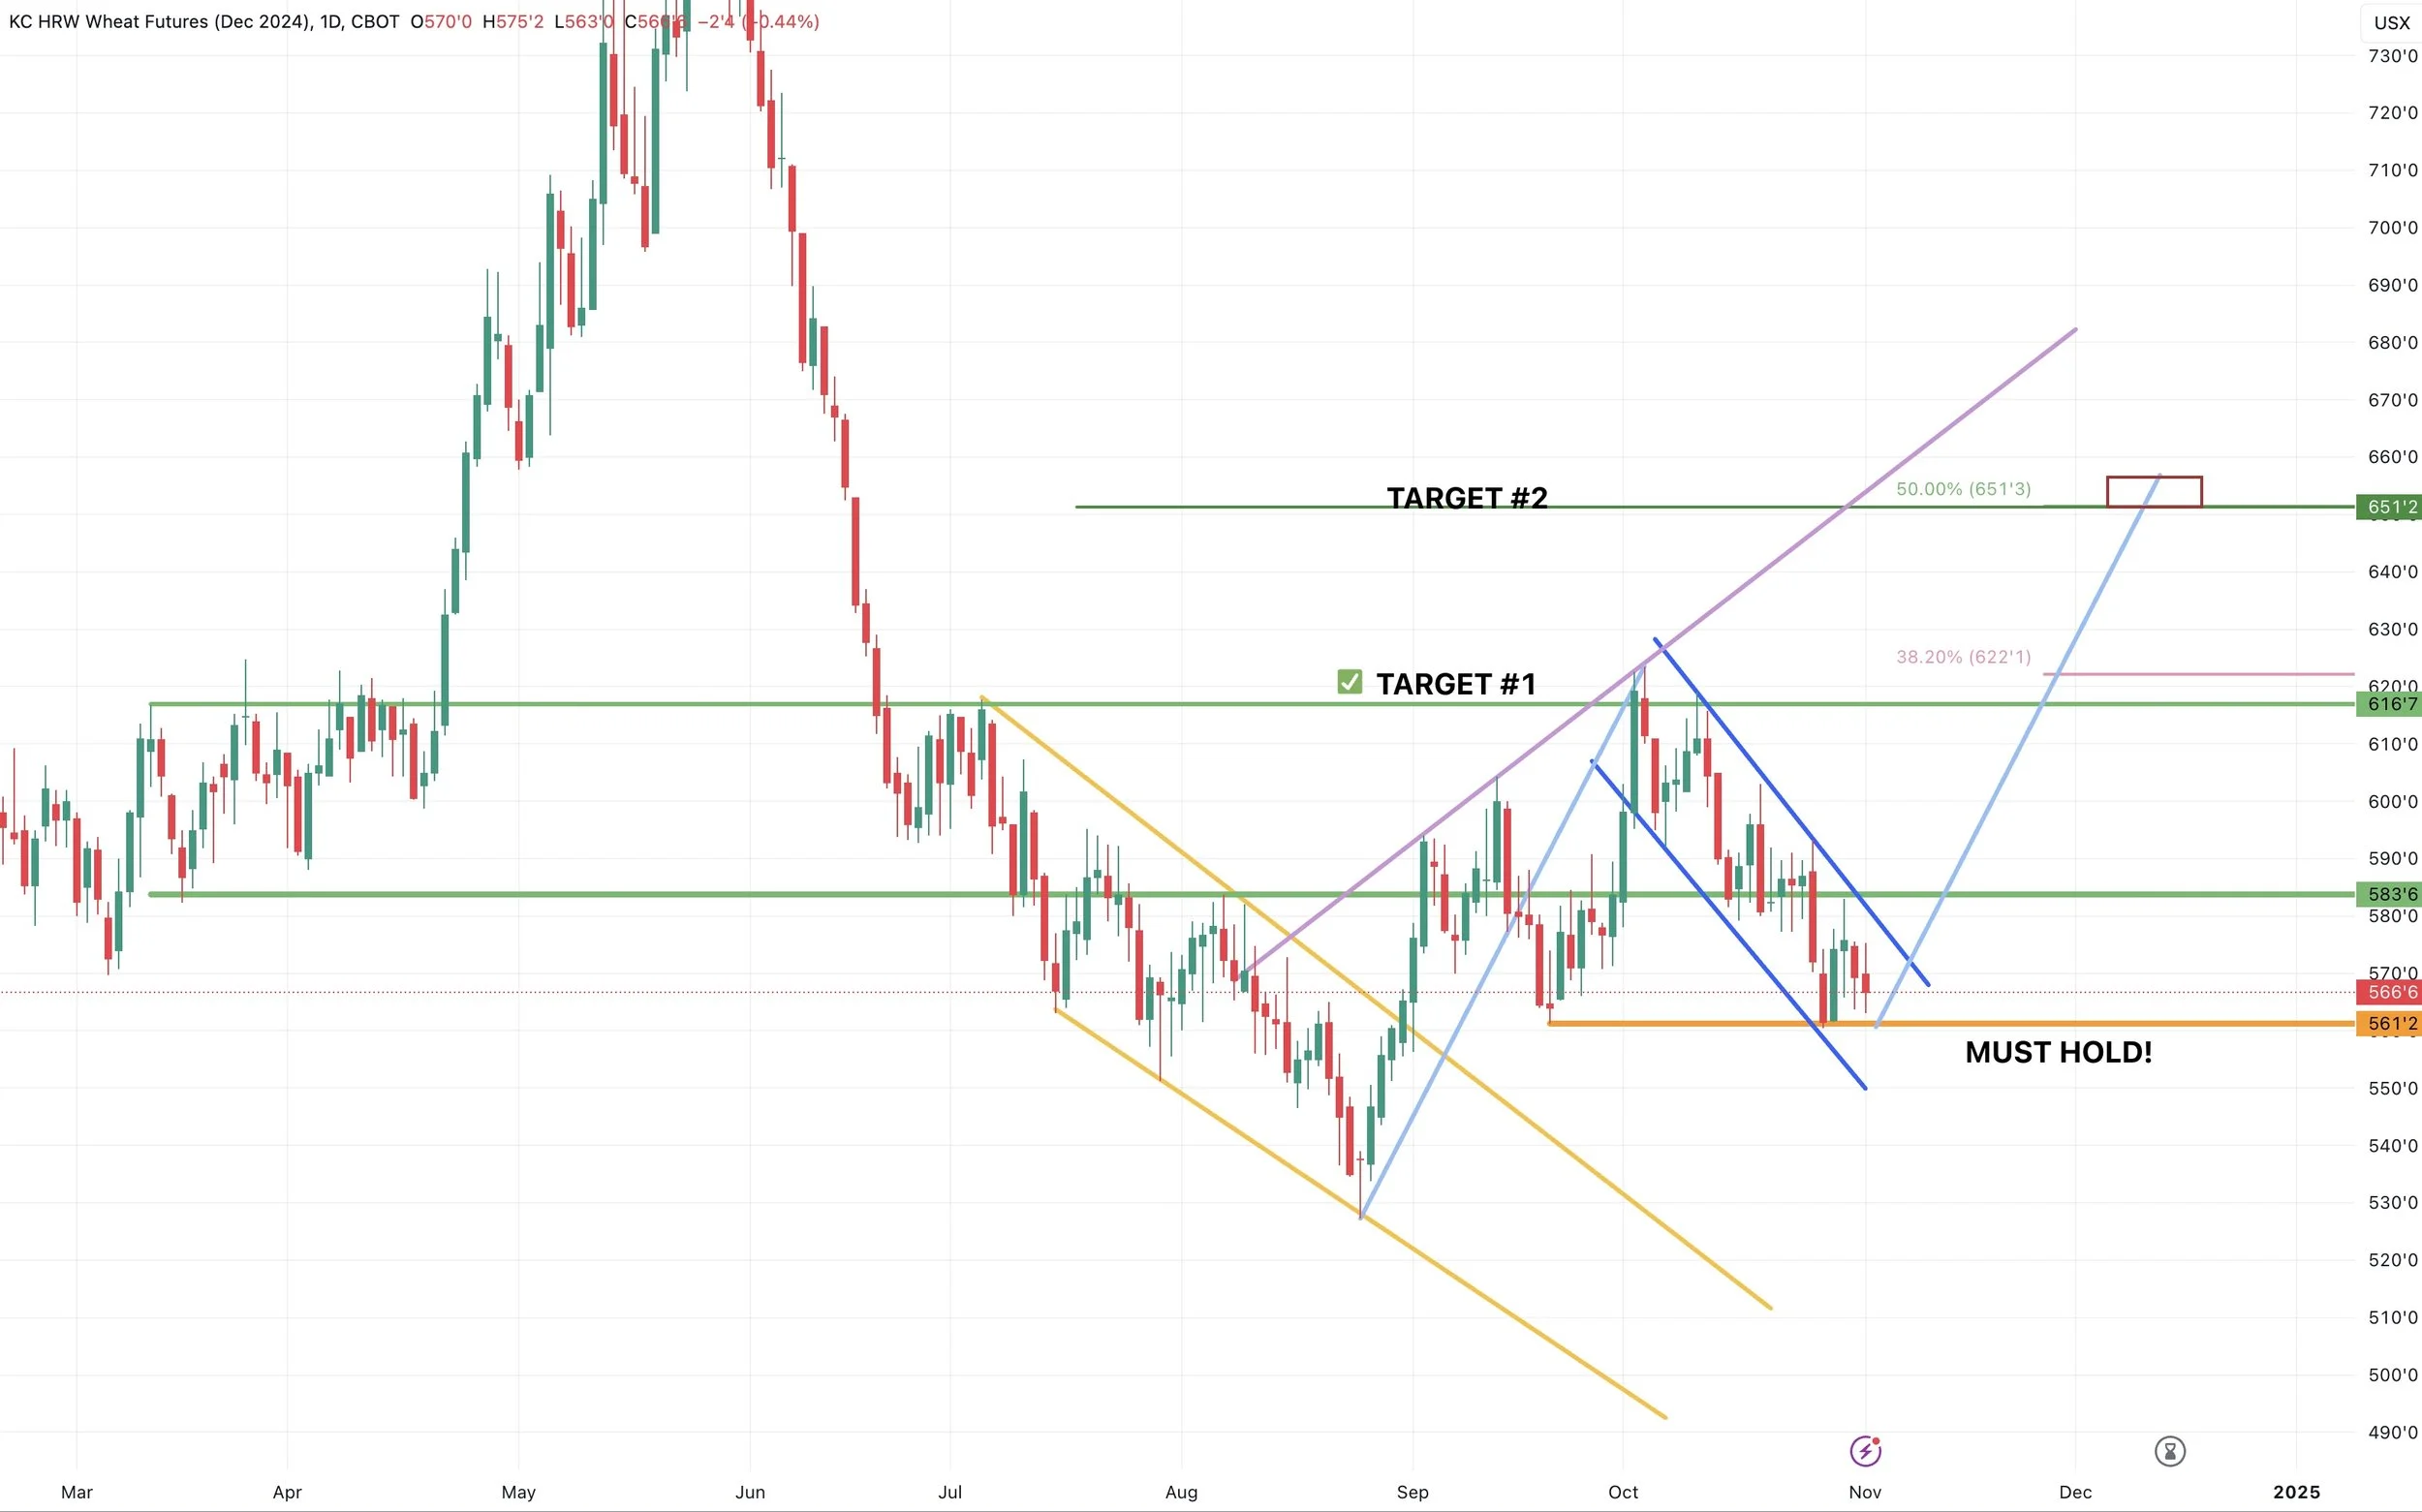
Pretty much the same set up as Chicago.
$5.61 is a MUST HOLD.
If we break below we likely see another leg lower.
Here is the daily chart.
Past Sell or Protection Signals
We recently incorporated these. Here are our past signals.
Oct 2nd: 🌾
Wheat sell signal at $6.12 target
Sep 30th: 🌽
Corn protection signal at $4.23-26
Sep 27th: 🌱
Soybean sell & protection signal at $10.65
Sep 13th: 🌾
Wheat sell signal at $5.98
May 22nd: 🌾
Wheat sell signal when wheat traded +$7.00
Want to Talk?
Our phones are open 24/7 for you guys if you ever need anything or want to discuss your operation.
Hedge Account
Interested in a hedge account? Use the link below to set up an account or shoot Jeremey a call at (605)295-3100.
Check Out Past Updates
10/31/24
ELECTION & USDA NEXT WEEK
10/30/24
SEASONALS, CORN DEMAND, BRAZIL REAL & MORE
10/29/24
WHAT’S NEXT AFTER HARVEST?
10/25/24
POOR PRICE ACTION & SPREADS WEAKEN
10/24/24
BIG BUYERS WANT CORN?
10/23/24
6TH STRAIGHT DAY OF CORN SALES
10/22/24
STRONG DEMAND & TECHNICAL BUYING FOR GRAINS
10/21/24
SPREADS, BASIS CONTRACTS, STRONG CORN, BIG SALES
10/18/24
BEANS & WHEAT HAMMERED
10/17/24
OPTIMISTIC PRICE ACTION IN GRAINS
10/16/24
BEANS CONTINUE DOWNFALL. CORN & WHEAT FIND SUPPORT
10/15/24
MORE PAIN FOR GRAINS
10/14/24
GRAINS SMACKED. BEANS BREAK $10.00
10/10/24
USDA TOMORROW
10/9/24
MARKETING STYLES, USDA RISK, & FEED NEEDS
10/8/24
BEANS FALL APART
10/7/24
FLOORS, RISKS, & POTENTIAL UPSIDE
10/4/24
HEDGE PRESSURE
10/3/24
GRAINS TAKE A STEP BACK
10/2/24
CORN & WHEAT CONTINUE RUN
10/1/24
CORN & WHEAT POST MULTI-MONTH HIGHS
9/30/24
