USDA RECAP: POOR REPORT, GREAT REACTION
AUDIO COMMENTARY
We had a negative report but traded higher
SA numbers disappointing. Will CONAB surprise next week?
World numbers continue to trend lower
The funds still heavily short. Report didn’t give reason to keep selling
The charts are starting to look very positive
Do not be chasing this rally. Courage calls quick
Who should not be re-owning
How I see this year shaking out
Taking advantage of this 3-4 week rally we could see
Charts & report numbers below*
Listen to today’s audio below
Our USDA Sale Ends Tomorrow. Take Advantage Before Your Free Trial Ends.
Charts
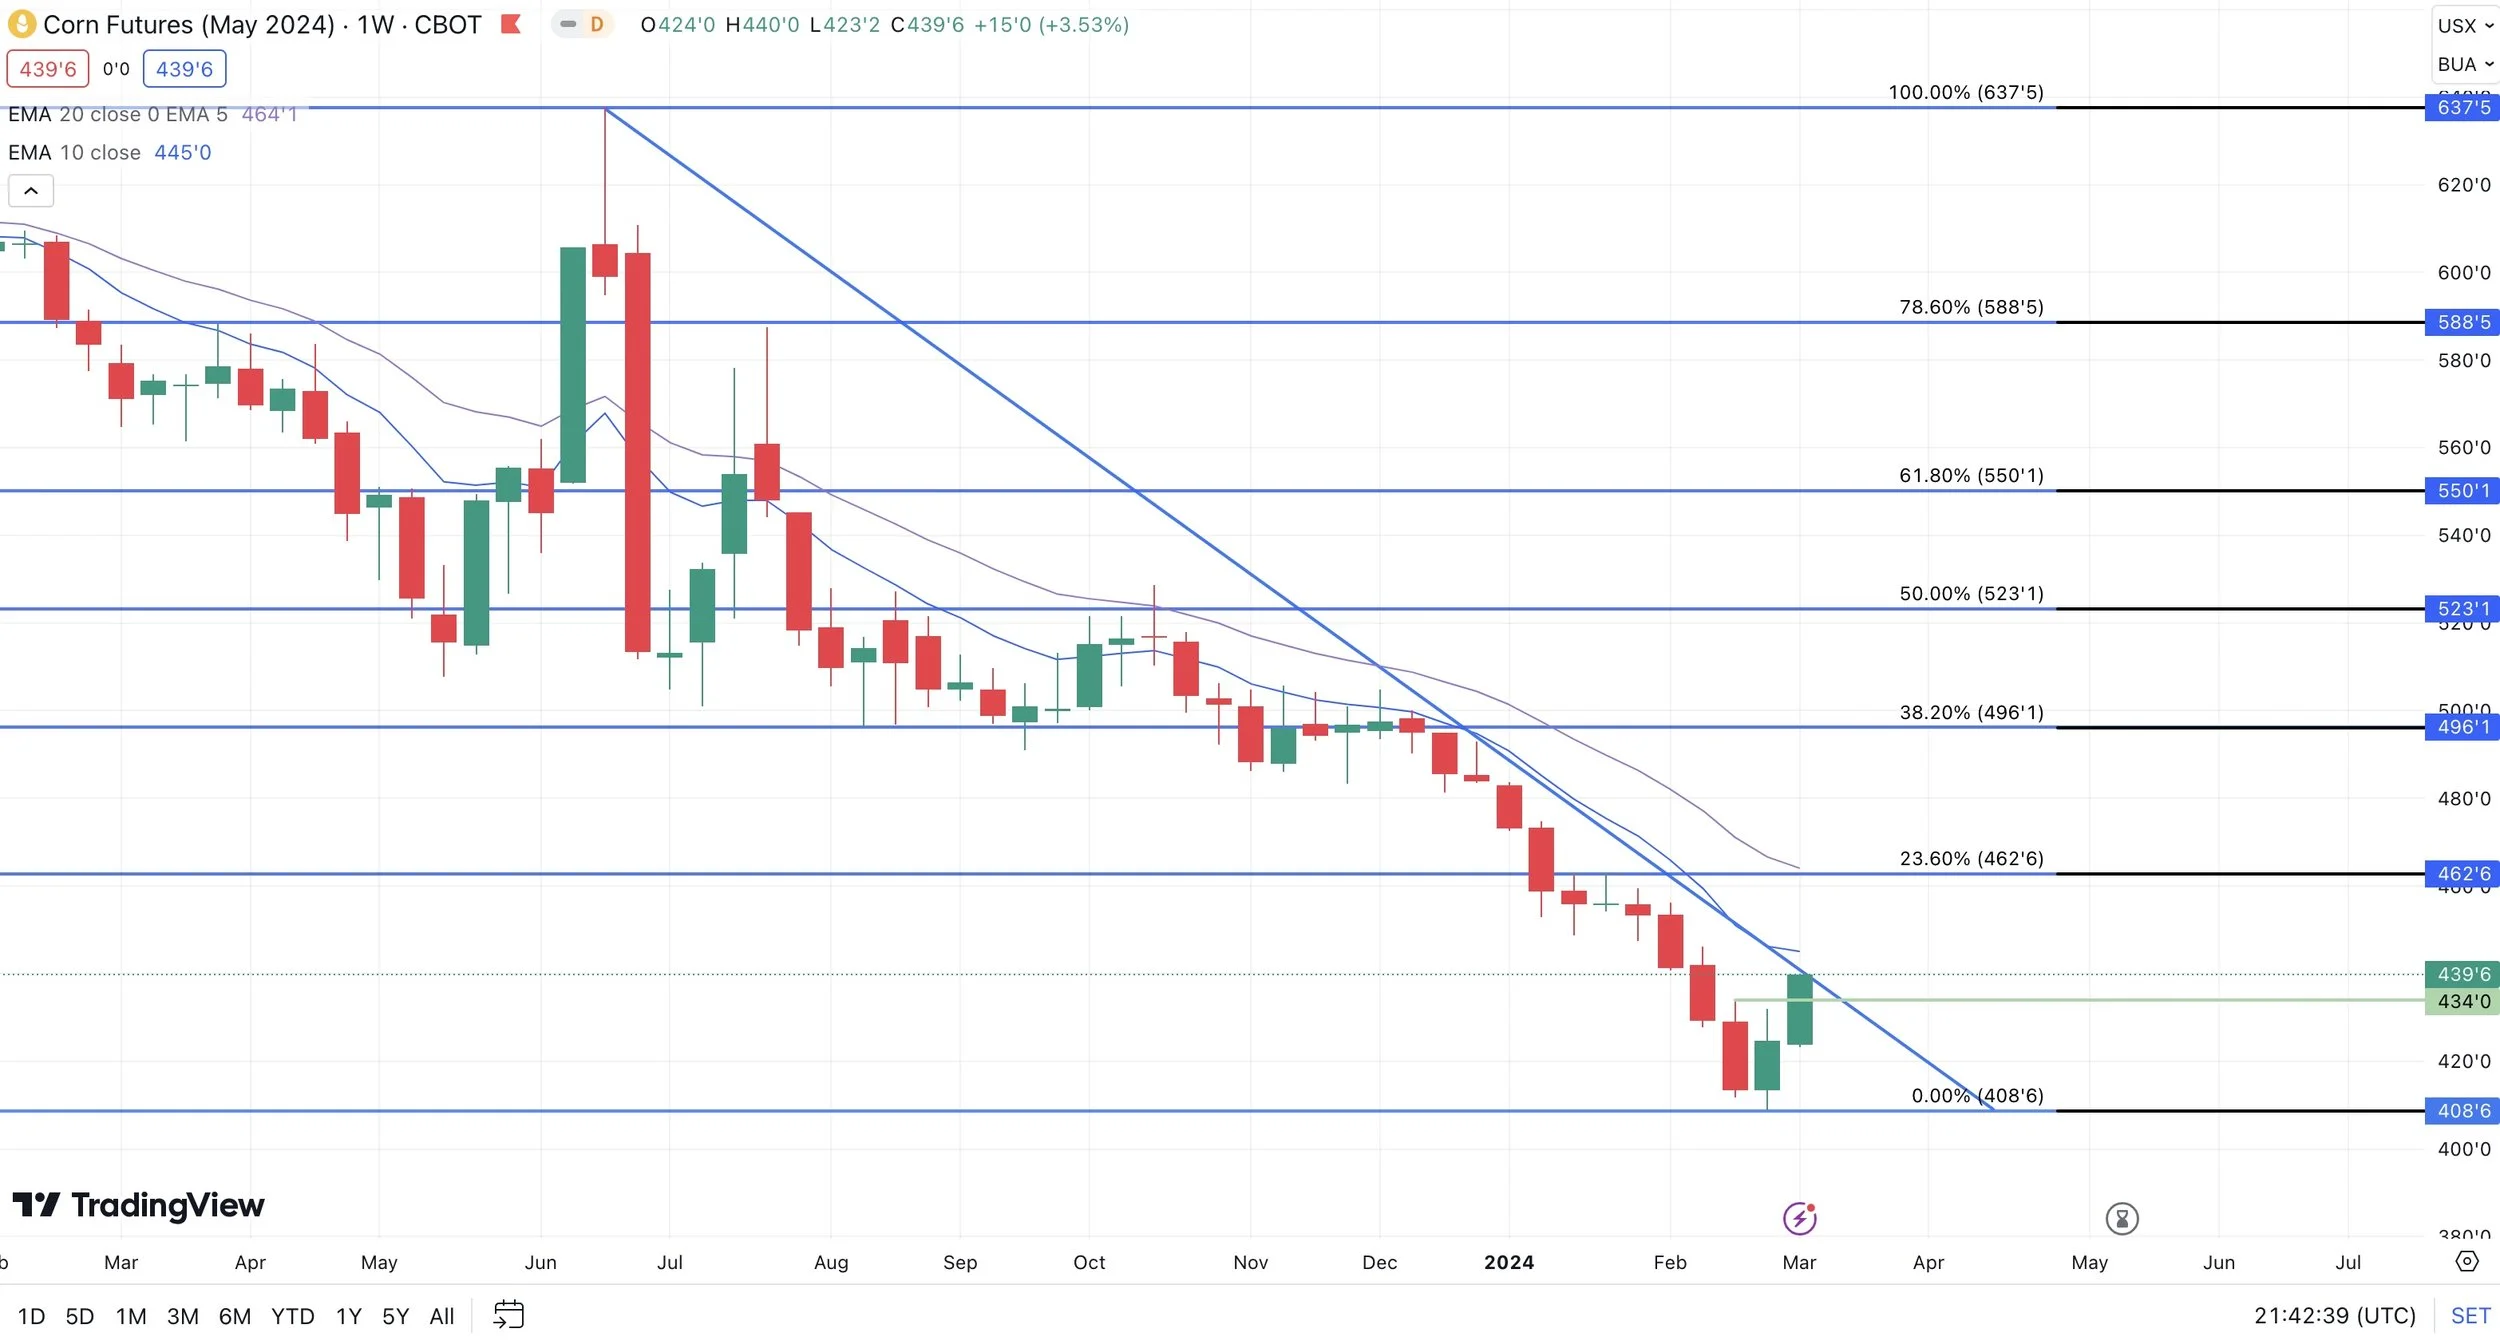
Corn Charts 🌽
This chart is starting to look great.
Second day in a row over the 20-day MA.
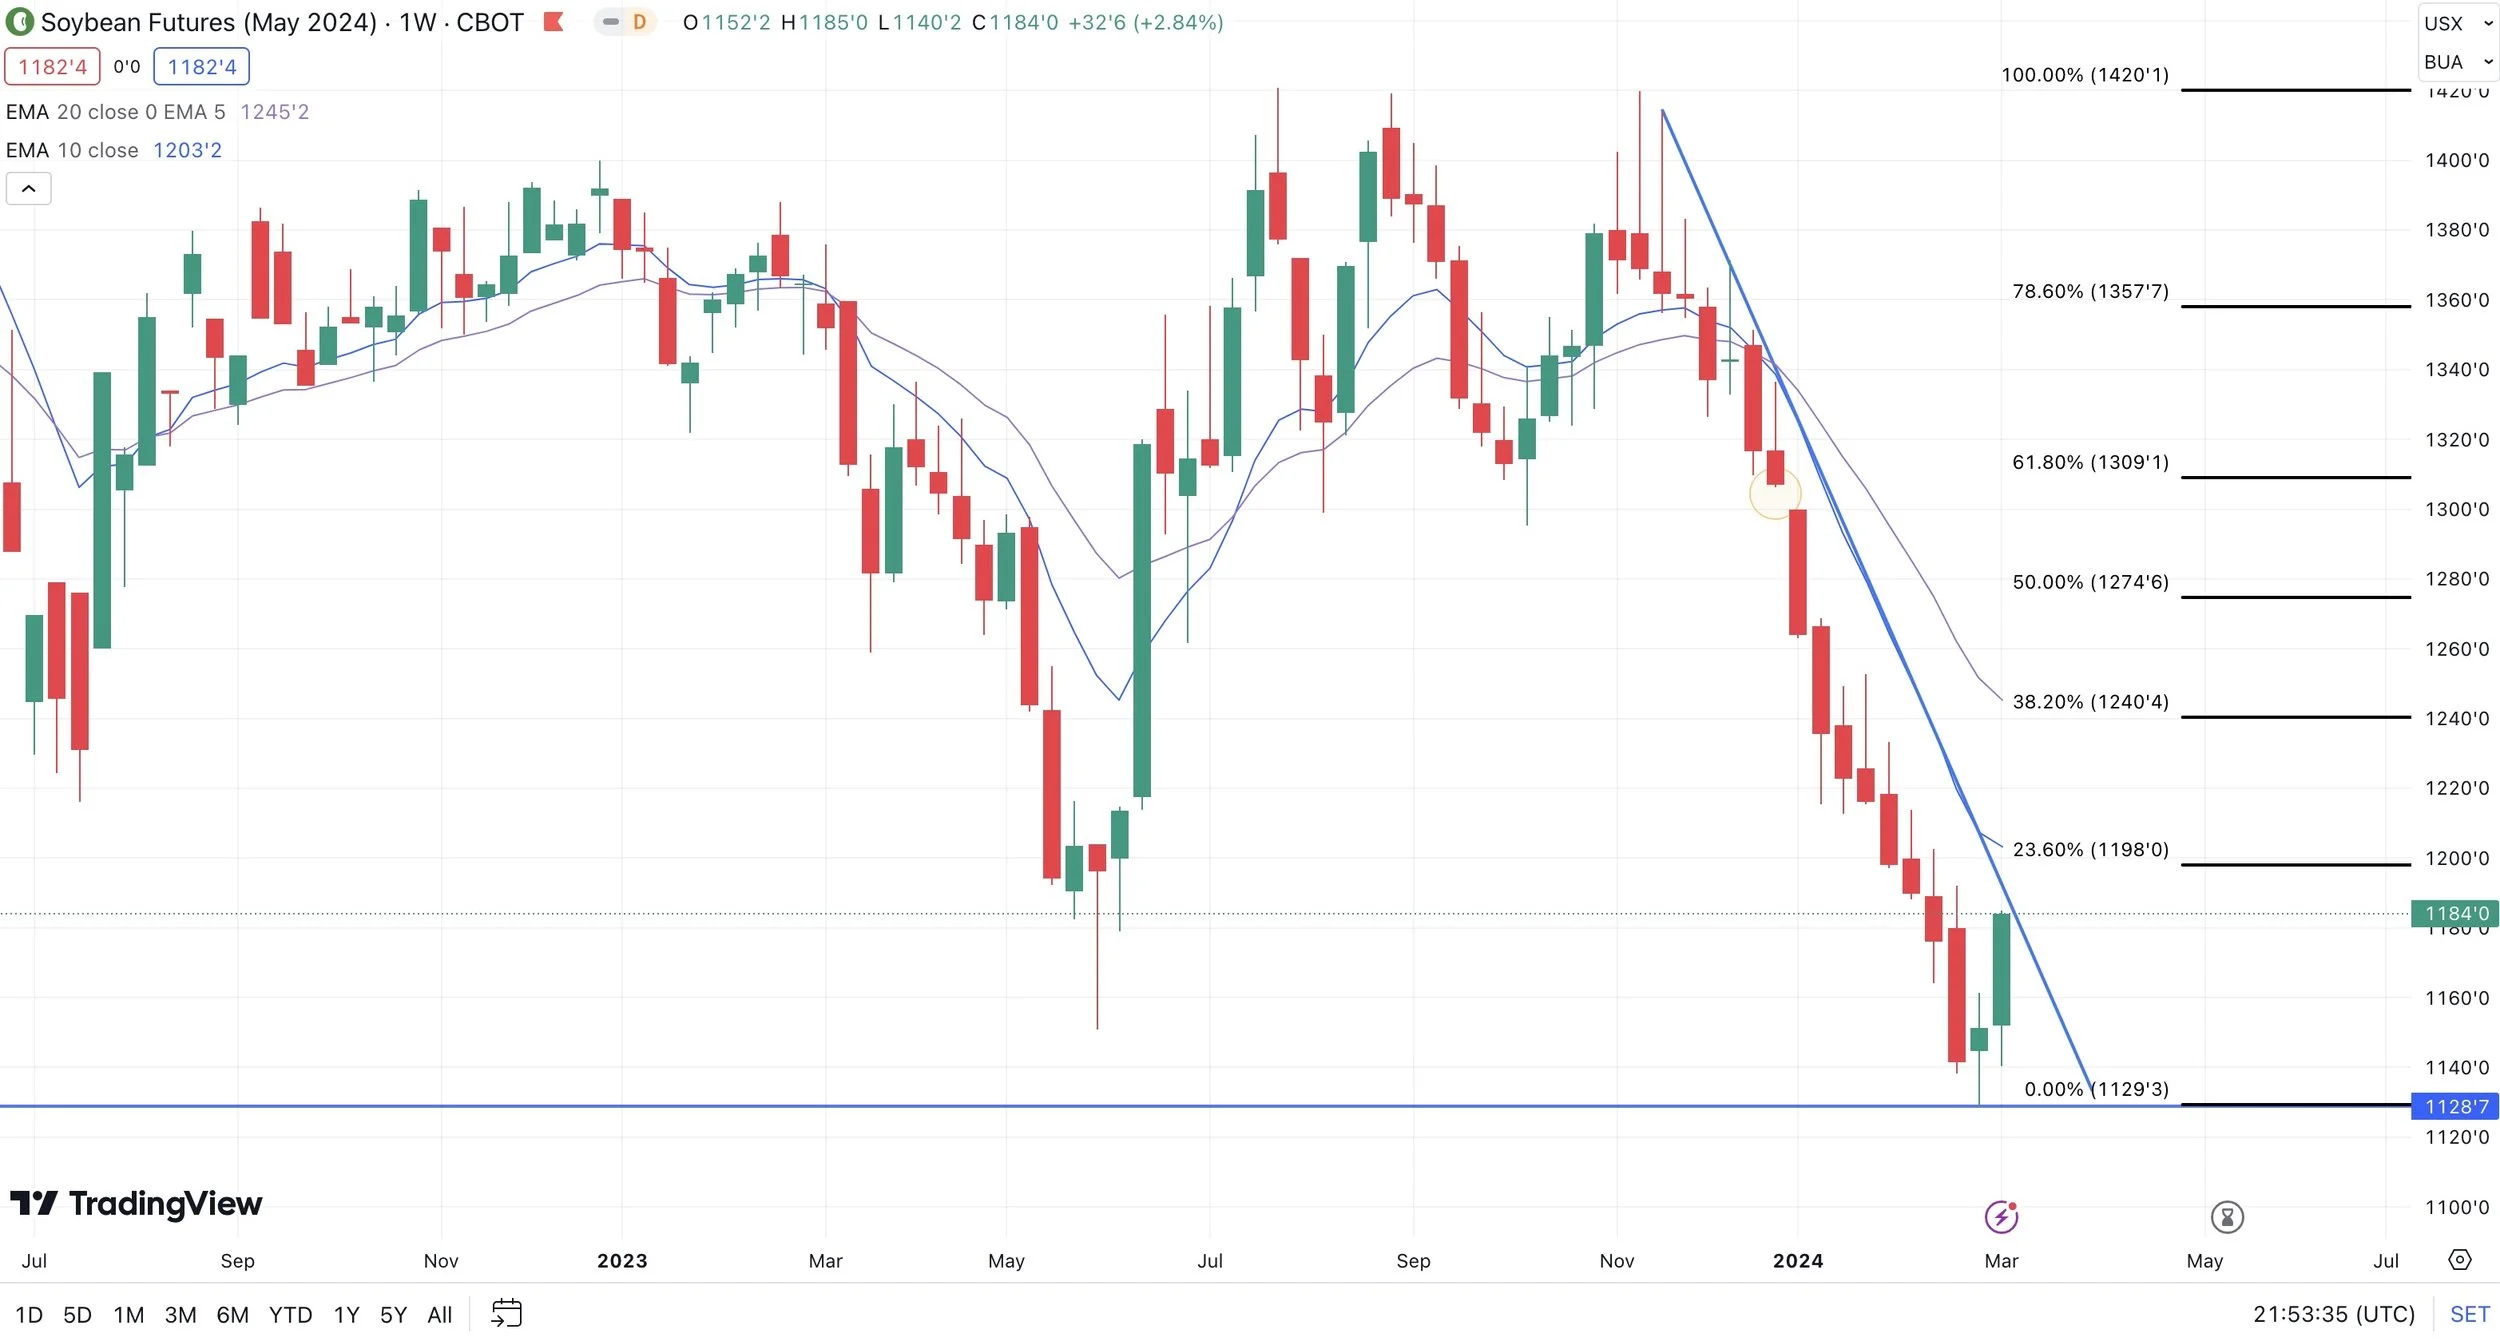
Highest weekly gain in 5 months.
Flirting with a breakout from that trendline.
First upside target is $4.62, our 23.6% retracement.
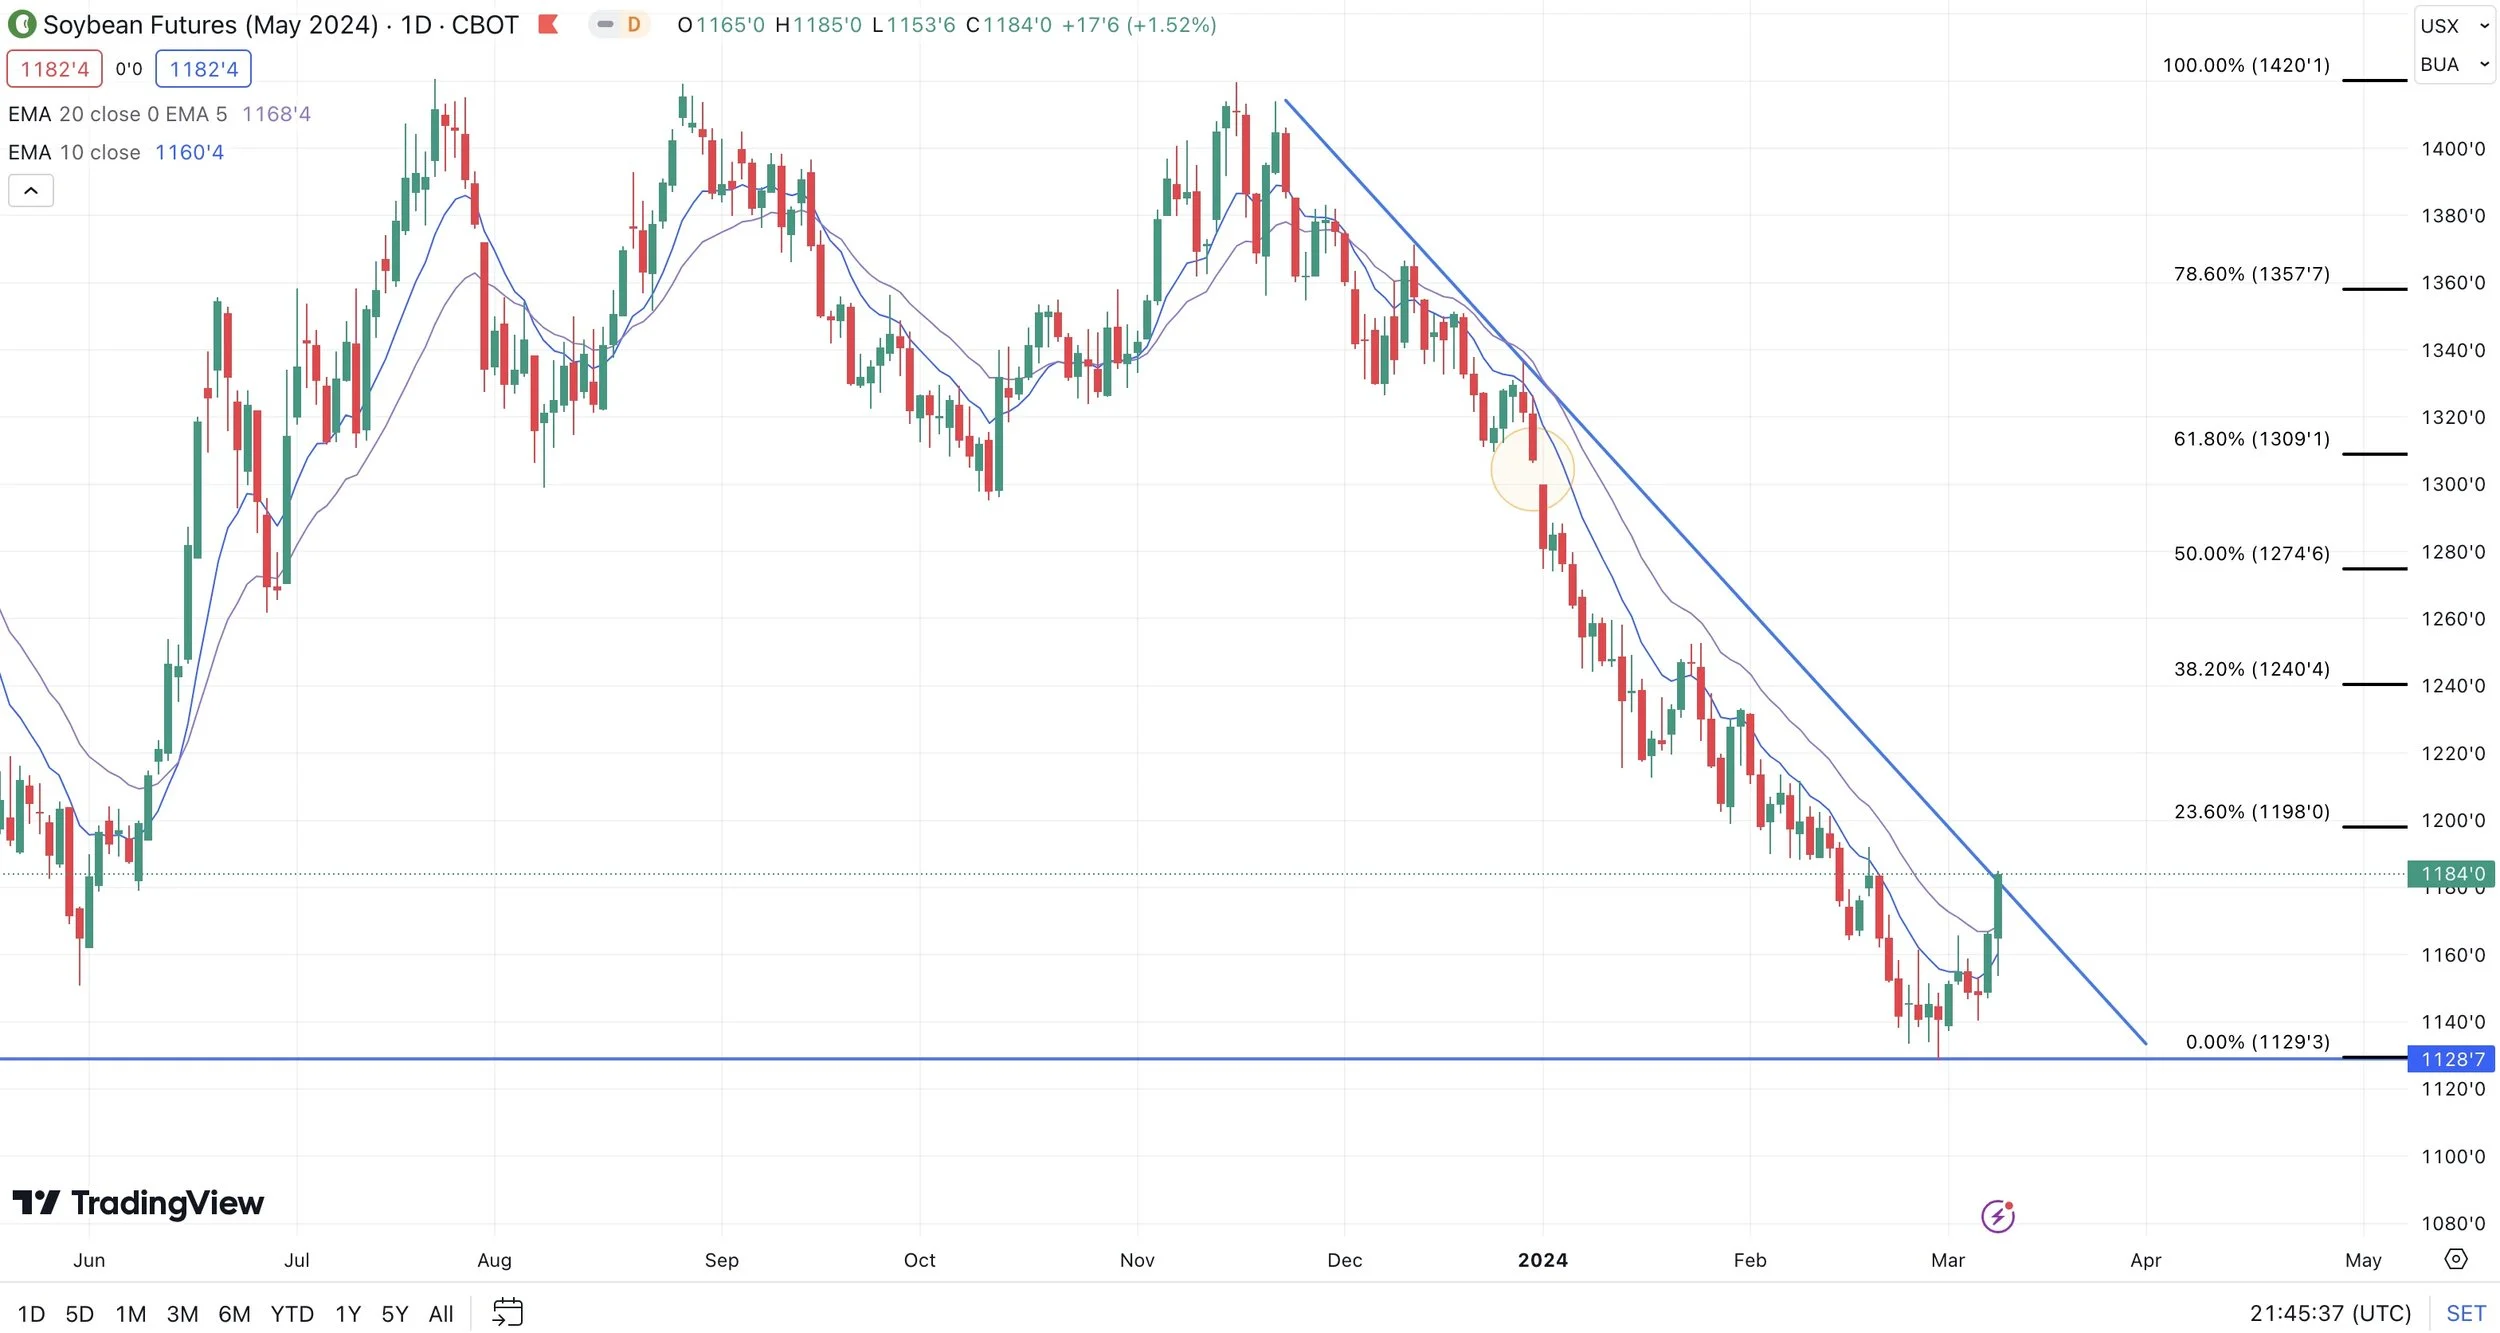
Soybean Charts 🌱
This chart also looks great.
First close above the 20-day MA since December. Smashing through it.
Flirting with that downward trendline from November.
First upside target is $11.98 and $12.40 1/2. Our 23.6% and 38.2% retracement levels.
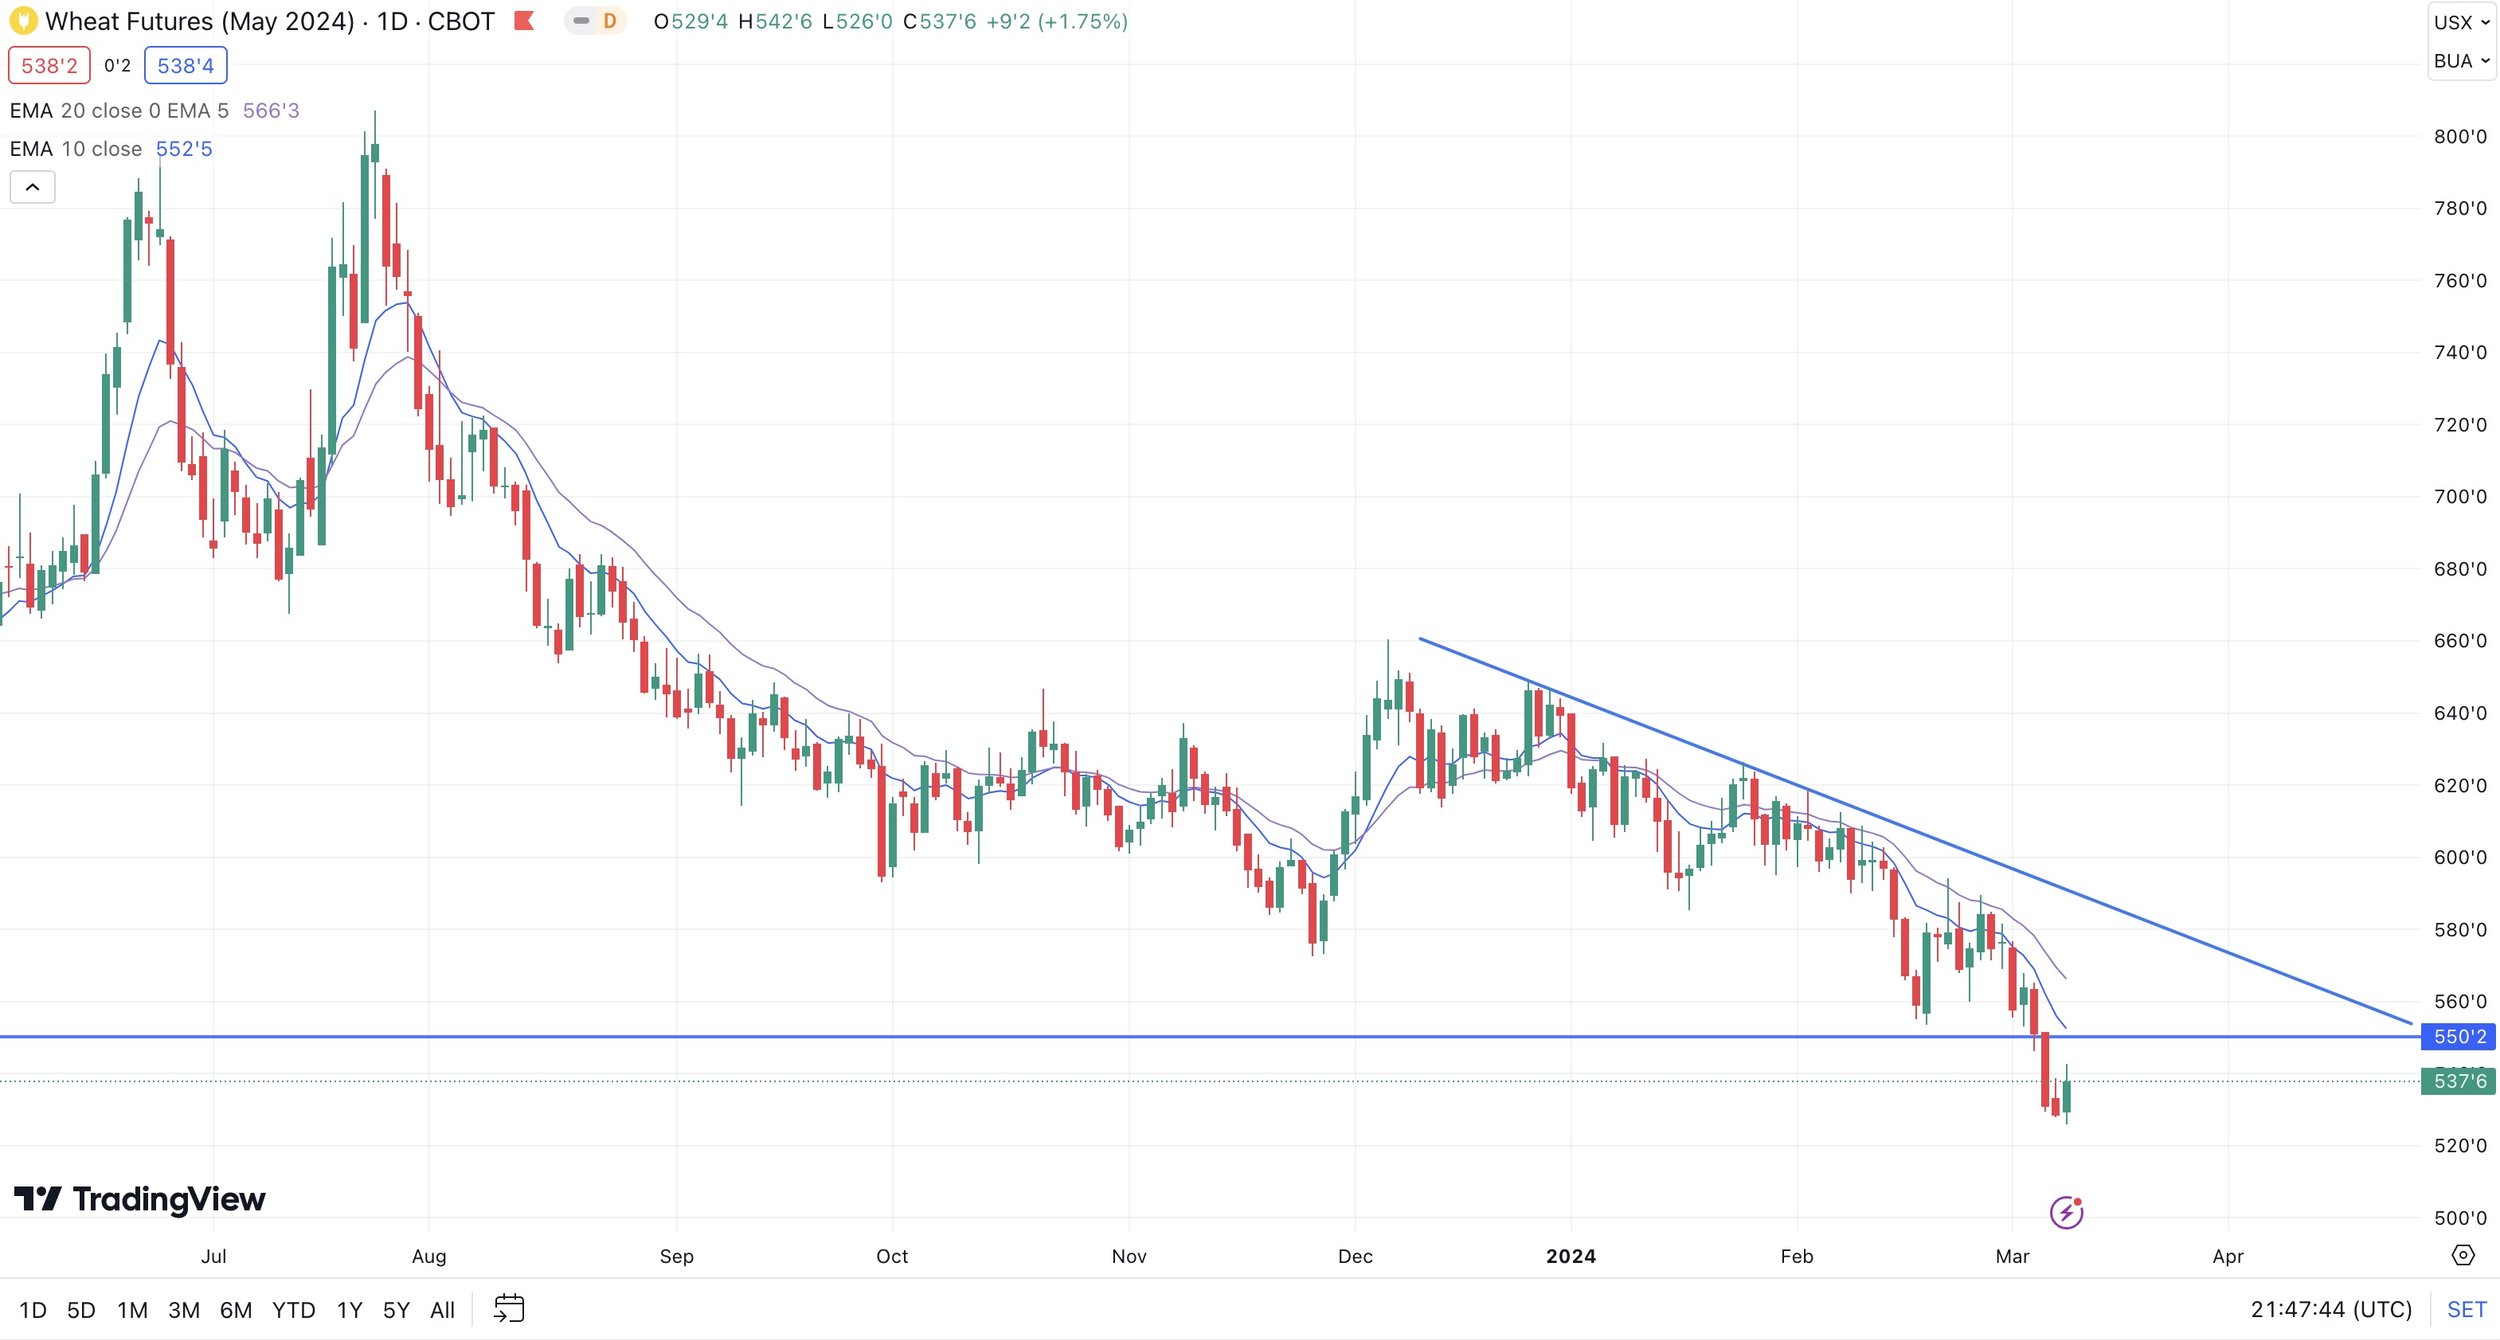
Chicago Chart 🌾
Almost made a key reversal.
Like we said yesterday,wheat is famous for bear traps and bull traps. I don’t want to be aggressively short wheat with the other grain charts looking positive.
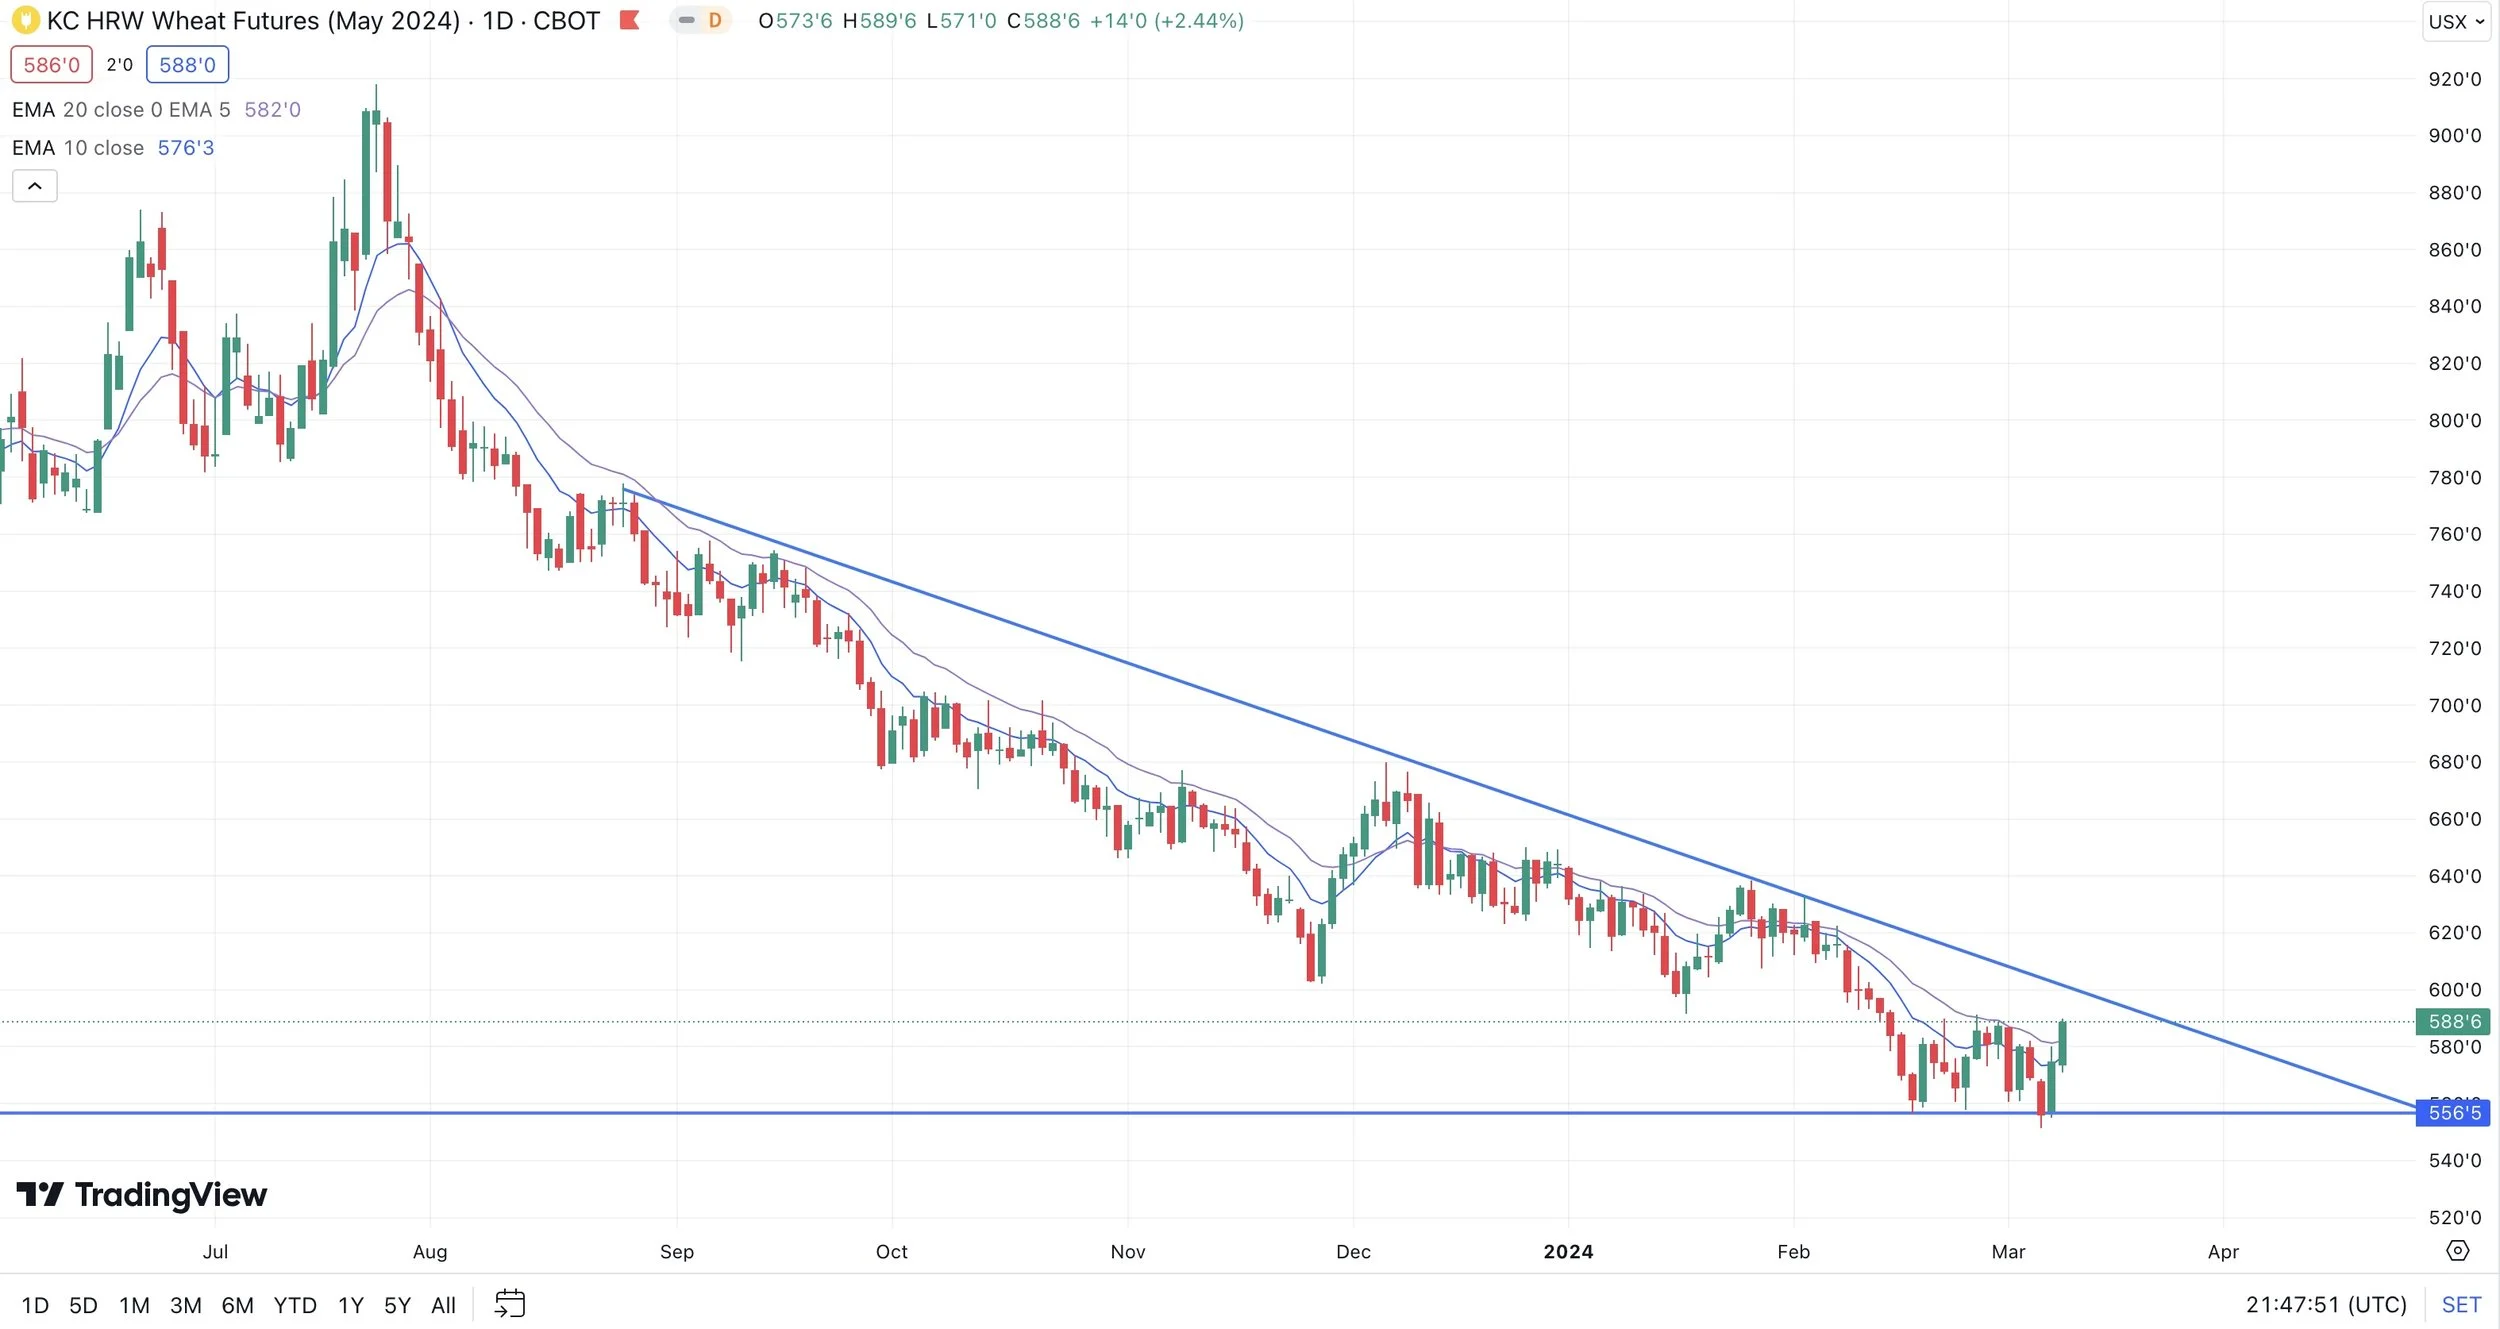
KC Chart 🌾
The same thinking goes for KC as Chicago.
Keep an eye on that trend line. We have not been above it since August.
USDA Numbers
Want to Talk?
Our phones are open 24/7 for you guys. If you need help with anything at all, don’t hesitate to shoot us a call, text, or email.
Hedge Account
Interested in a hedge account? Use the link below to set up an account or shoot Jeremey a call at (605)295-3100 or Wade at (605)870-0091
Check Out Past Updates
3/7/24
CORN TECHNICALS TURNING BULLISH. PREPARING FOR USDA REPORT
Read More
3/6/24
CHINA CANCELS WHEAT? RUSSIA SELLING WHEAT TO FUND WAR
3/5/24
NEW LOWS IN WHEAT & USDA BRAZIL ESTIMATES
3/4/24
IS CHINA HUNGRY FOR CHEAP GRAIN?
3/1/24
FIRST HIGHER WEEK IN MONTHS
2/29/24
HOW TO USE TARGETS VS TRIGGERS
2/28/24
BIGGEST 3 DAYS IN CORN SINCE AUGUST
2/27/24
DID CHINA BUY CORN YESTERDAY?
2/26/24
EARLY PLANTING, DROUGHT, & FINDING YOUR GRAIN MARKETING STRATEGY
2/23/24
MORE DOOM & GLOOM AS CORN BREAKS BELOW $4.00
2/22/24

