GRAINS STRONG DESPITE BEARISH REPORT YESTERDAY
Overview
There wasn’t much fresh news or headlines today, but old crop grains ended higher across the board here today despite the slightly bearish USDA report we saw yesterday. With the exception of both KC and Minneapolis wheat ending the day lower. New crop contracts in corn and beans did see some pressure today as well.
Following the report yesterday, the trades focus on the markets will again shift to weather and demand.
Russia said the Black Sea grain deal "couldn’t stand on one leg". Further stating that the outlook for the agreement doesn’t look very good. We will have to wait and see if we get a continuation of tension or headlines out of Russia or war.
Report Highlights
As for the report yesterday, this report was a lower impact one that wasn’t much of a needle mover. Overall it on the bearish side of things with little major changes made.
We saw the USDA make a pretty cut to Argentina soybean production. But the question there is just how much of this is already baked in, as we saw Brazil's number slightly higher.
The USDA basically kicked the can down the road and left both the old crop U.S. corn and bean balance sheets unchanged from last month. *Note: We won’t get USDA insight on new crop until May.
World wheat stocks came in below expectations which offset the higher U.S. stocks number, while global corn and beans both came in higher.
In yesterday's audio we go over the report into further detail and give our take on why we think the seasonals might be in place for us to go higher and more. You can listen to that below.
Yesterday's Audio - USDA Kicks Can Down the Road
Listen Here
USDA Report Numbers
We sent these out yesterday, but here they are in case you missed them.
Today's Main Takeaways
Corn
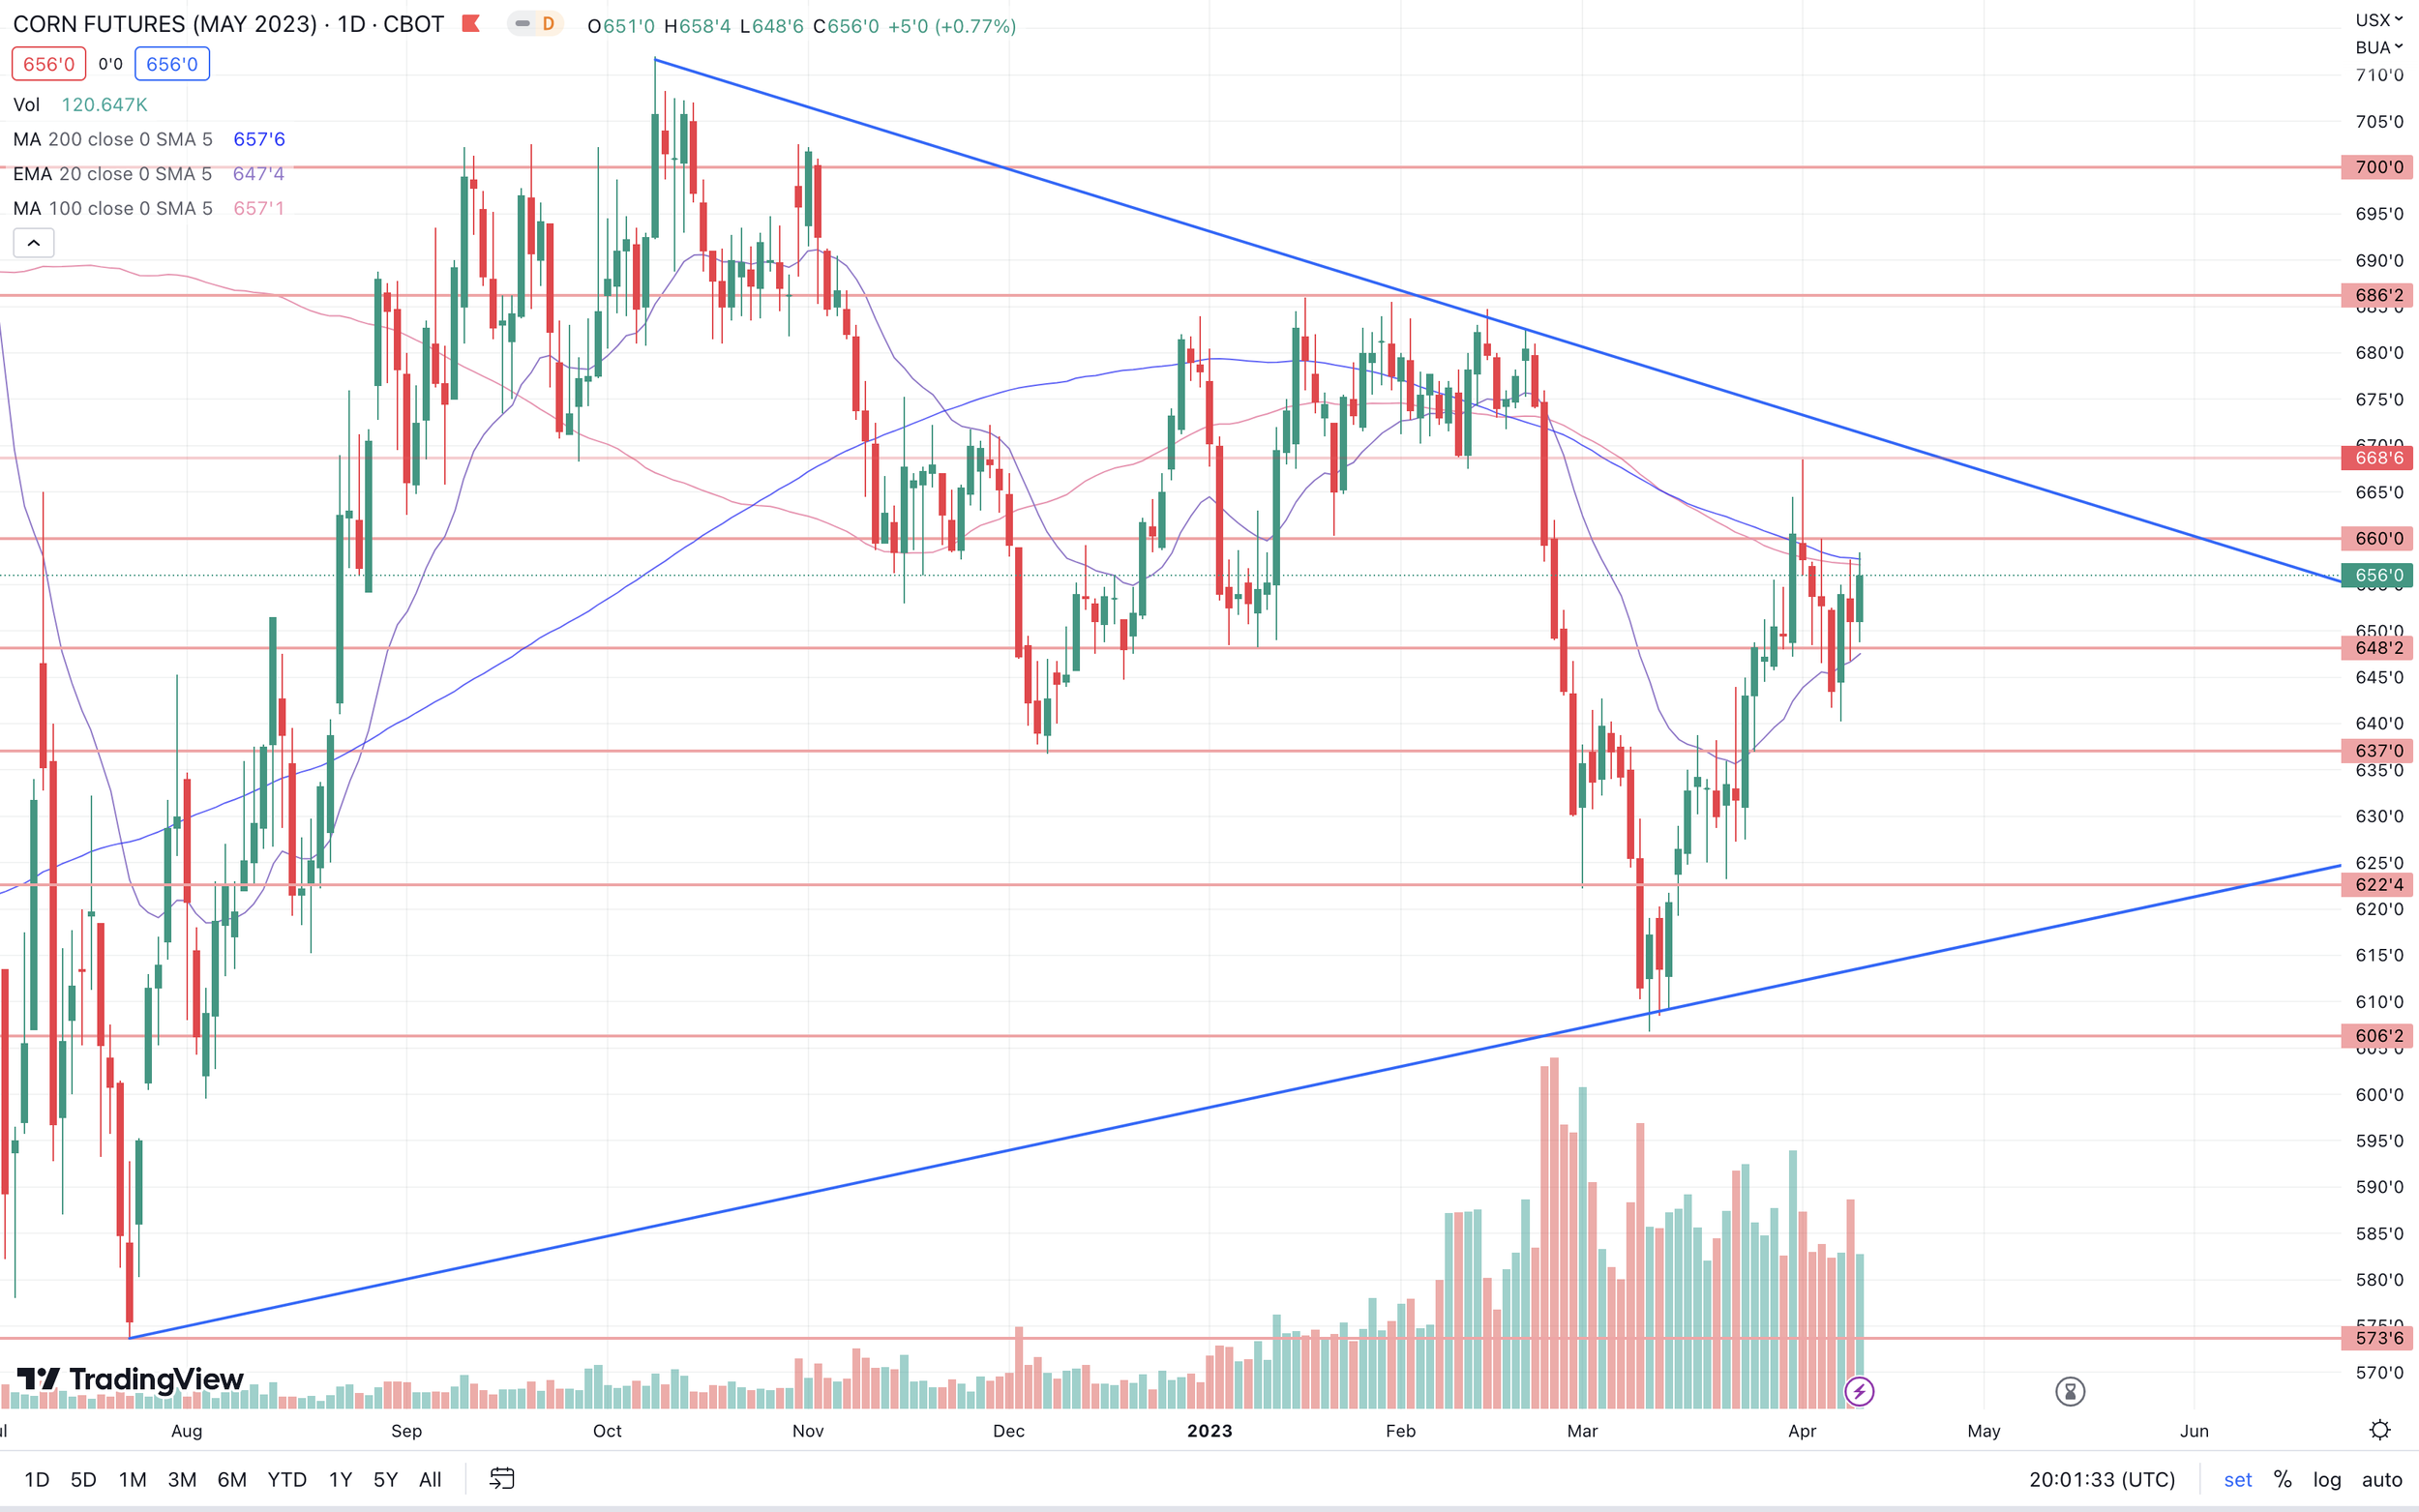
Corn closed higher by a nickel here today following minor losses yesterday following the report.
The report was mostly a snoozer for corn. As mentioned earlier we saw zero changes made to U.S. carryout, while most were anticipating a drop. World carryout was lowered but slightly above estimates.
South America also saw very little change. Brazil corn came in unchanged, while Argentina was lowered by 3 million metric tons to 37, but this was exactly where the estimates were. Many are still arguing that Argentina's number could wind up being below 35.
It looks like planting here in the U.S. is underway in the southern and eastern corn belt everywhere except the Dakotas and Minnesota.
Bulls would like to see Chinese demand increase. Other factors they are watching include Brazil weather headlines as there is potential for some weather concerns surrounding their second crop. Then we of course have Russia & Ukraine headlines. Lastly, the weather here in the U.S. will continue to start playing a much bigger role as planting gets underway.
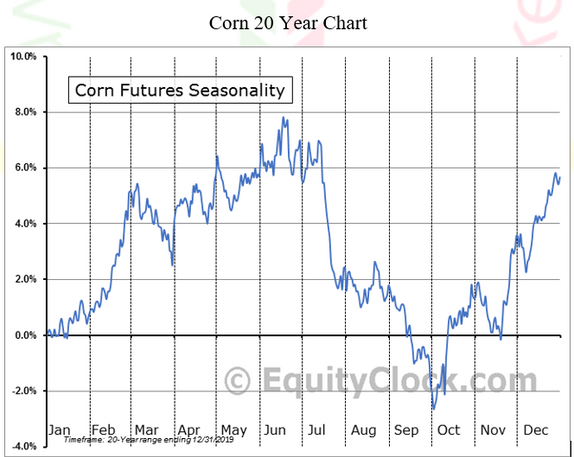
Right now we are being patient and looking for the seasonals to kick in. Short term we could see some pressure, as weather is looking pretty favorable, so we could see planting move along quick this week. The fundamentals are bullish and taking a look at the seasonal trend, we go higher from here. But of course, the journey we take to the top won’t be a straight line.
Corn May-23
Soybeans
Beans leading the grains higher again today following strength yesterday.
Beans were the only of the grains that had some bullish news from the report. That being the large cut we saw to the Argentina production number. Where it came in at 27 million metric tons, lower than March's 33 and the average pre-report estimate of 29.3 million. This number is a record low.
On the other hand, we did get a slight increase in Brazil numbers, being bumped up from 153 to 154 million. Which partially offset the losses in Argentina. But the cut to Argentina numbers was enough to support both beans and meal in higher prices yesterday.
Similar to corn, we saw U.S. carryout left unchanged from March, coming in above estimates. World carryout saw a slight increase.
Weather will begin playing a huge role in our markets including beans. One thing bears are looking at is the possibility for some El Niño weather pattern possibly forming in late summer.
Chinese demand and the cheap exports out of Brazil will also be factors to keep an eye on going forward.
We saw Argentina introduce their new peso program. But it looks like producers are still hesitant to sell their bushels.
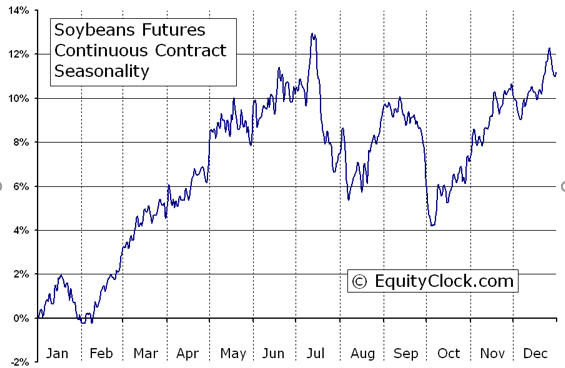
Going forward, our fundamentals are bullish looking long term. Our seasonal trend is higher until mid-summer. Taking a look at the charts, they are looking great compared to when we sold off to close out March. We are actually trading higher than when the initial sell off took place. With the rally we broke out of downtrend we had created. Bulls are thinking we could easily go and test our recent highs in the $15.50 range. 50 cents is a lot of ground to make up, but keep in mind, as of today's close we are $1 off our lows made March 24th.
Soybeans May-23
Wheat
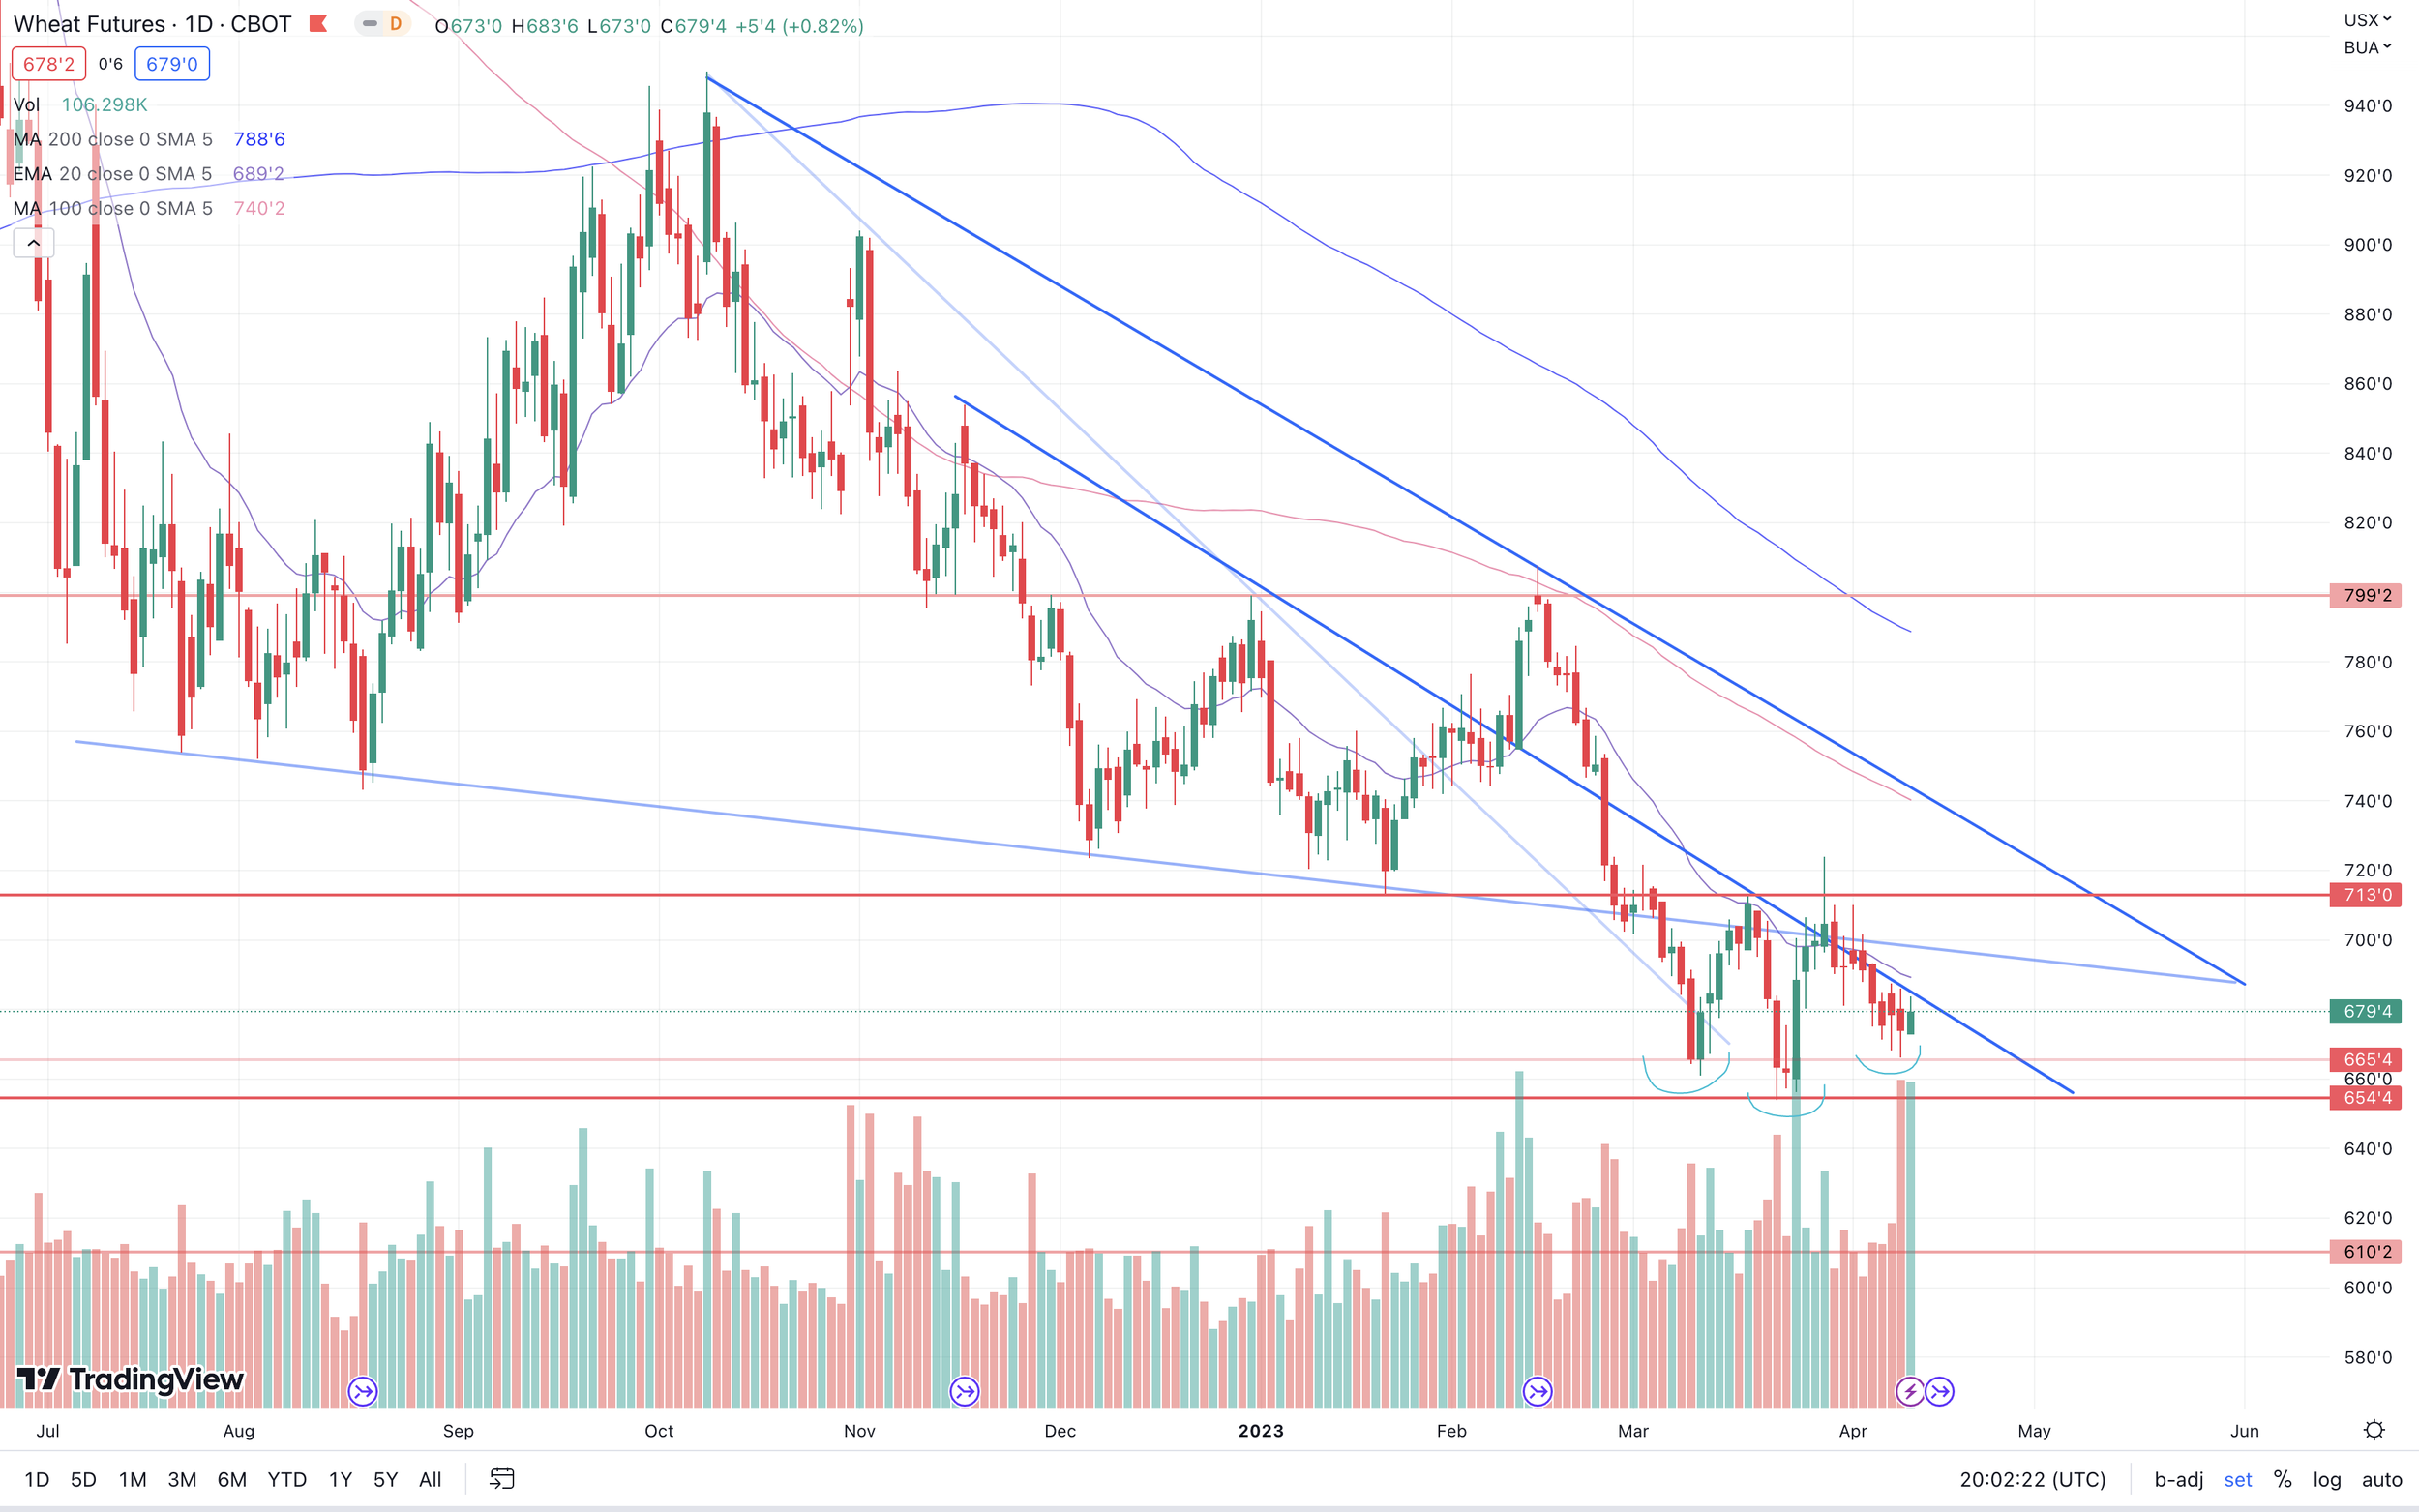
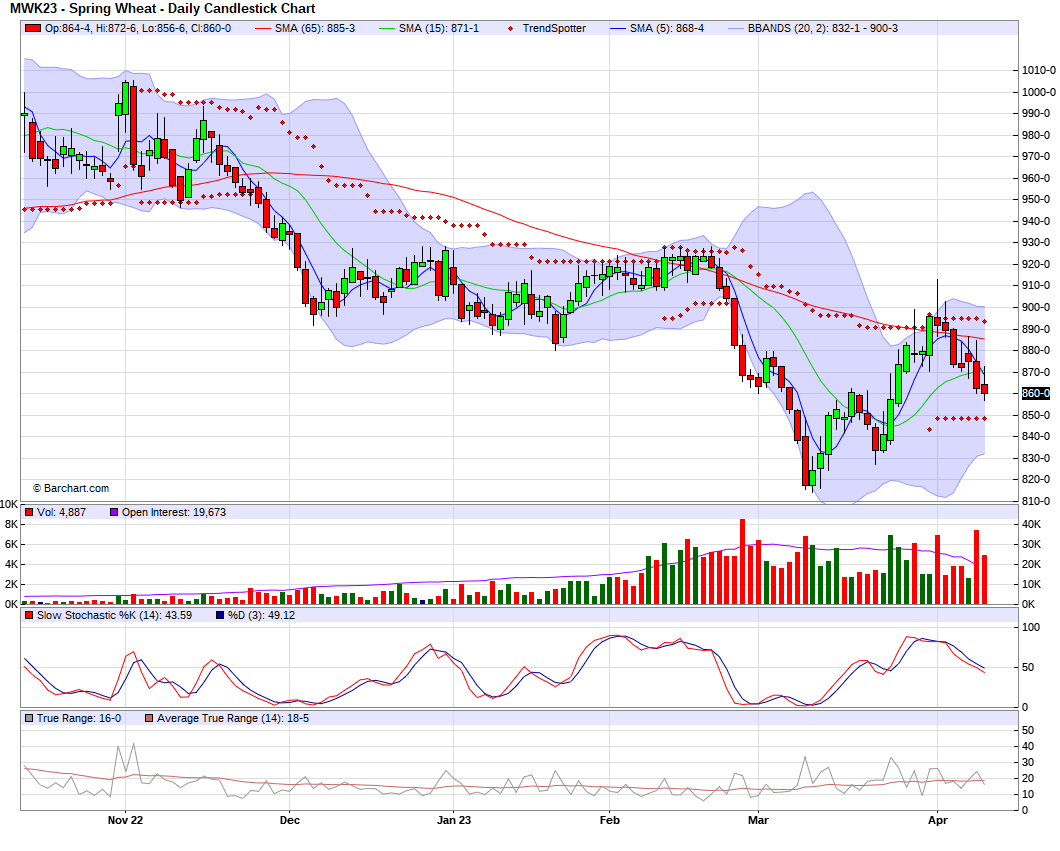
Wheat futures mixed here today, with Chicago up a nickel and a half while KC and Minneapolis close down a few cents each.
It was a little surprising to see Chicago gain 11 cents on KC wheat today given just how poor the winter wheat crop is. As they continue to get worse. Perhaps they were buying some Chicago and selling a little bit of Kansas City. I think KC wheat has plenty of upside.
Yesterday's report was also pretty uneventful for wheat. With U.S. carryout raised slightly while world carryout was lowered slightly.
Taking a look at the hard red winter wheat growing areas, if they don’t see rain soon we could possibly be looking at fewer acres due to the crop being abandoned for other crops.
U.S. winter wheat conditions dropped again, down to 27% rated good to excellent last week. 61% of Kansas winter wheat is rated poor to very poor, keep in mind that Kansas typically makes up for 25% of the total U.S. winter wheat and 17% of the total U.S. wheat output.
That 27% rated poor to very poor for the U.S. crop is tied with 1996 for the lowest in 40 years.
As mentioned earlier, there is still plenty of uncertainty surrounding Russia, the war, and the Black Sea agreement. As Russia continues to rough some feather, this time stating that the agreement outlook isn’t looking great. I still think we could potentially see another bullish wild card from the Black Sea agreement or war.
Looking at our 30 year seasonal trend, the trend is lower prices until after summer. But the past year or so for wheat hasn't followed the seasonals at all with war and other factors shaking up the markets.
Fundamentals are still bullish. We have one of the worst crops on record here in the U.S. and a war situation still at large. The funds remain heavily short. I'm not sure when the funds will decide to flip that switch, but when they do I think we could see a pretty big short-covering rally rather fast, especially if we get some wild war or weather headline.
Taking a look at the chart, we created a possible inverted head and shoulders formation, which is a bullish indicator. I think this could potentially be the bottom here and the beginning of a reversal to the upside.
Chicago March-23
KC March-23
MPLS March-23
Mother Nature & Acres
From Farms.com Risk Management,
Mother Nature took the spring out of U.S. spring wheat
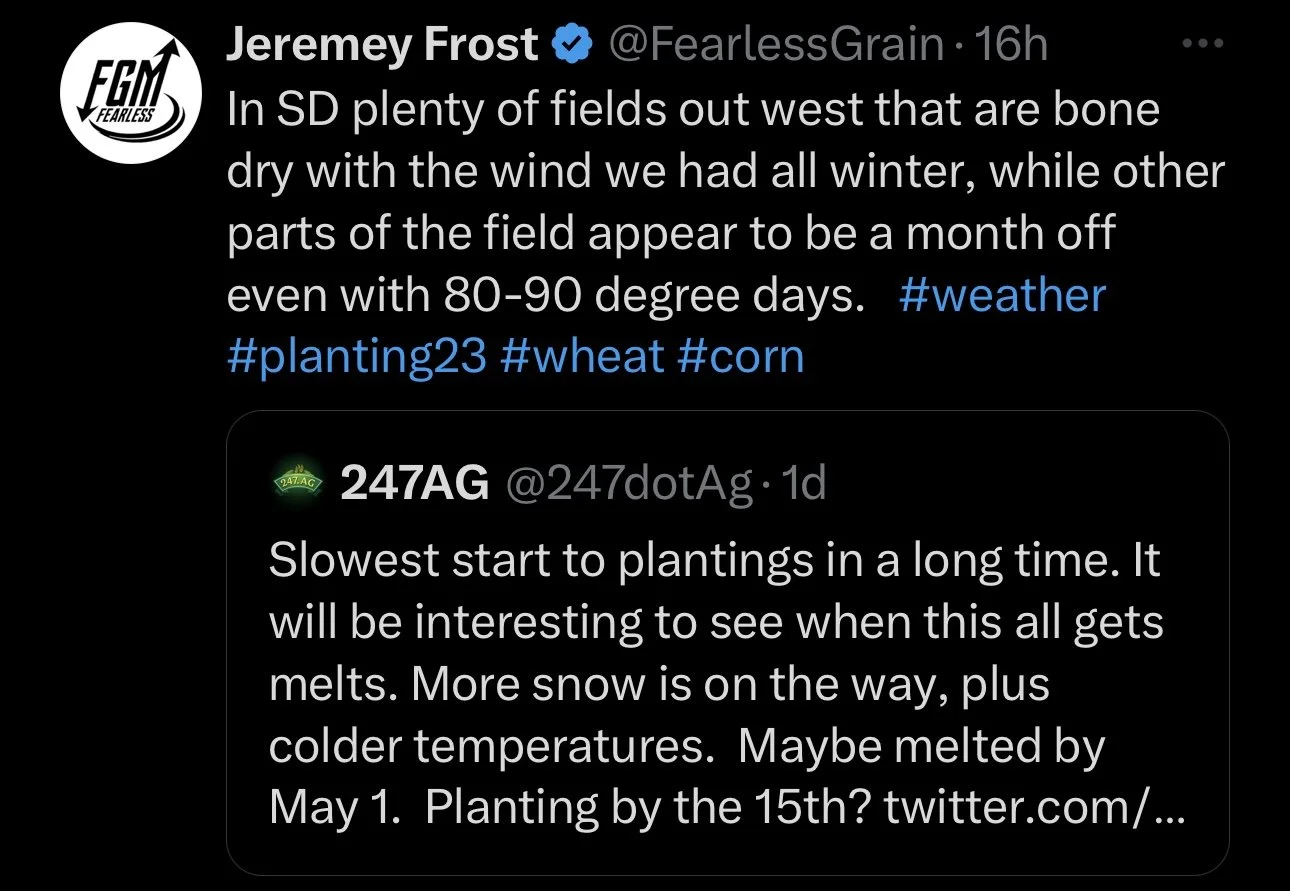
U.S. spring wheat growing areas in South Dakota, eastern North Dakota and northwest Minnesota were hammered with heavy snow and winds during the first seven days of April. Some of these huge drifts and piles will stick around for another month which will be a problem. U.S. spring wheat crop insurance deadlines in the Dakota’s are May 31st to June 5th and for corn May 25th to May 31st. Our best guess is planting will get started by mid-May bit only barring any more Colorado lows or heavy rain events.
If spring comes late again this year expect U.S. spring wheat and corn acres to fall vs. the intended acres in the USDA March planting intentions report. In fact, North Dakota final corn area has averaged 2.0% below the March intentions over the past 20 years and really cold and wet conditions in three of the past four seasons have resulted in an average 4.7% fall from March to the final figure over the past 10 years, both the most of any major state. To keep things in perspective, ND could lose as much as 75,000 to 176,250 acres of corn but North Dakota according to the USAD will grow 3,750 million acres of corn in 2023 up 800,000 from 2022.
South Dakota corn area has fallen by an average of 3.7% from the March to final over the past ten years while another northern state, Michigan, has seen a 2.2% March to final drop average since 2013. SD could lose as much as 218,300 corn acres with intended acres up 150,000 acres.
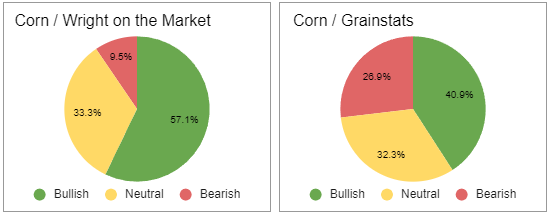
Seasonals & Recommendations
From Wright on the Market,
Corn
December corn settled on Tuesday at $5.59 ¼, -¾¢ since last Tuesday.
The past 7 days’ high was $5.65½, the low was $5.50½.
Contract high is $6.79¼ made Apr 27, 2022;
Contract low is $3.97½ made Dec 15, 2020;
Range is $2.81¾.
Yesterday’s closing price was:
$1.20 below the contract high.
$1.61¾ above the contract low.
USDA’s 2021 crop carryout in terms of days’ use:
U.S. 34 days.
World 93 days.
USDA’s 2022 crop carryout in terms of days’ use:
U.S. 35 days
World 94 days
Seasonal Trend is up.
Fundamentals are bullish.
Technical Situation is up with higher highs and higher lows since March 10th.
Conclusion:
Sell old crop when May or July corn will get to $7.50+
Given what we know now, expect to price with HTA December 2023 in the $7.00 to $7.60 range in middle to late May.
Beans
Soybean situation after the close Tuesday, April 11, 2023:
May soybeans settled on Tuesday at $14.97 ¼, -20 ¼¢ from last Tuesday.
November Soybeans settled on Tuesday at $13.14 ¼, -5¾¢ since last Tuesday.
The past 7 days’ high was $13.38¾, the low was $12.95¾.
Contract high is $14.48¼ on Apr 29, 2022;
Contract low is $8.87¼ on Aug 7, 2020;
Range is $5.61.
Tuesday’s closing price was:
$1.34 below the contract high;
$4.27 above the contract low.
USDA’s 2021 crop carryout in terms of days’ use:
U.S. 22 days
World 100 days
USDA’s 2022 crop carryout in terms of days’ use:
U.S 18 days.
World 98 days.
Seasonal Trend is up into mid-summer.
Fundamentals are bullish, very bullish long term.
Technical Situation is up with higher highs and higher lows since March 10th.
Conclusion:
Sell old crop May HTA $15.72 or July HTA at $17.50, take your pick.
We expect November 2023 beans to trade to the $16 area in June. Be patient.
Wheat
Hard Red Winter Wheat
July KC Hard Red Winter Wheat settled on Tuesday at $8.50, -7 ¾¢ from last Tuesday.
The past 7 days’ high was $8.67¼, the low was $8.37 ¼.
Contract high is $12.10 on May 19, 2022;
Contract low is $4.94 on August 4, 2020;
Range is $7.16.
Tuesday closing price was:
$3.60 below the contract high;
$3.56 above the contract low.
USDA’s 2021 total wheat carryout in terms of days’ use:
U.S. 135 days.
World 125 days.
USDA’s 2022 total wheat carryout in terms of days’ use:
U.S. 116 days.
World 123 days.
USDA’s 2021 winter wheat carryout in terms of days’ use:
U.S. 170 days.
USDA’s 2022 winter wheat carryout in terms of days’ use:
U.S. 147 days.
The 30 year seasonal trend is down until September.
Fundamentals are very bullish.
Technical Situation is up, price has been making higher highs & higher lows since March 10th.
Conclusion:
Price July Hard Red Winter HTA near $10.
_________
Hard Red Spring Wheat
September Hard Red Spring Wheat settled on Tuesday at $8.61¼, -27 ¾¢ from last Tuesday.
The past 7 days’ high was $8.90¼, the low was $8.59¼.
Contract high is $11.50 on May 19, 2022;
Contract low is $7.78 ¾ on February 2, 2022;
Range is $3.71 ¼.
Tuesday closing price was:
$2.88 ¾ below the contract high;
$0.82 ½ above the contract low.
USDA’s 2021 total wheat carryout in terms of days’ use:
U.S. 135 days.
World 125 days.
USDA’s 2022 total wheat carryout in terms of days’ use:
U.S. 116 days.
World 123 days.
USDA’s 2021 spring wheat carryout in terms of days’ use:
U.S. 103 days.
USDA’s 2022 spring wheat carryout in terms of days’ use:
U.S. 90 days.
The 30 year seasonal trend is down until September.
Fundamentals are very bullish.
Technical Situation is up with higher highs and higher lows since March 10th.
Conclusion: Sell on HTA when September Hard Spring Wheat trades above $10.
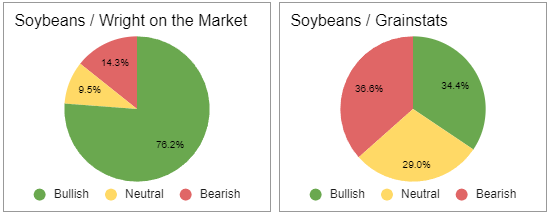
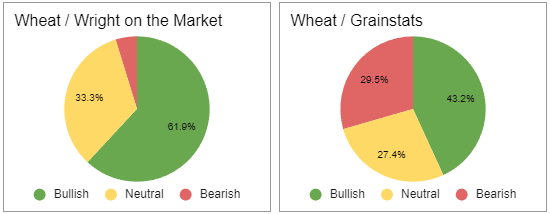
I highly recommend checking out Wright on the Market. They provide daily tidbits and thoughts, as well as weekly recommendations.
Enjoy Our Stuff?
Try our 30-day trial or get 50% off our yearly or monthly option. Every update & audio sent via text and email.
Other Highlights & News
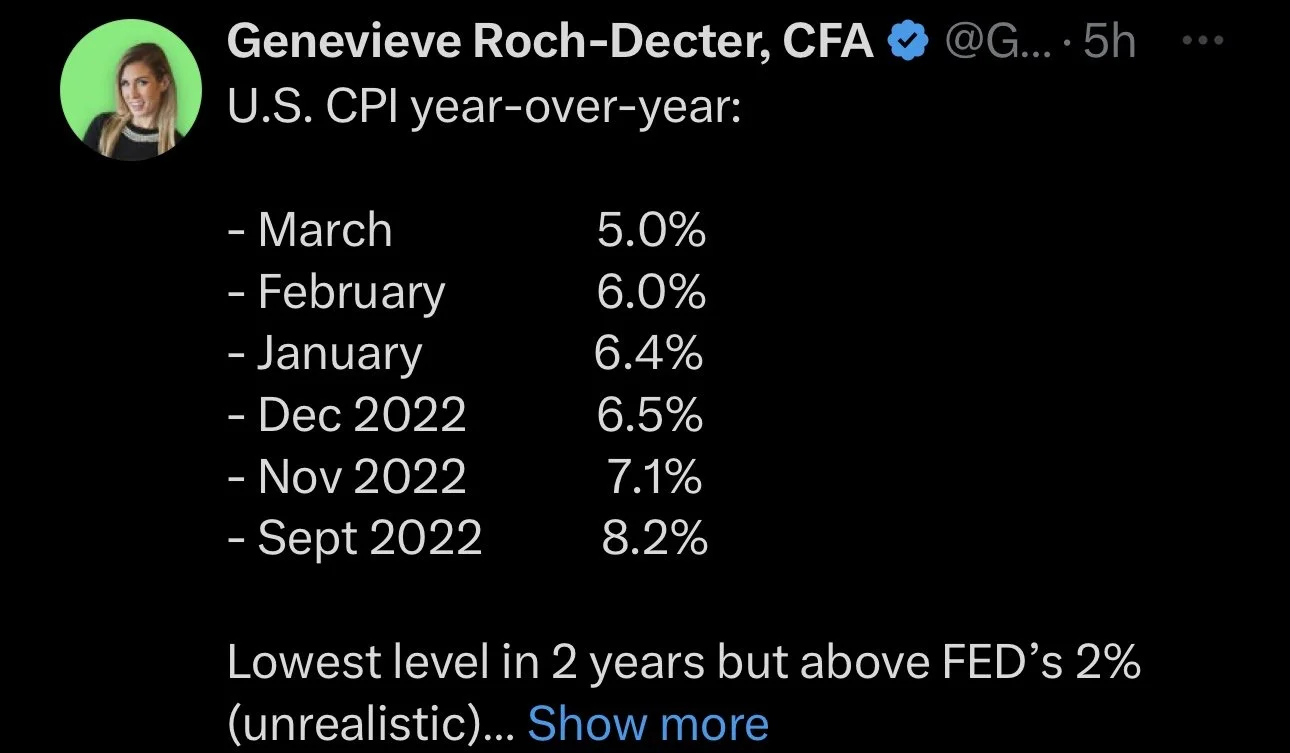
The yearly rate of inflation dropped from 6% to 5%, the lowest level since May 2021. As the March CPI today came in at 5%, which was below the 5.2% estimates.
China's corn prices were 7 to 8 cents higher yesterday, and 25 to 26 cents higher the past 5 business days.
An explosion at a dairy farm in Texas yesterday reportedly killed 18,000 dairy cows.
Gold closed above $2,000 for the 6th straight trading day.
Social Media
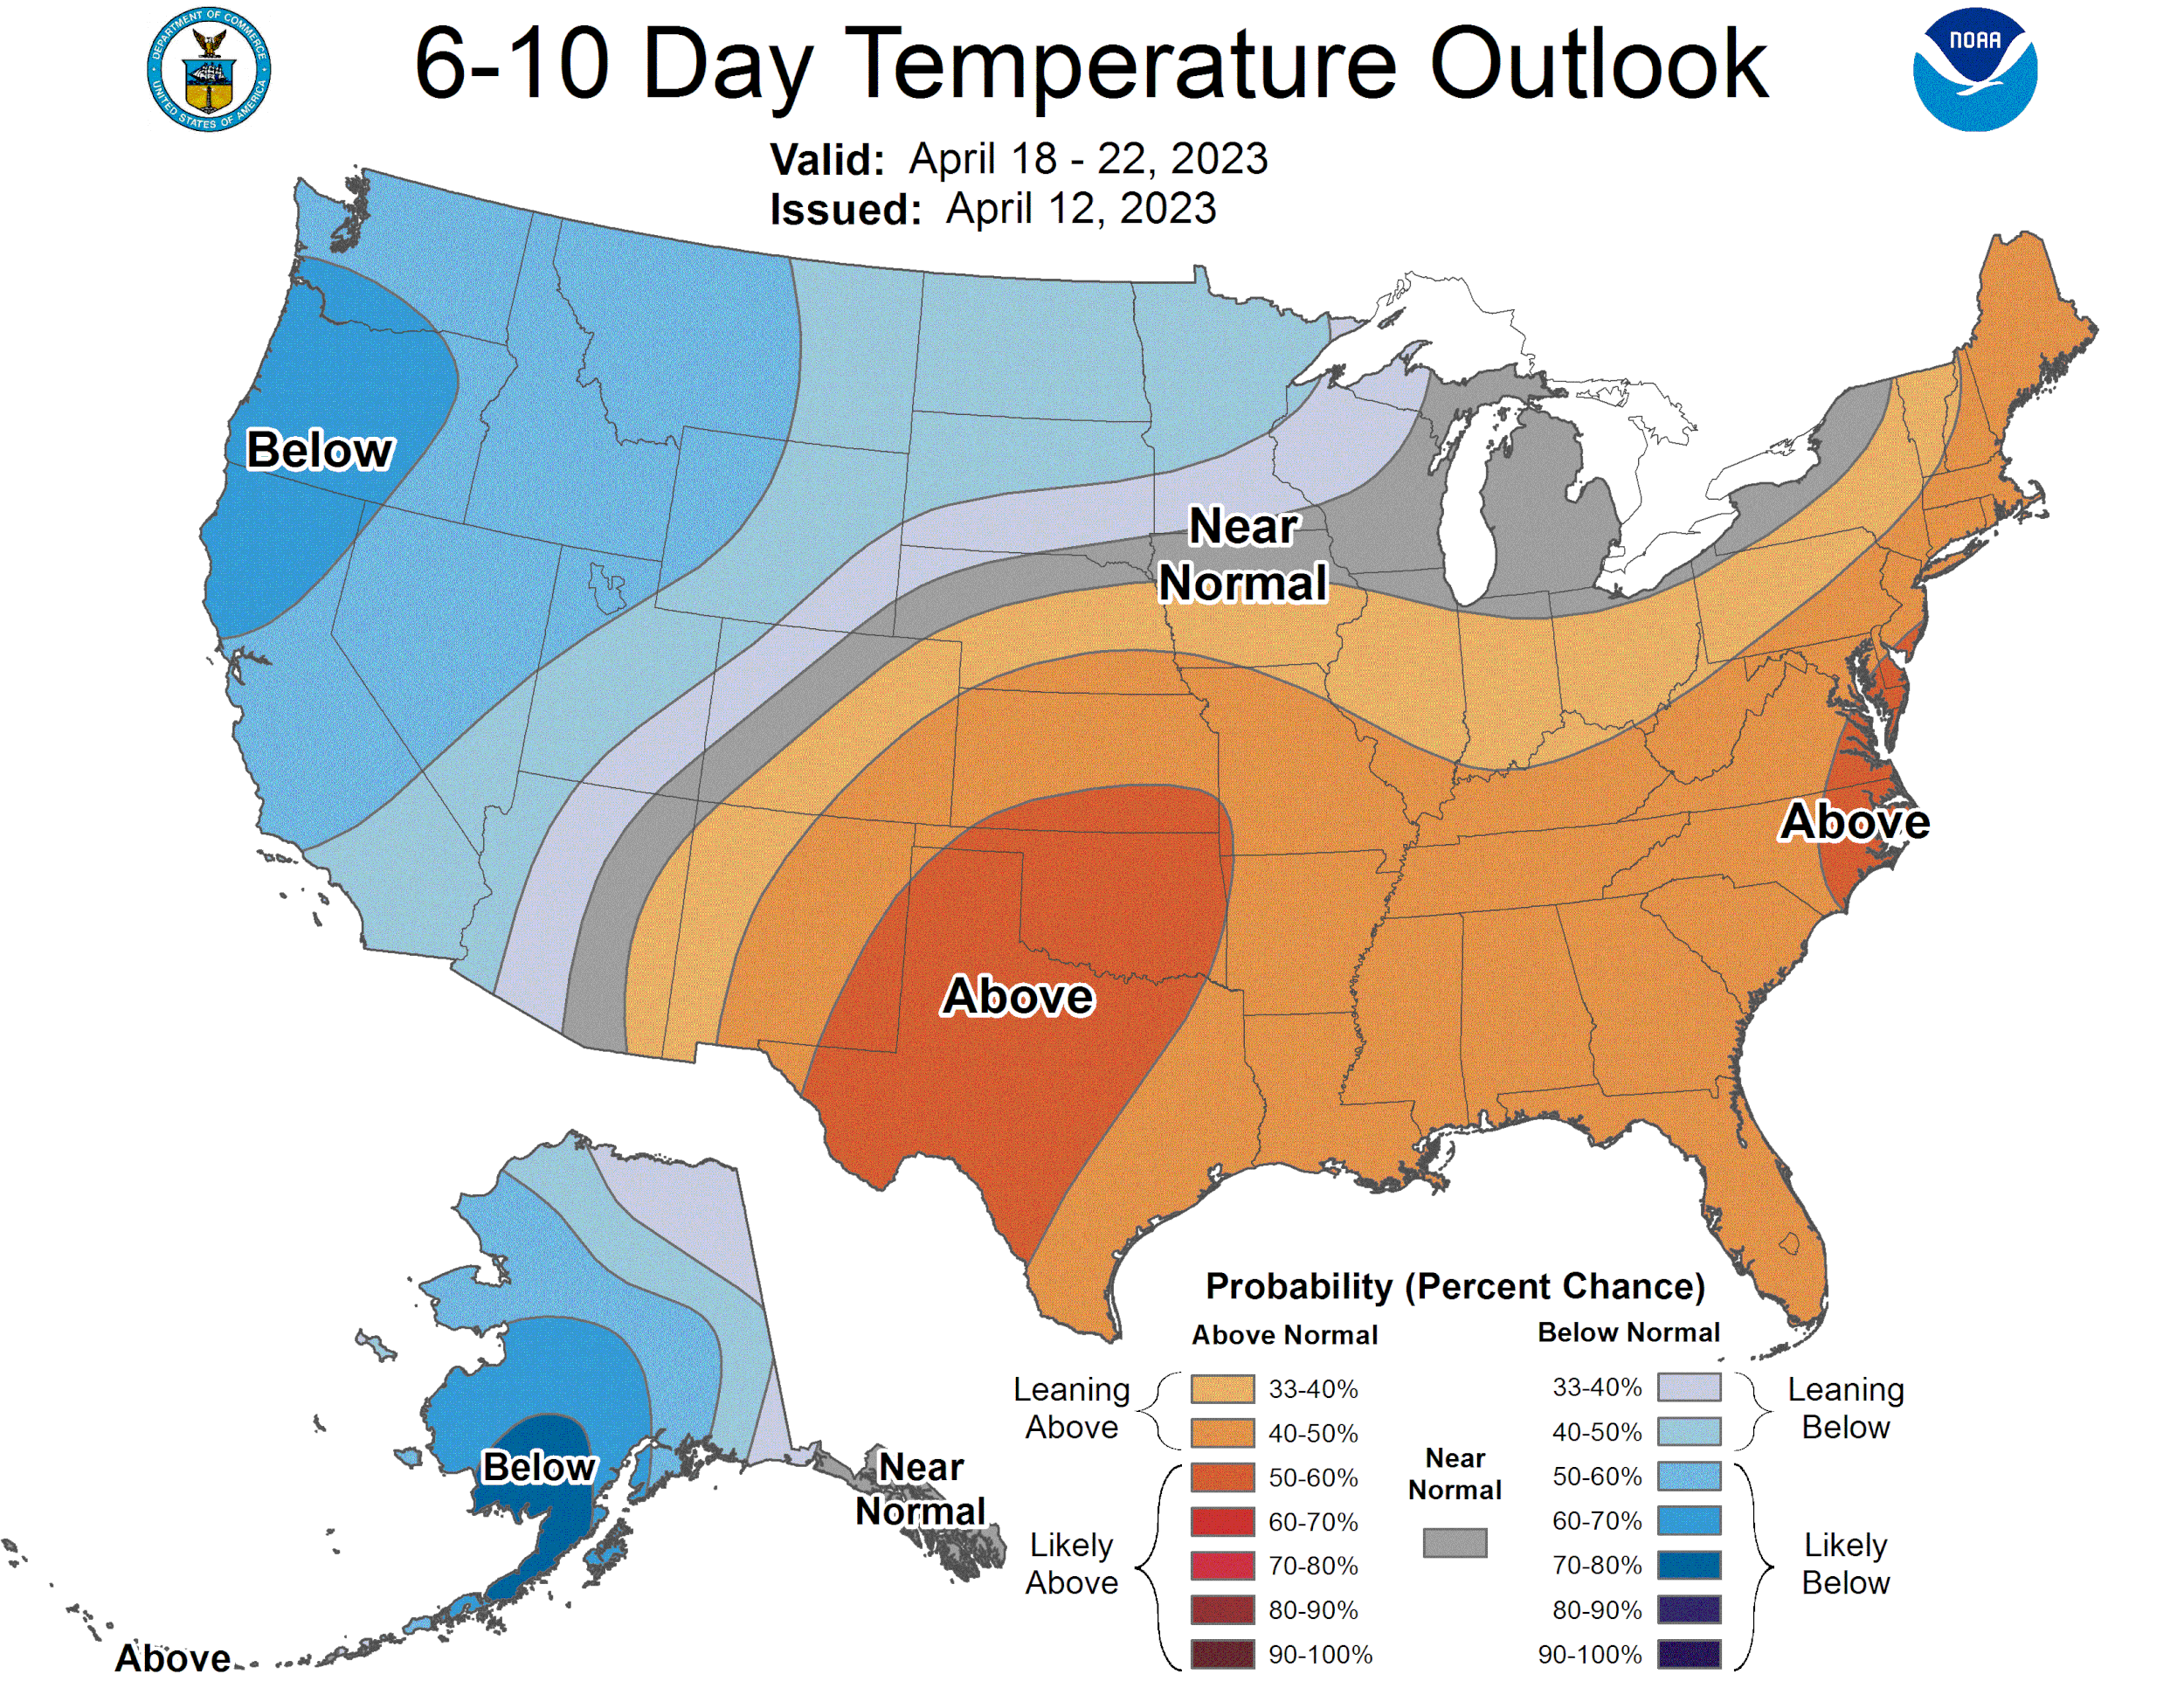
U.S. Weather
Source: National Weather Service


