NAVIGATING THE USDA REPORT & DROUGHT
WEEKLY GRAIN NEWSLETTER
Here are some not so fearless comments for www.dailymarketminute.com
USDA Report
Was out on Friday and it was a non-event. Overall bearish on the surface with numbers printed that didn’t help feed the bulls at all.
Here are the numbers if you missed them.
As for price action from the report that too was similar to watching paint dry as we just didn’t move much. We did close most of the markets slightly higher than they were prior to the release of the report. But we didn’t do anything super special or harmful on the charts either.
What we did do is keep the bears in the game, heck we probably even added a reason for more bears to jump in the game. Meaning we added more confidence for those that are short the market to stay short, add shorts, or maybe even double up. I think that is false confidence that will give us even more upside in the future should Mother Nature not get wet.
A couple of good questions to ask yourself are.
What type of yield is already priced into the market. What type of yield is potential, possible, and probable? What is the present range of those yields?
So what are we going to be watching going forward? Other than weather updates several times daily?
Trends
Crop condition trends, weather trends, and demand trends will all be key. As will the #USDA update at the end of the month when we get updated acres and quarterly stocks. The quarterly stock trend has been one below estimates for a couple in a row for corn and beans with both January and March coming in below trade estimates. If that trend continues the USDA may be forced to drop old crop carryout in July or we should continue to see exports slow of old crop product because we just don’t appear to have it.
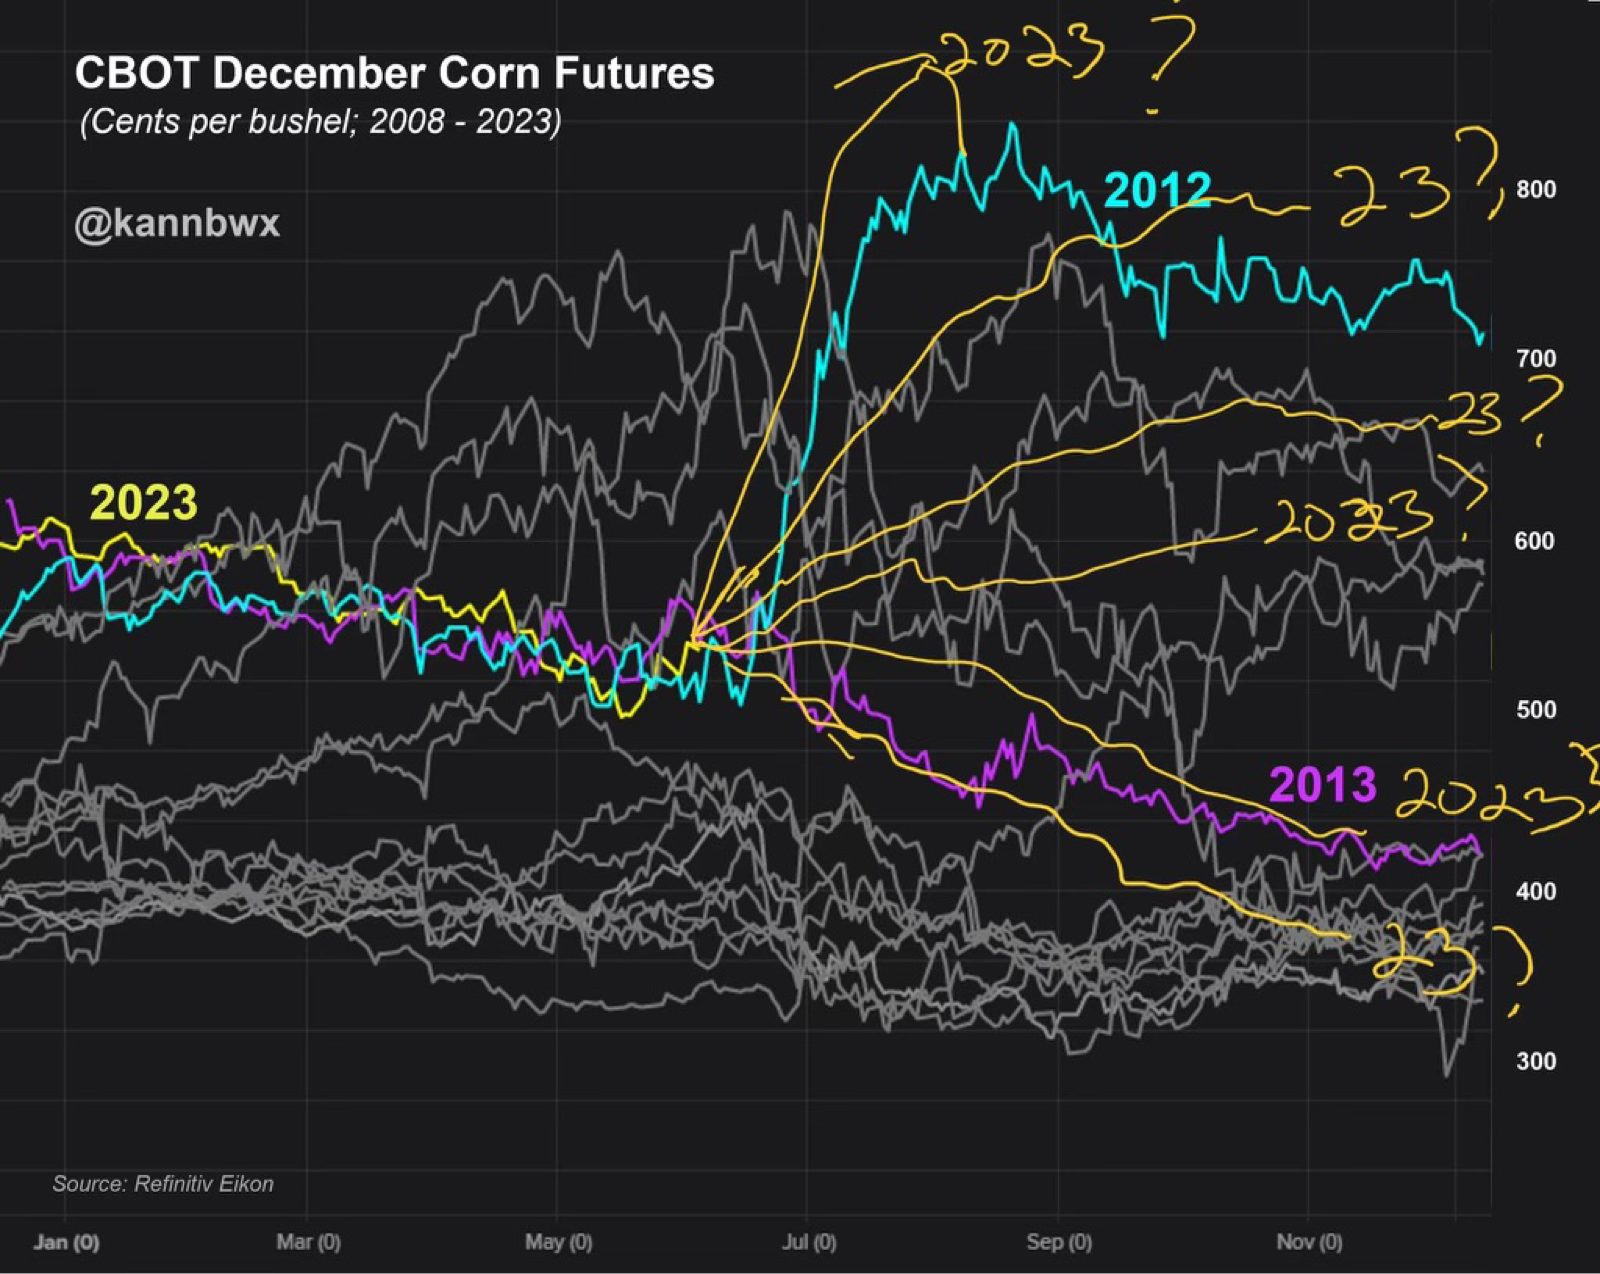
We have done a lot of comparisons to 2012 for several months. Many others have done comparisons to 2013. We are near the point when 2023 will do one of 3 things, follow 2013 price action and get cheaper, follow 2012 and get higher, or make its own path.
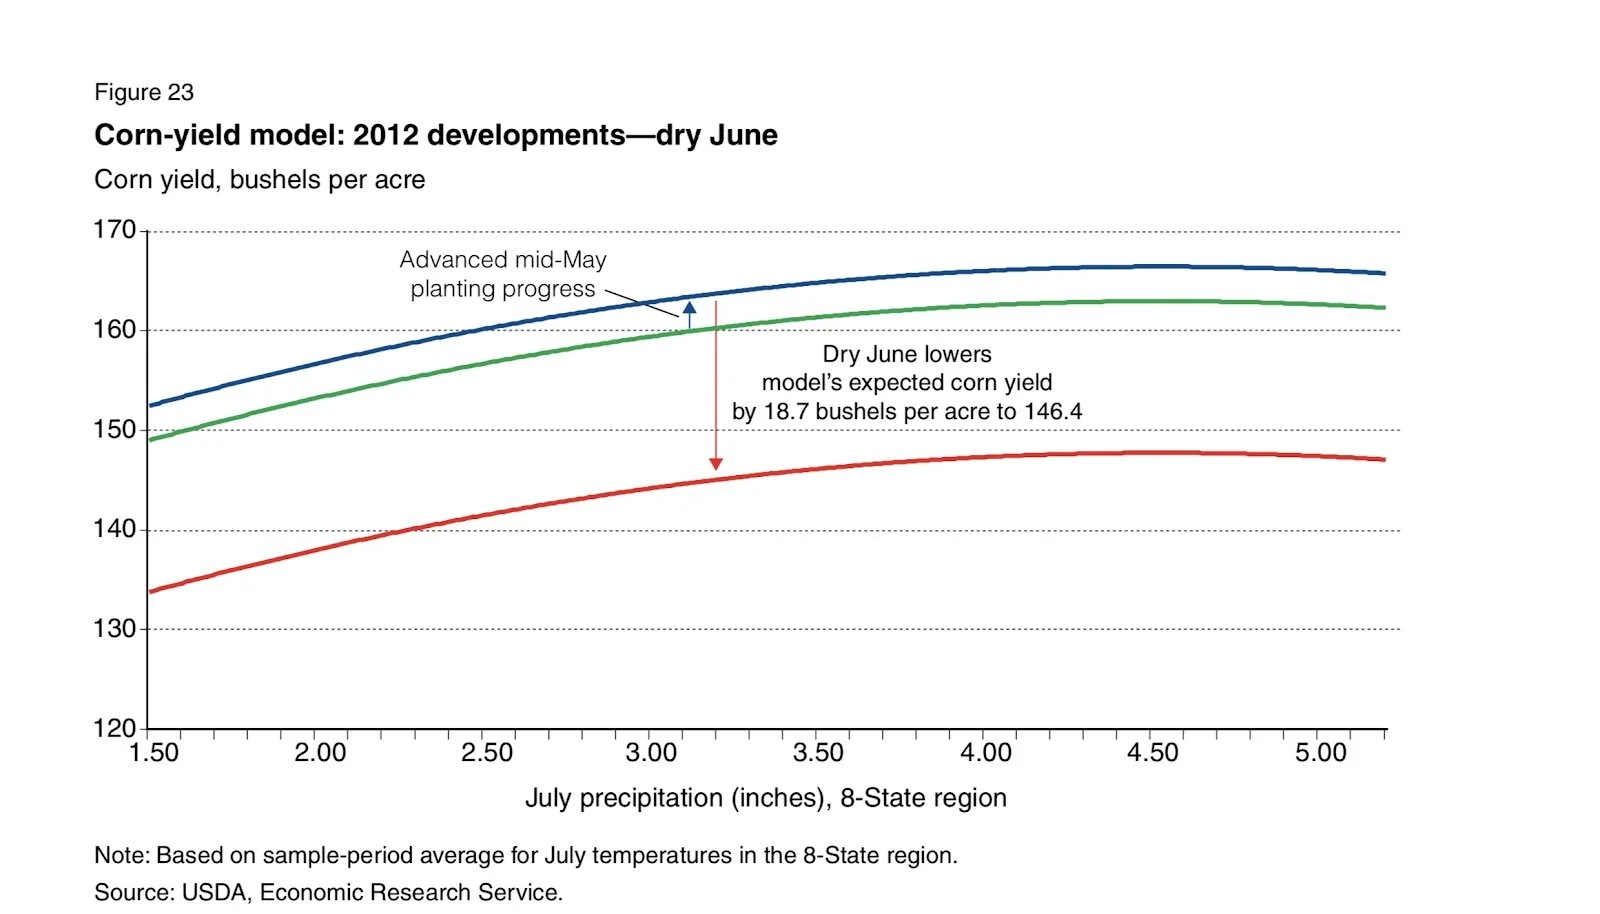
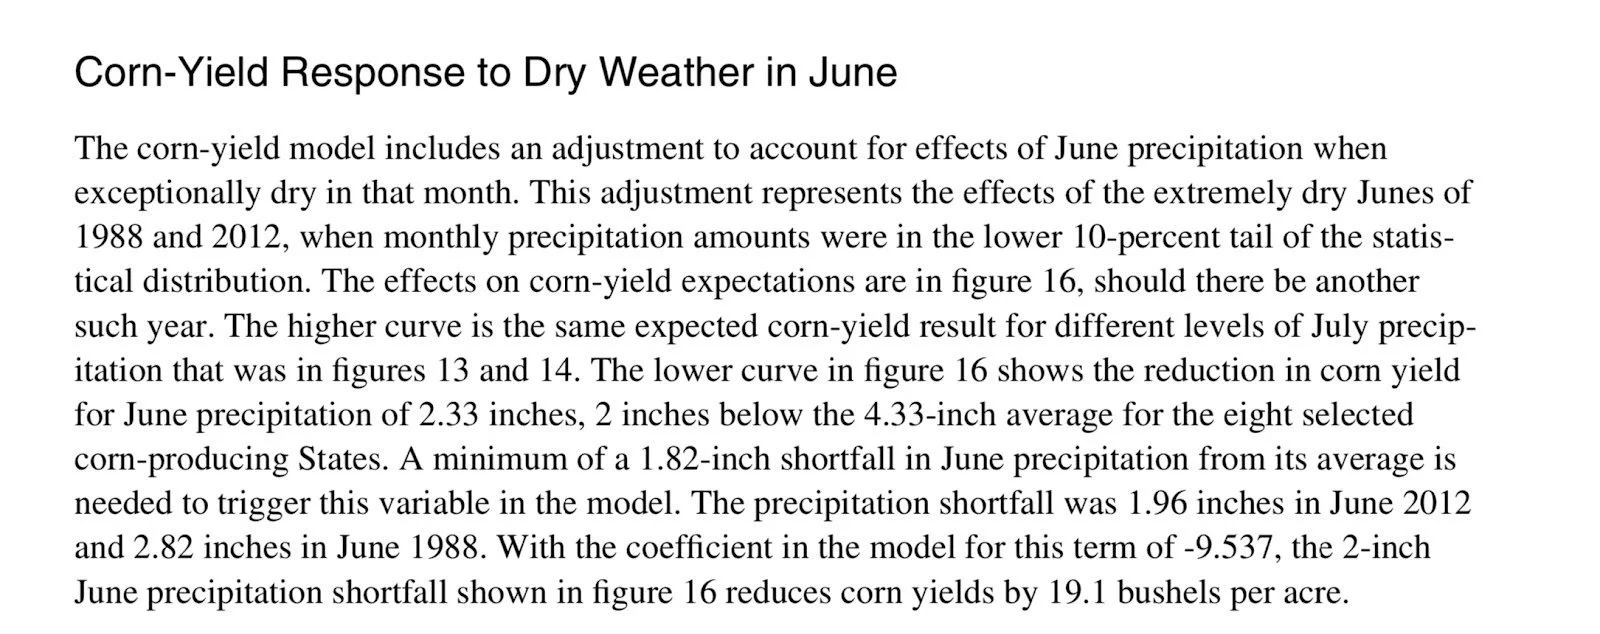
Below are some various screen shots coming from a 2013 report that talks about how the USDA came up with 2012 yield adjustments.
To sum it up, our July yield decrease came from very dry June weather. The article correlates a 2 inch deflect in precipitation in June for the 8 state region equals about a 20 bushel per acre yield decrease from yield models.
HONEYMOON SALE
My partner and son Sebastian got married yesterday. In celebration, we are offering our content for a massive discount. The offer is available until he returns from his honeymoon. Take advantage before your free trial ends.
$299/yr or $29/mo
Originally: $800/$80
Become a Price Maker. Not a Price Taker.
Here is what CHATGPT says is possible based on present drought conditions staying worse then 2012. It believes that we have a chance of 165 yield in July, considering worse crop conditions then a year ago and an increase in the midwest drought conditions versus 2012. Obviously it goes without saying that Mother Nature over the next 30 days will really dictate what happens on the July USDA Crop Report.
Here is a link to the 2013 USDA article.
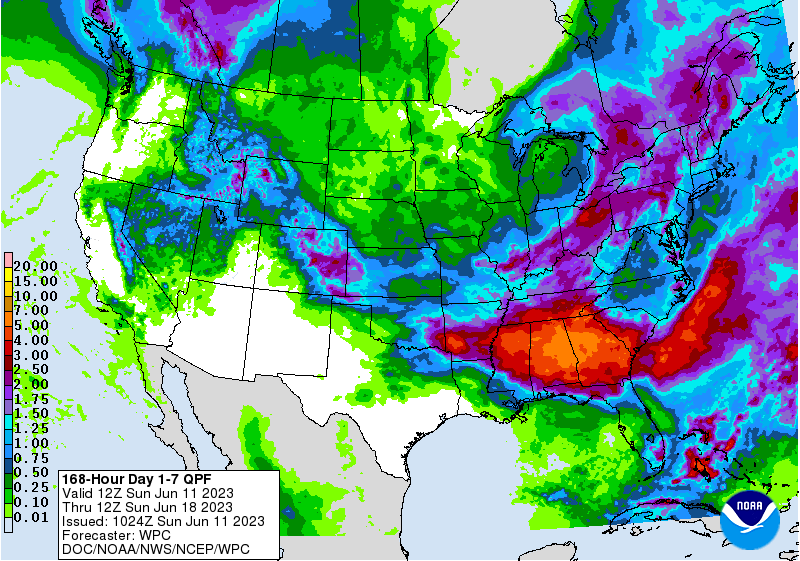
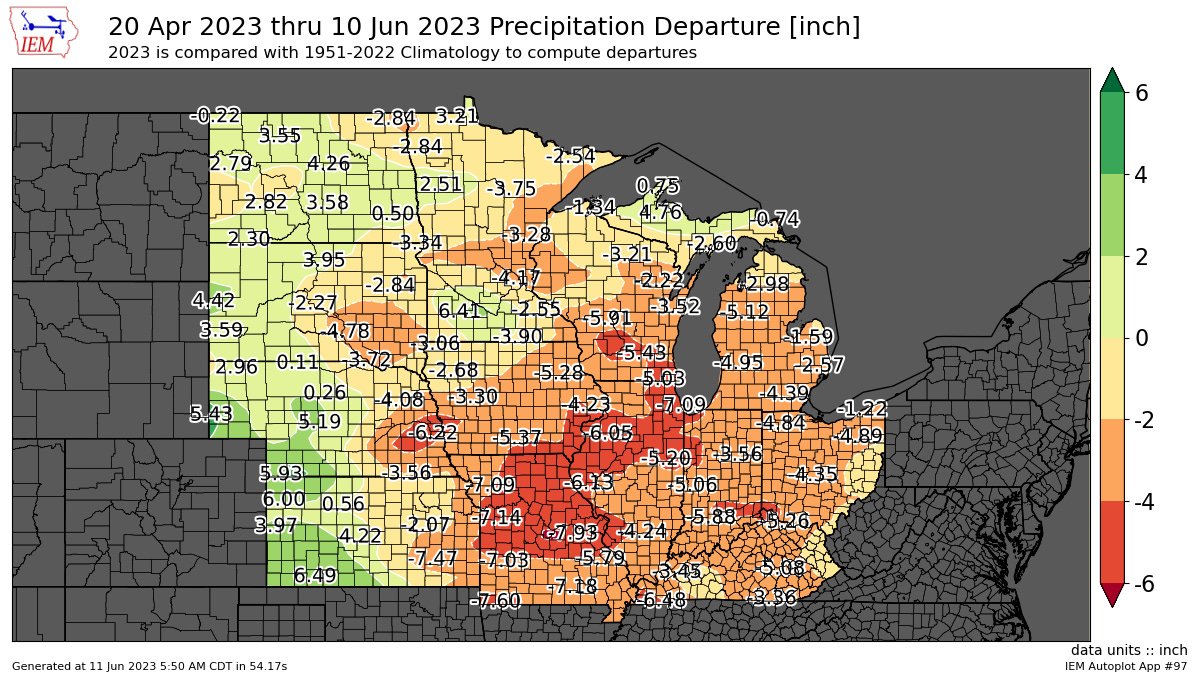
As for weather, here are some maps, some of which will be changing and updating before the markets open.
Here is the 15 day percent of normal precipitation. Sticking to the theme above I have marked the top 11 in 2022 corn production. Notice Iowa and Minnesota.
Here is the past 30 day precipitation, this speaks for it self.
Here is a 1 week anomaly from normal. This is the GFS model.
This map is one that is turning the heat back up. Notice Iowa and Illinois. In the article above about 2012 July heat was to explain the rest of the below normal.
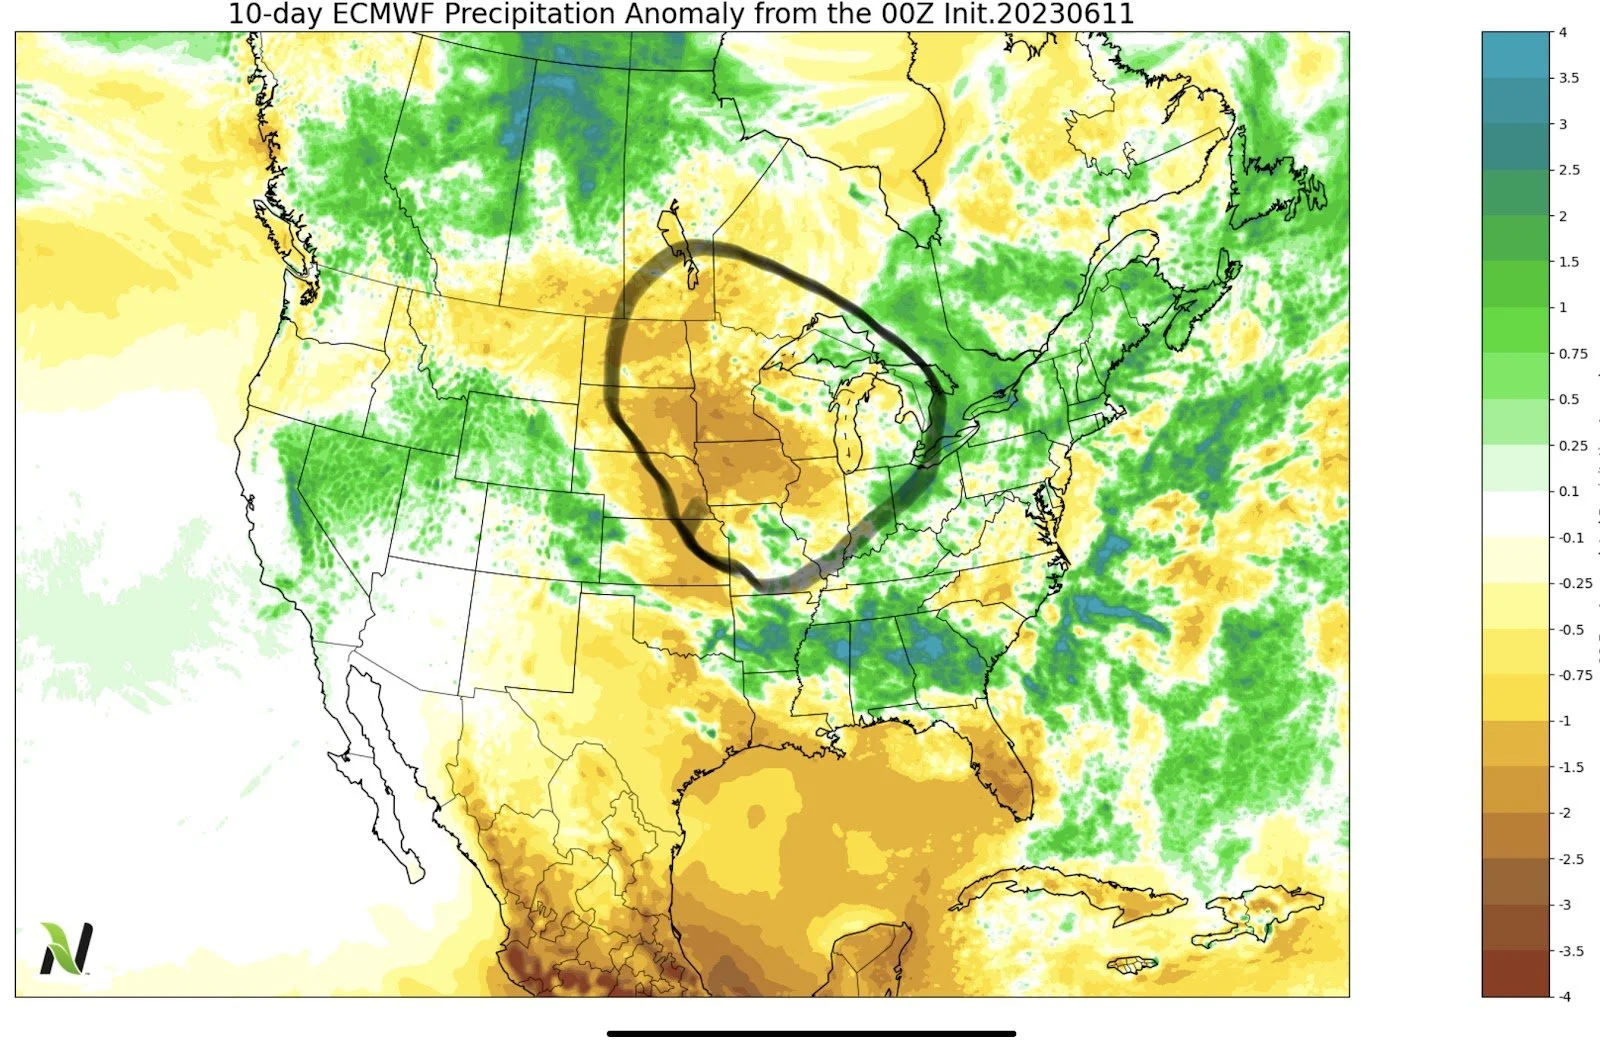
Here is the 10 ECMWF (Euro) day anomaly, notice Iowa.
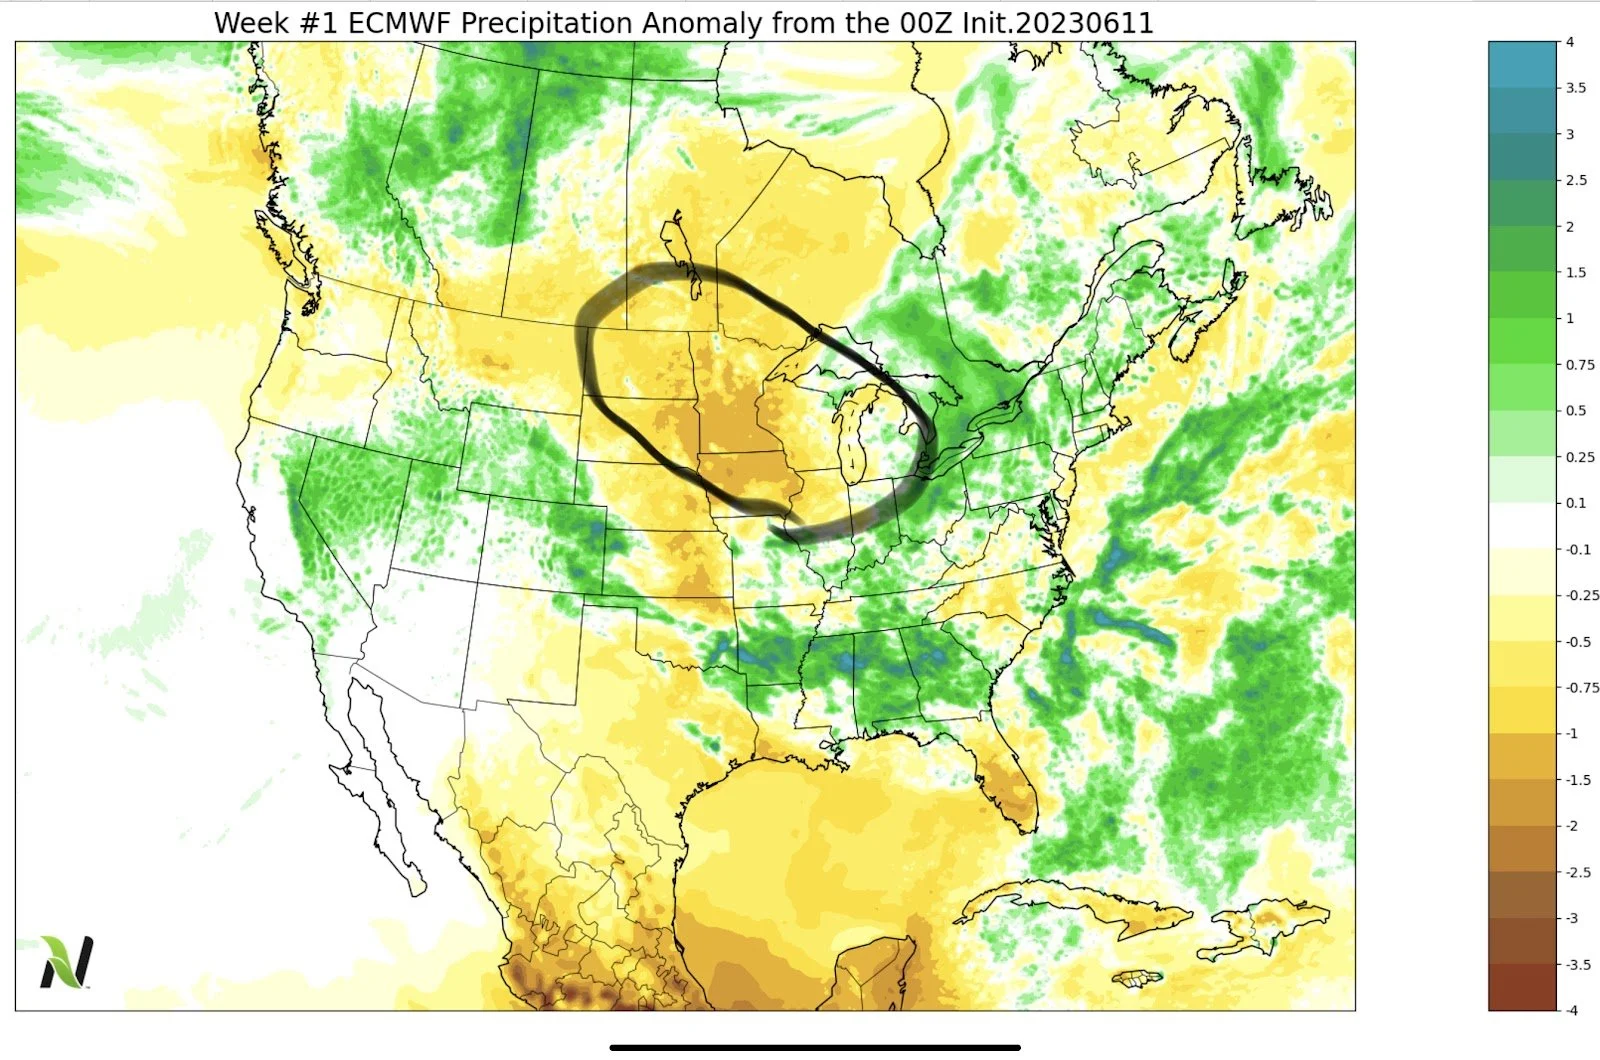
Here is the one week ECMWF anomaly.
Here is the last 72 hours of precipitation.
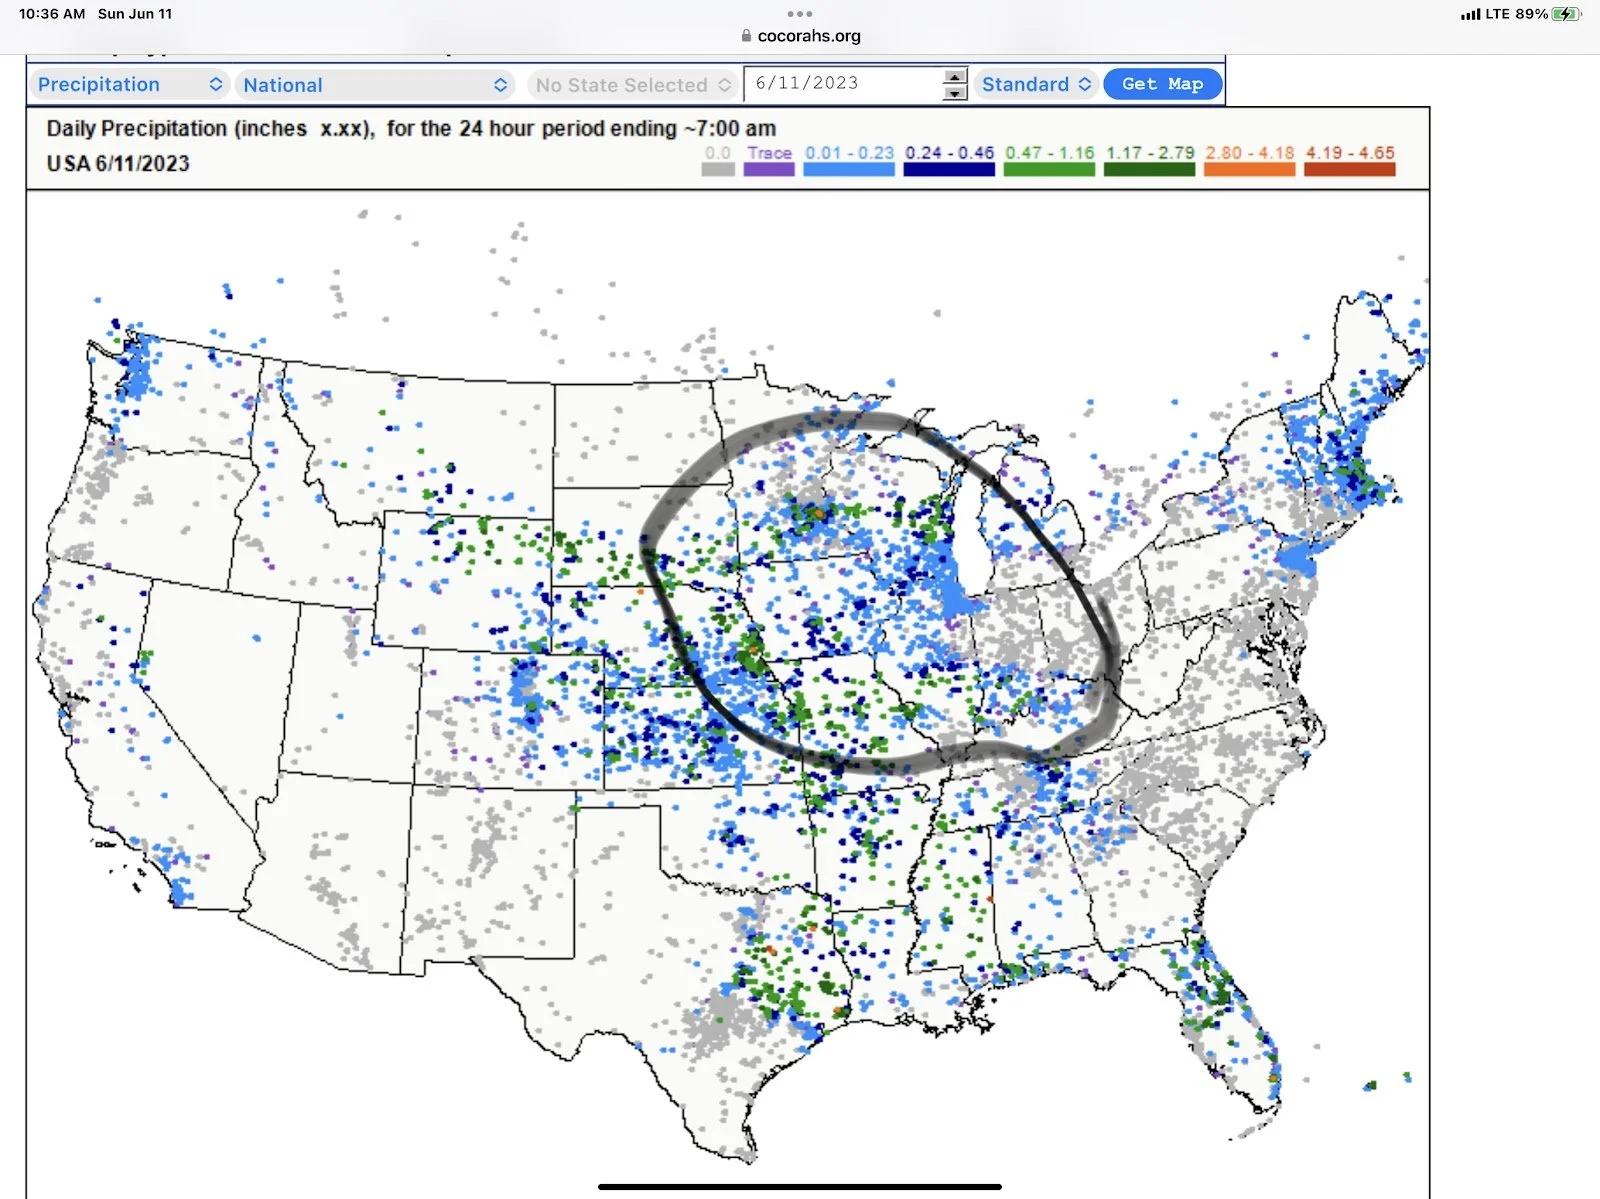
Here is from www.cocrahs.org, which is a great website as it shows what is actually hitting rain gauges. I recommend enrolling if you are not.
Here is a good comparison to what others show as observed precipitation.
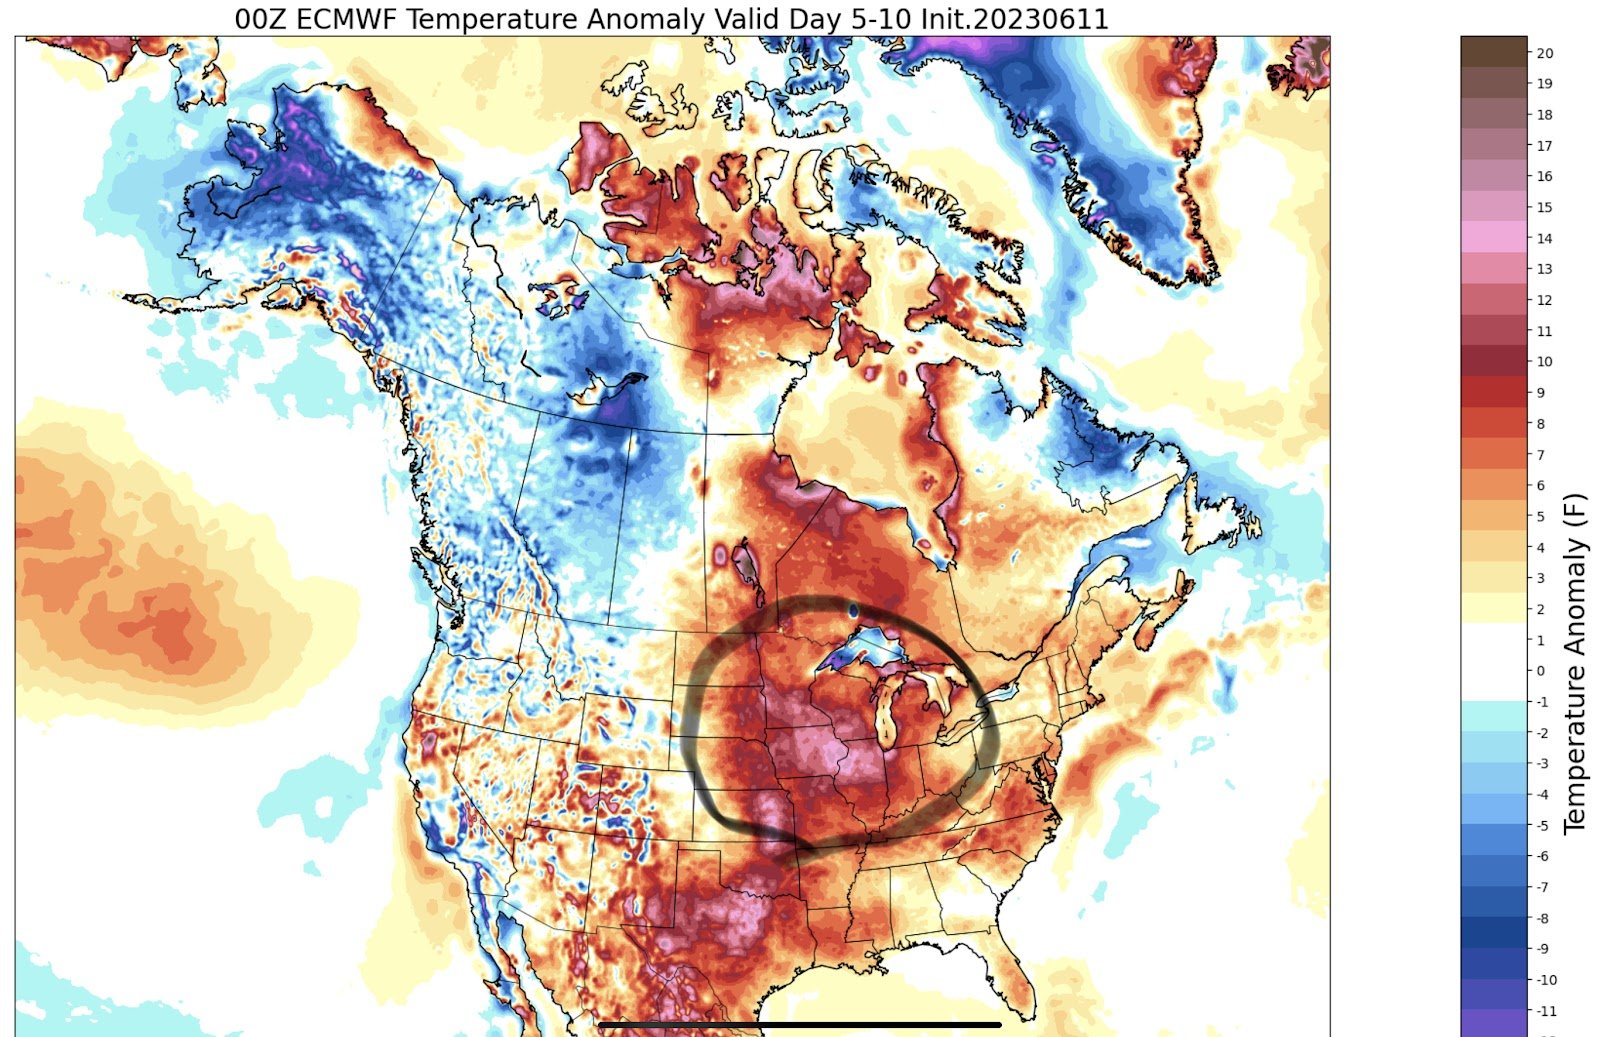
With all of the above maps the million dollar question is the weather trend changing. I don’t know the answer. I think it is trying to. The one thing that concerns me more than anything is the hot temps forecasted in 5-10 days in one model. Below are the two different models.
Here is a screen shot from farms.com risk management. More drought comparisons.
Here is a good graph that might indicate that we are well on the way of a 2012 repeat.
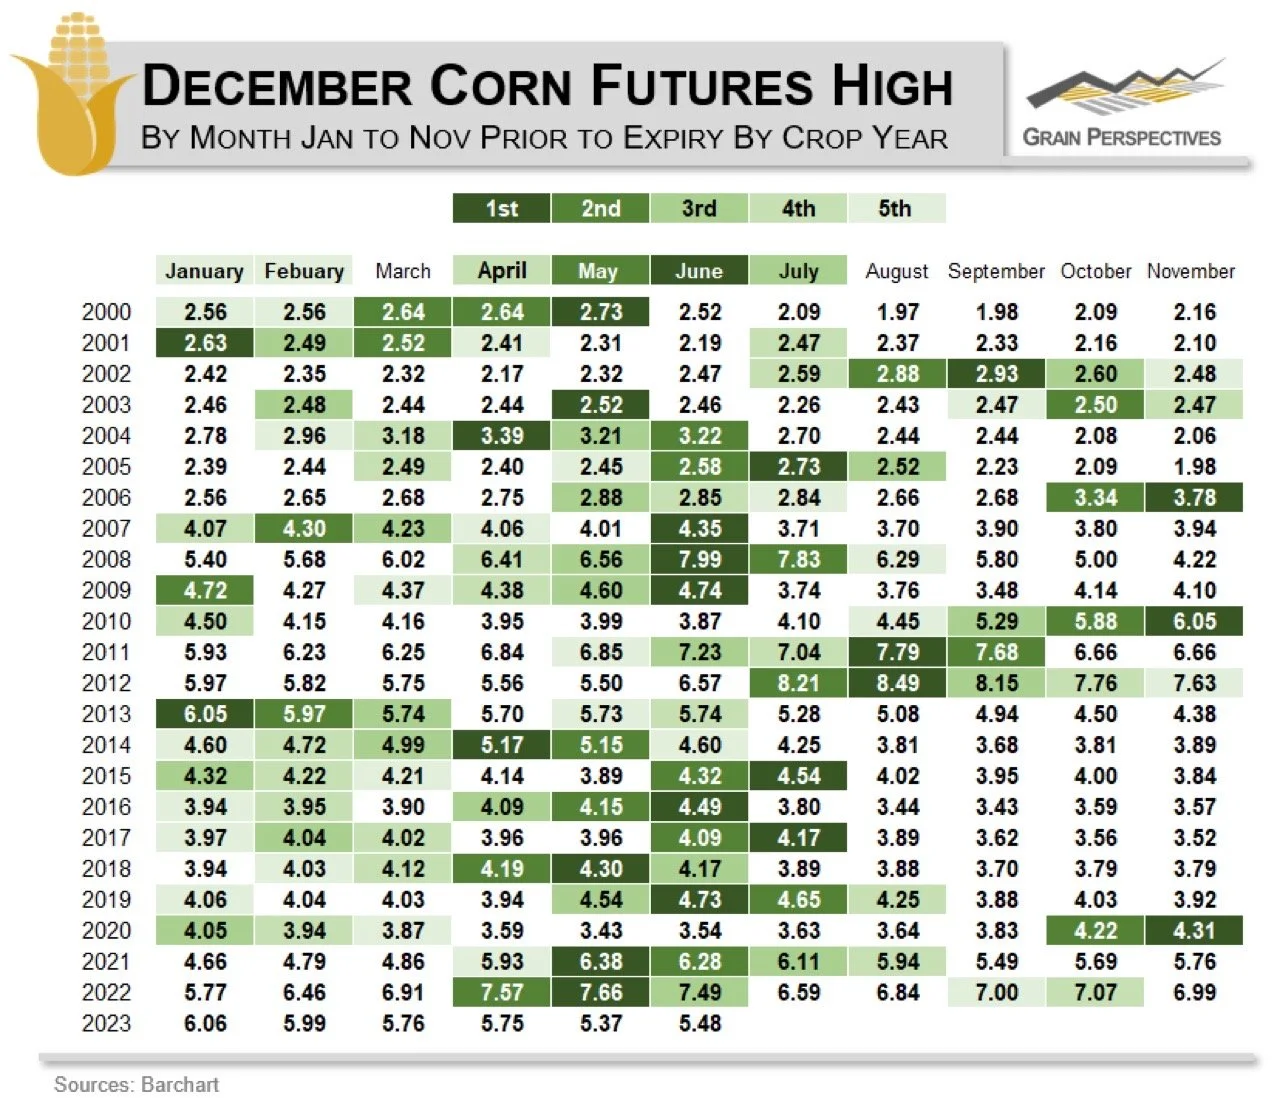
Here is another nice graph. Notice in 2012 Dec corn traded 5.97 as a high. May 2012 was 5.50 as a high followed by 6.57 in June before going over 8.00 in July, August, and September.
The bottom line in all of this is we have several possibilities. Be prepared.
I like having courage calls, because I think we have several issues. Such as the lack of subsoil which means some areas that need to get timely consistent rains to reach anything close to what the USDA is forecasting.
If you want to open a hedge account you can give me a call at 605-295-3100 or Wade a call at 605-870-0091.
Here is a link:
https://www.dormanaccounts.com/eApp/user/register?brokerid=332
As a reminder Sebastian got married yesterday and he will be leaving for his honeymoon after his update on Monday afternoon. We will be sending out audio comments but we won’t have regular write updates again until the 22nd. Feel free to call me if you have questions on the markets or need some information that Sebastian typically sends out. I can be reached at 605-295-3100
Congrats Sebastian and Kianna.
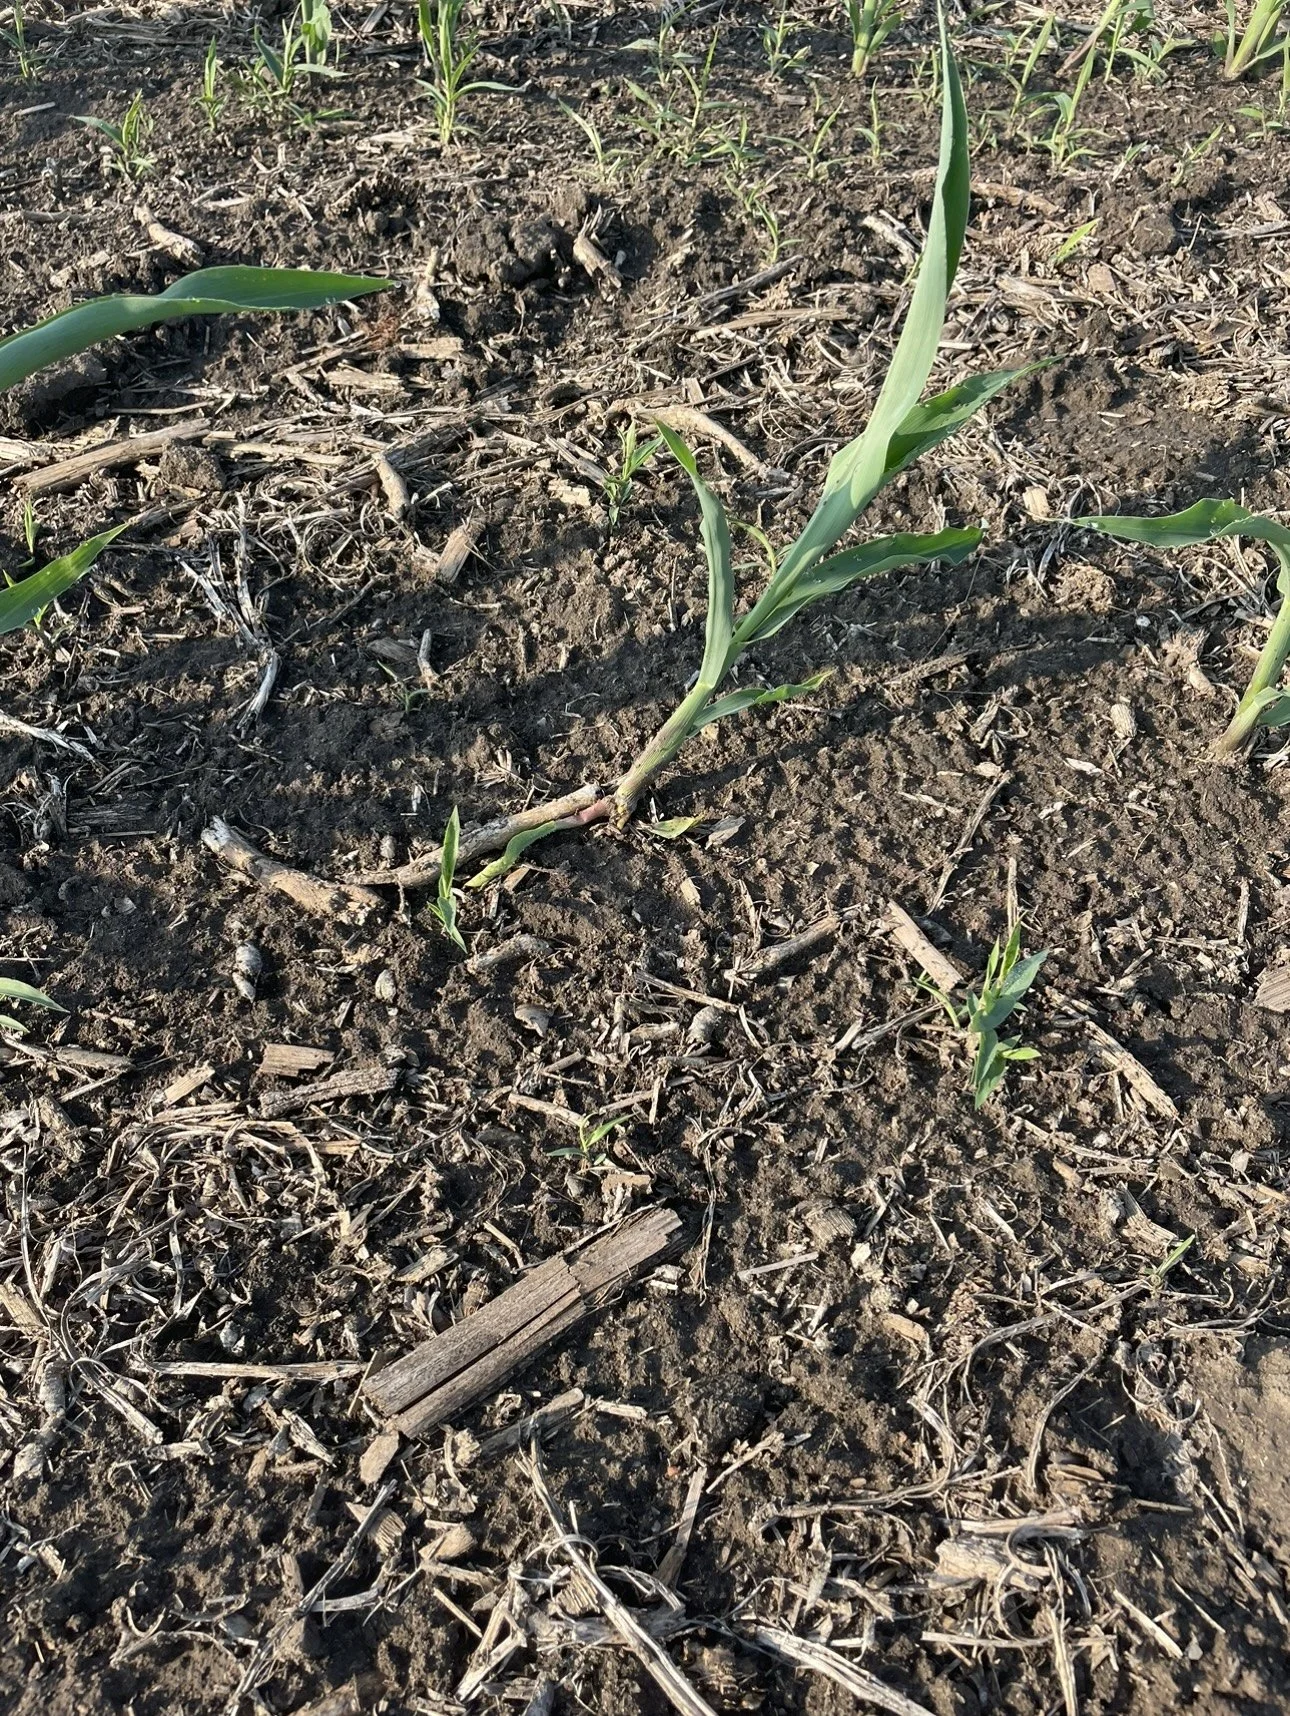
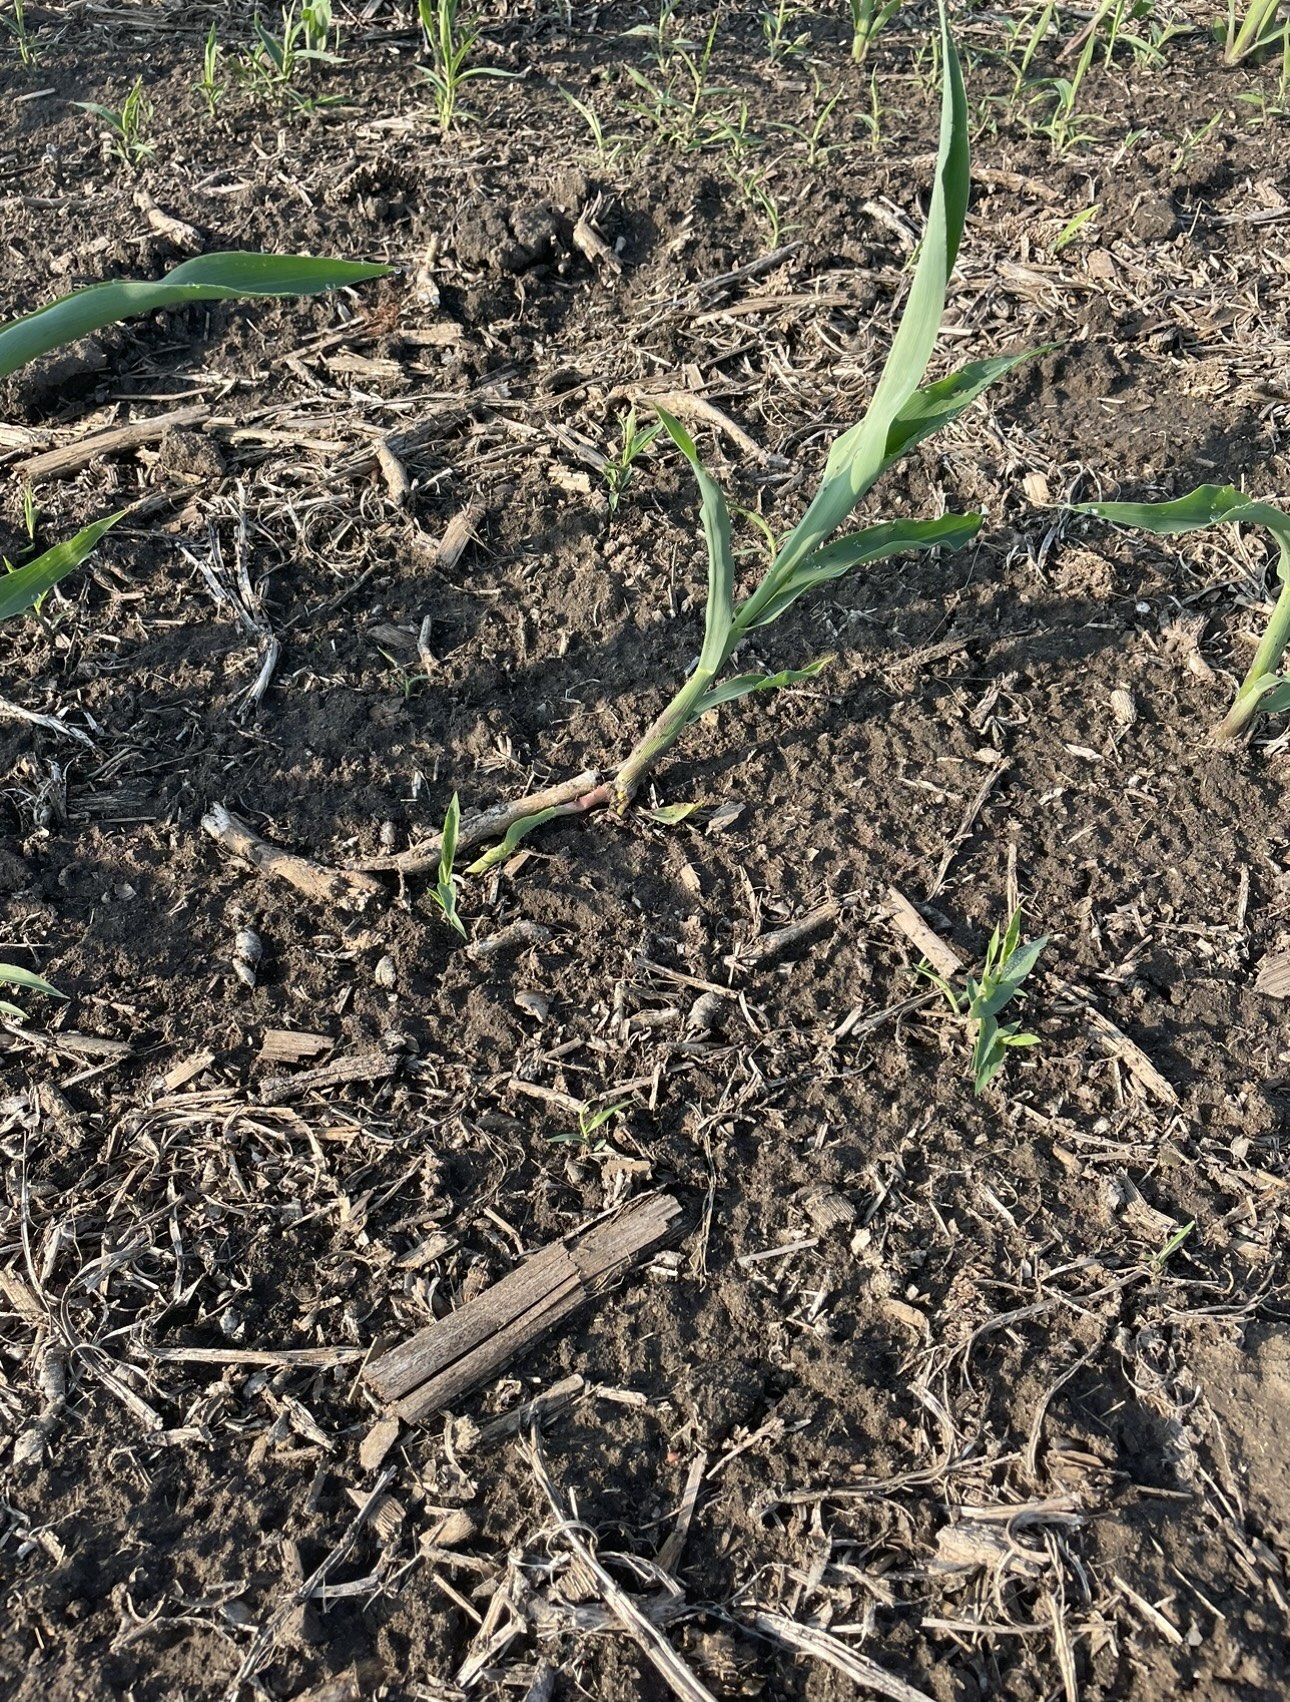
Crop Pics
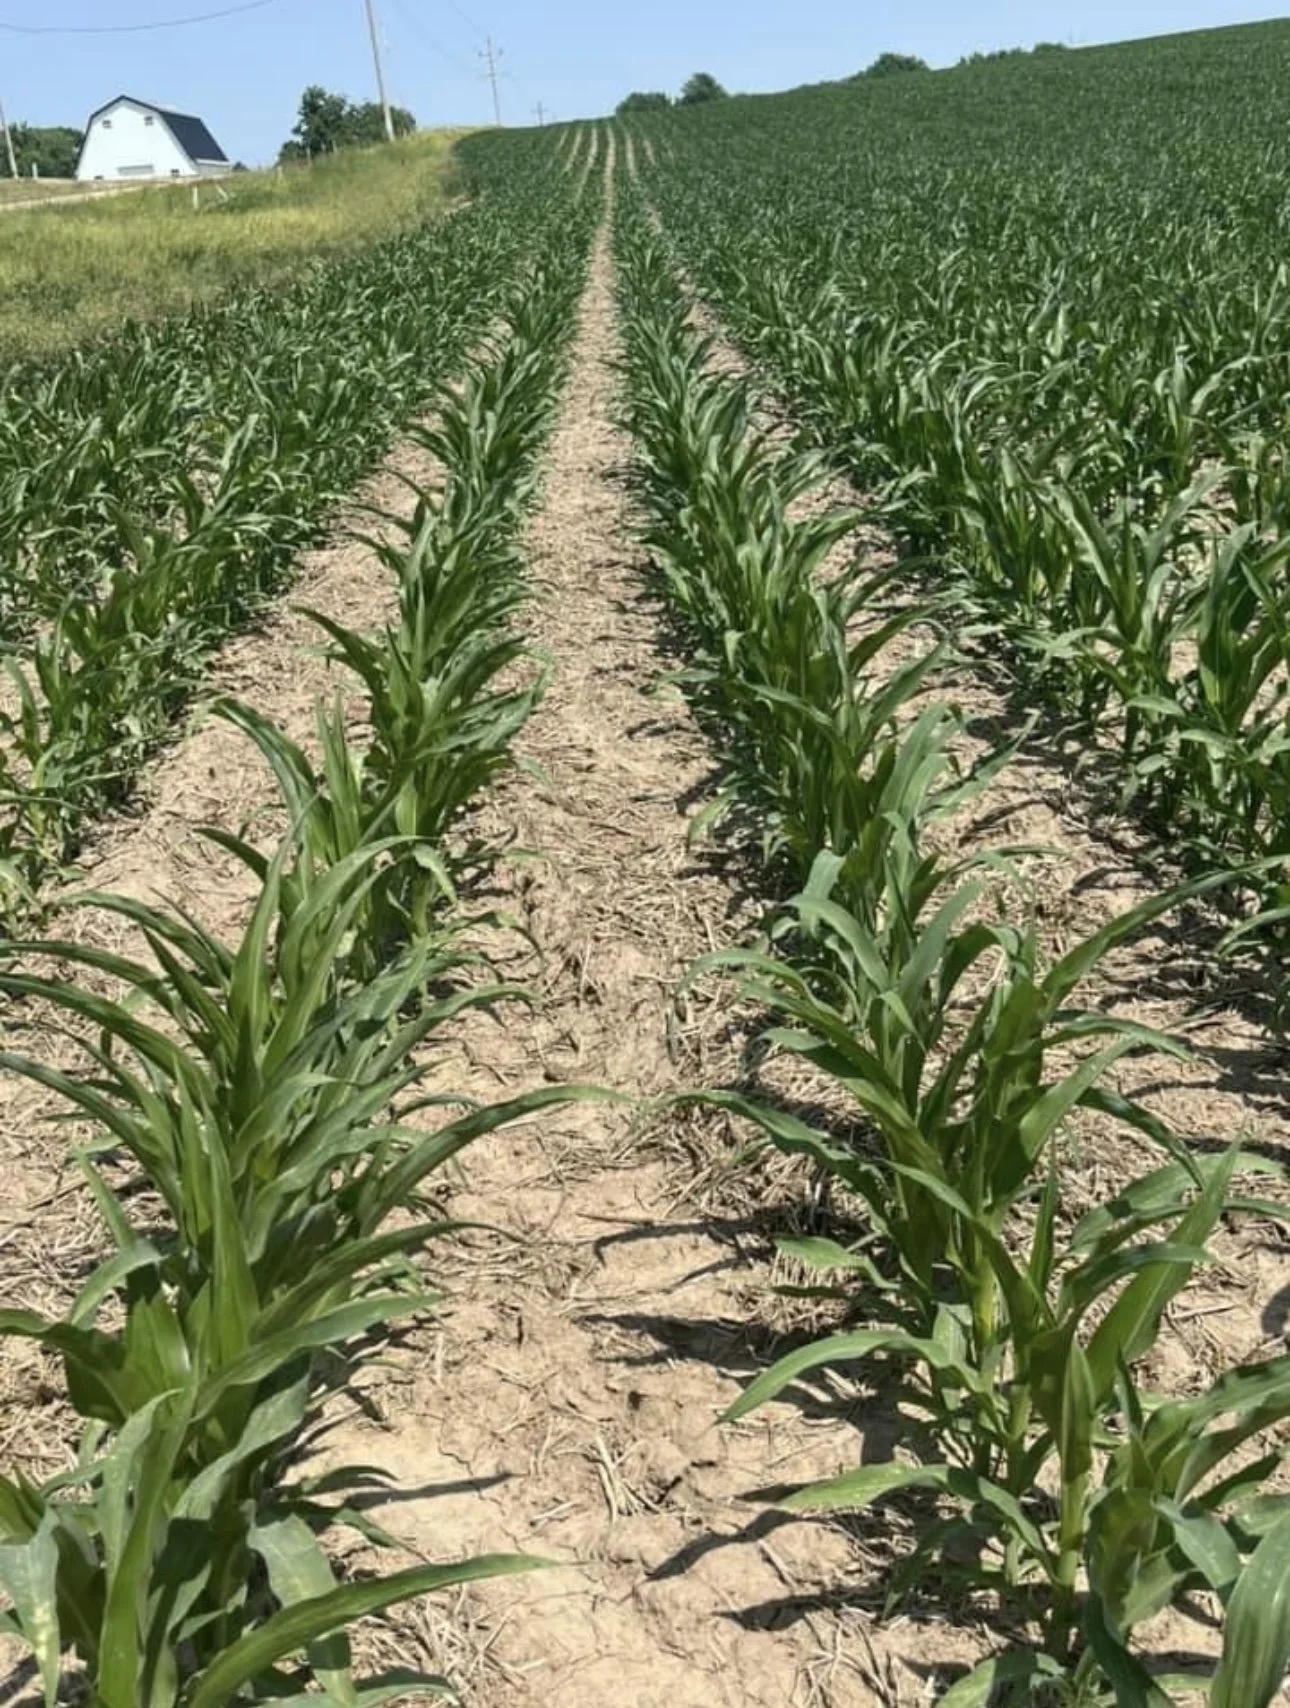
We are looking to add a section with crop update pictures from various areas.
Please feel free to text us pictures along with location to 605-295-3100


