POOR ACTION IN GRAINS POST FRIENDLY USDA
MARKET UPDATE
You can still scroll to read the usual update as well. As the written version is the exact same as the video.
Miss Our Sale?
Since you are on a trial here is extended access to our sale that ended last week.
Want to talk? (605)295-3100
Futures Prices Close
Overview
Grains down across the board following Friday's decently friendly USDA report.
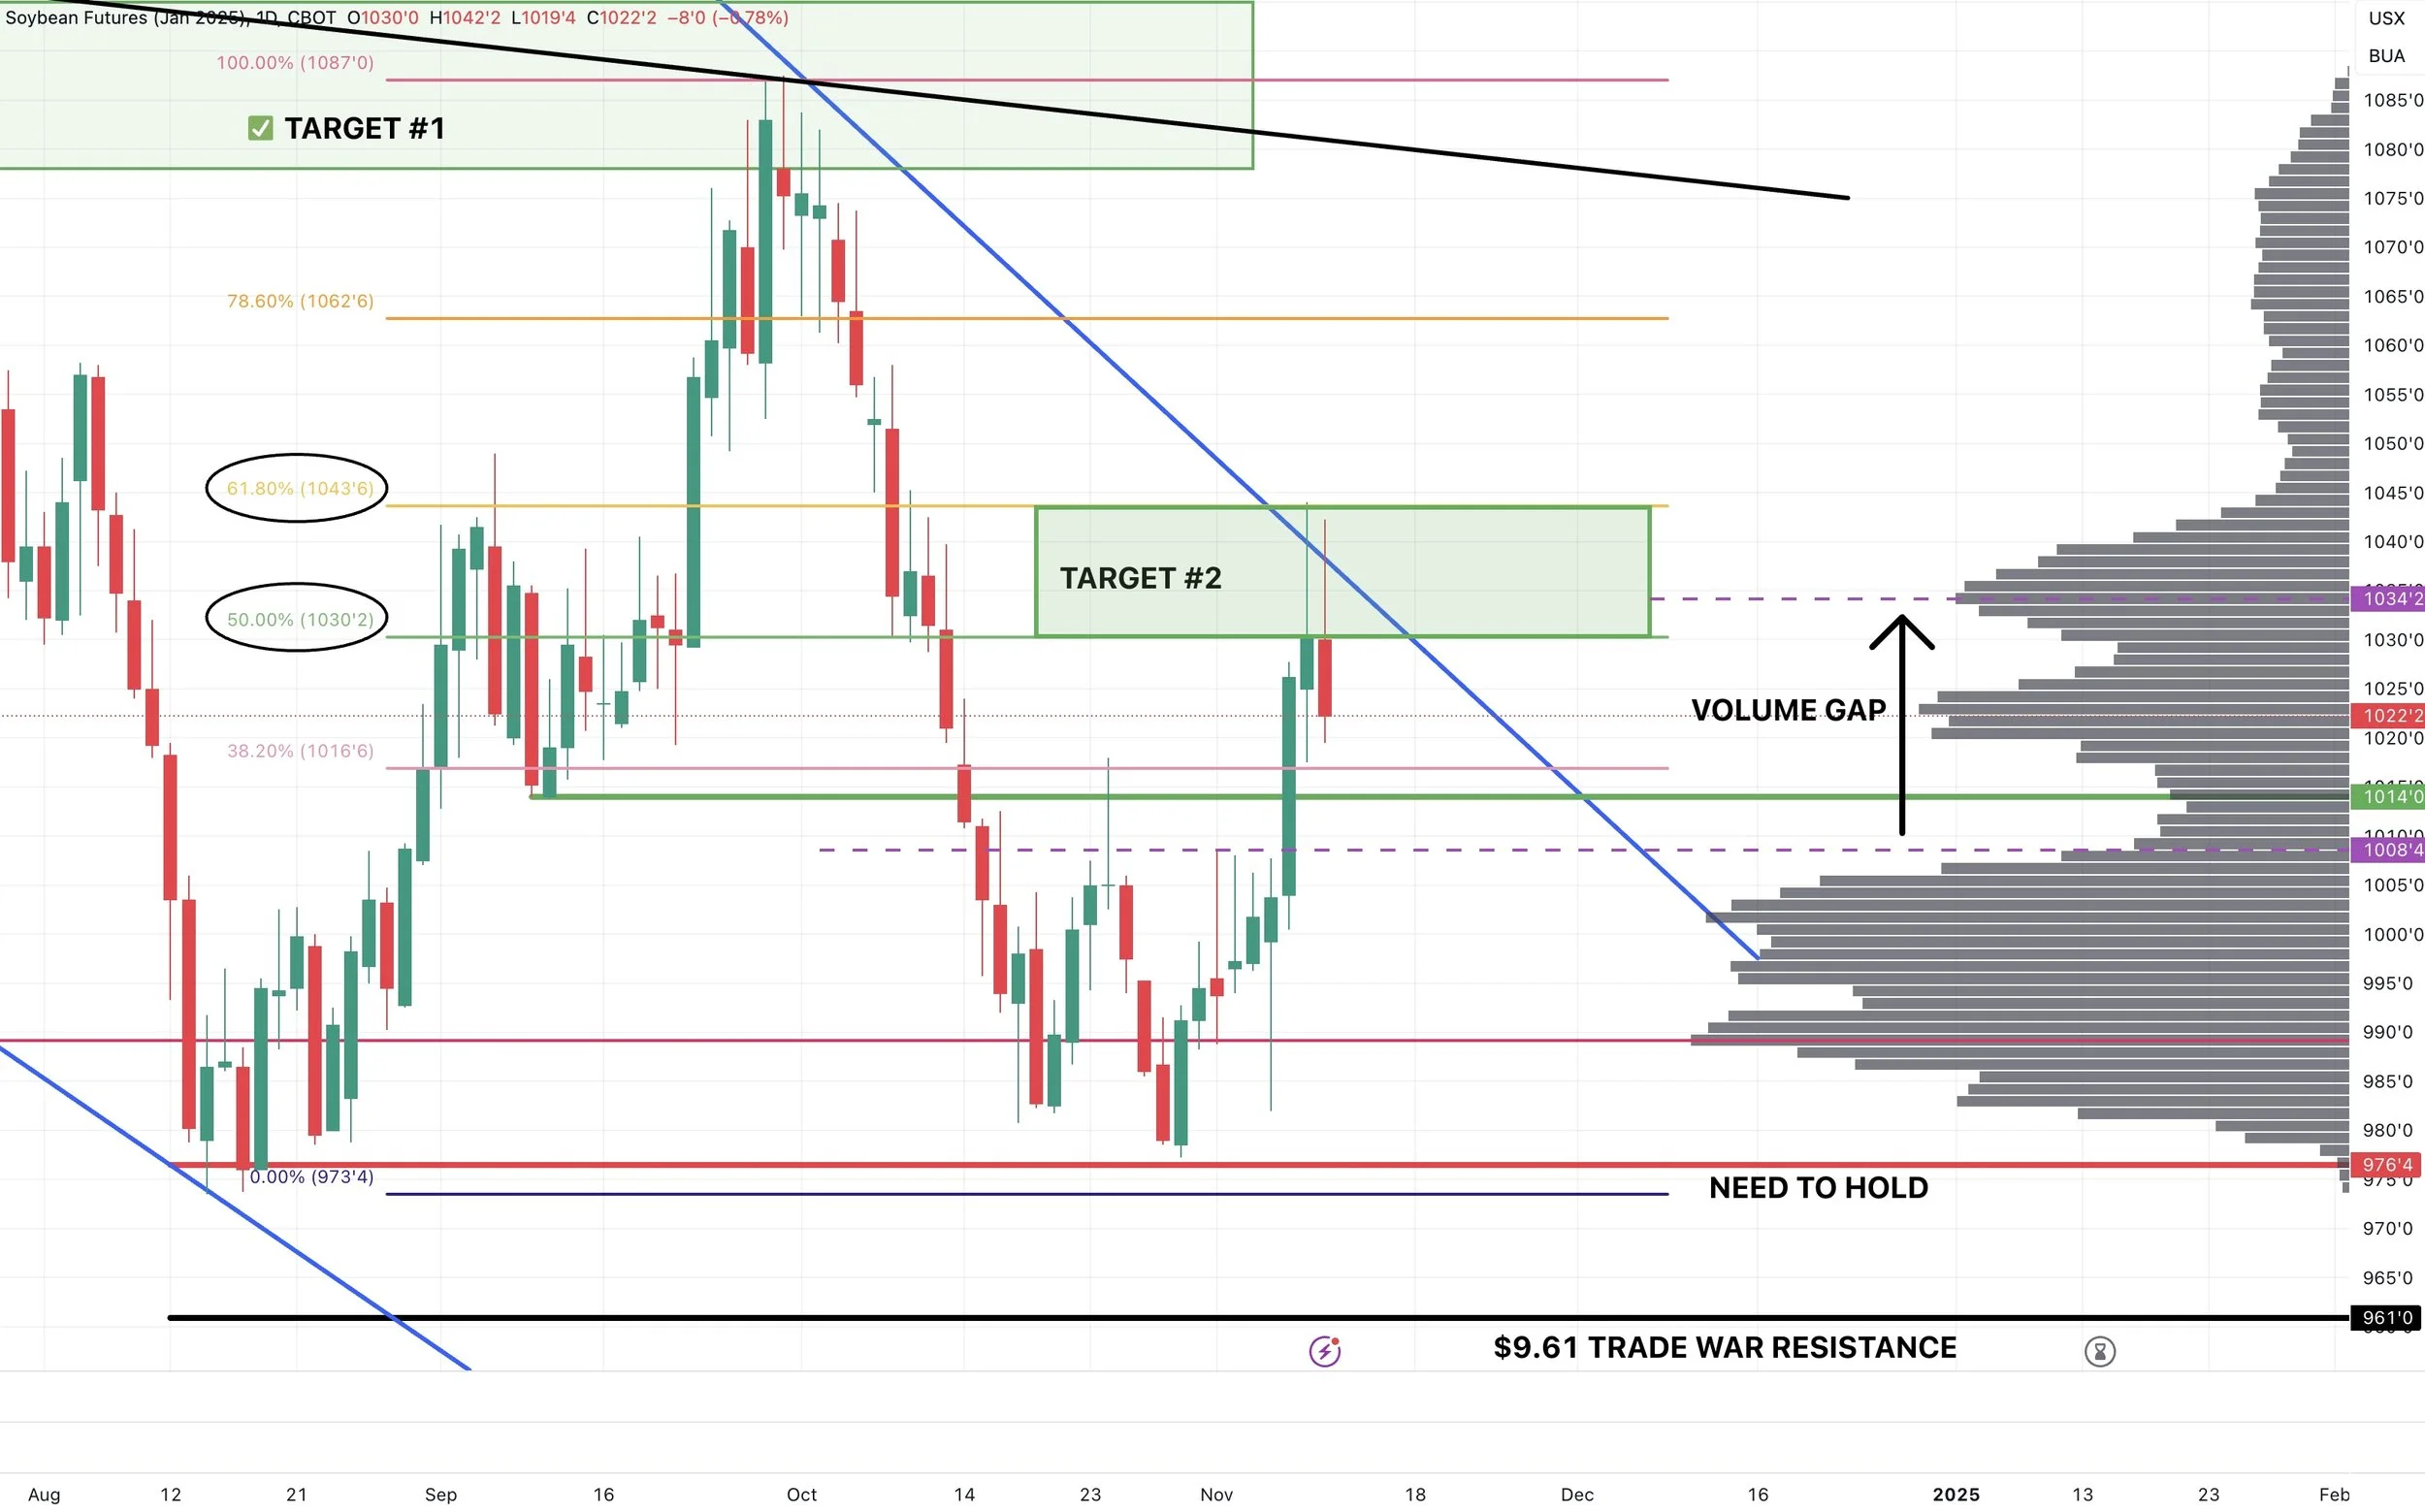
Awful price action today in soybeans, as they closed -20 cents off their early highs. Finding resistance once again in that $10.30 to $10.44 level I had been mentioning.
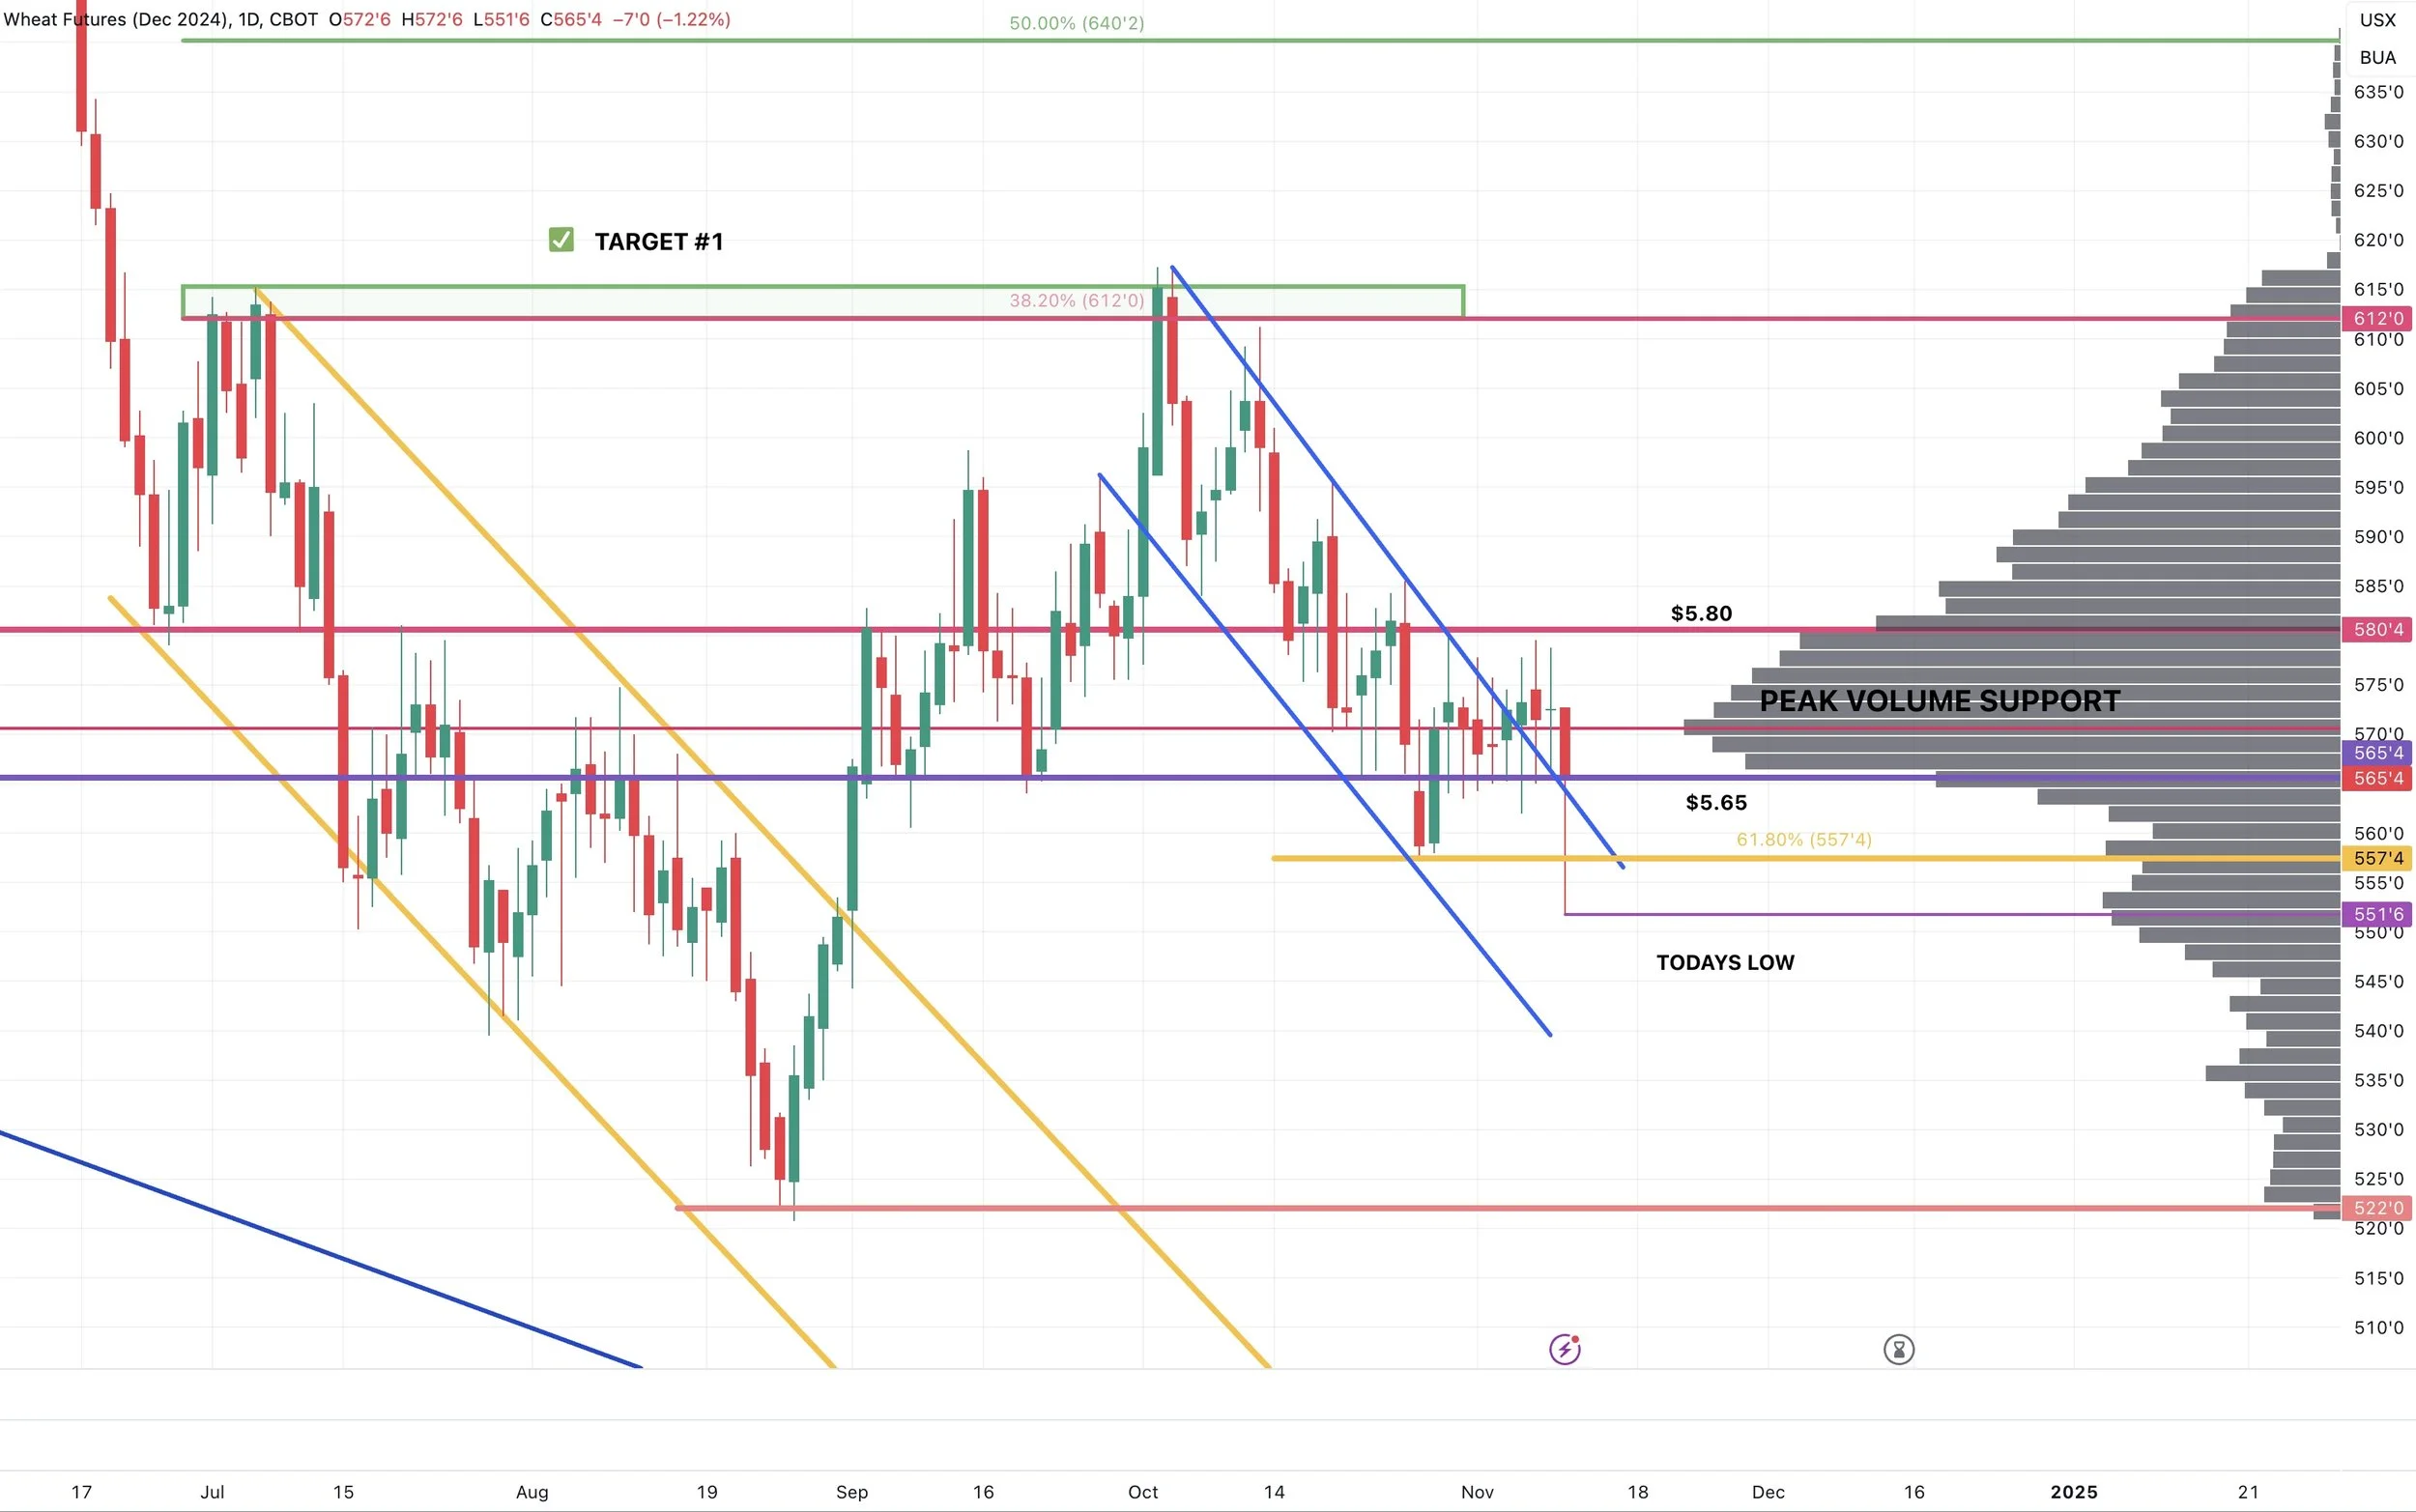
The wheat market was the biggest loser today. Hitting 2-month lows, but rallied +14 cents off their lows. So decent close in wheat.
Why did wheat get hit so hard today?
There is 3 main reasons.
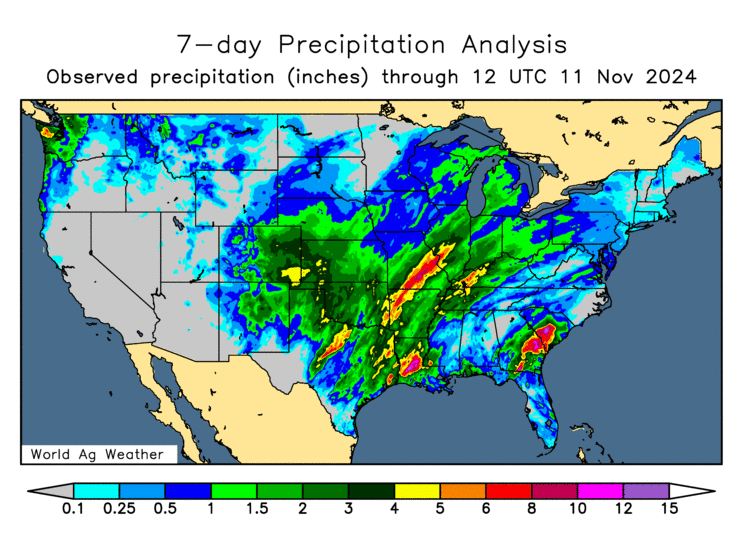
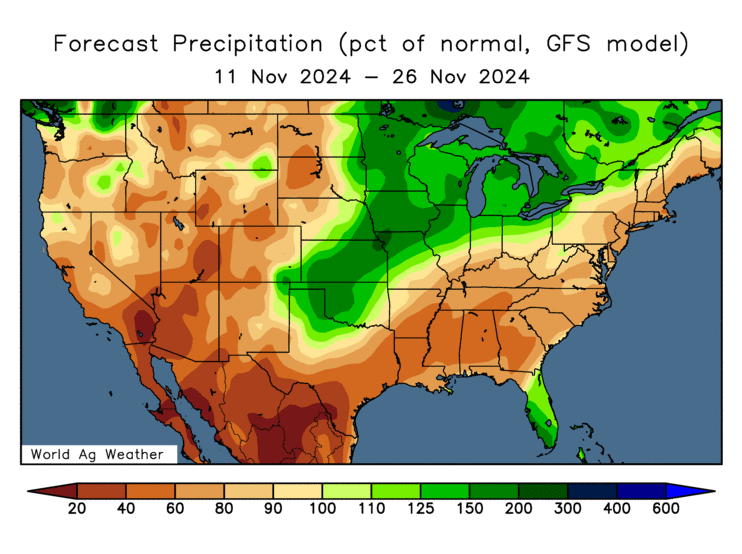
The first is rain in HRW regions. The plains have received good rain with more on the way. So a lot of those drought concerns are easing.
Past 7 Days Rain
Next 2 Weeks Rain
The 2nd reason is the massive rally in the US dollar.
As it continues to rally since Trump won the election.
Rallying to it's highest levels since June.
A rising dollar makes exports harder, as it makes us less competitive globally.
The 3rd reason is there is talk about Trump ending the war in Russia & Ukraine.
As Putin really respects Trump. Putin said he is very serious about Trump's plan to end the war.
But of course, the war headlines really aren’t much of a factor at all anymore. Long term ending the war is actually probably friendly for wheat.
How? Well we have sent a lot of money to help Ukraine with their agricultural issues. If we are no longer funding Ukraine then that leaves the potential for them to not be as competitive in the global market. War headlines rarely affect the market anymore anyways.
As for the USDA report. Here is how I would classify it:
Corn: Neutral to slightly friendly
Beans: Friendly
Wheat: Neutral
Here is the numbers:
First corn.
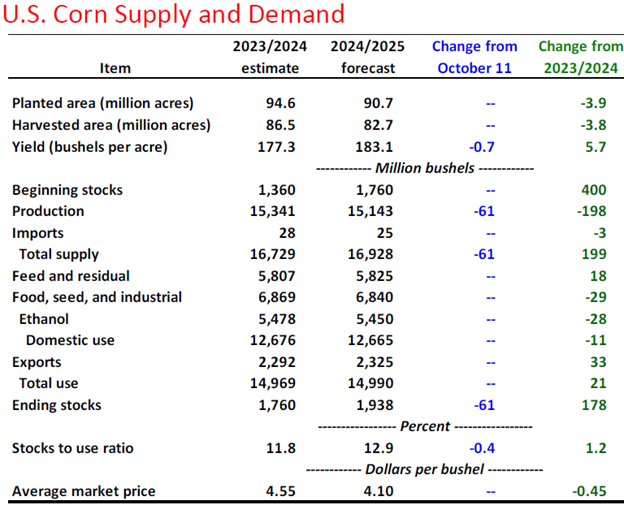
They surprisingly dropped yield from 183.8 to 183.1
This dropped carryout from 1.999 to 1.938
Even though both exports & ethanol are running well ahead of pace, the USDA did not make any changes to the demand side of the balance sheet.
This was slightly disappointing, but this makes you wonder if it's going to show up in future reports. As them leaving demand unchanged does open the door for future bullish arguments to be made on the demand numbers.
Soybeans saw the biggest surprise.
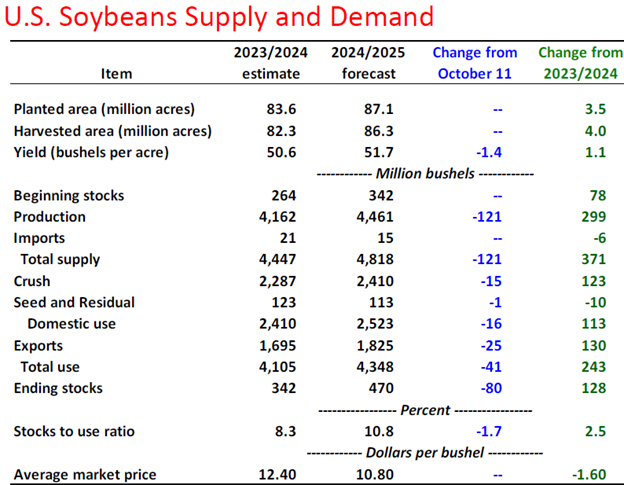
As yield fell from 53.1 to 51.7, which was below even the low end of the trade range estimates. (Trade Range: 52.1-53.8)
This was the largest Nov-Dec drop in yield in at least the past 30 years.
This led to carryout dropping from 550 to 470 million, nearly a 20% drop.
The drop in production was somewhat offset by cuts to demand. As the USDA dropped crush by 15 million and exports by 25 million.
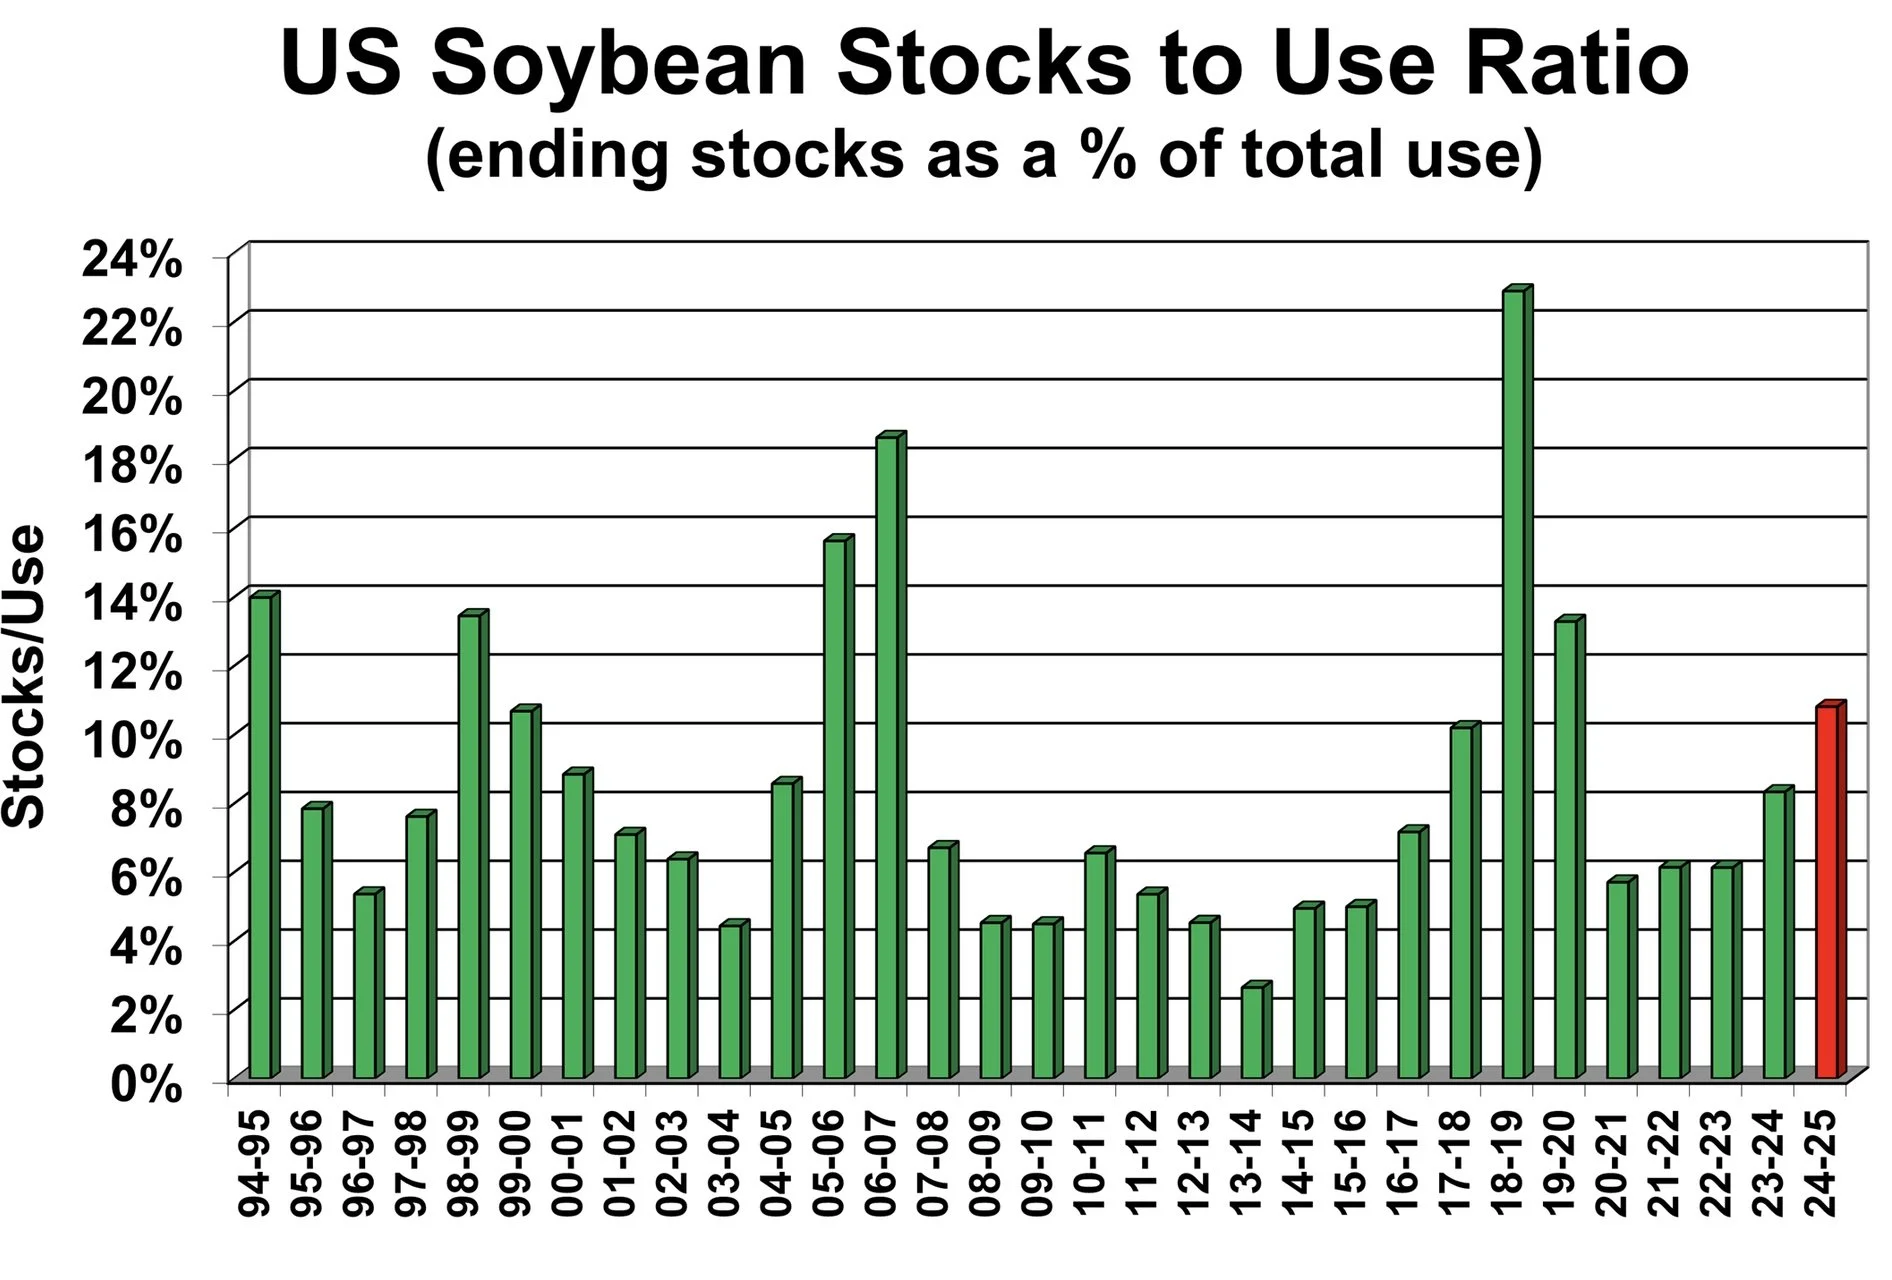
Despite this, a 470 million carryout is not bullish by anymeans.
Here is the US stocks to use ratio.
It is not as high as it was during the trade war, but it is still on the large side.
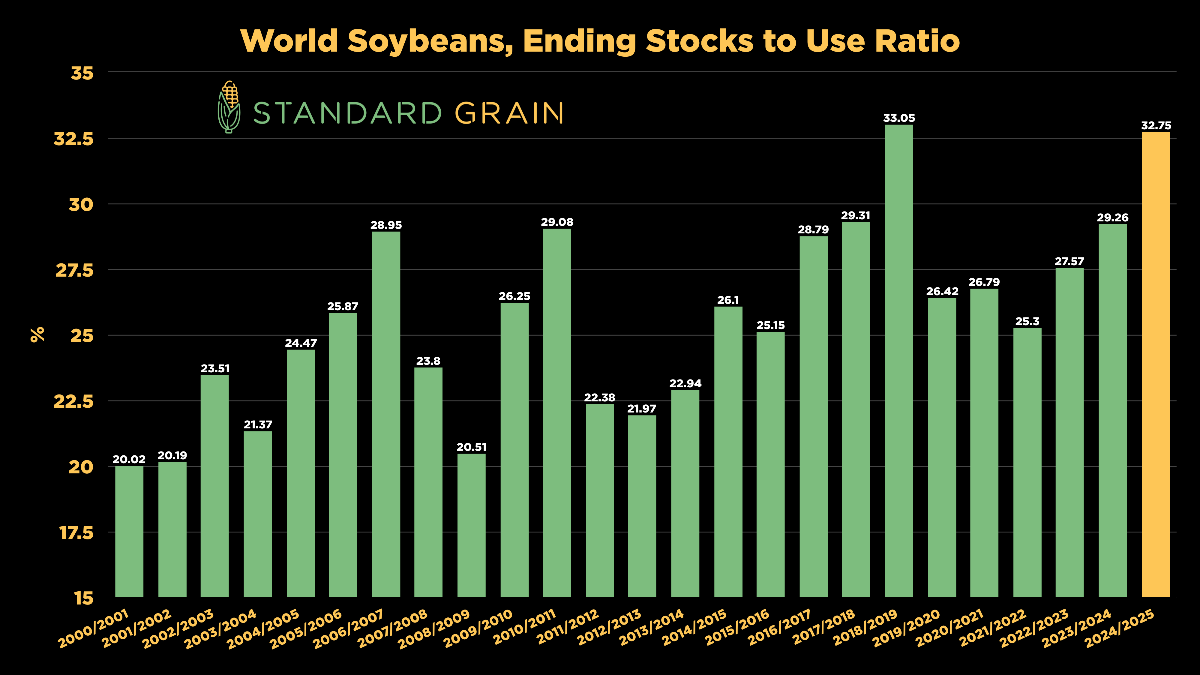
The biggest concern in soybeans is not the US balance sheet.
It is the global balance sheet.
Unlike corn, the US exports somewhere in the realm of 40% of it's soybeans.
Brazil is also the largest player in the bean market vs the US being king of corn.
We still have one of the most bearish global outlooks ever. As even with the decrease to US yield, it just didn’t make a major dent globally.
This is the outlook IF Brazil raises what the USDA thinks they will.
These numbers are not bullish. At all.
Chart from Standard Grain
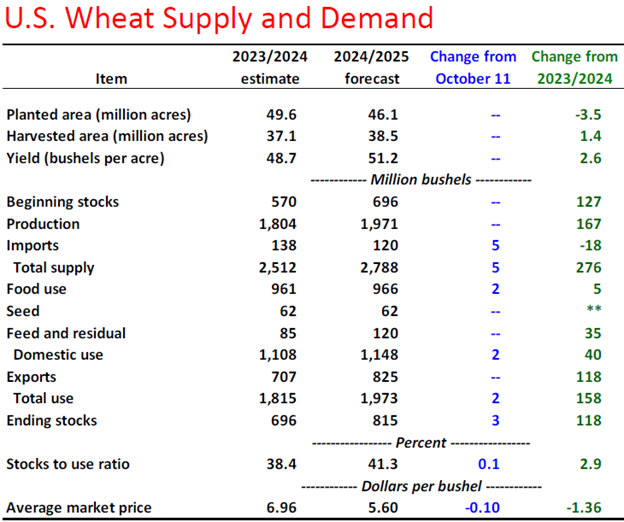
For wheat, the report was underwhelming.
We did not see any major changes. A non-event.
Today's Main Takeaways
Corn
Not much new on corn today.
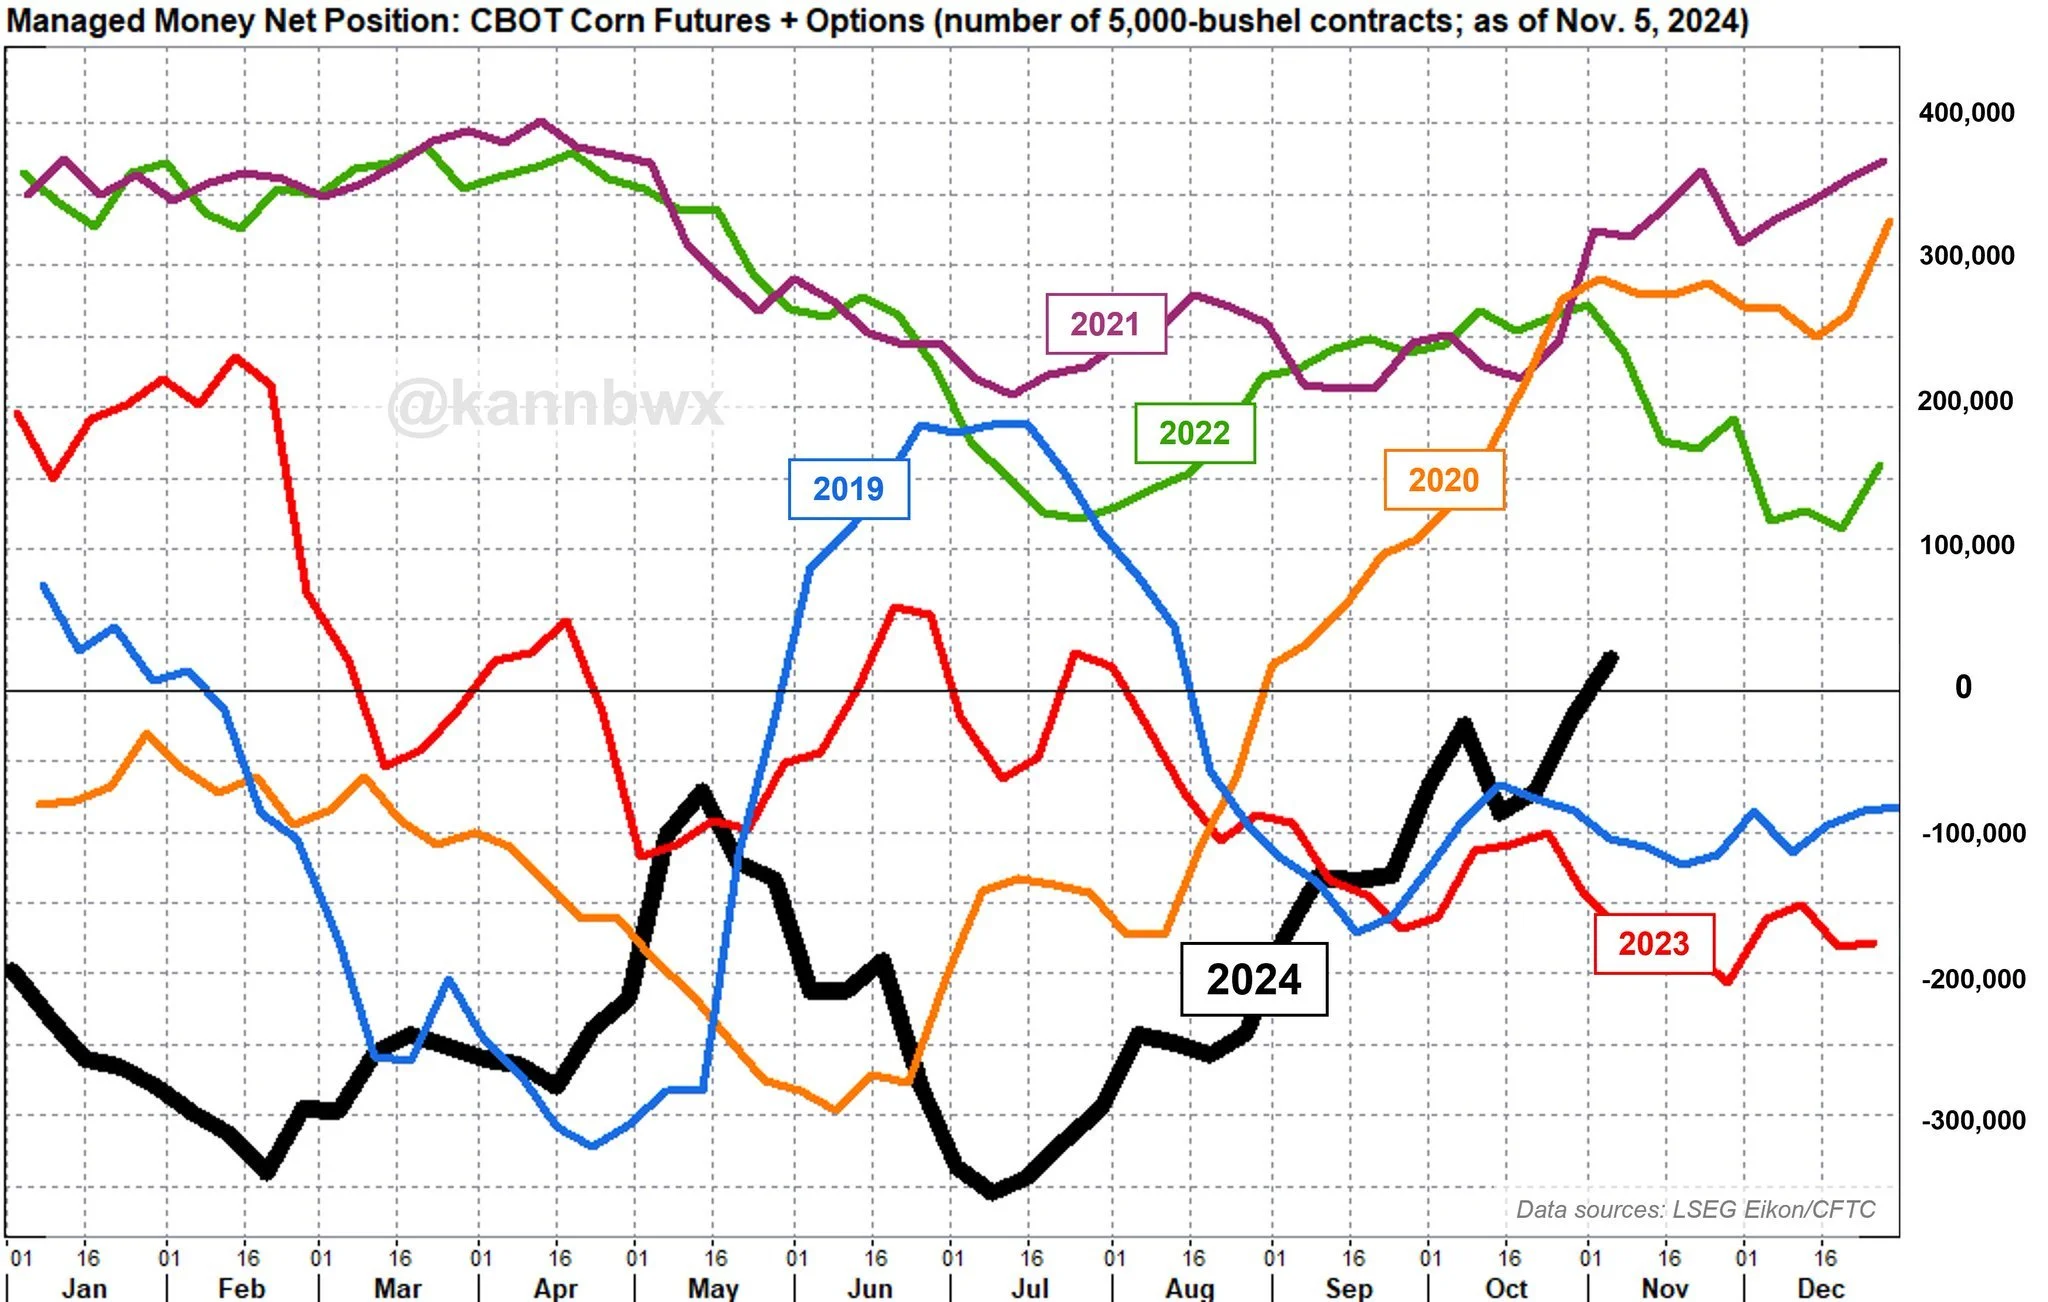
The funds are NET LONG corn for the first time since August 2023.
In July they were short over -350k contracts. A record.
This means we no longer has the possibility to get any sort of "short covering" event.
But it does mean that the funds are no longer betting we are going lower.
Chart from Karen Braun
Long term I still think demand leads us higher.
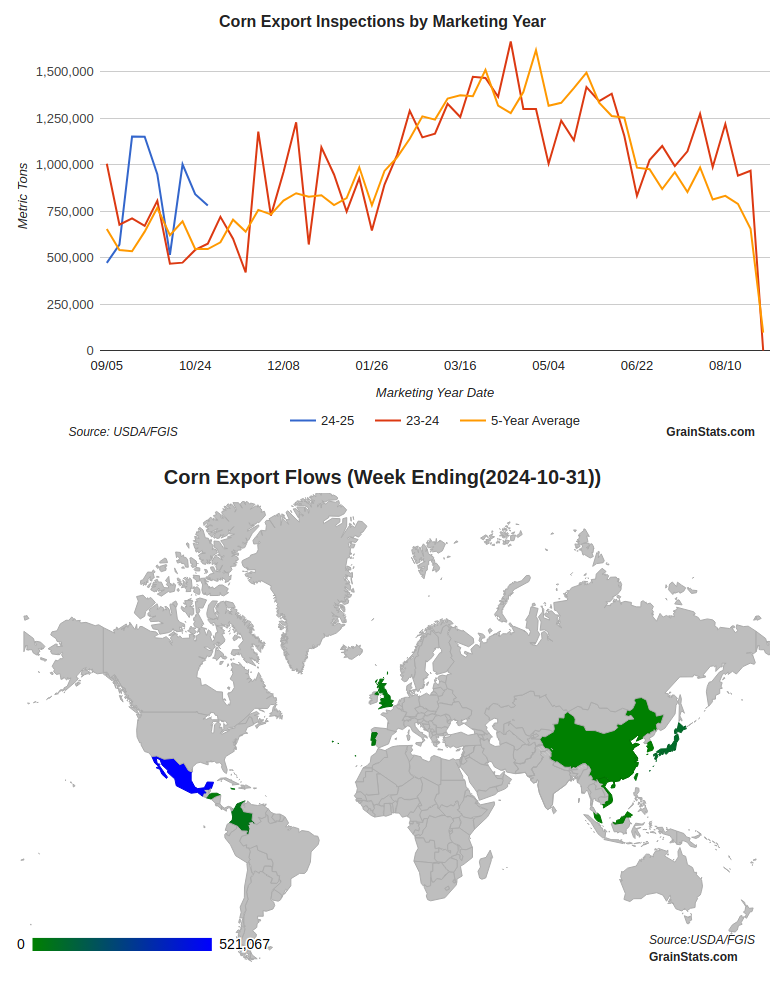
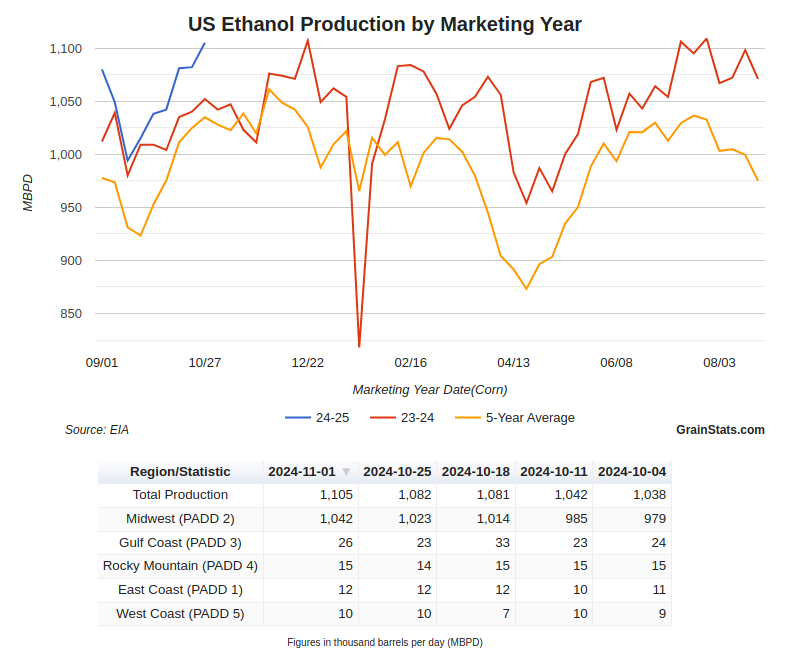
Both exports & ethanol are running ahead of USDA forecasts. Both of these could very well eat into that carryout.
Below is a visual from GrainStats of where both of these stand.
These numbers will be updated as there was no USDA data out today with the holiday.
Yield is +6 bpa higher than last year, yet if our carryout drops 100 million more it'll be lower than last year. That is due to demand.
I think both exports and ethanol could be bumped higher down the road.
For exports however, there is some people claiming that Mexico was simply front loading their purchases before Trump gets in office. It's possible. But regardless, low prices create demand. Which we have seen.
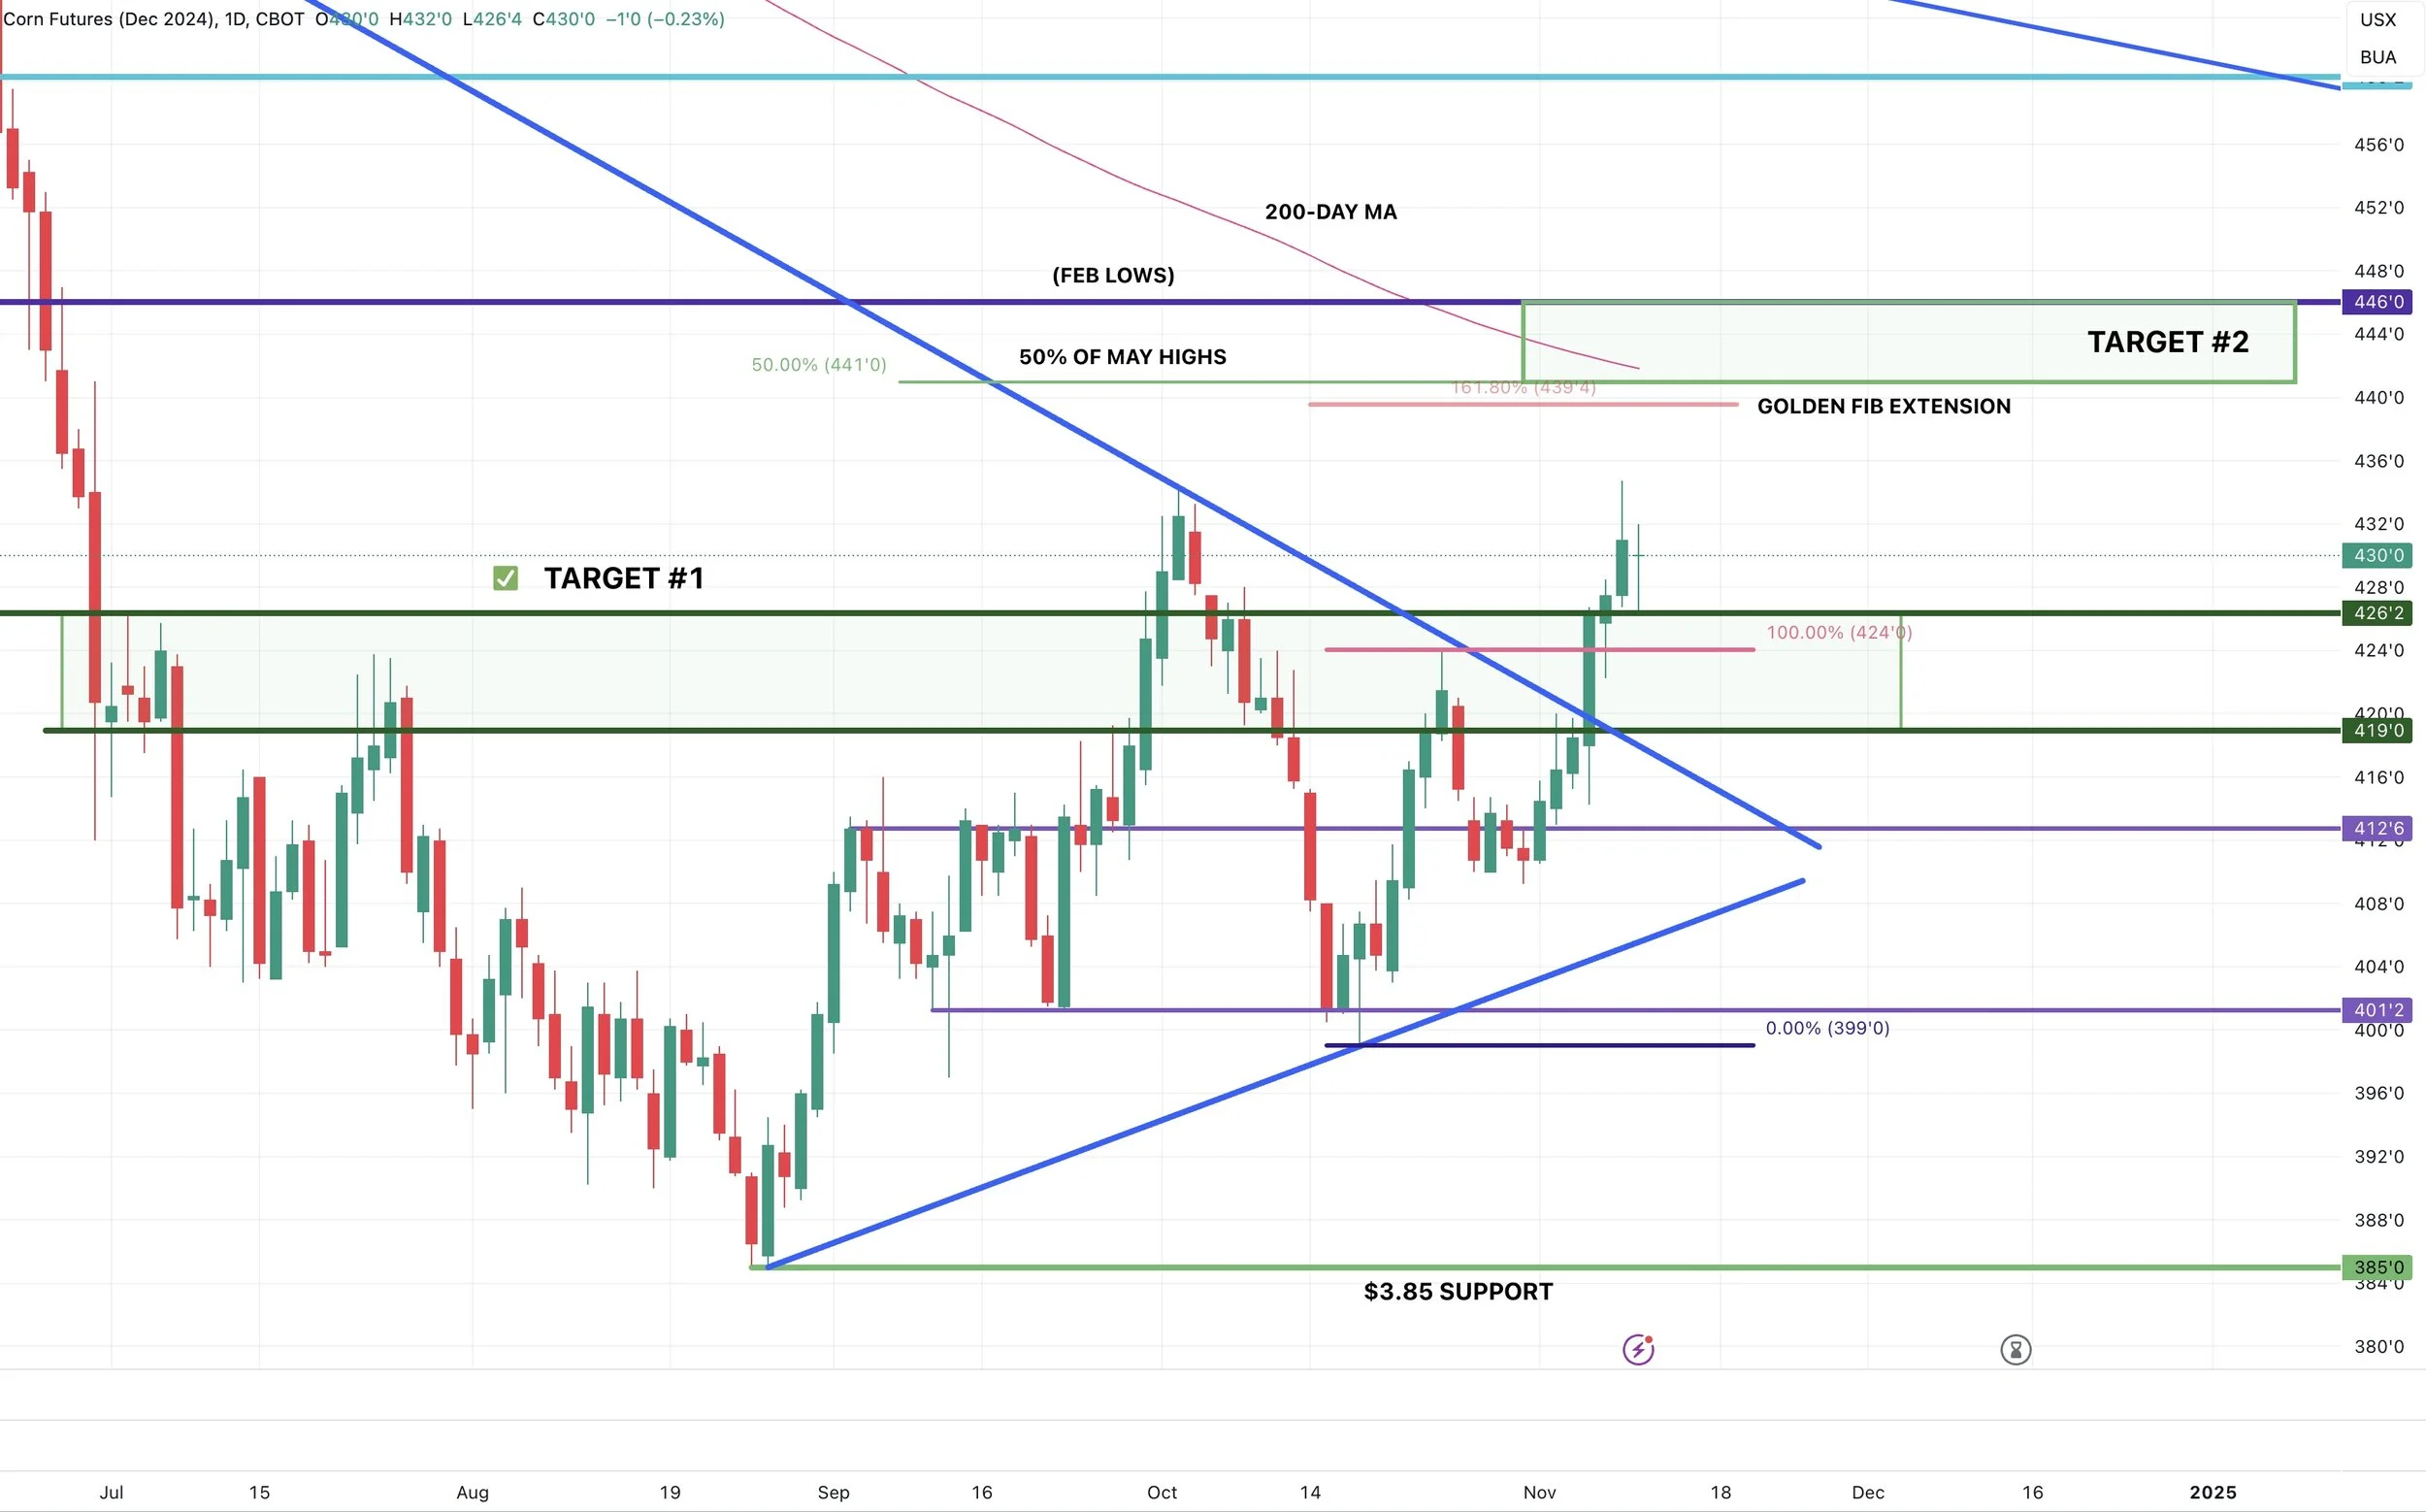
Looking at the chart, my first target to re-hedge or make sales if needed is still $4.39 to $4.46
$4.39 is our golden fib extension.
$4.41 is our 50% retracement to those May highs.
$4.46 is our Feb lows.
Have targets in if you’re someone who will be wanting to take a little risk off.
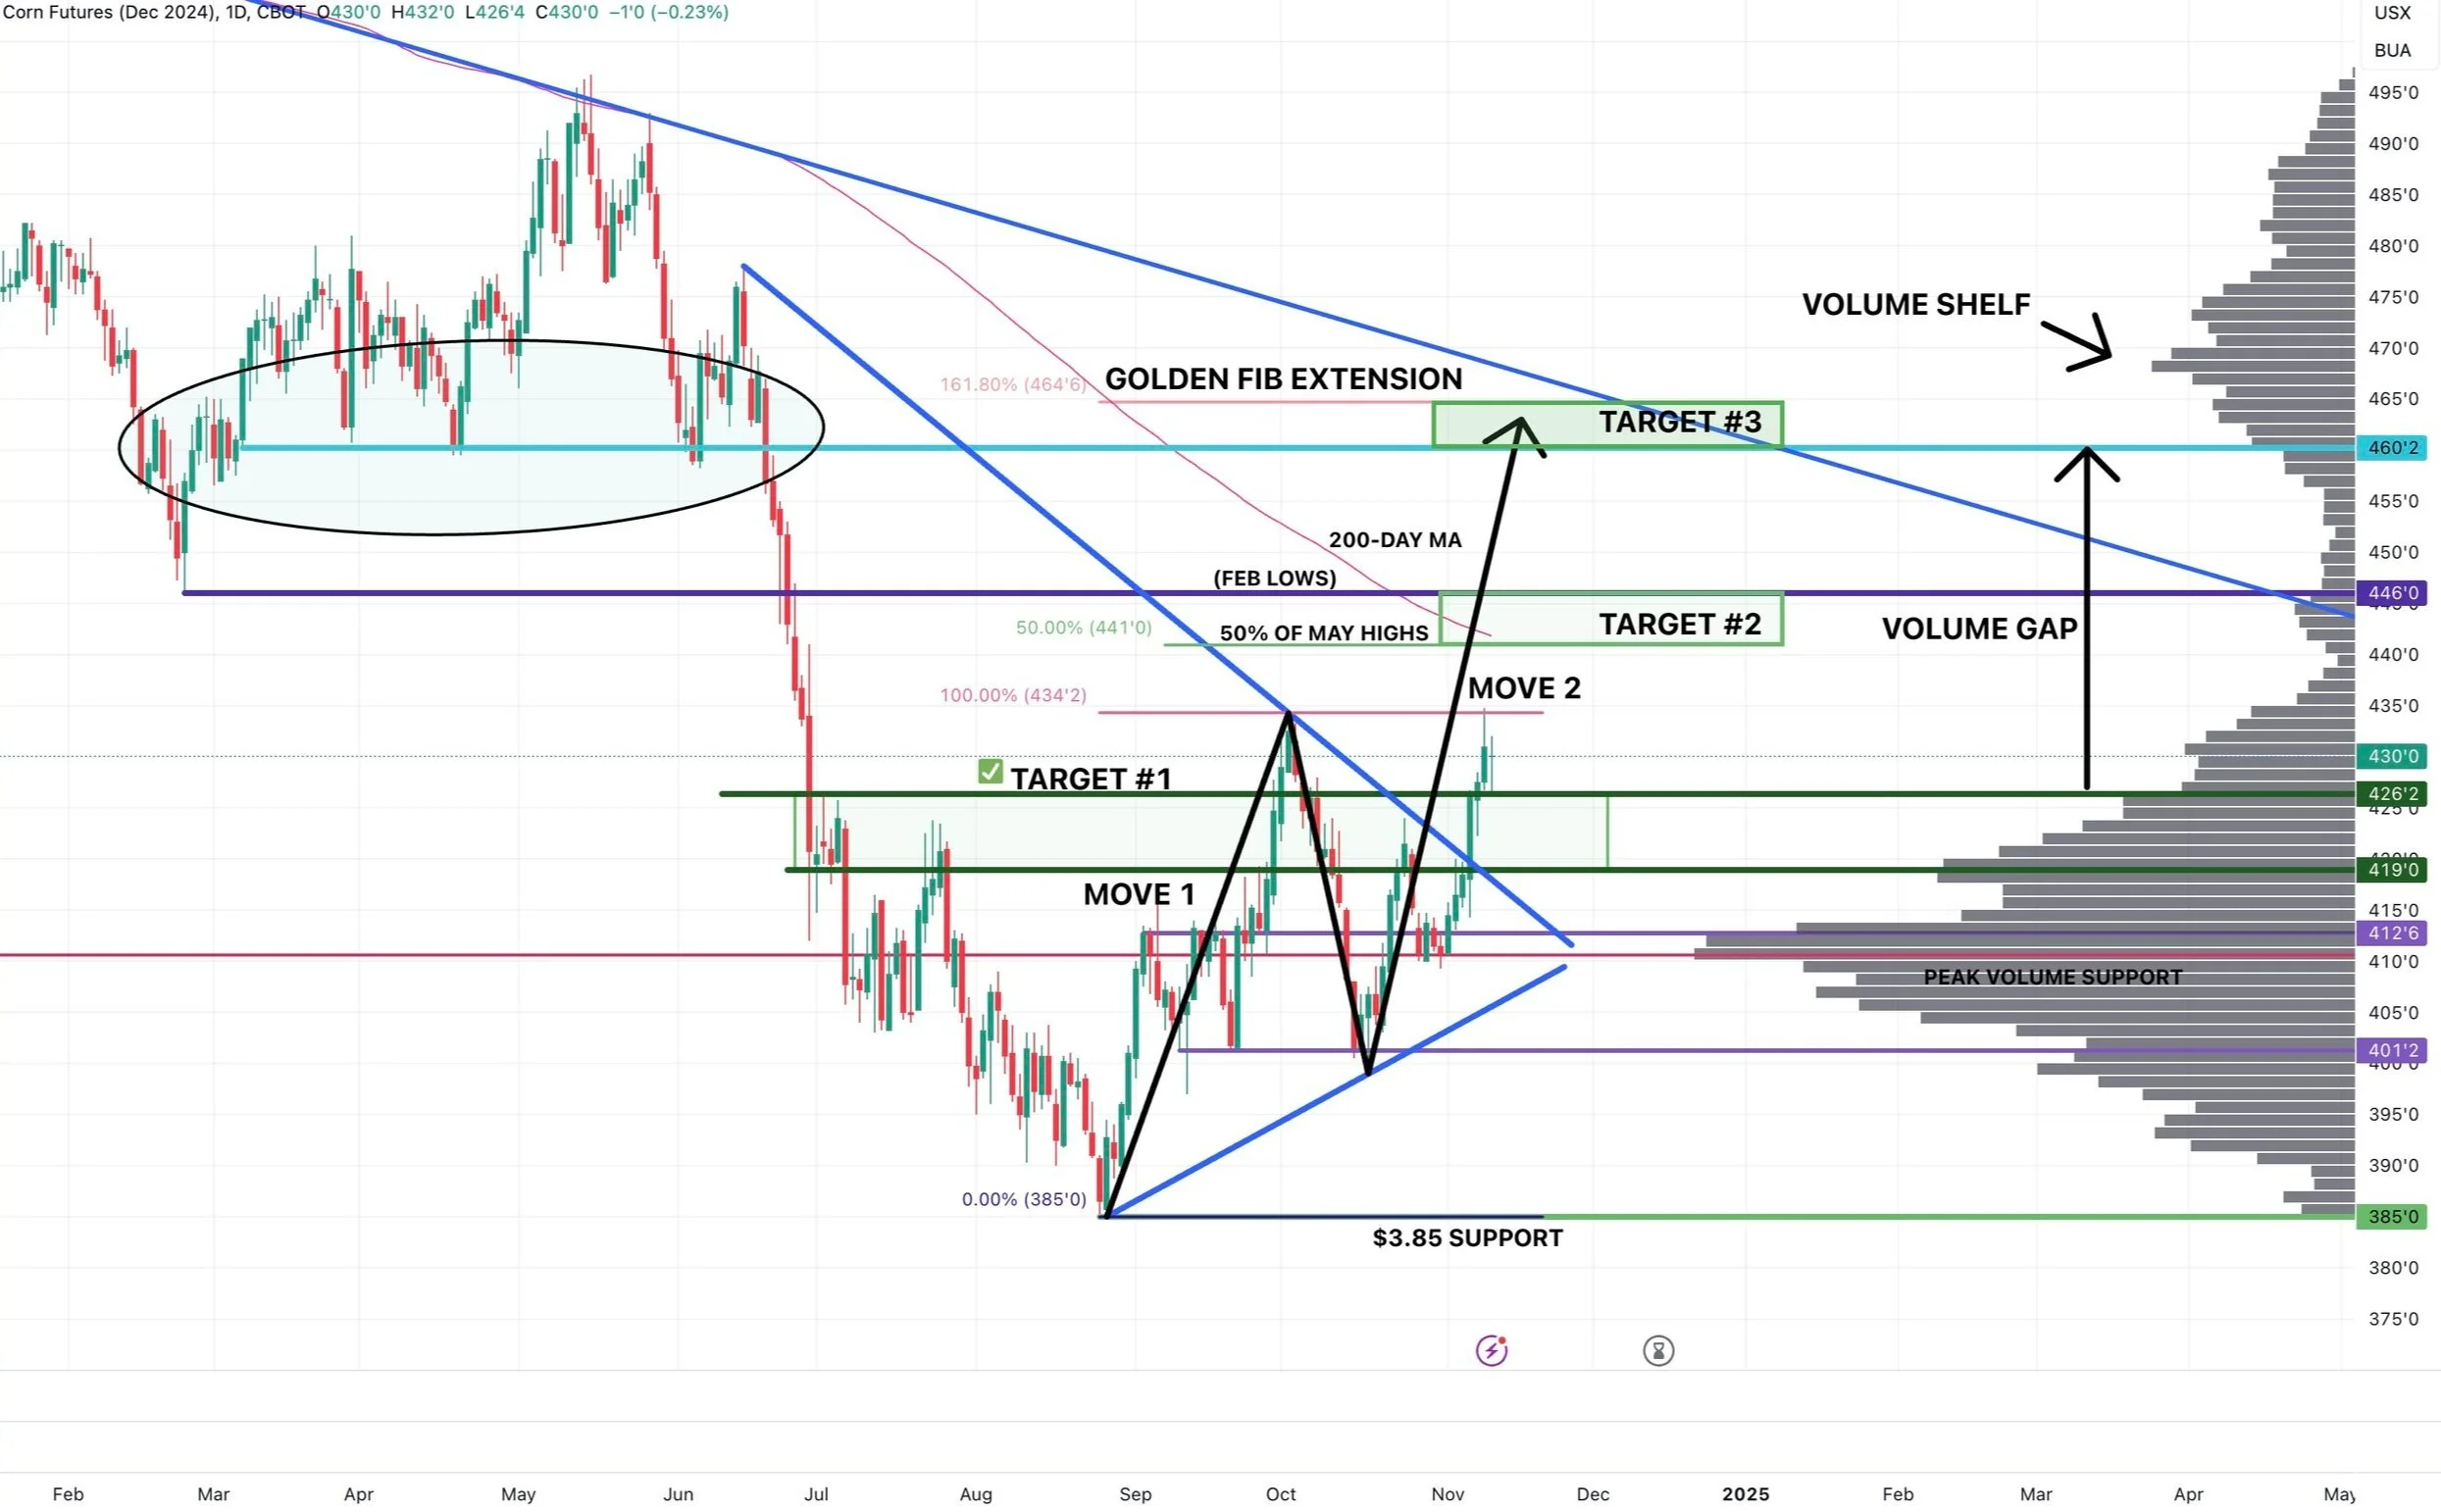
My 2nd longer term target is $4.60 to $4.65
$4.65 is the golden fib extension of that entire September rally from $3.85 to $4.34
We also found support at $4.60 several times earlier this year. (Support turned resistance).
There is also a large volume gap to $4.60
Soybeans
Soybeans simply failed on the charts today.
We rejected off those golden retracement zones today & Friday. ($10.30 to $10.44)
This is one reason why having targets out there can be important sometimes for those that need to take risk off the table.
We rejected twice right off my targets I had out there, but the moves were fast and prices did not last up there.
Fundamentally, there are still a ton of unknowns.
Yes we got a bullish surprise from the USDA, but the market still seems more concerned about the potential for a very bearish outlook globally.
Despite the cut to yield, a 470 million bushel carryout isn’t exactly bullish either.
As at the end of the day, the global balance sheet dominates the bean market unlike corn.
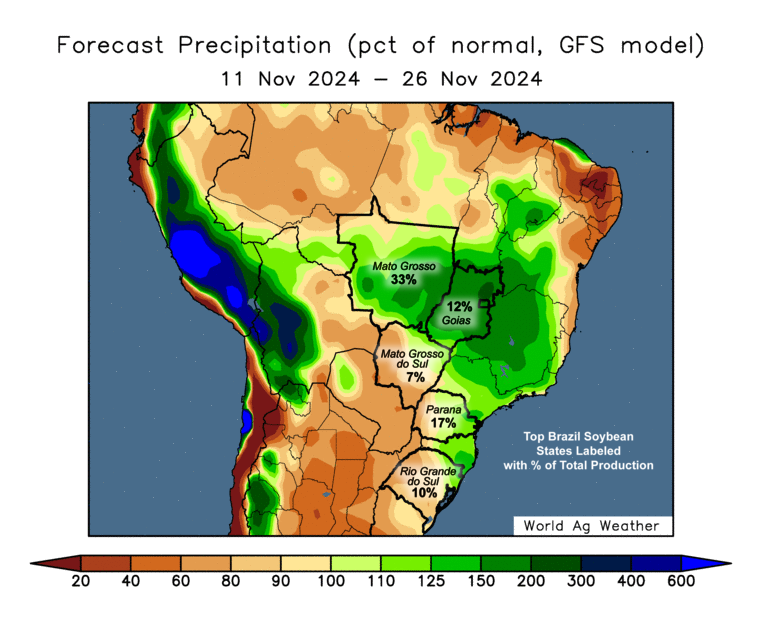
Right now the forecasts for Brazil still indicate zero issues.
IF Brazil winds up producing what the USDA thinks, there is still a TON of downside risk in the bean market.
Next 2 Weeks Rain
The US is really the only supplier of soybeans until Brazil's product becomes available in late Janurary.
So another big wild card is does China buy beans now before Trump gets in office, or do they use their reserves until Brazil's beans are available?
Bottom line, the risk remains lower in beans.
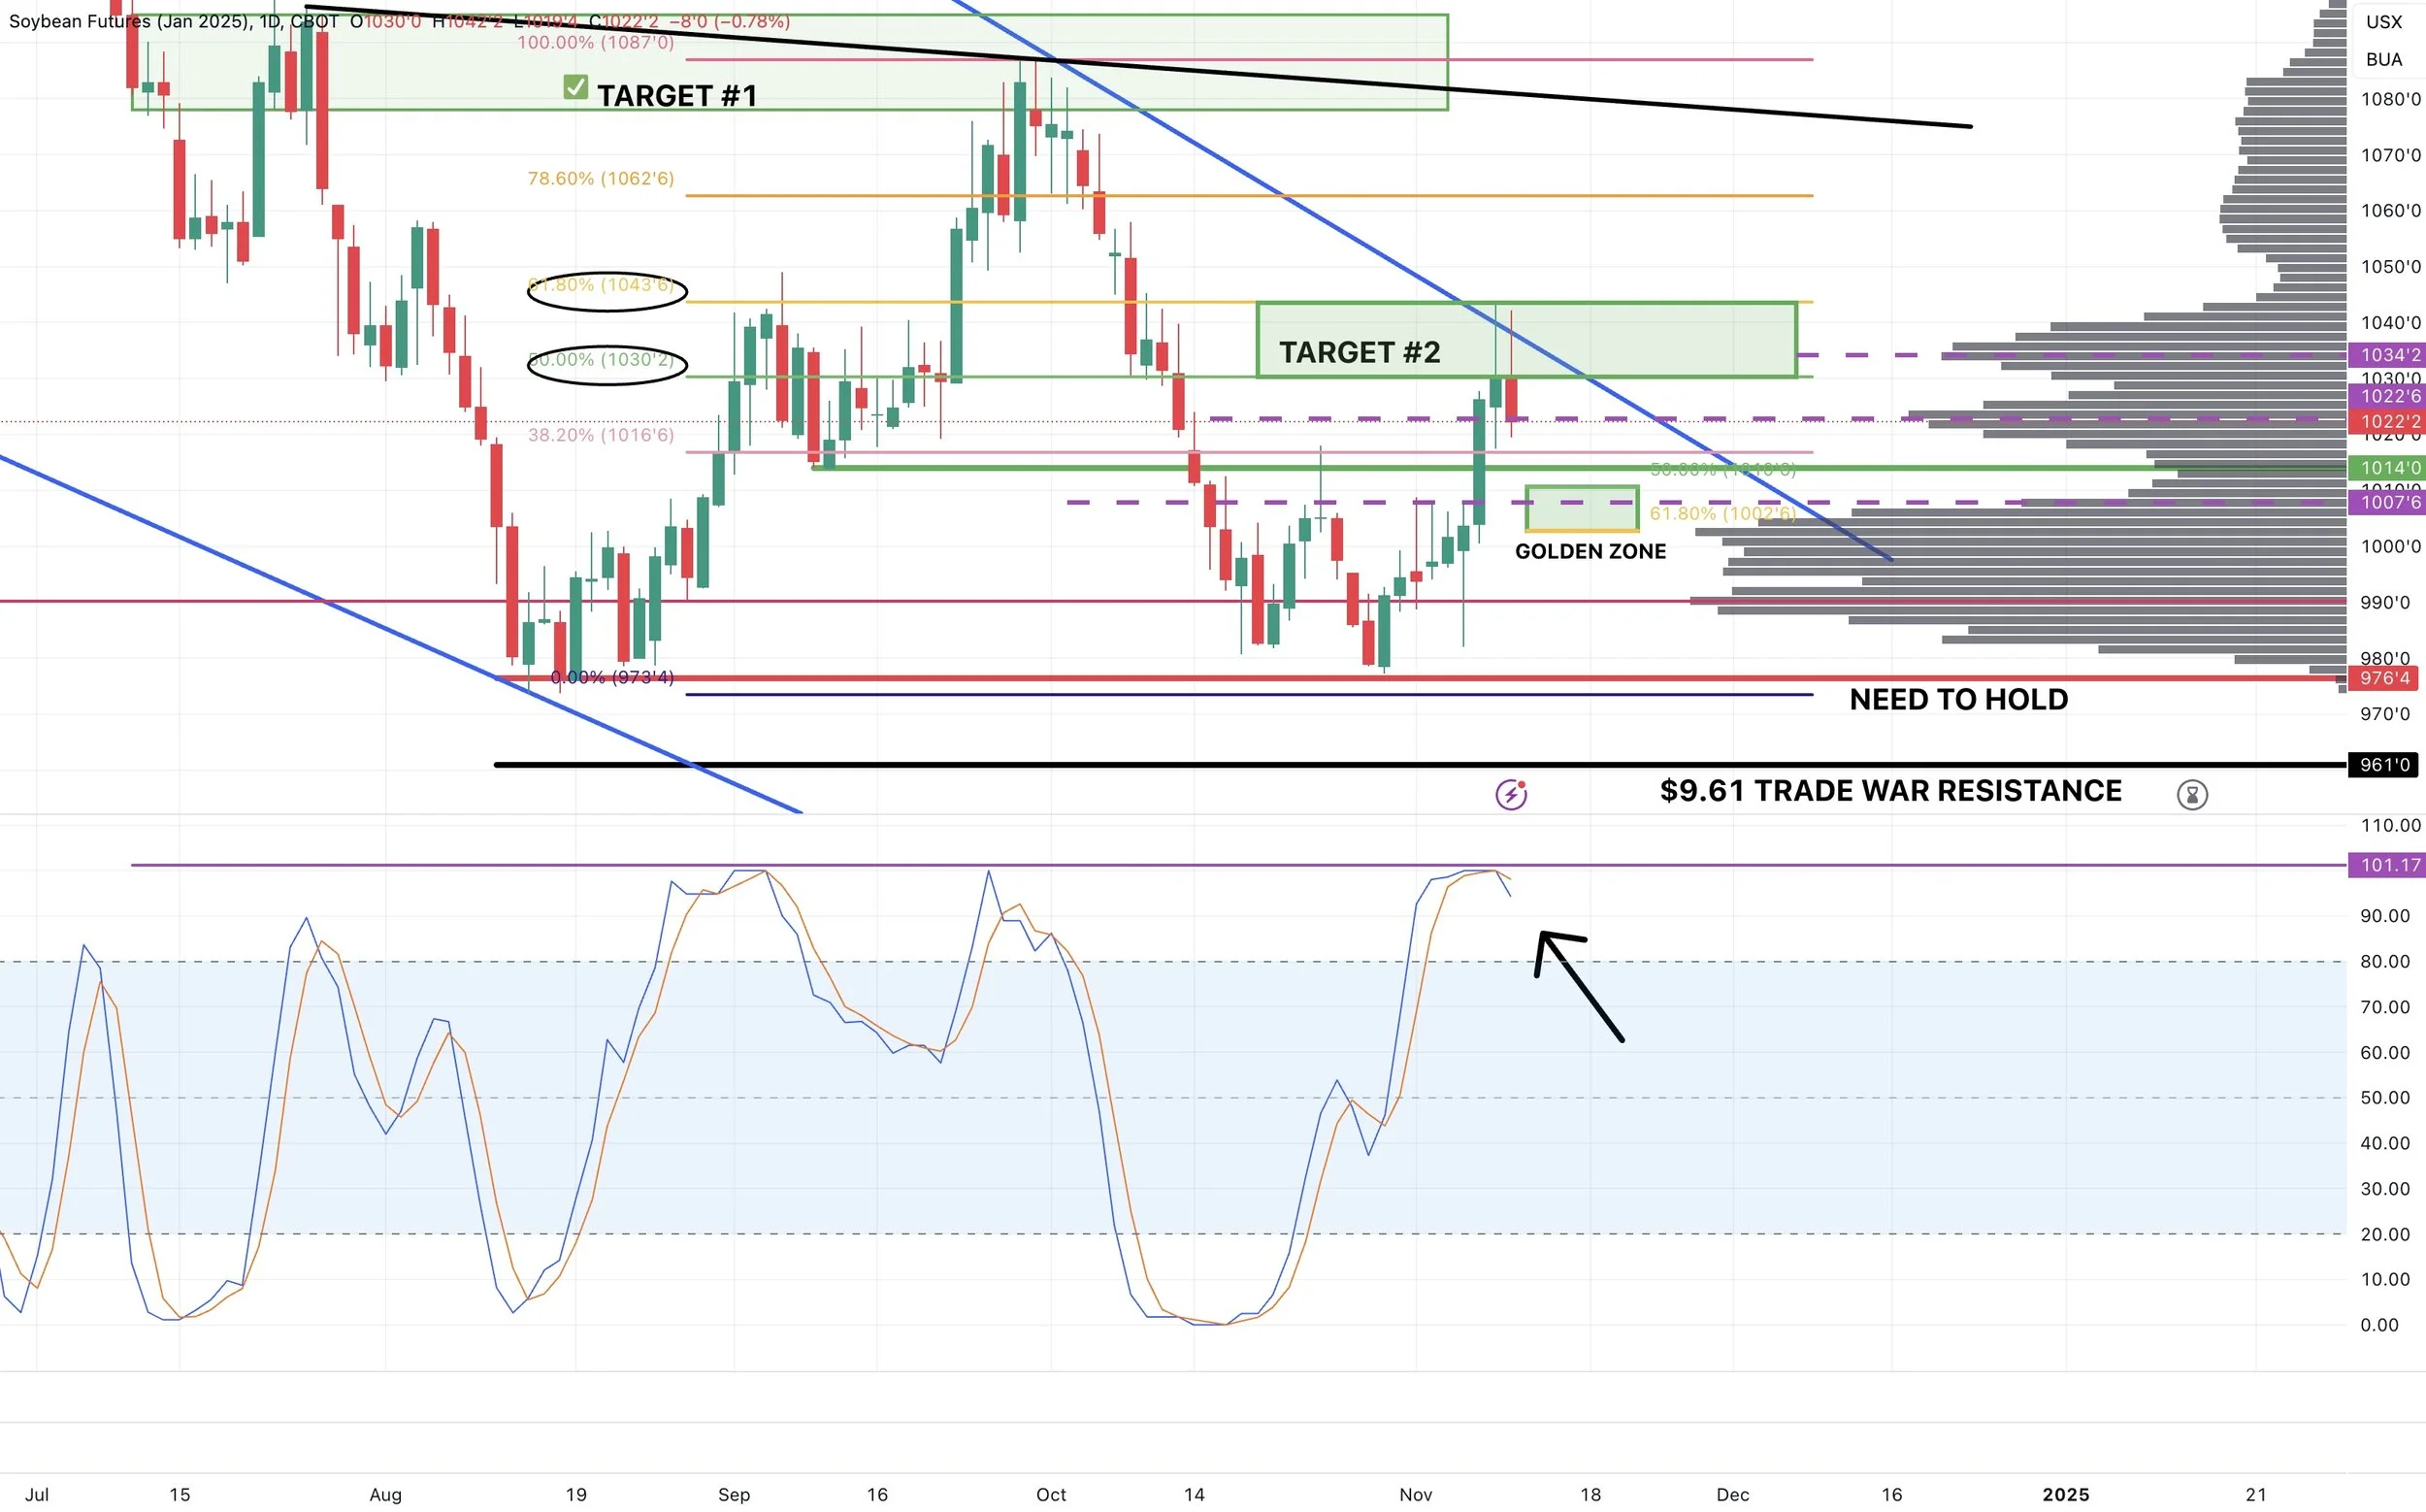
It looks like the stochastics are starting to turn lower.
Now yes we could just turn right back around, but often times the stochastic does come all the way to the bottom which can signal it is time for a cool off in prices.
If you look at the volume shelves on the right, we have 3 of them. (purple dotted lines)
1) $10.30 to $10.40
2) $10.19 to $10.26
3) $9.86 to $10.08
So if we fail to hold this 2nd shelf, I would not be surprised to see us come back into that heavy volume area between $10.00 to $10.10 as there is essentially a pocket of air in between shelf 2 and 3.
Our golden pocket retracement zone is also $10.02 to $10.11 (50% to 61.8% retracements).
A break above that blue downward trendline would be a big win for the bulls to suggest maybe we are going higher.
Wheat
Wild day for wheat.
We had quiet a few reasons for wheat to trade lower as I mentioned.
Rain in HRW, a rally in the US dollar, and war peace talks.
Yet we bounced well off the lows. At one point we where down over -20 cents but close down just -7 cents. So not "horrible" price action.
Fundamentally, looking longer term towards next year there are still plenty of reasons to believe wheat has upside here.
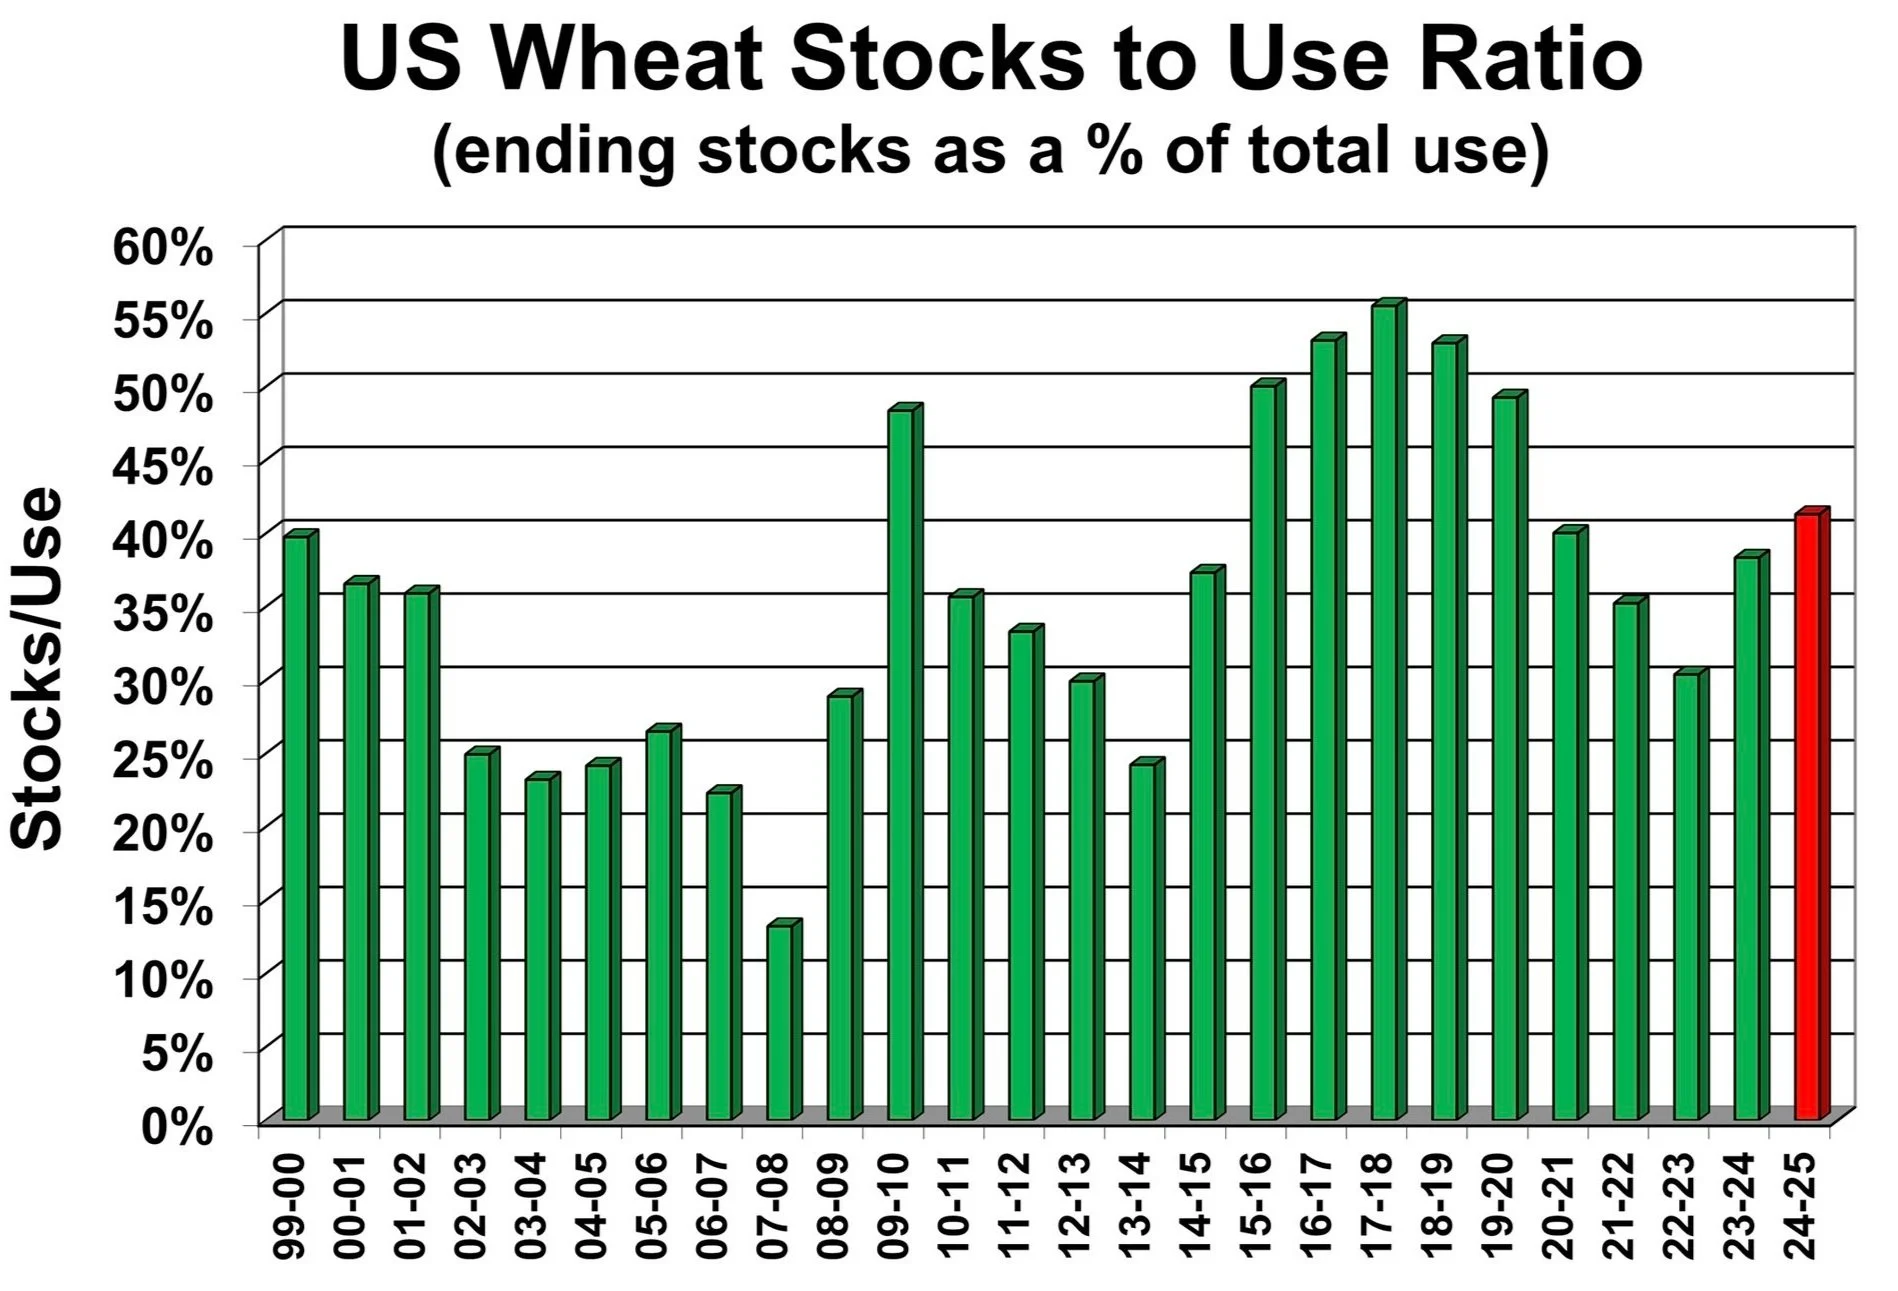
Below is our US stocks to use ratio. Not "bullish" but it's not super bearish either.
What is bullish is our stocks to use ratio for major exporters.
I have shown this graph several times, but it is one of the biggest reasons why wheat could have a story down the road.
The stocks to use is the lowest since 2008. The carryout for major exporters is the lowest since 2012. I wouldn’t call that bearish.
Short term could we go lower? Absolutely possible.
If we look at the chart, we posted a new low but yet again closed right at that peak volume support of $5.65
That is still a major spot to hold. To dictate the short term action, I am waiting to see if we can bust above $5.80 or below $5.65 with confidence.
If we bust below here, there is little support below.
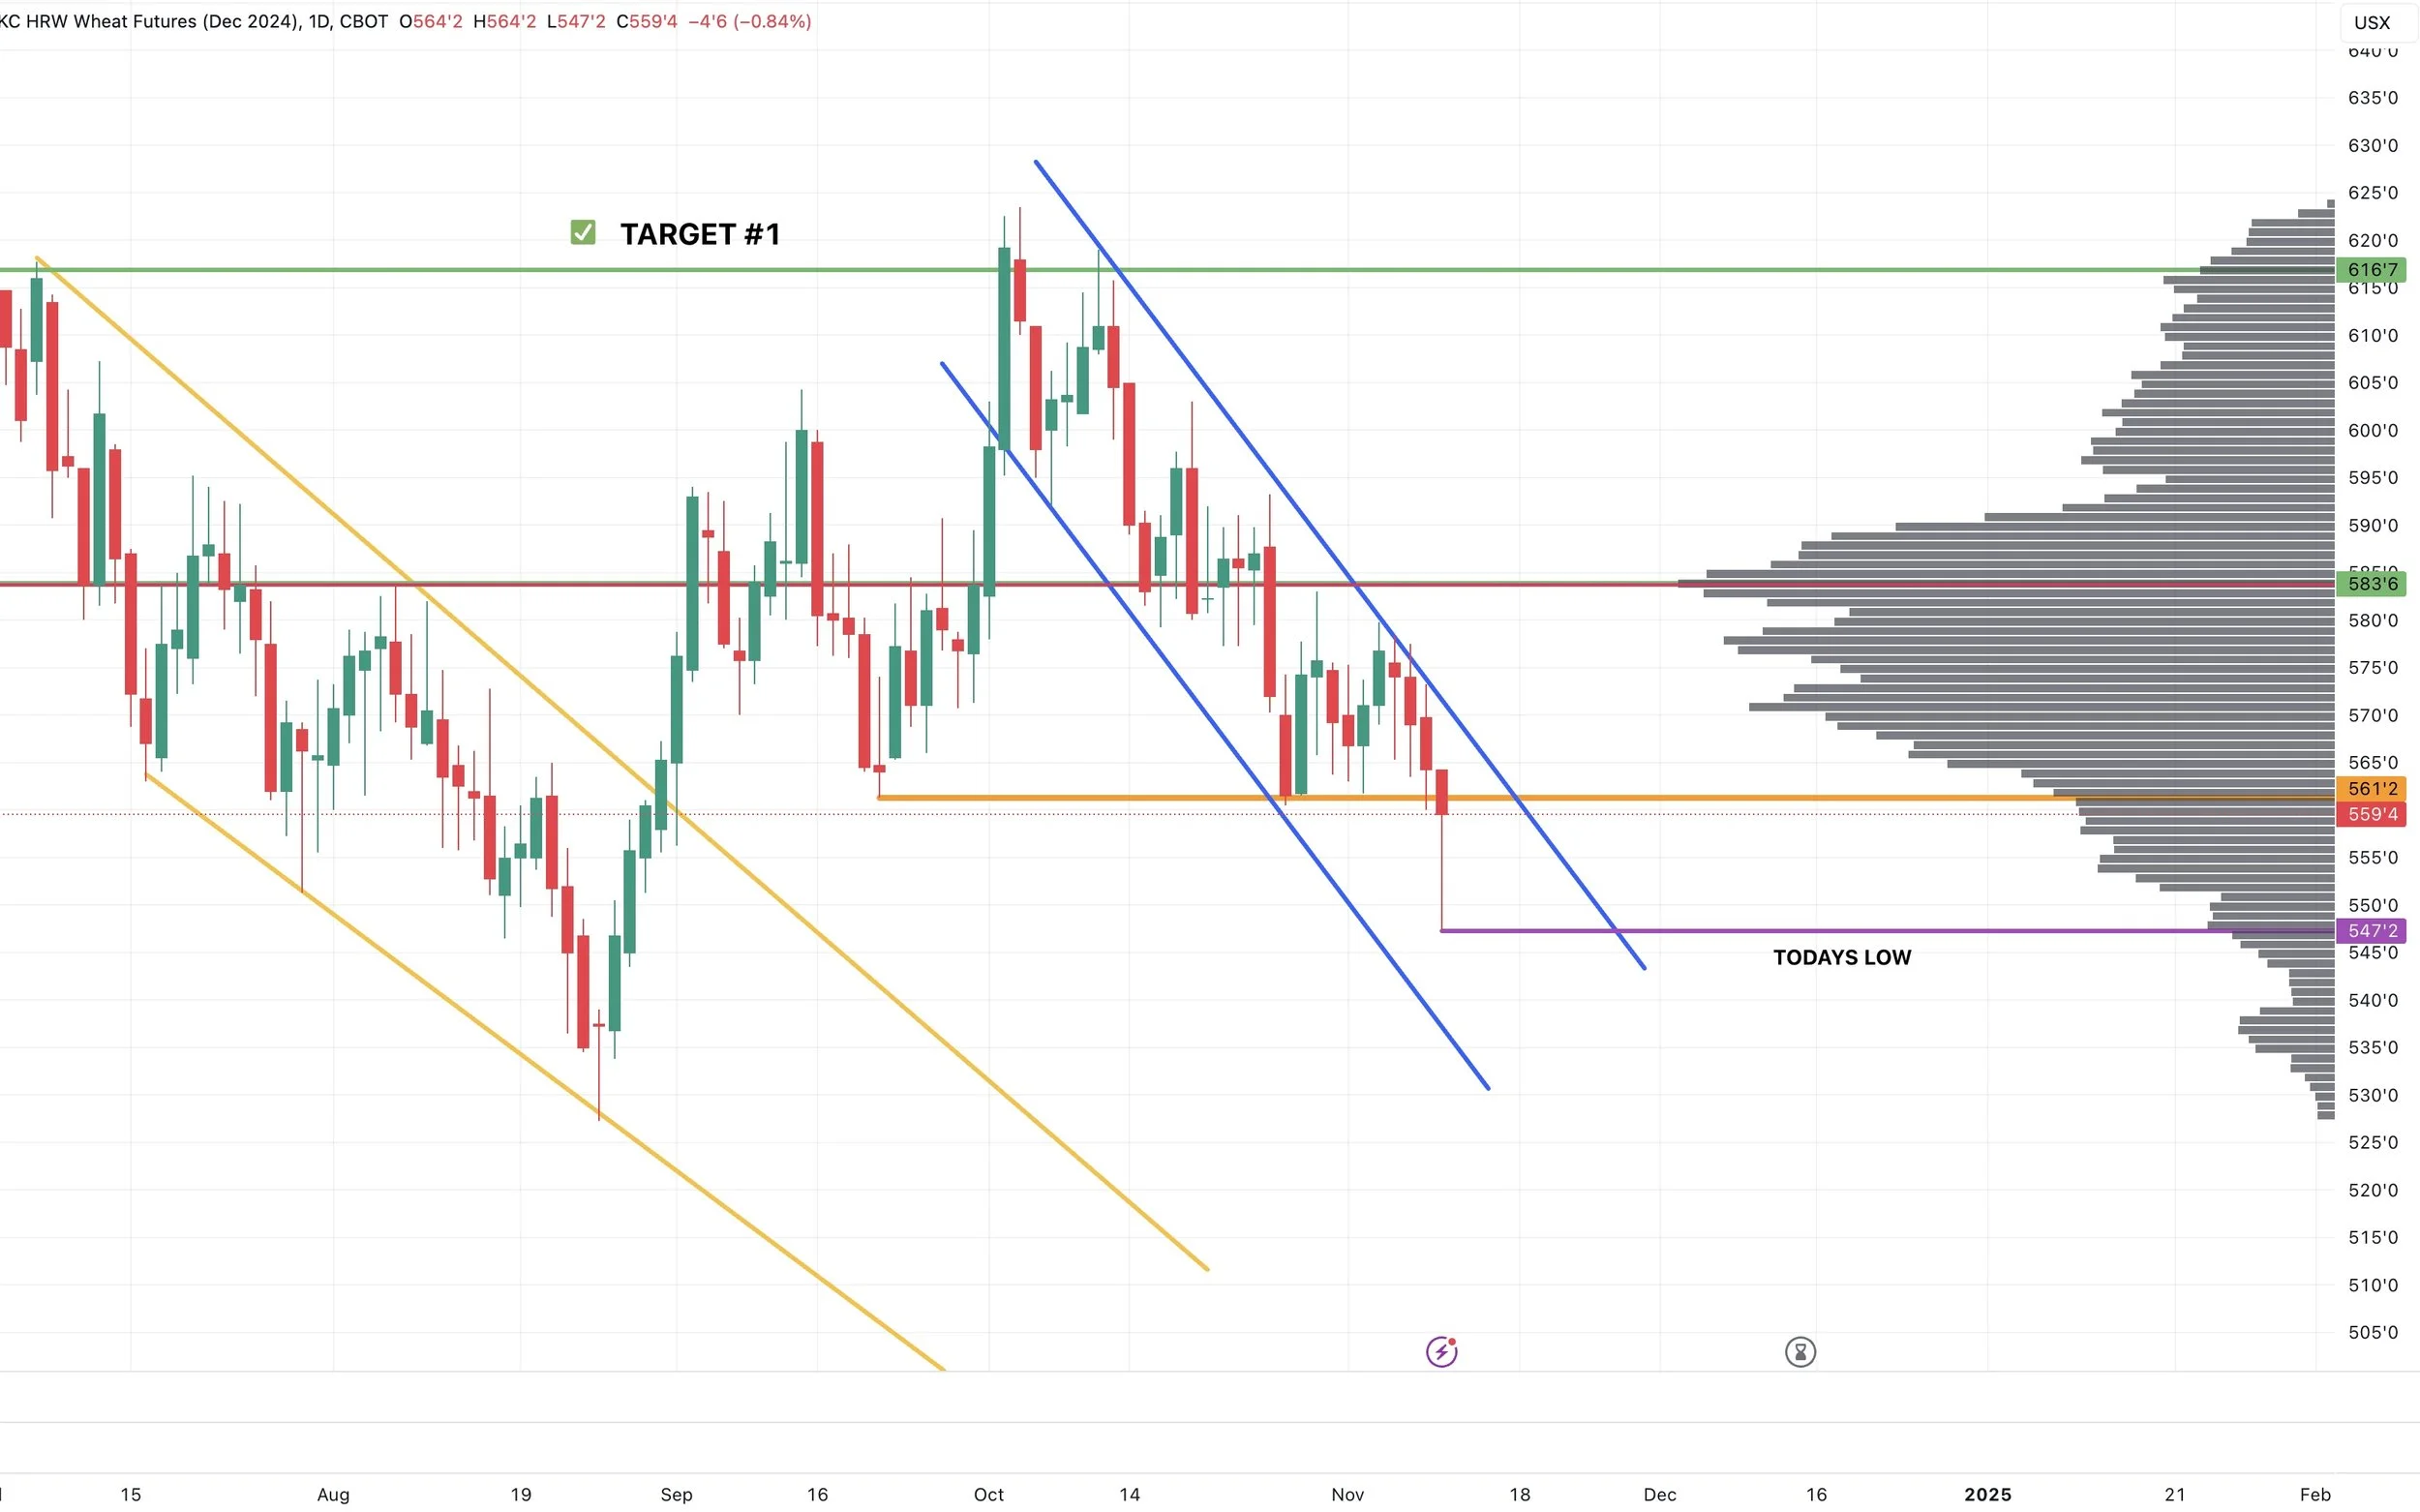
Same story for KC.
We posted a new low, and broke that $5.61 support.. so on one hand not a good look.
But we rallied well off the lows, leaving a pretty decent candle wick. Potentially friendly.
We will know soon whether this is the start of a reversal or not.
Past Sell or Protection Signals
We recently incorporated these. Here are our past signals.
Oct 2nd: 🌾
Wheat sell signal at $6.12 target
Sep 30th: 🌽
Corn protection signal at $4.23-26
Sep 27th: 🌱
Soybean sell & protection signal at $10.65
Sep 13th: 🌾
Wheat sell signal at $5.98
May 22nd: 🌾
Wheat sell signal when wheat traded +$7.00
Want to Talk?
Our phones are open 24/7 for you guys if you ever need anything or want to discuss your operation.
Hedge Account
Interested in a hedge account? Use the link below to set up an account or shoot Jeremey a call at (605)295-3100.
Check Out Past Updates
11/8/24
USDA FRIENDLY BUT GRAINS WELL OFF HIGHS
11/6/24
GRAINS STORM BACK POST TRADE WAR FEAR
11/5/24
ALL ABOUT THE ELECTION & VIDEO CHART UDPATE
11/4/24
ELECTION TOMORROW
11/1/24
GRAINS WAITING ON NEWS
10/31/24
ELECTION & USDA NEXT WEEK
10/30/24
SEASONALS, CORN DEMAND, BRAZIL REAL & MORE
10/29/24
WHAT’S NEXT AFTER HARVEST?
10/25/24
POOR PRICE ACTION & SPREADS WEAKEN
10/24/24
BIG BUYERS WANT CORN?
10/23/24
6TH STRAIGHT DAY OF CORN SALES
10/22/24
STRONG DEMAND & TECHNICAL BUYING FOR GRAINS
10/21/24
SPREADS, BASIS CONTRACTS, STRONG CORN, BIG SALES
10/18/24
BEANS & WHEAT HAMMERED
10/17/24
OPTIMISTIC PRICE ACTION IN GRAINS
10/16/24
BEANS CONTINUE DOWNFALL. CORN & WHEAT FIND SUPPORT
10/15/24
MORE PAIN FOR GRAINS
10/14/24
GRAINS SMACKED. BEANS BREAK $10.00
10/10/24
USDA TOMORROW
10/9/24
MARKETING STYLES, USDA RISK, & FEED NEEDS
10/8/24
BEANS FALL APART
10/7/24
FLOORS, RISKS, & POTENTIAL UPSIDE
10/4/24
HEDGE PRESSURE
10/3/24
GRAINS TAKE A STEP BACK
10/2/24
CORN & WHEAT CONTINUE RUN
10/1/24
CORN & WHEAT POST MULTI-MONTH HIGHS
9/30/24

