
USDA REPORT. HOW THIS IMPACTS CORN
MARKET UPDATE
You can scroll to read the usual update as well. As the written version is the exact same as the video.
Timestamps for video:
Overview & USDA: 0:00min
Corn: 3:00min
Soybeans: 6:45min
Wheat: 10:20min
Want to talk about your situation?
(605)295-3100
Take advantage of our planting sale before your free trial expires.
Make sure you are prepared for the next opportunity.
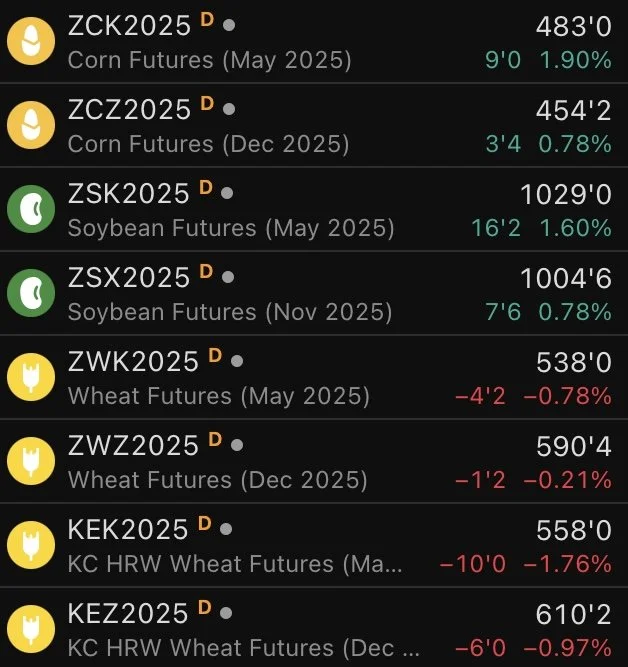
Futures Prices Close
Overview
Corn & soybeans rally after the bullish USDA report.
Corn had by far the most bullish report.
As the USDA finally acknowledged our exports like we and everyone else have been saying they should.
As they bumped them by +100 million bushels. (Now 2,550 vs 2,450)
This was partially offset by a -25 million cut to feed & residual for a net drop of -75 million bushels on our carryout.
This led to old crops carryout falling to 1.46 billion.
Soybeans had a friendly report with carryout falling more than expected. Wheat on the other hand had decently bearish report as carryout was higher than anticipated.

Here is the world numbers.
Corn well below the estimates.
Soybeans and wheat both surprised higher.

How this report impacts corn:
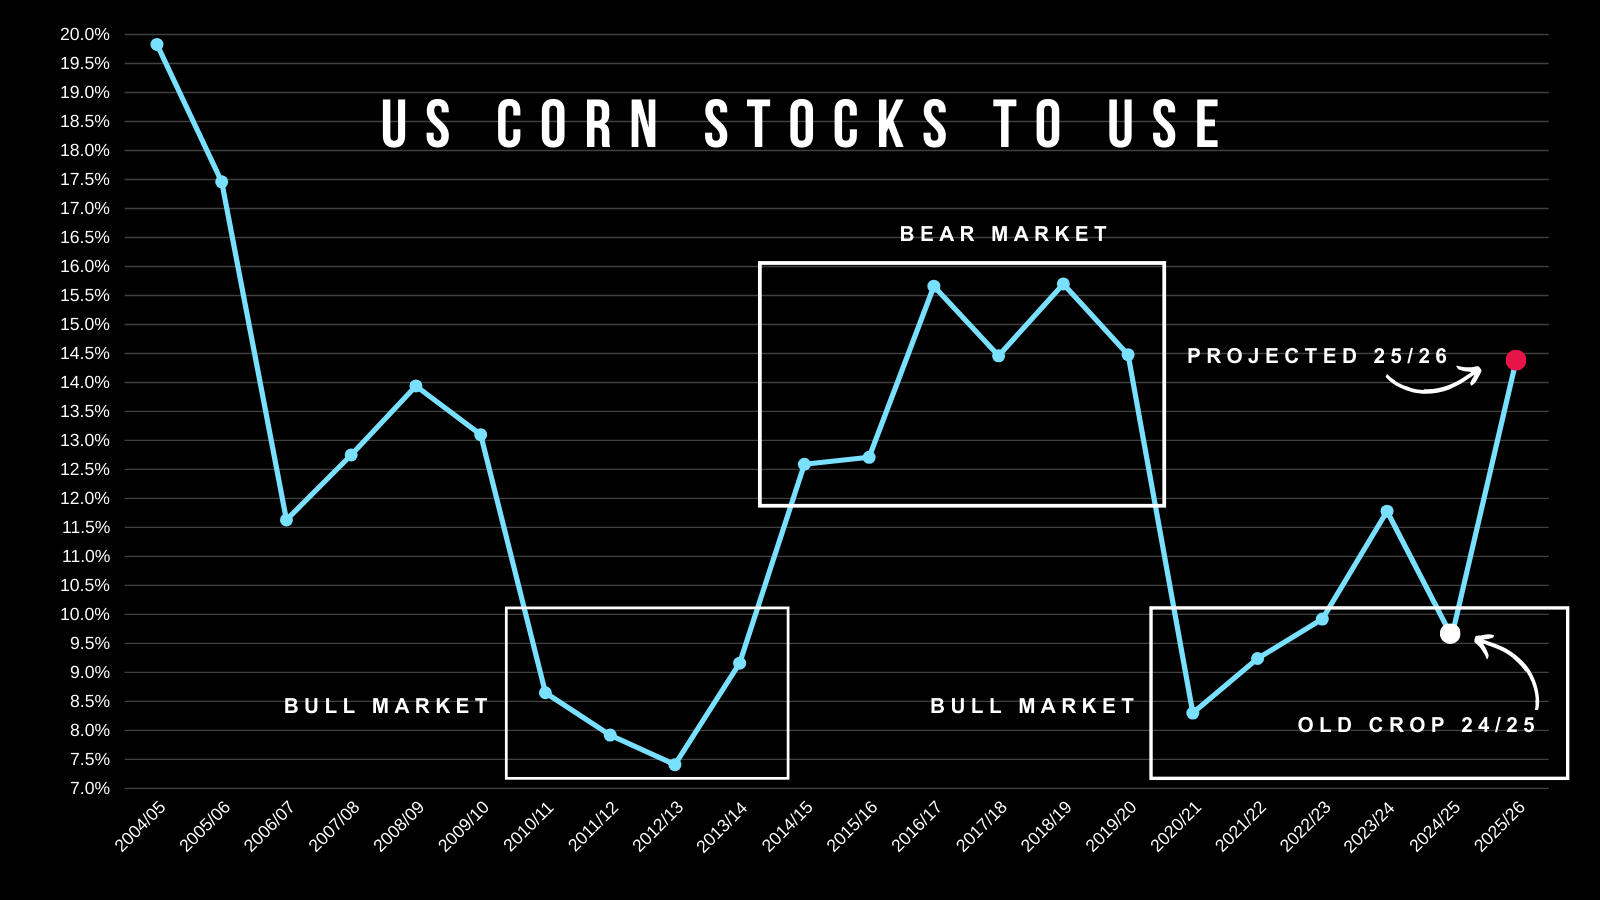
With the USDA bumping exports, this led to our old crop stocks to use ratio falling to 9.6%. Now below 10%.
Here is what that looks like on the balance sheet.

Anything below 10% is usually referred to as "bull market" territory.
It's still not $7-8 corn bullish, but this number is miles away from screaming $4 corn.
If the USDA had our stocks to use ratio at this level last year, we would not have been under $5.00
This 9.6% stocks to use ratio makes corn seem very undervalued here.
This is the tightest we have been since 2021/22 marketing year.
The absolute low in corn during those two years was $4.95.. meanwhile we barely cracked $5 this year.
Yes, would’ve been nice for the USDA to acknowledge exports months ago instead of in April when the focus starts shifting to new crop. But we can’t do anything about it.
The issue with the corn situation is new crop. The current projection is a stocks to use ratio of over 14%. Which is a very bearish number and the highest since 2019/20.
But keep in mind, this number does use a 181 yield. This is also right about where we started out last year, with a +2 billion bushel carryout. We all know how that turned out. So it's far from being set in stone.
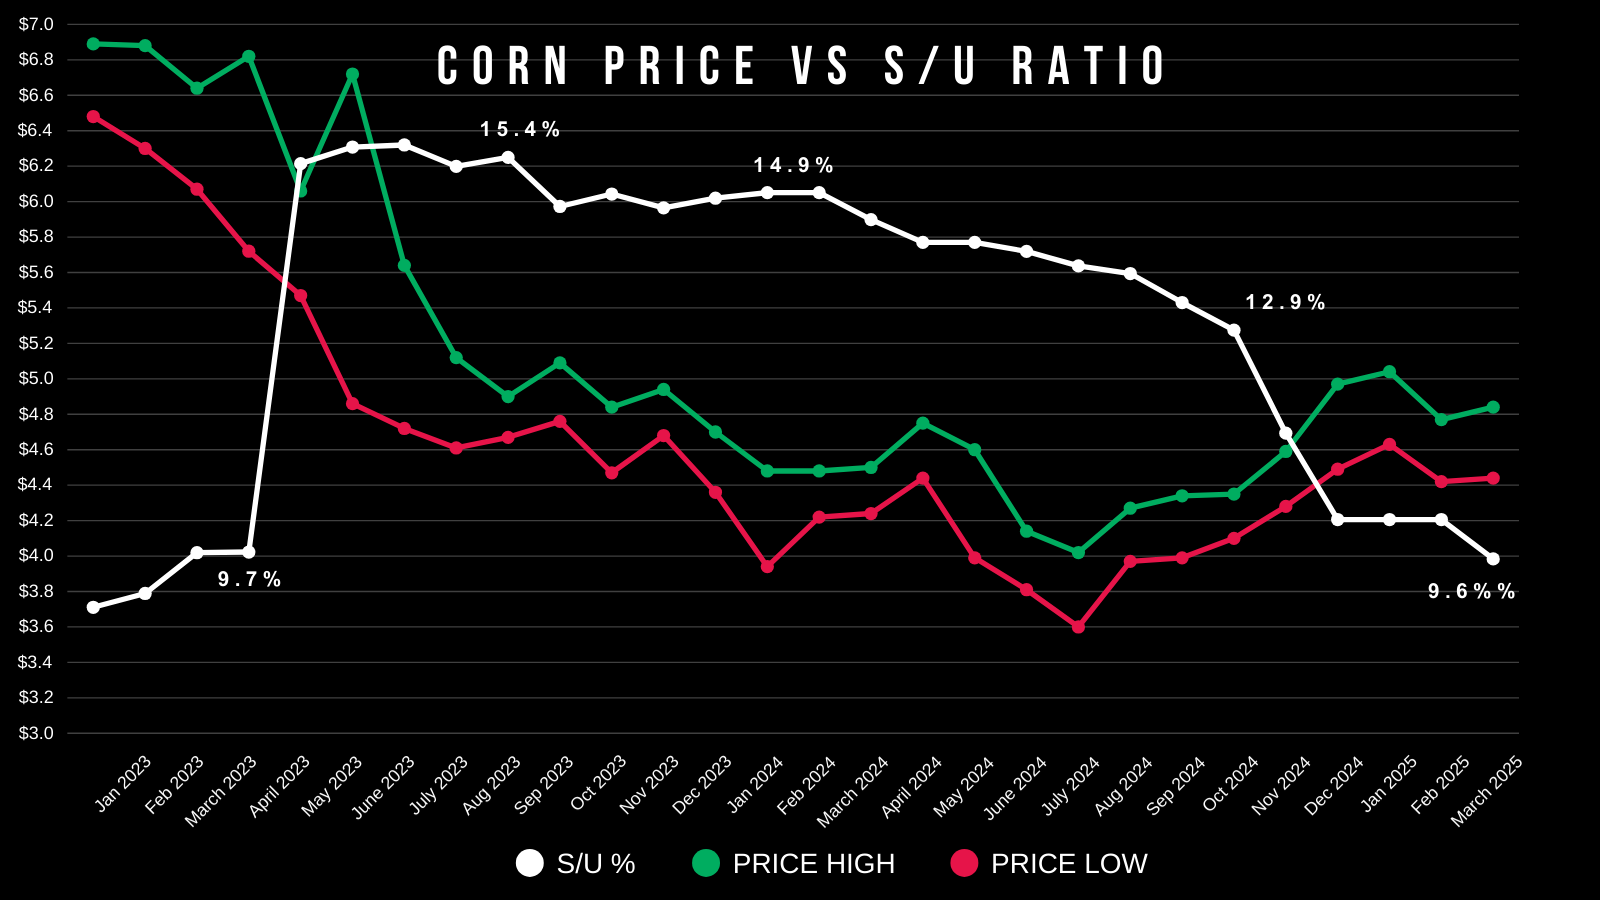
This stocks to use is the tightest since March 2023.
Corn was trading in the realm of $6 during this time period.
That doesn’t mean we are going to $6. Just tells you we might be undervalued.
Today's Main Takeaways
Corn
Fundamentals:
Fundamentally the old crop situation is the tightest in a few years.
We also have a world situation that simply can’t afford any losses with this years crop, as it is the tightest in a decade.
Corn's price action since these events:
- USDA said +95 million acres: +39 cents.
- Trade war starts: +35 cents.
Corn has remained the bright spot while the rest of the markets have crumbled with fear over the uncertainties.
As I've been mentioning the last week or so, what argument do bears really have here?
Once we know what this crop looks like and as we head into harvest, then yes we are inevitably probably going to tank like we always do. And we are going to plant a ton of acres.
But ahead of growing season? There isn’t an argument to be made that corn should go much lower than here.
We still have an entire growing season ahead of us. We still have to get a crop in the ground. We still have to endure all of the weather implications.
Corn still has a story and I still think we are undervalued here moving forward.
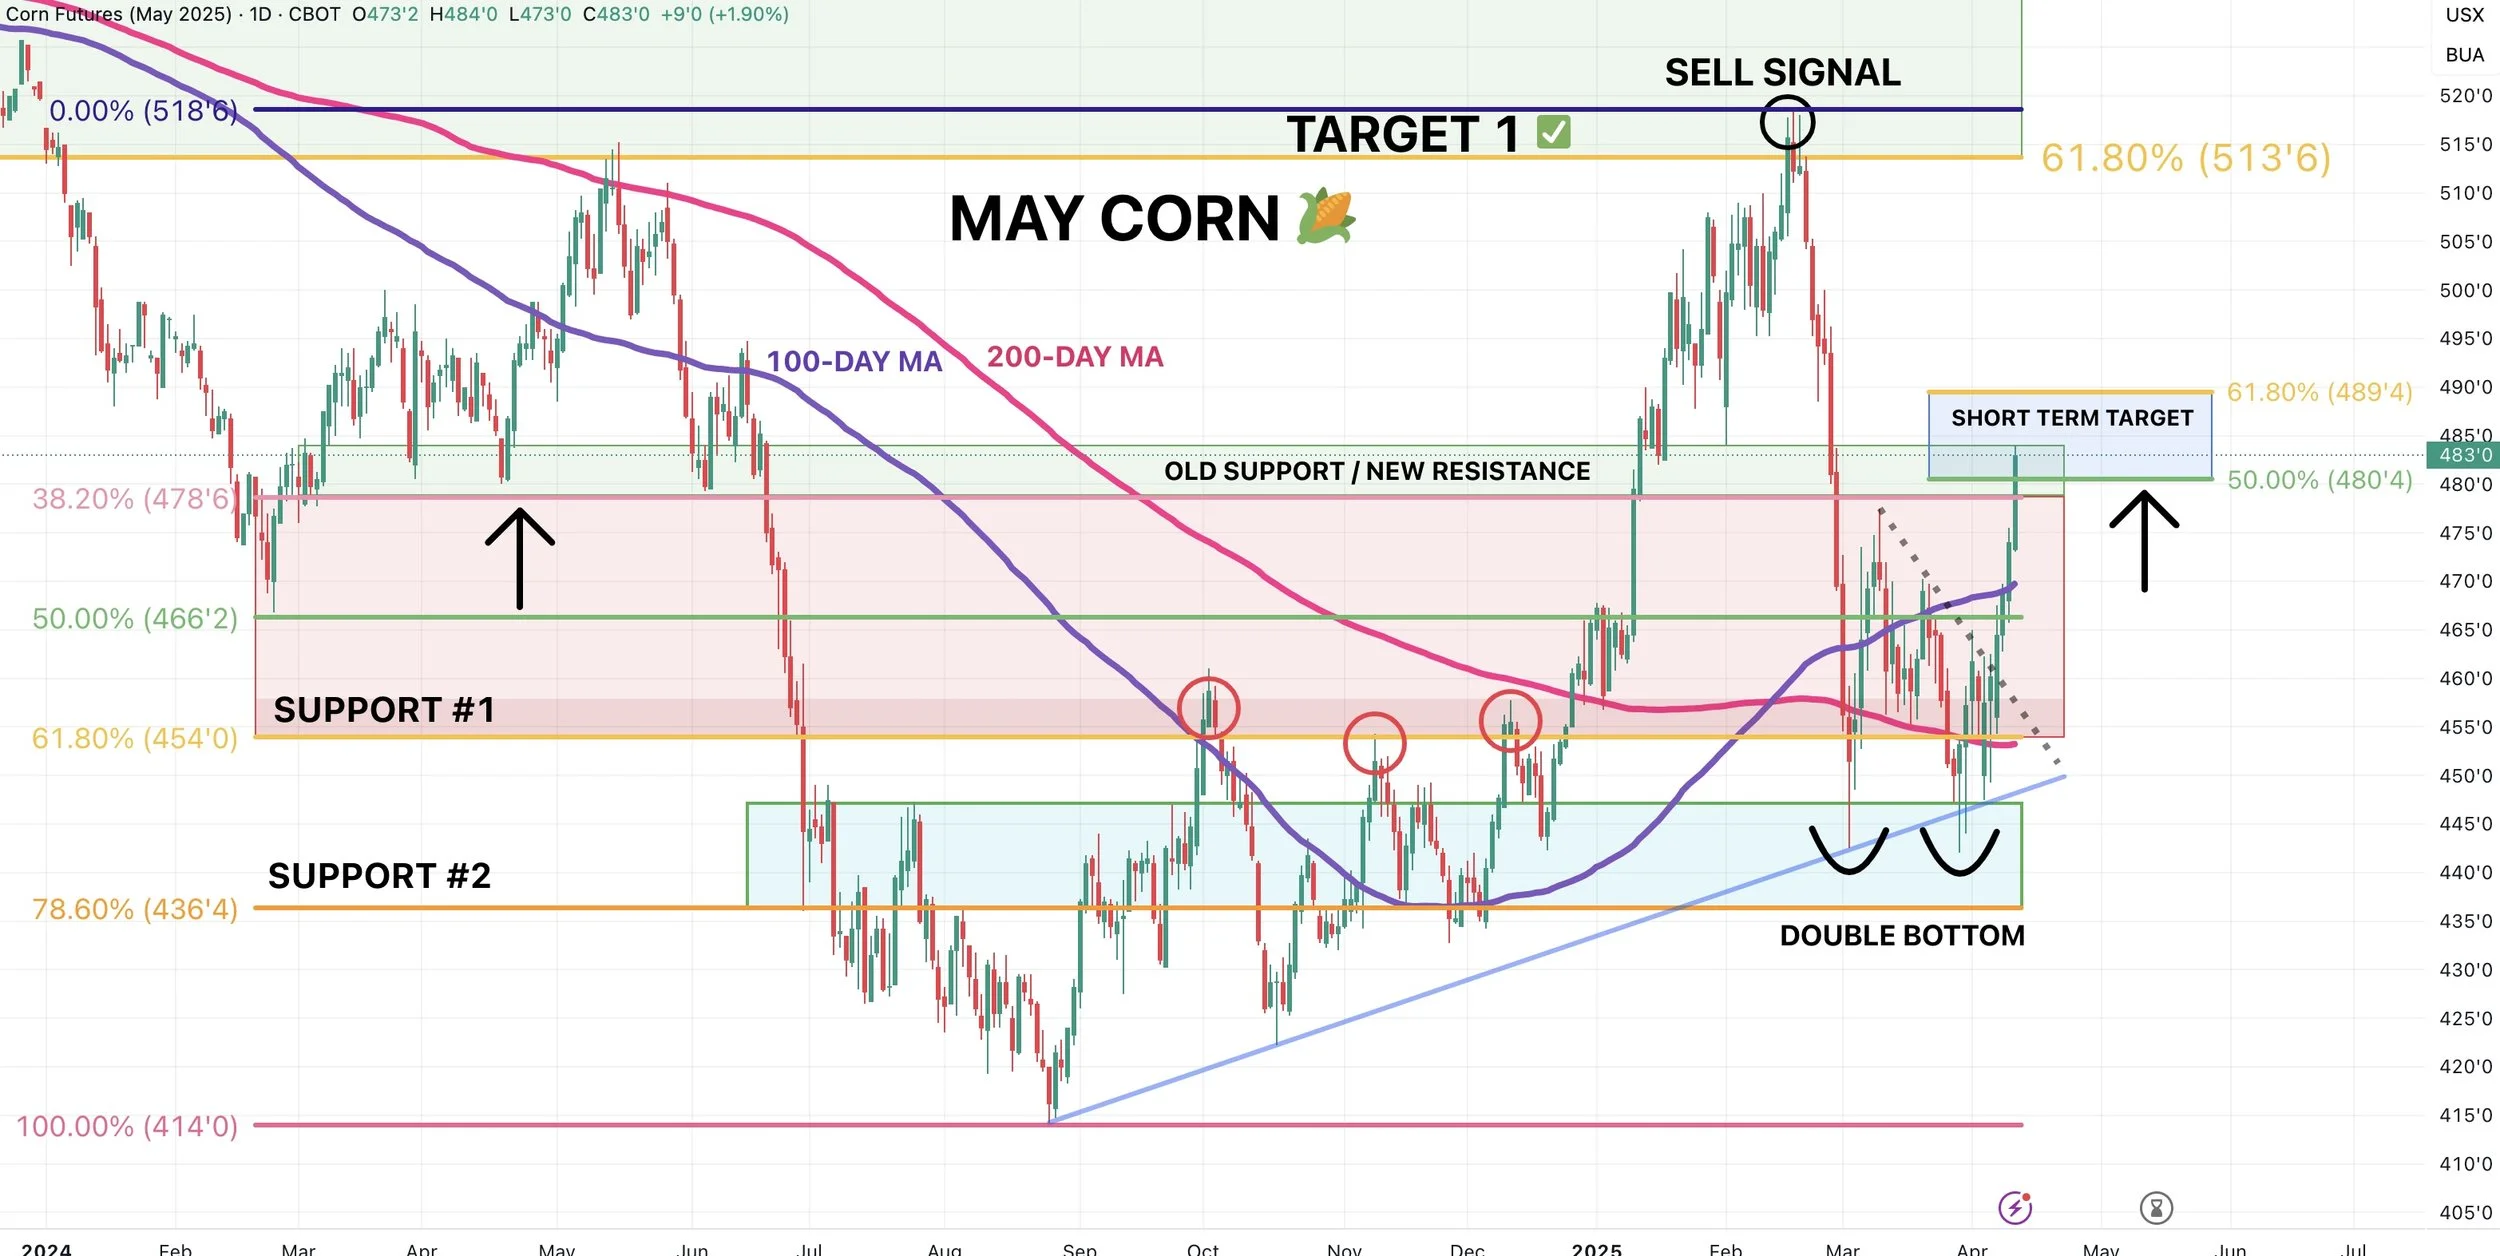
Technicals:
Today we did alert an old crop sell signal for those that need to move corn in the next 45 days or for those that are uncomfortable or undersold.
If you missed it: CLICK HERE
The corn chart still looks great. I have been saying for weeks how strong of a support level we had below us that I thought we would hold.
We hit my first upside target of $4.80
This gives us back 50% of the sell off.
It is also our old key support from last spring (old support often turns into resistance).
That is why I think it makes sense to take risk off that table if you are someone who has to move something soon or is uncomfortable or undersold.
Since this is a resistance level, it means that if we break above it should lead to more upside.
At the same time.. if we are going to see a rejection short term. It makes sense that it would happen here.
It is decision time for corn here short term.
Personally, I think we will be higher in the coming weeks/months whether we pull back here or not. But it is all about defining your personal risk.
Here is July corn.
Exact same technical lay out as May corn.
We hit the 50% retracement.
This is also that key support (now resistance) from last spring.

I have not shown this chart in a while.
This is weekly continuous corn and my big picture thinking.
A few things to note.
The blue line at $4.97.
This is one of the reasons we had that sell signal back on Feb 18th.
That is a huge level that has acted as key support and resistance a handful of times (circled instances).
If we clear that level, there is not much resistance to the upside.
So our target is going to be $5.37. Which is 38.2% of the $8.24 highs from 2022. Again, this is my big picture target.
Targets do not have to hit. They are simply there to let you know it might be a good time to de-risk if we get there.

Dec corn has been lagging behind May and July.
However, we did close above the 100-day MA. This often indicates that we are in the process of starting a new upward trend.
First target is still going to be $4.60 to $4.65
$4.60 gives us back 50% of the rally. It is also our past resistance from those September highs.
$4.65 is the 61.8% retracement of the sell off. It is also the lows from Feb 2024.

Soybeans
Fundamentals:
Trump announces he is tariffing China 145%
Soybeans reaction?
Rally +40 cents in 2 days.
May beans have now erased the ENTIRE trade war initial sell off.
In Tuesdays update I went over why the soybean market has traded higher despite all of the outside noise. (If you missed it: CLICK HERE)
Essentially, the market already traded the initial shock of the trade war fear.
It really does not matter if we tariff China 50% or 500%. They do the same damage.
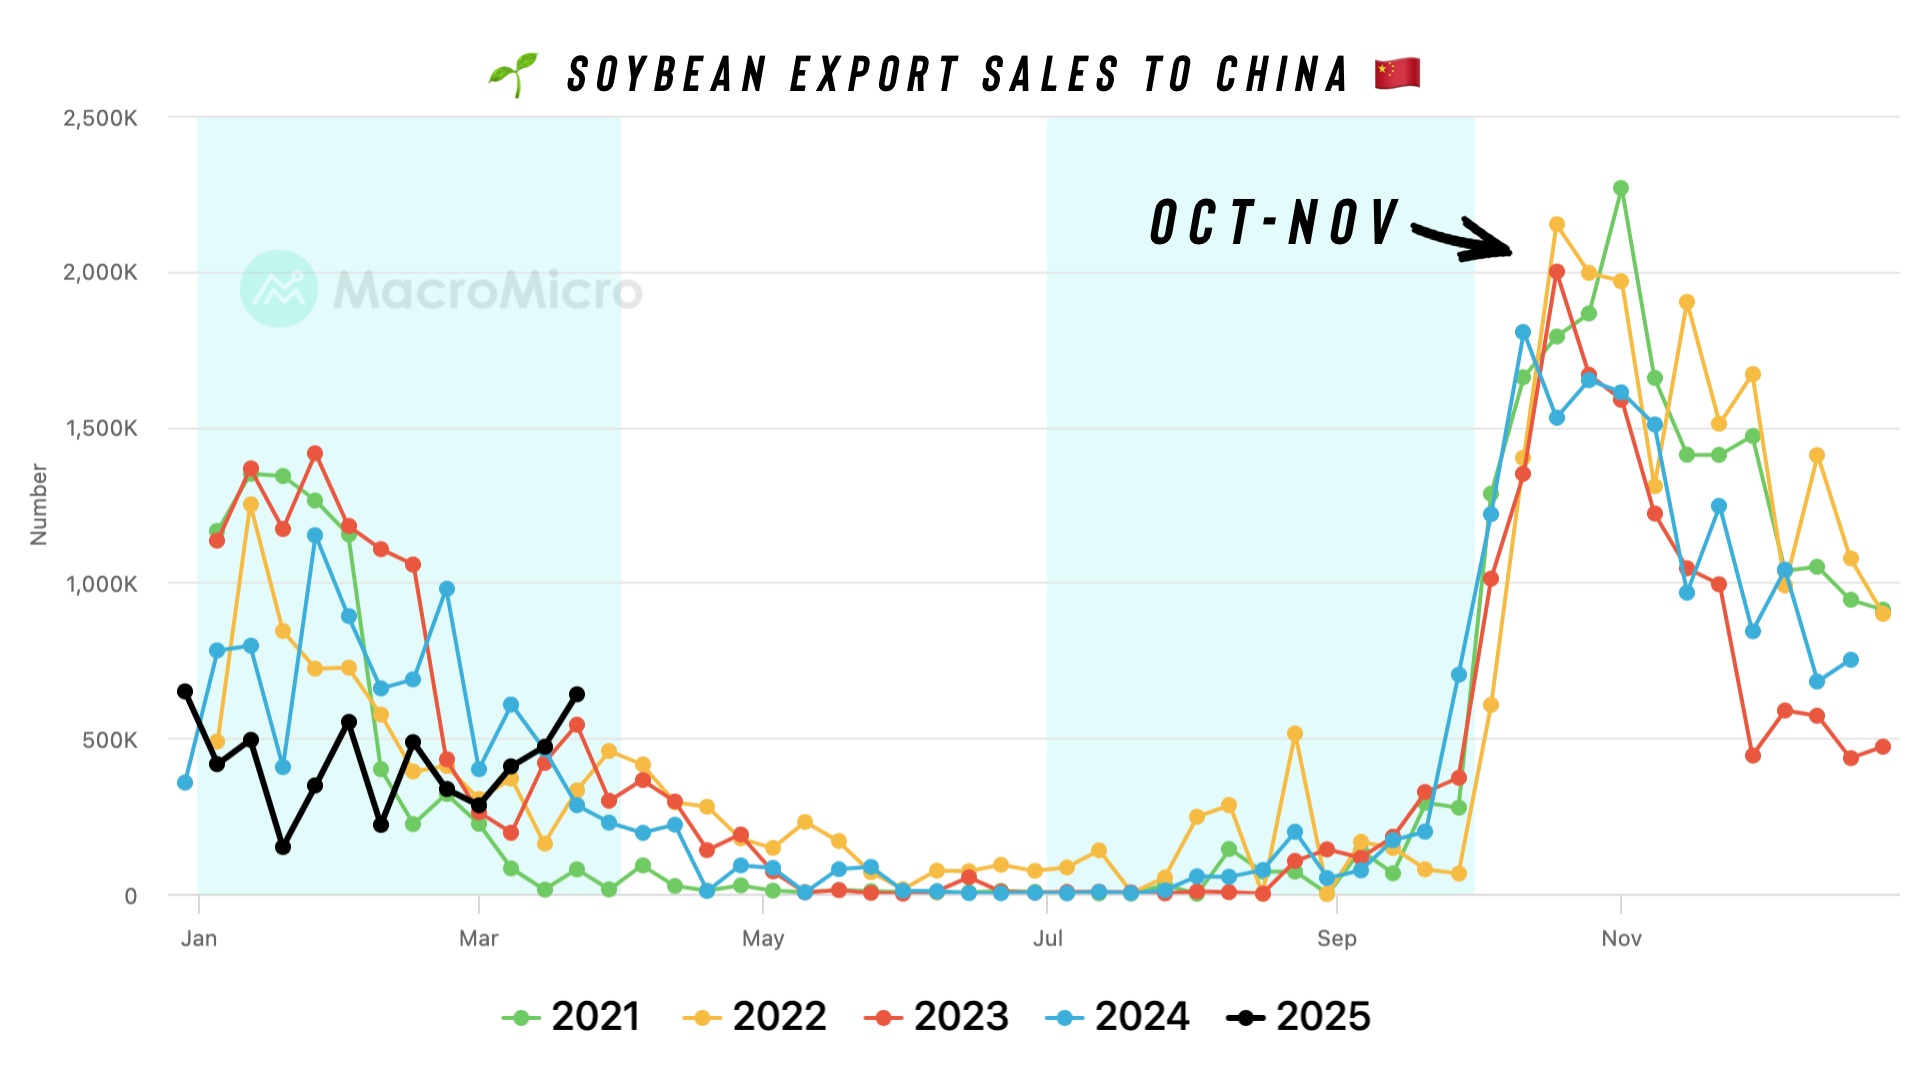
This is also the time of year where China stops buying US soybeans anyways.
So does a trade war really matter "today" when China isn’t going to be buying soybeans to begin with?
Old crop soybeans have been especially strong compared to new crop on this recent recovery.
This is because China has bought pretty much all of the soybeans theya re going to buy this year until harvest, and most of those beans have been shipped.
Now IF the trade war were to continue until harvest time, then the trade war does become a huge bearish factor. As that is when China comes to the US for their soybean needs. Right now they are going to Brazil post Brazil harvest.
(I included this Tuesday, but here it is again for reference)
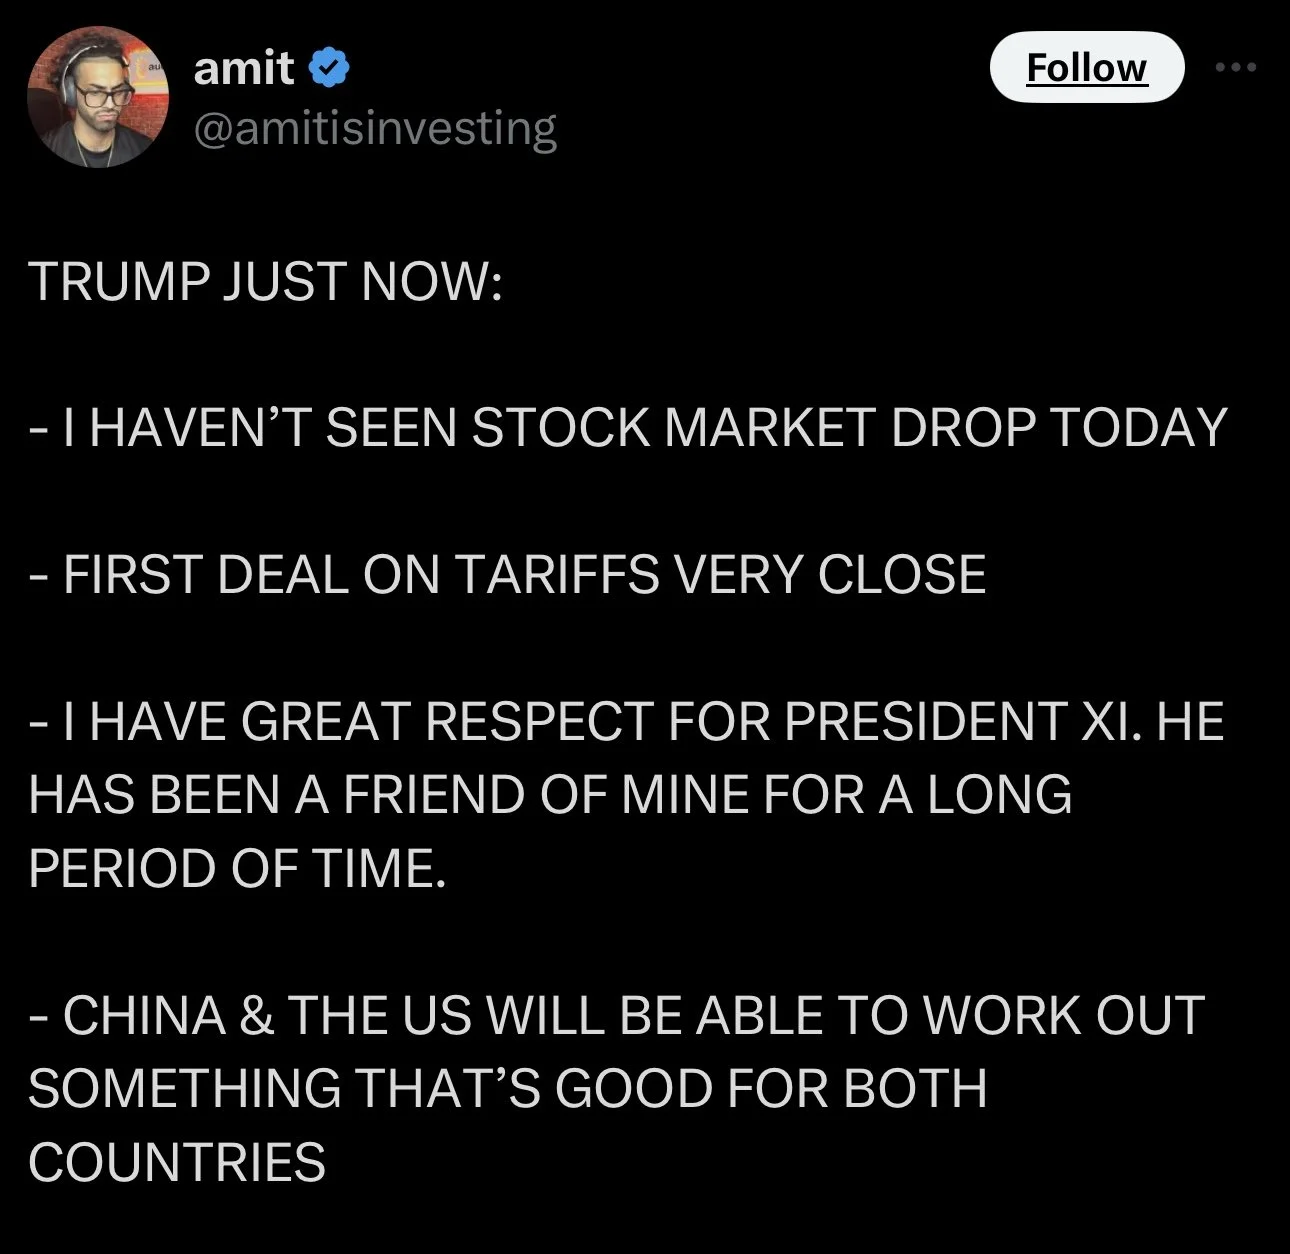
No one can predict the trade war.
But Trump is making it sound like the US and China will come to an agreement.
Overall, disregarding the trade war, fundamentally soybeans are undervalued here moving forward.
Our new crop carryout is projected to be substantially lower than last year. WITH A RECORD YIELD OF 52.5 BPA.
This is the biggest argument bulls have here.
Even dropping yield to 51 bpa puts soybeans carryout near 150 million bushels. Which trims the current stocks to use ratio projection in half.
Here is the balance sheet scenarios: (Current est vs Scenario)
Current Projection

51 bpa Scenario

Technicals:
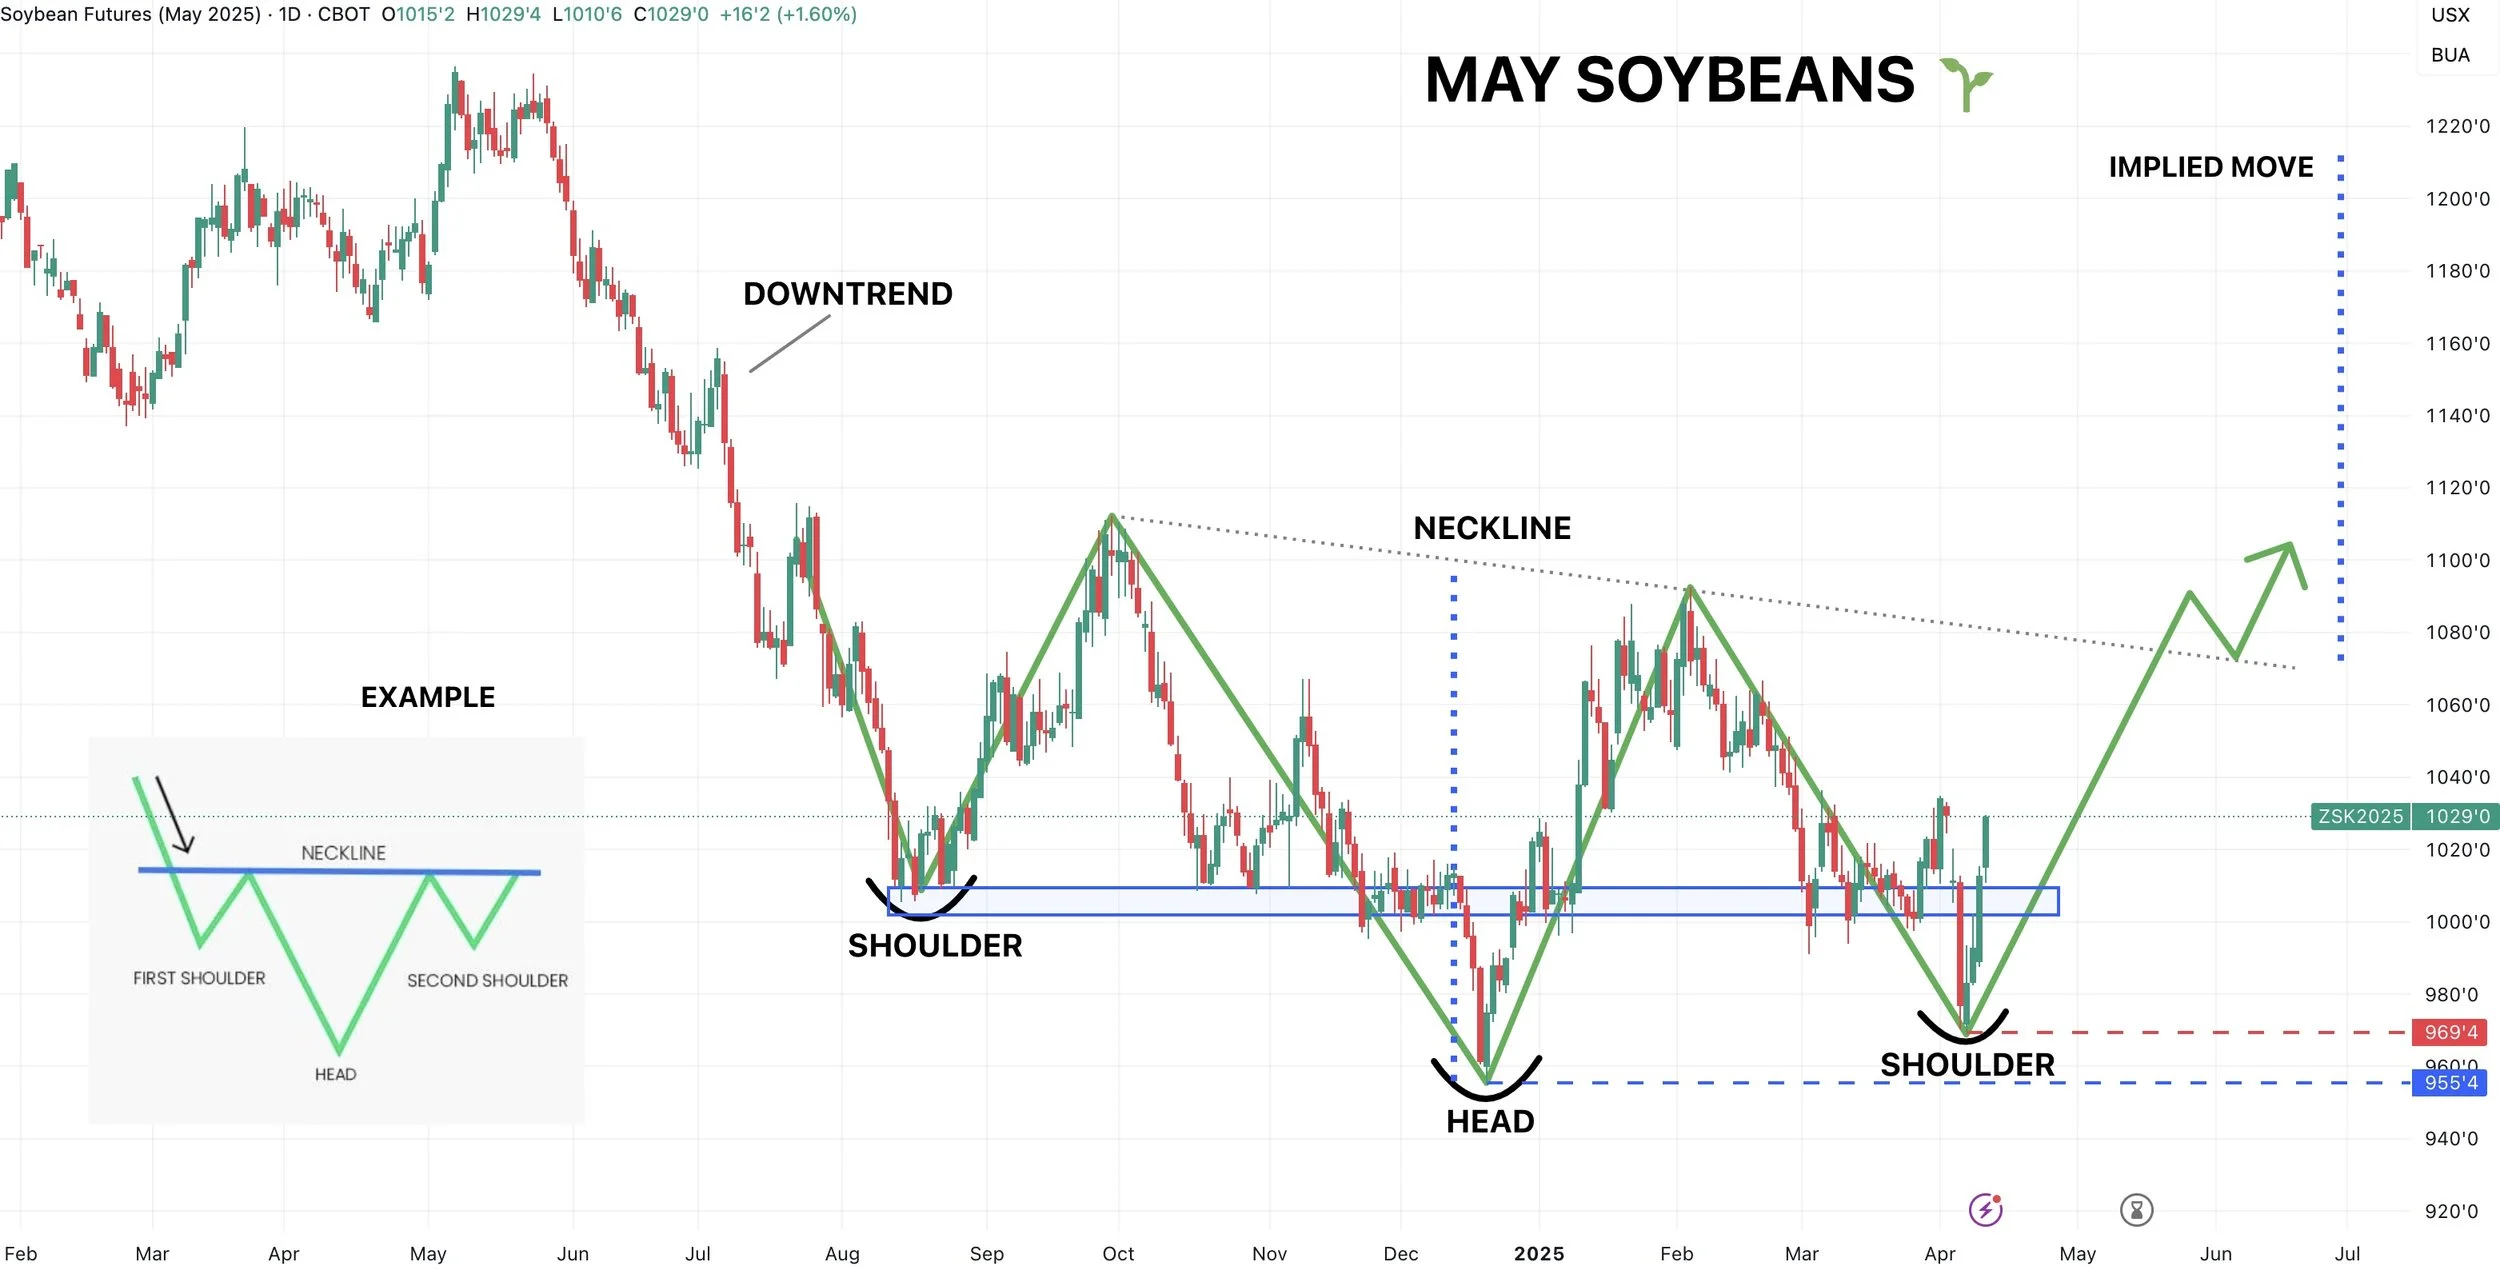
Soybean bulls hope is still very alive.
I have been talking about this inverse head & shoulders pattern since February.
It is still in tact despite getting somewhat close to becoming invalid.
(It becomes invalid if we break below the head. We bounced +16 cents before those lows).
The implied move for this pattern is slightly over $12.00 depending how long it takes to break the neckline.
It is calculated by taking the range from the head to the neckline, then adding that same range to the point of where we broke above the neckline.
To confirm this pattern, you need to break the neckline.
We closed back above the 100-day MA.
This is great news, as this has been significant resistance in the past. (circled instances)
I would like to think that this sparks further upside here.
(Yes I thought this would happen last week when we closed above it until Trump ruined the party)
Then our next test of resistance is going to be the 200-day MA. Which is where we topped out both on the recent Feb highs as well as the highs from May 2024.
We have not closed above it since 2023. That is how significant it is.
A break above that opens the doors much higher.
My first bigger picture target is $11.29
That is 61.8% of the May 2024 highs.
It is also the lows from Feb 2024.

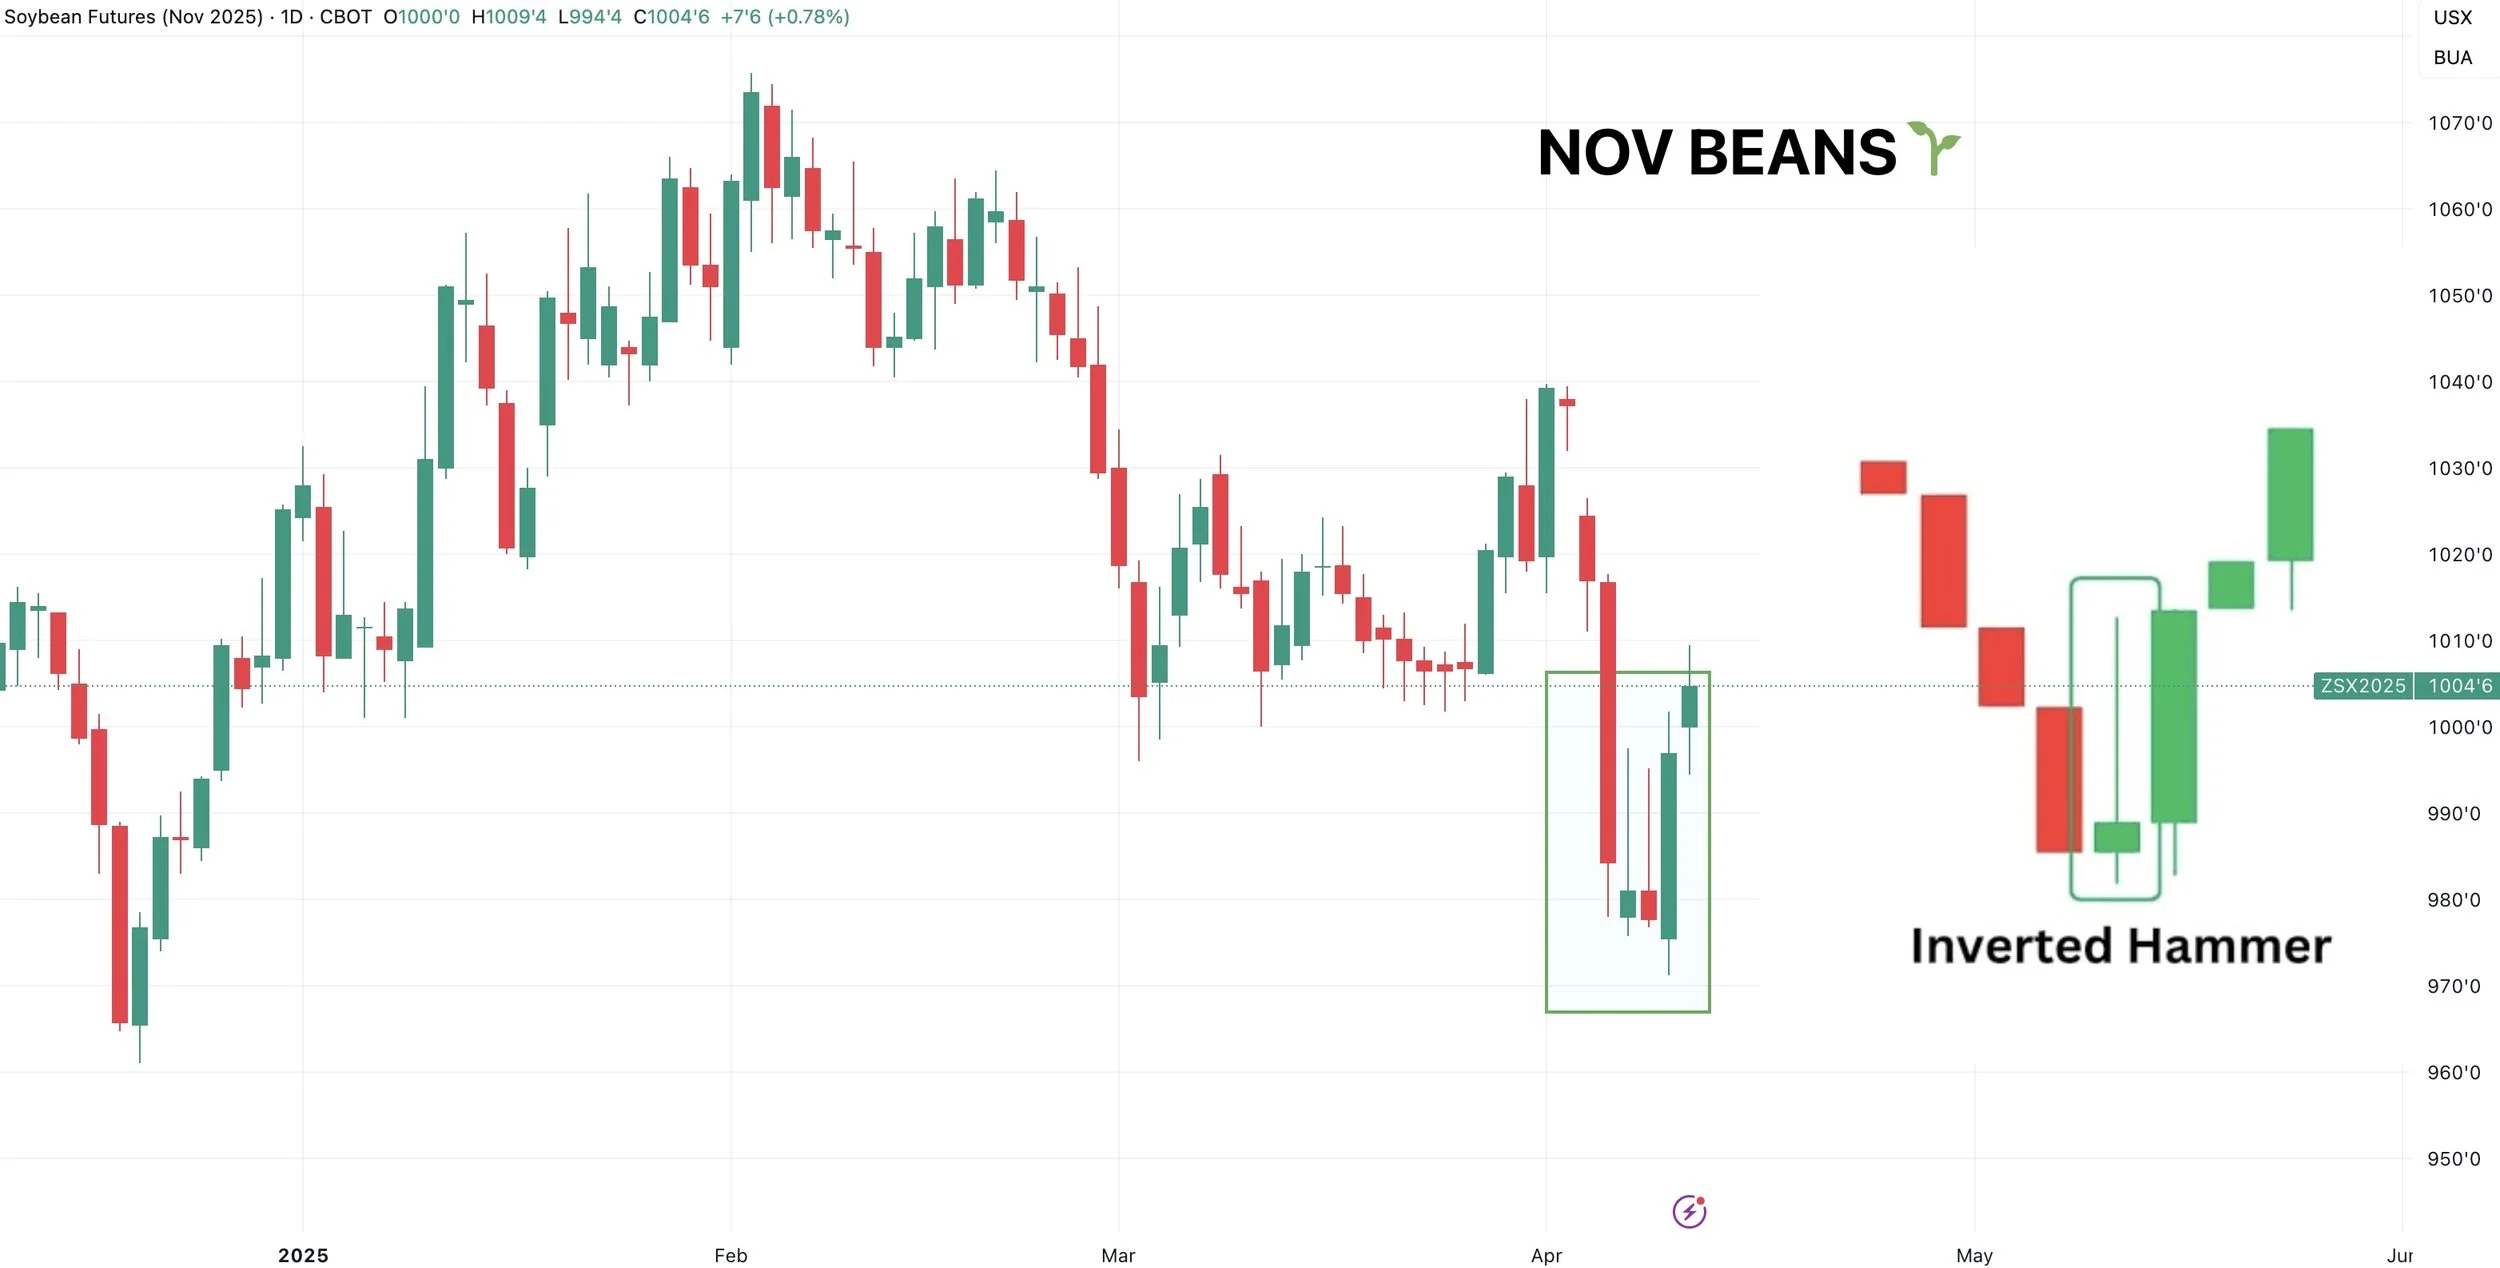
Nov beans do not have as clean of a recovery, but should still follow behind May if we continue higher.
Still have the inverse head & shoulders.
That bigger picture target is $11.11

I showed you this inverted hammer pattern on Monday.
So far it is playing out nicely.
This pattern often marks the lows in a downtrend.
Wheat
Fundamentals:
Wheat had a bearish report but it doesn’t change my long term view.
I have went over several fundamental reasons why wheat is undervalued in the past, so I am not going to spend much time on it today.
Sorry for beating a dead horse:
Wheat isn’t winning acres.
The winter wheat region looks dry for the next few months.
We have the tightest global situation in a decade.
Russian wheat exports in April are projected to drop -64% YOY and -45% vs the 5-year average.
I just don’t see a reason to get overly bearish wheat at these price levels.
Technicals:
Not much to update on the charts either for wheat.
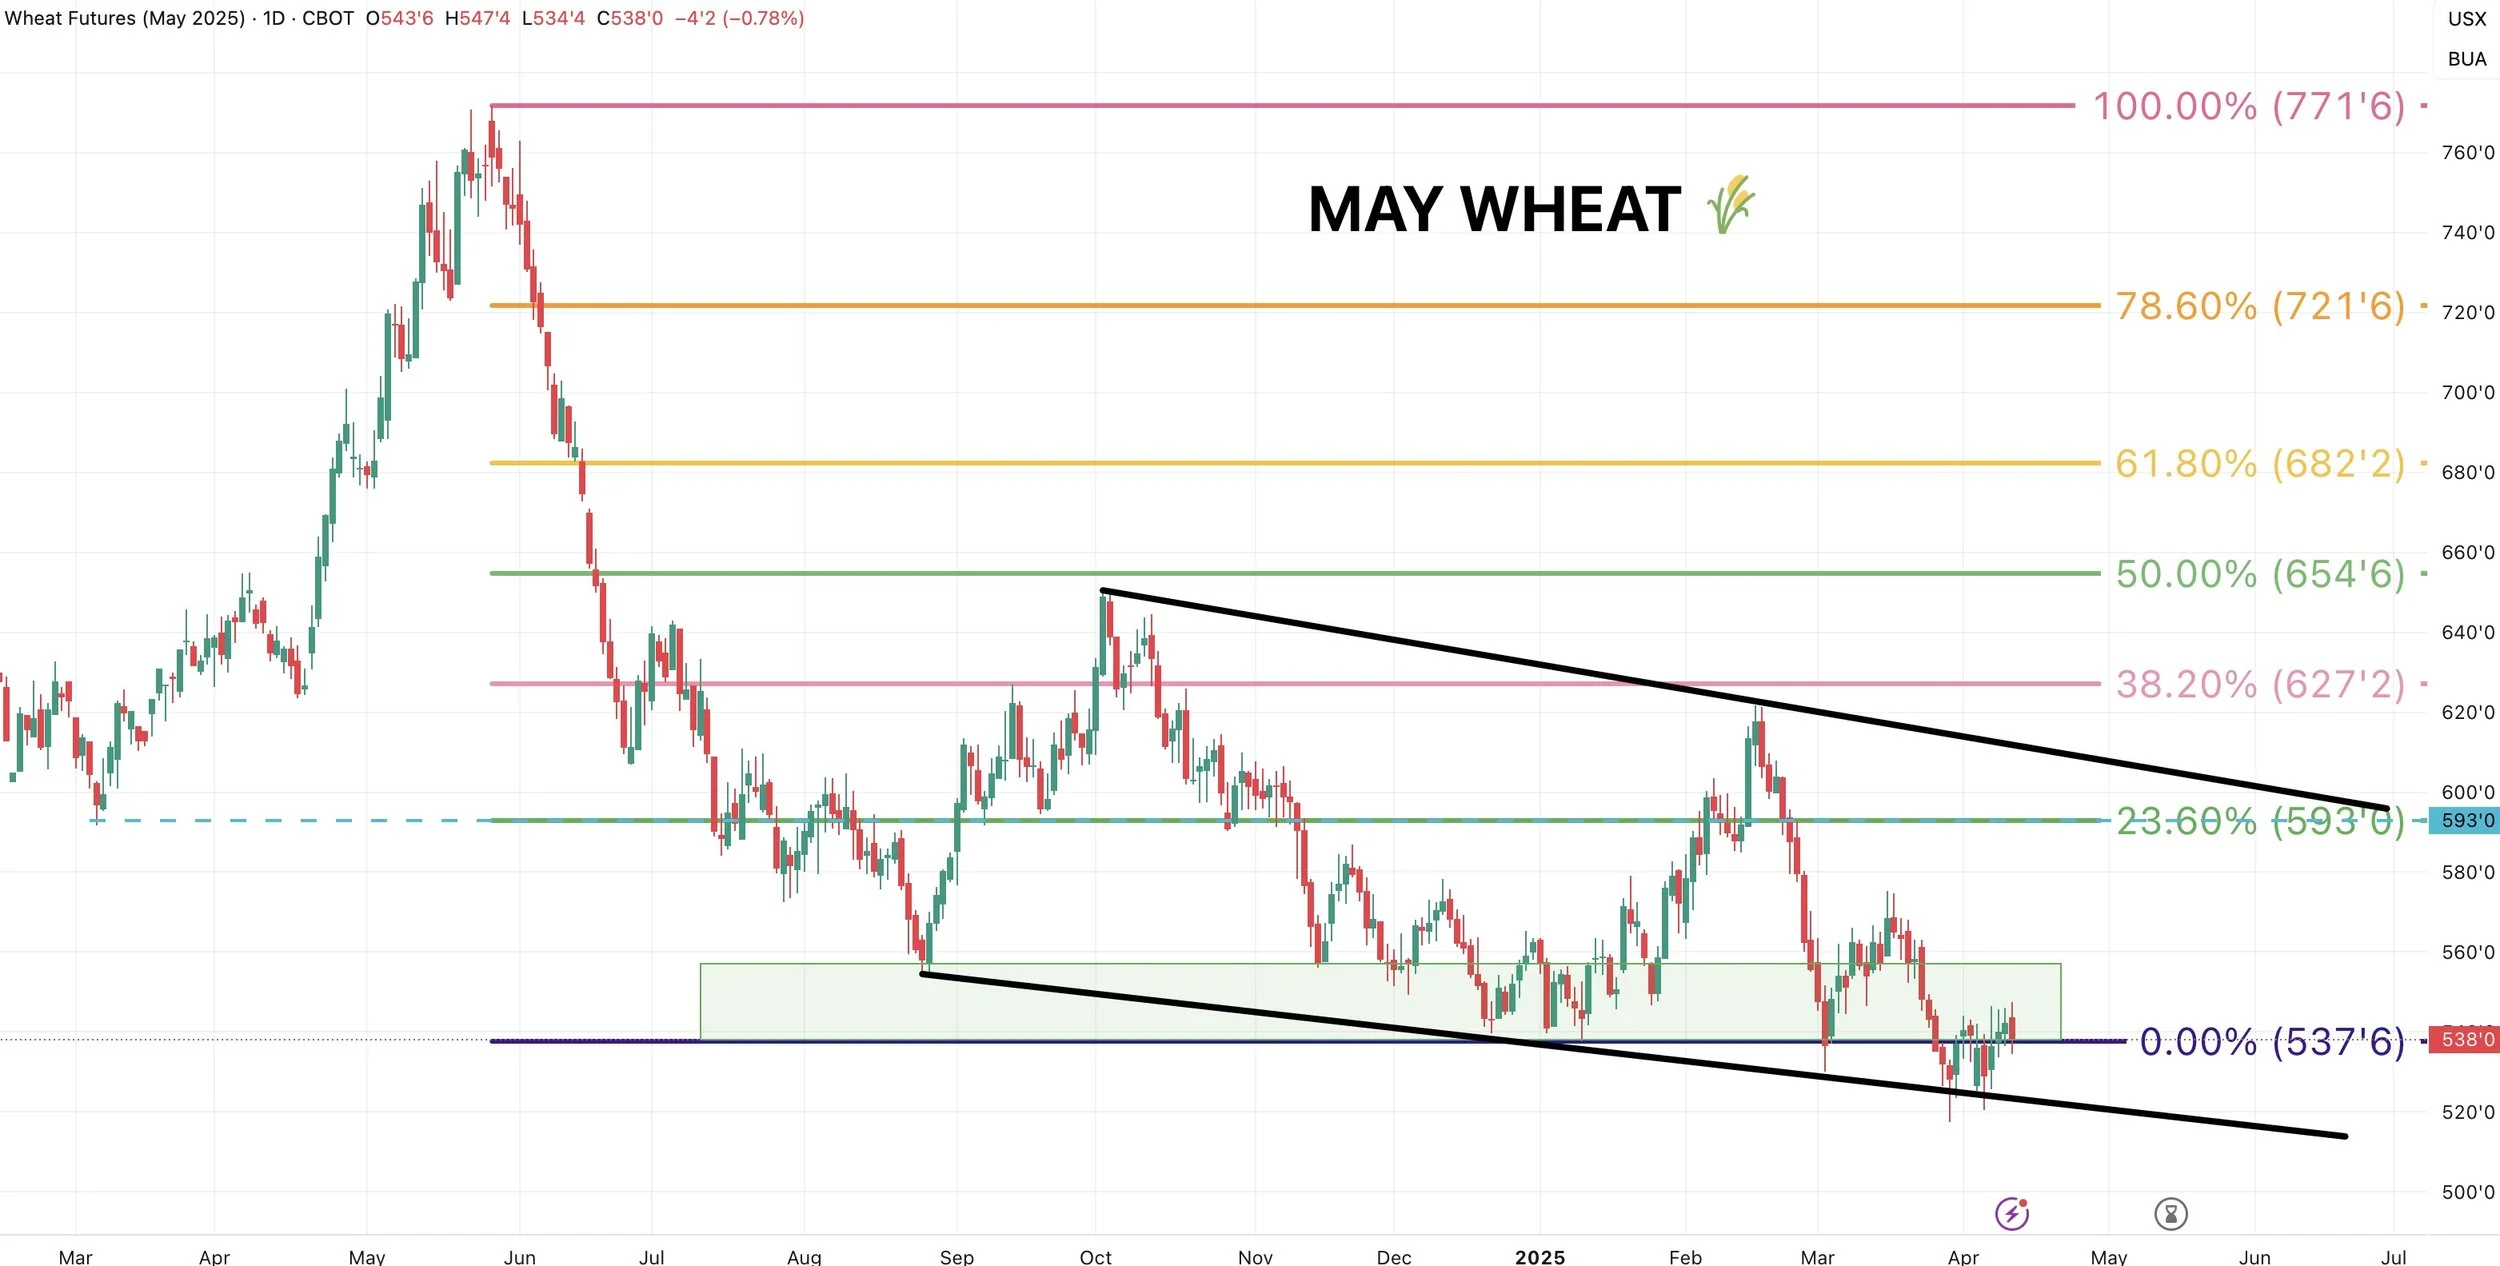
May Chicago is still simply trapped in this channel.
KC wheat still holding the support box.
As a spec, the chart is fairly simply.
Buy at support, sell at resistance. It has worked the past 7 months.
If we break above the resistance, then you wait for a re-test down back to the point of breakout to buy back in. As a break above should result in more upside.
If support fails, you sell and take your loss. (NFA)
As a producer, my next upside objective to de-risk is once again going to be the top of the range.

Past Sell or Protection Signals
We recently incorporated these. Here are our past signals.
April 10th: 🌽
Old crop corn sell signal.
March 19th: 🐮
Cattle hedge & sell signal.
Feb 18th: 🌽 🌾
Old crop KC wheat & old crop corn signal.
Jan 23rd: 🌽 🌱
Corn & beans old crop sell signal.
CLICK HERE TO VIEW
Jan 15th: 🌽 🌱
Corn & beans hedge alert/sell signal.
Jan 2nd: 🐮
Cattle hedge alert at new all-time highs & target.
Dec 11th: 🌽
Corn sell signal at $4.51 200-day MA
CLICK HERE TO VIEW
Oct 2nd: 🌾
Wheat sell signal at $6.12 target
Sep 30th: 🌽
Corn protection signal at $4.23-26
Sep 27th: 🌱
Soybean sell & protection signal at $10.65
Sep 13th: 🌾
Wheat sell signal at $5.98
May 22nd: 🌾
Wheat sell signal when wheat traded +$7.00
Want to Talk?
Our phones are open 24/7 for you guys if you ever need anything or want to discuss your operation.
Hedge Account
Interested in a hedge account? Use the link below to set up an account or shoot Jeremey a call at (605)295-3100.
Check Out Past Updates
4/9/25
TARIFFS GIVE. TARIFFS TAKE
4/8/25
CORN’S DIVERGING STRENGTH
4/7/25
SOLID PRICE ACTION DESPITE OUTSIDE FEAR
4/4/25
CORN PRICE ACTION SPEAKS VOLUME. ANY HOPE LEFT FOR SOYBEANS?
4/3/25
WHAT IS LEFT FOR CORN BEARS? TRADE WAR: CHARTS HOLDING SUPPORT
4/2/25
SHOULD UNKNOWNS KEEP A FLOOR UNDER GRAIN PRICES?
4/1/25
HOW DO ACRES IMPACT FUTURE OF THE GRAINS?
3/31/25
USDA REPORT: NOW WHAT?
3/28/25
ALL EYES ON USDA
3/27/25
PRE-USDA POSITIONING. DON’T GIVE GRAIN AWAY
3/26/25
HISTORY OF MARCH INTENTIONS. SOYBEANS UNDERVALUED?
3/25/25
6 DAYS UNTIL MAJOR USDA REPORT
3/24/25
HOW TO POSITION YOURSELF BEFORE PLANTING
3/21/25
REASONS TO BE OPTIMISTIC IN GRAINS?
3/20/25
WAS THAT THE BOTTOM IN CORN?
3/19/25
THE PATH HIGHER & THE DOWNSIDE RISKS IN GRAINS
3/18/25
SEASONALS, CATTLE HEDGE, CHARTS & DROUGHT?
3/17/25
WHEAT RALLIES. DON’T GET BACKED INTO A CORNER
3/14/25
MARCH 31ST REPORT THOUGHTS & WHAT’S NEXT FOR GRAINS
3/13/25
EXPLAINING RE-OWNERSHIP VS COURAGE CALLS
3/12/25
TARIFF FEARS. EU, CANADA, & ETHANOL
3/11/25
USDA SNOOZE. RECORD FUND SELLING A CONCERN?
3/10/25
USDA TOMORROW. GETTING COMFORTABLE IN MARKETING
3/7/25
HOW TIGHT IS THE WORLD & US SITUATION?
3/6/25
TARIFFS PUSHED BACK. FUTURE OPPORTUNITIES?
3/5/25
IS GRAINS BIGGEST RISK WEAK CRUDE & DEFLATION?
3/4/25
TRADE WAR BEGINS. 8TH DAY OF PAIN FOR GRAINS
3/3/25
TARIFFS ON TOMORROW. BUY SIGNAL
3/3/25
BUY SIGNAL
2/28/25
WHEN WILL THE BLEEDING STOP?
2/27/25
CORN AT CRITICAL SPOT. USDA ACRE REPORT. WAY TOO EARLY DROUGHT TALK
2/26/25
HISTORY SUGGESTS CORN TOP ISN’T IN? ACRE OUTLOOK TOMORROW
2/25/25
POSITIVE CLOSE. WHAT TO KNOW ABOUT USDA OUTLOOK
2/24/25
USDA OUTLOOK, FIRST NOTICE DAY & BRAZIL
2/21/25
WHAT TO EXPECT MOVING FORWARD IN GRAINS
2/20/25
FIRST NOTICE DAY CONCERNS. MASSIVE CORN ACRES OR NOT?
2/19/25
HOW TIGHT IS THE CORN SITUATION?
2/18/25
MORE DETAILS ON TODAYS SELL SIGNAL
2/18/25
OLD CROP KC WHEAT & CORN SELL SIGNAL
2/14/25
WHEAT BREAKING OUT ON WEATHER RISK. TECHNICALS & FUNDAMENTALS
2/12/25
GLOBAL GRAIN SITUATION, ACRE TALK, CHARTS & MORE
2/11/25
USDA: NOT A BEARISH REPORT. DISAPPOINTING PRICE ACTION
2/10/25
USDA TOMORROW. LONG TERM PATH FOR SUB 10% CORN STOCKS TO USE?
2/7/25
WHY WOULD THE FUNDS EXIT THEIR LONGS?
2/6/25
WHEAT FINALLY CATCHING A BID
2/5/25
COMPLETE THOUGHTS ON MARKETS: BACK & FORTH DISCUSSION
2/4/25
STRONG JANUARY LEAD TO STRONG YEAR? TARIFFS, CHARTS & MORE
2/3/25
TARIFFS PUSHED BACK
1/31/25
TARIFF NEWS ALL OVER THE PLACE. ARE YOU PREPARED FOR POSSIBILITIES?
1/30/25
WHEAT BULL ARGUMENT. TRUMP ADDS TARIFFS
1/29/25
CORN APPROACHES $5.00
1/28/25
TARIFFS, CORN FUNDS, SOUTH AMERICA & MORE
1/27/25
HEALTHY CORRECTION WE TALKED ABOUT & TARIFF NEWS
1/24/25
GRAINS DUE FOR SHORT TERM CORRECTION?
1/23/25
OUR ENTIRE NEW CROP SALES THOUGHTS & OLD CROP SELL SIGNAL
1/22/25
GRAINS TAKE A BREATHER. IS CORN IN A BULL OR BEAR MARKET?
1/21/25
HUGE DAY IN GRAINS. WHAT TO DO WITH OLD CROP VS NEW CROP
Read More
1/20/25
VIDEO CHART UPDATE
1/17/25
TRUMP, CHINA, ARGY & USING THE SPREADS INVERSE
1/16/25
OLD CROP LEADS US LOWER. MARKETING THOUGHTS
1/15/25
SIGNAL & HEDGE ALERT QUESTIONS EXPLAINED. IS $6 CORN EVEN POSSIBLE?
1/14/25
MORE DETAILS ON TODAYS HEDGE ALERT & SELL SIGNAL
1/14/25
CORN & SOYBEANS HEDGE ALERT/SELL SIGNAL
1/13/25
USDA GAME CHANGER OR NOT?
1/10/25
BULLISH USDA FOR CORN & BEANS
1/9/25
USDA OUT TOMORROW
1/8/25
2 DAYS UNTIL USDA. BE PREPARED
1/7/25
THE HISTORY OF THE JAN USDA & MORE
1/6/25
MAJOR USDA REPORT FRIDAY
Read More
1/3/25
UGLY DAY ACROSS THE GRAINS
1/2/25