
HISTORY OF MARCH INTENTIONS. SOYBEANS UNDERVALUED?
MARKET UPDATE
You can scroll to read the usual update as well. As the written version is the exact same as the video.
Timestamps for video:
March Intentions History: 0:55min
Corn: 4:00min
Soybeans: 9:20min
Wheat: 13:15min
Want to talk about your situation?
(605)295-3100
Miss last weeks offer?
Before your trial expires.. here is extended access: Click Here
Futures Prices Close

Overview
Very little fresh news today as all eyes are on the report Monday.
Today's price action was ugly as corn broke below the 200-day MA and some key support (which I will touch on later).
What was the reason for the weakness?
All around we simply lack fresh news to feed the bulls.
It looks like the trade is pricing in bigger acres in corn.
There is still concerns surrounding tariffs, this had the stock market under heavy pressure.
As Trump announced auto tariffs which has the market thinking other countries will retaliate.

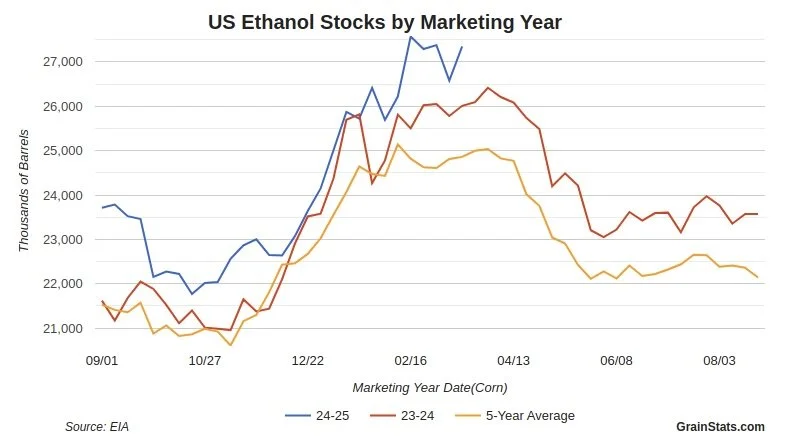
We also had disappointing ethanol numbers out today.
Falling more than expected to 8 week lows.
At the same time, ethanol stocks rose more than expected.
This is negative for ethanol demand on the corn balance sheet.
Charts from GrainStats

History of March Intentions
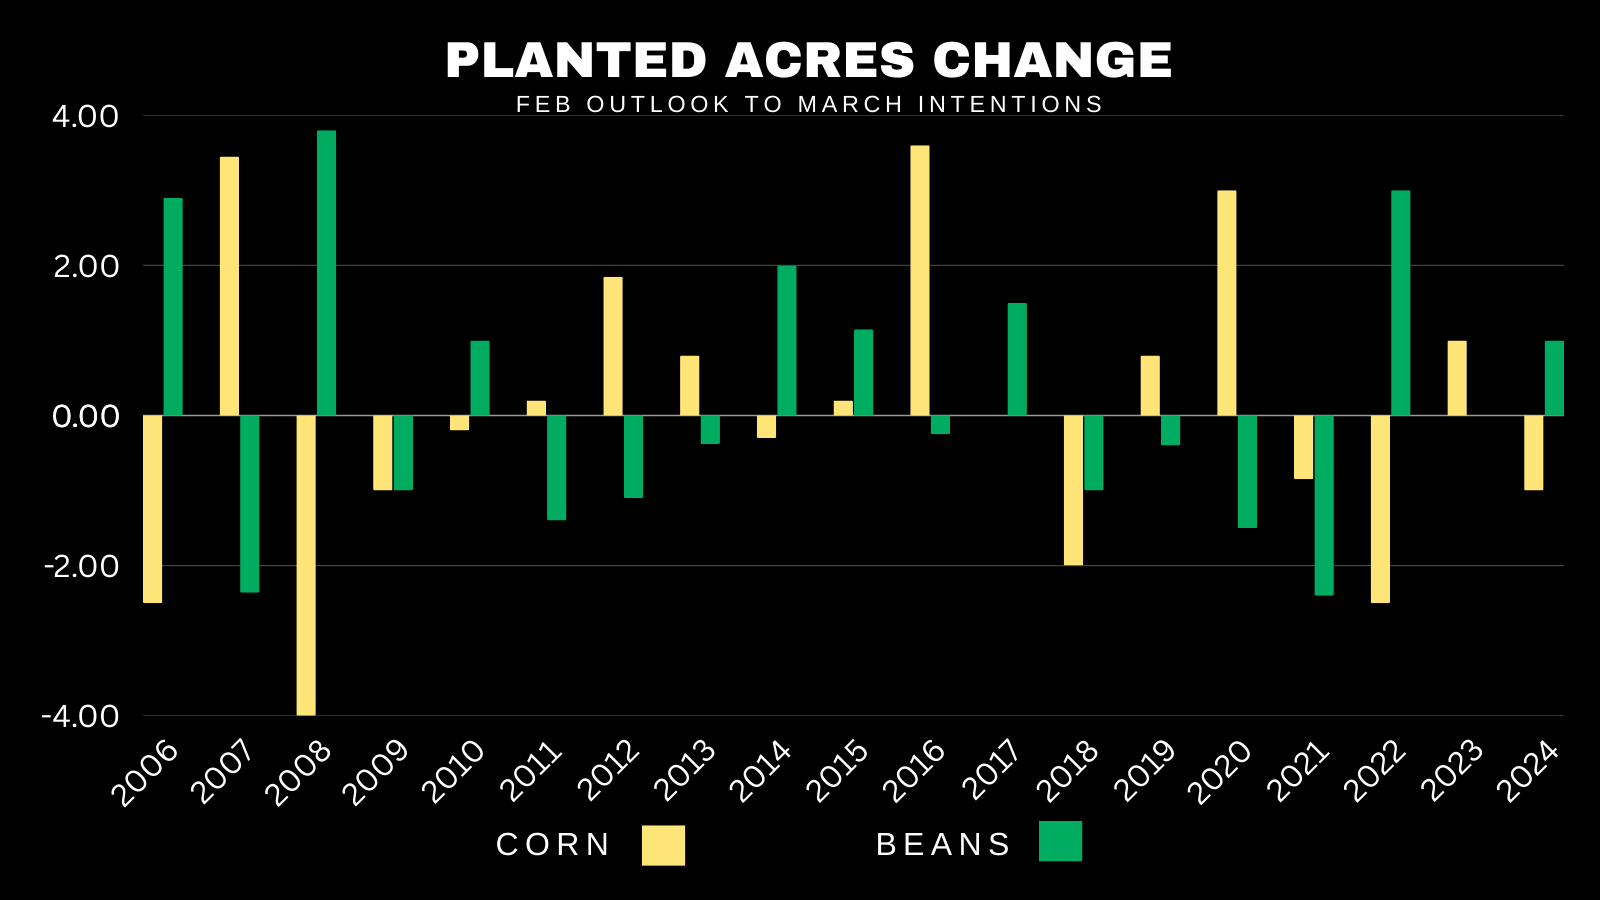
First let's look at actual acres.
Here is a chart showing how acres changed from the Feb outlook to the March intentions report.
Corn came in noticeably higher 7 times, lower 7 times, and virtually unchanged 5 times.
Soybeans came in noticeably higher 8 times, lower 7 times, and virtually unchanged 4 times.
The point is, this report is essentially a coin flip.
Average Acre Change:
Corn: +/- 1.53 acres
Beans: +/- 1.48 acres
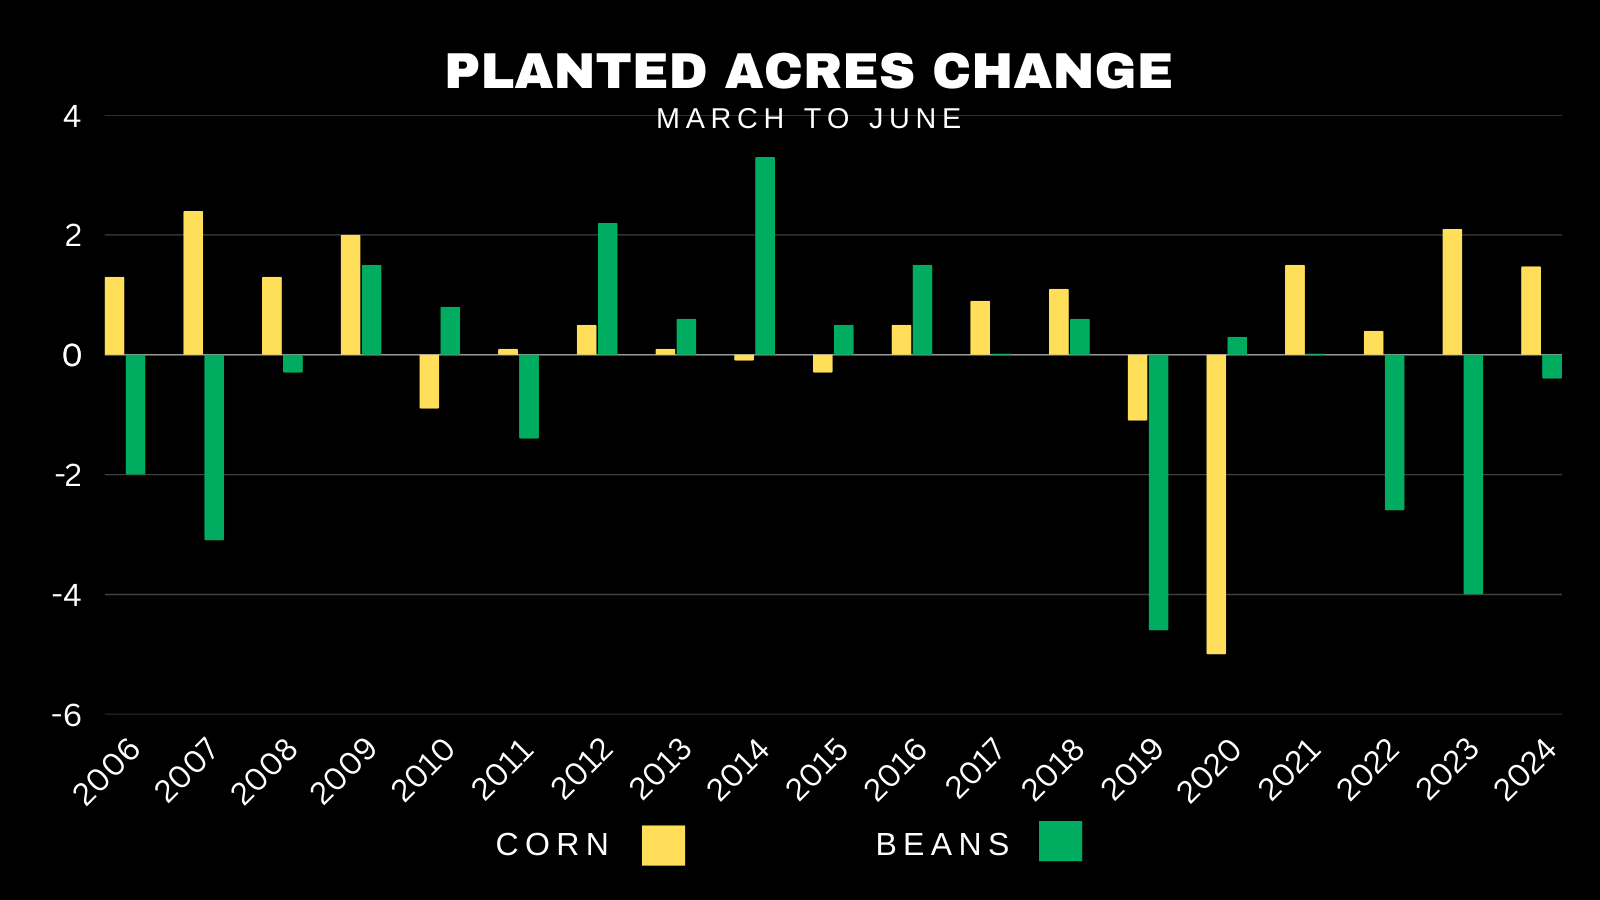
Now here is how acres have changed from the March intentions to the real June report.
Corn acres have risen 4 straight years. Coming in higher the past 7 of 9 years. That is a real tendency.
Soybean acres have fallen 3 straight years and have not came higher since 2018.
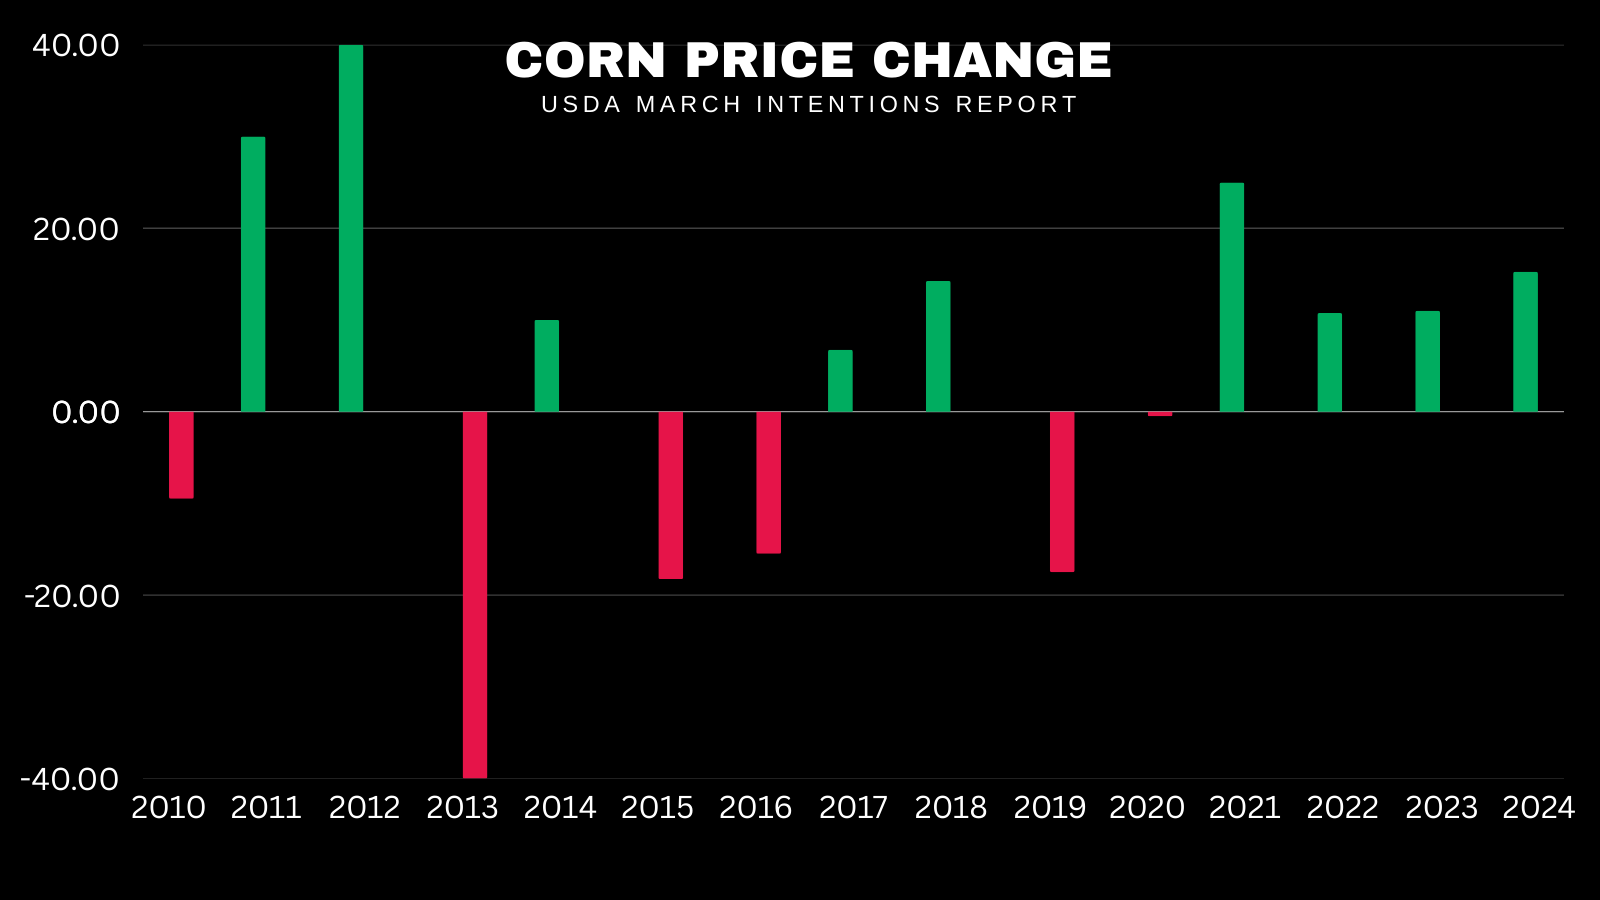
Now here is the price performance from this report.
Corn has traded higher 4 years in a row. Ending the day green 6 of the past 8 years.
This report is a market mover.
The average price change is 17 cents.
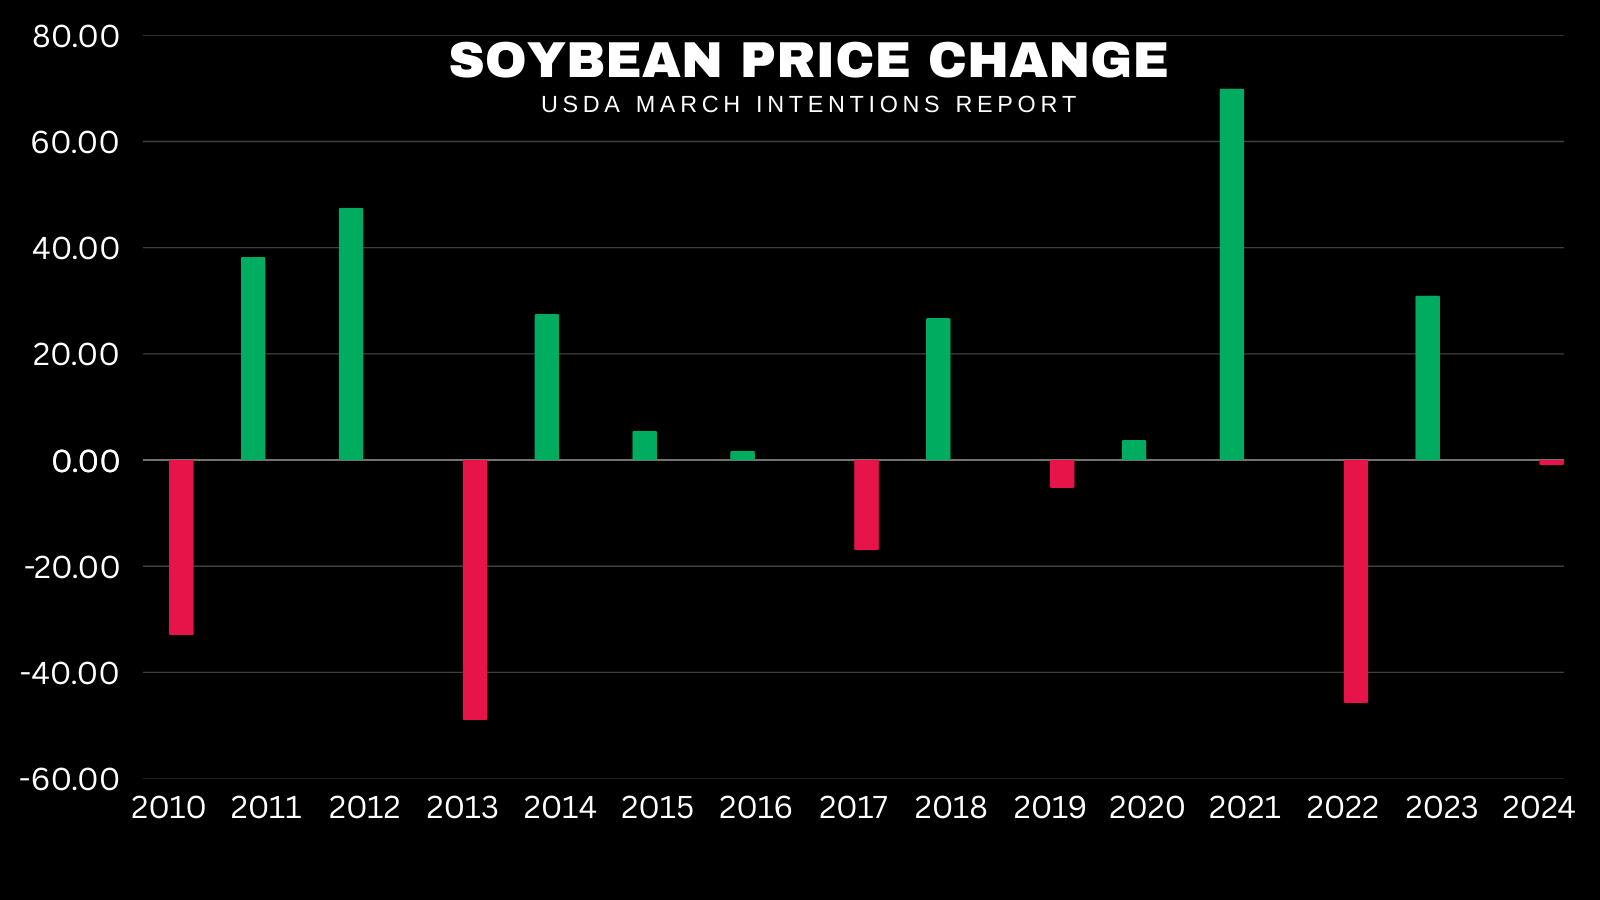
Here is soybeans.
No trend. However, we have only taken it on the chin 4 of the past 15 years.
But this report can be a major market mover.
In 2013 we dropped -50 cents.
In 2021 we rallied +70 cents.
The average price change is 25 cents.
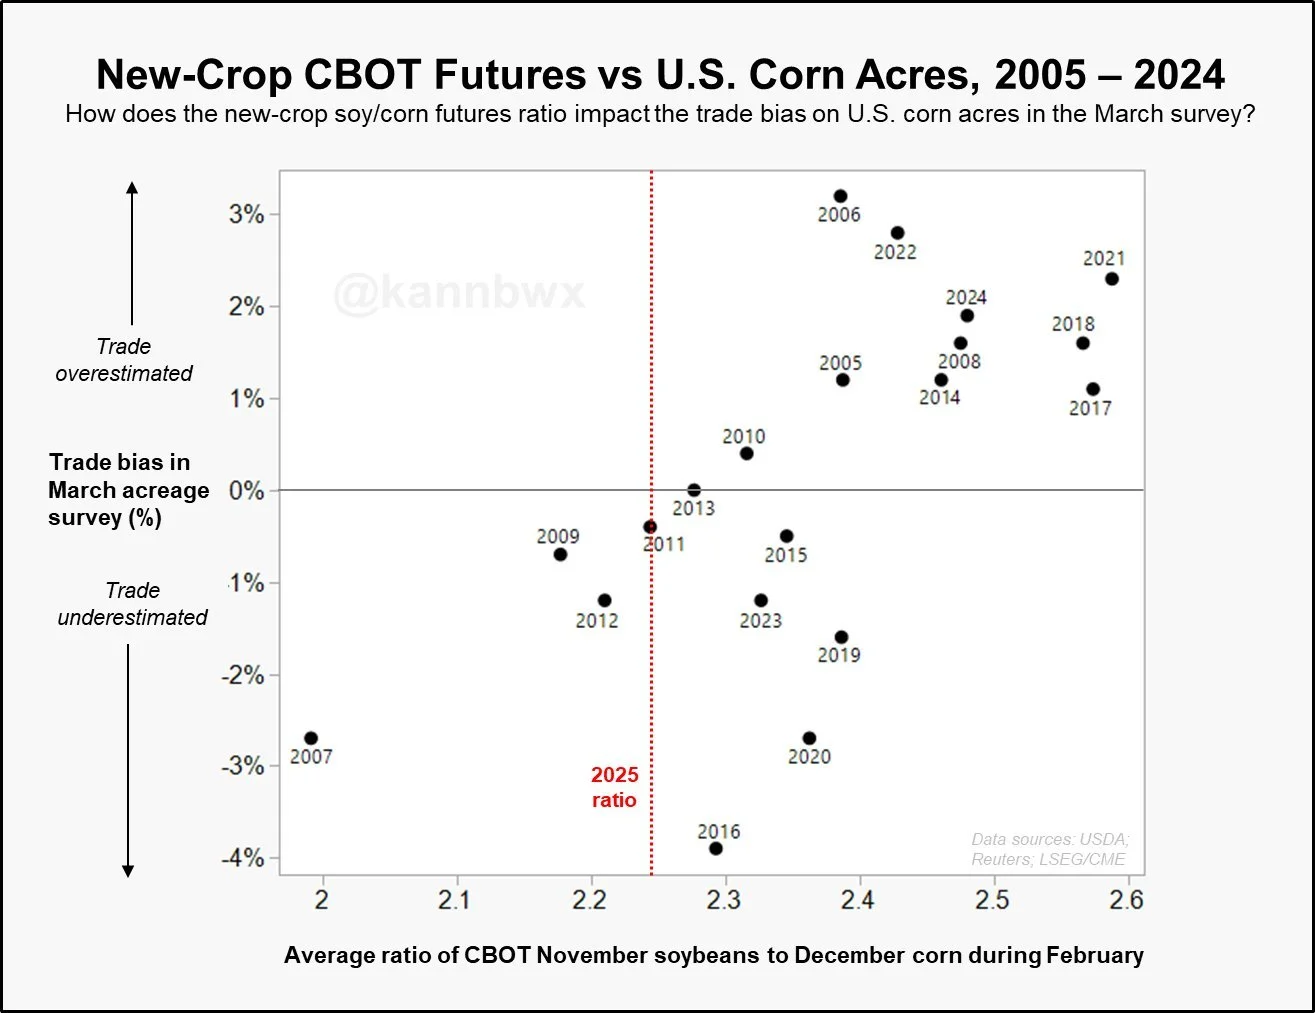
Lastly here is a chart from Karen Braun.
She found that March corn acres have never surprised lower when the soybean to corn ratio is 2.3 or lower (currently at 2.24).
So this would suggest that we likely do not see corn acres surprise low.
Report Estimates
Per Karen Braun from Reuters:
For corn acres the trade has a larger range of estimate than normal.
3 of the 22 analyst predict corn acres to come in higher than 95 million.
Analysts predict soybeans to drop nearly 4% vs last year, which is the largest drop analysts have predicted on the March report since 2007.

Analysts see corn stocks falling vs last year while they see both soybeans & wheat higher vs last year.
The trade range for corn is the smallest since 2007.
The trade range in soybeans is the smallest in 10 years.
A small trade range can open the door for surprises if we see a big miss to one side.
So stocks might be the an even more important factor than acres come Monday.

Today's Main Takeaways
Corn
Fundamentals:
I have shown you several examples of how tight the world corn situation is. Here is yet another example.
The USA, Ukraine, Brazil, and Argentina export roughly 80% of the world's corn. A huge number.
Here is how each of these countries individual corn S&D situations currently looks like.
🇺🇦 Ukraine:
They are the 3rd tightest ever. Only behind 2019 and 2021.
🇦🇷 Argentina:
They are their tightest since 2012 and their 2nd tightest ever.
🇧🇷 Brazil:
They are their tightest of all-time.
🇺🇸 USA:
We are not extremely tight. Sitting at the 9th tightest in 20 years (10.19%). However, we are far from bearish like we were from 2015-2019.
If you combine all of these countries together, they are the 3rd tightest ever, Only behind 2021 and 2012.
No, this does NOT mean corn has to go tremendously higher. It simply amplifies the fact that the world cannot handle any losses in the US crop.
This means that IF we see a weather scare, it will influence the market more than it normally would.

Here is another interesting chart and argument bulls could make.
This shows corn price & US stocks to use ratio.
Currently the US corn situation is the tightest since March 2023.
Prices are on par with fall of 2023 when our stocks to use was at 15% vs 10.2% today.
Essentially prices are the same as they were when the supply & demand situation was a lot looser.

Bottom line, I still think corn is undervalued here moving forward.
The global situation can’t handle a hiccup in the US, and I'd like to think we some sort of weather opportunity come into play despite higher acres likely going to weigh on the balance sheet in the future.
The funds have sold a massive amount of their longs but aren’t getting "short". Their money is simply on the sidelines.
I don’t see any reason why they would actually get short corn. They know the world situation is tight. They know the US farmer is heavily sold. It doesn’t make sense to risk being short heading into summer for them.
As for the report, stocks will be just as important as acres.
I doubt the acres will be bullish. But unless we get some massive corn acres, I think the market has already priced in bigger acres. We have sold off going into the report, so we could see a little "sell the rumor, buy the fact". Where if acres come in around estimates, we trade higher as it was priced in already.
Technicals:
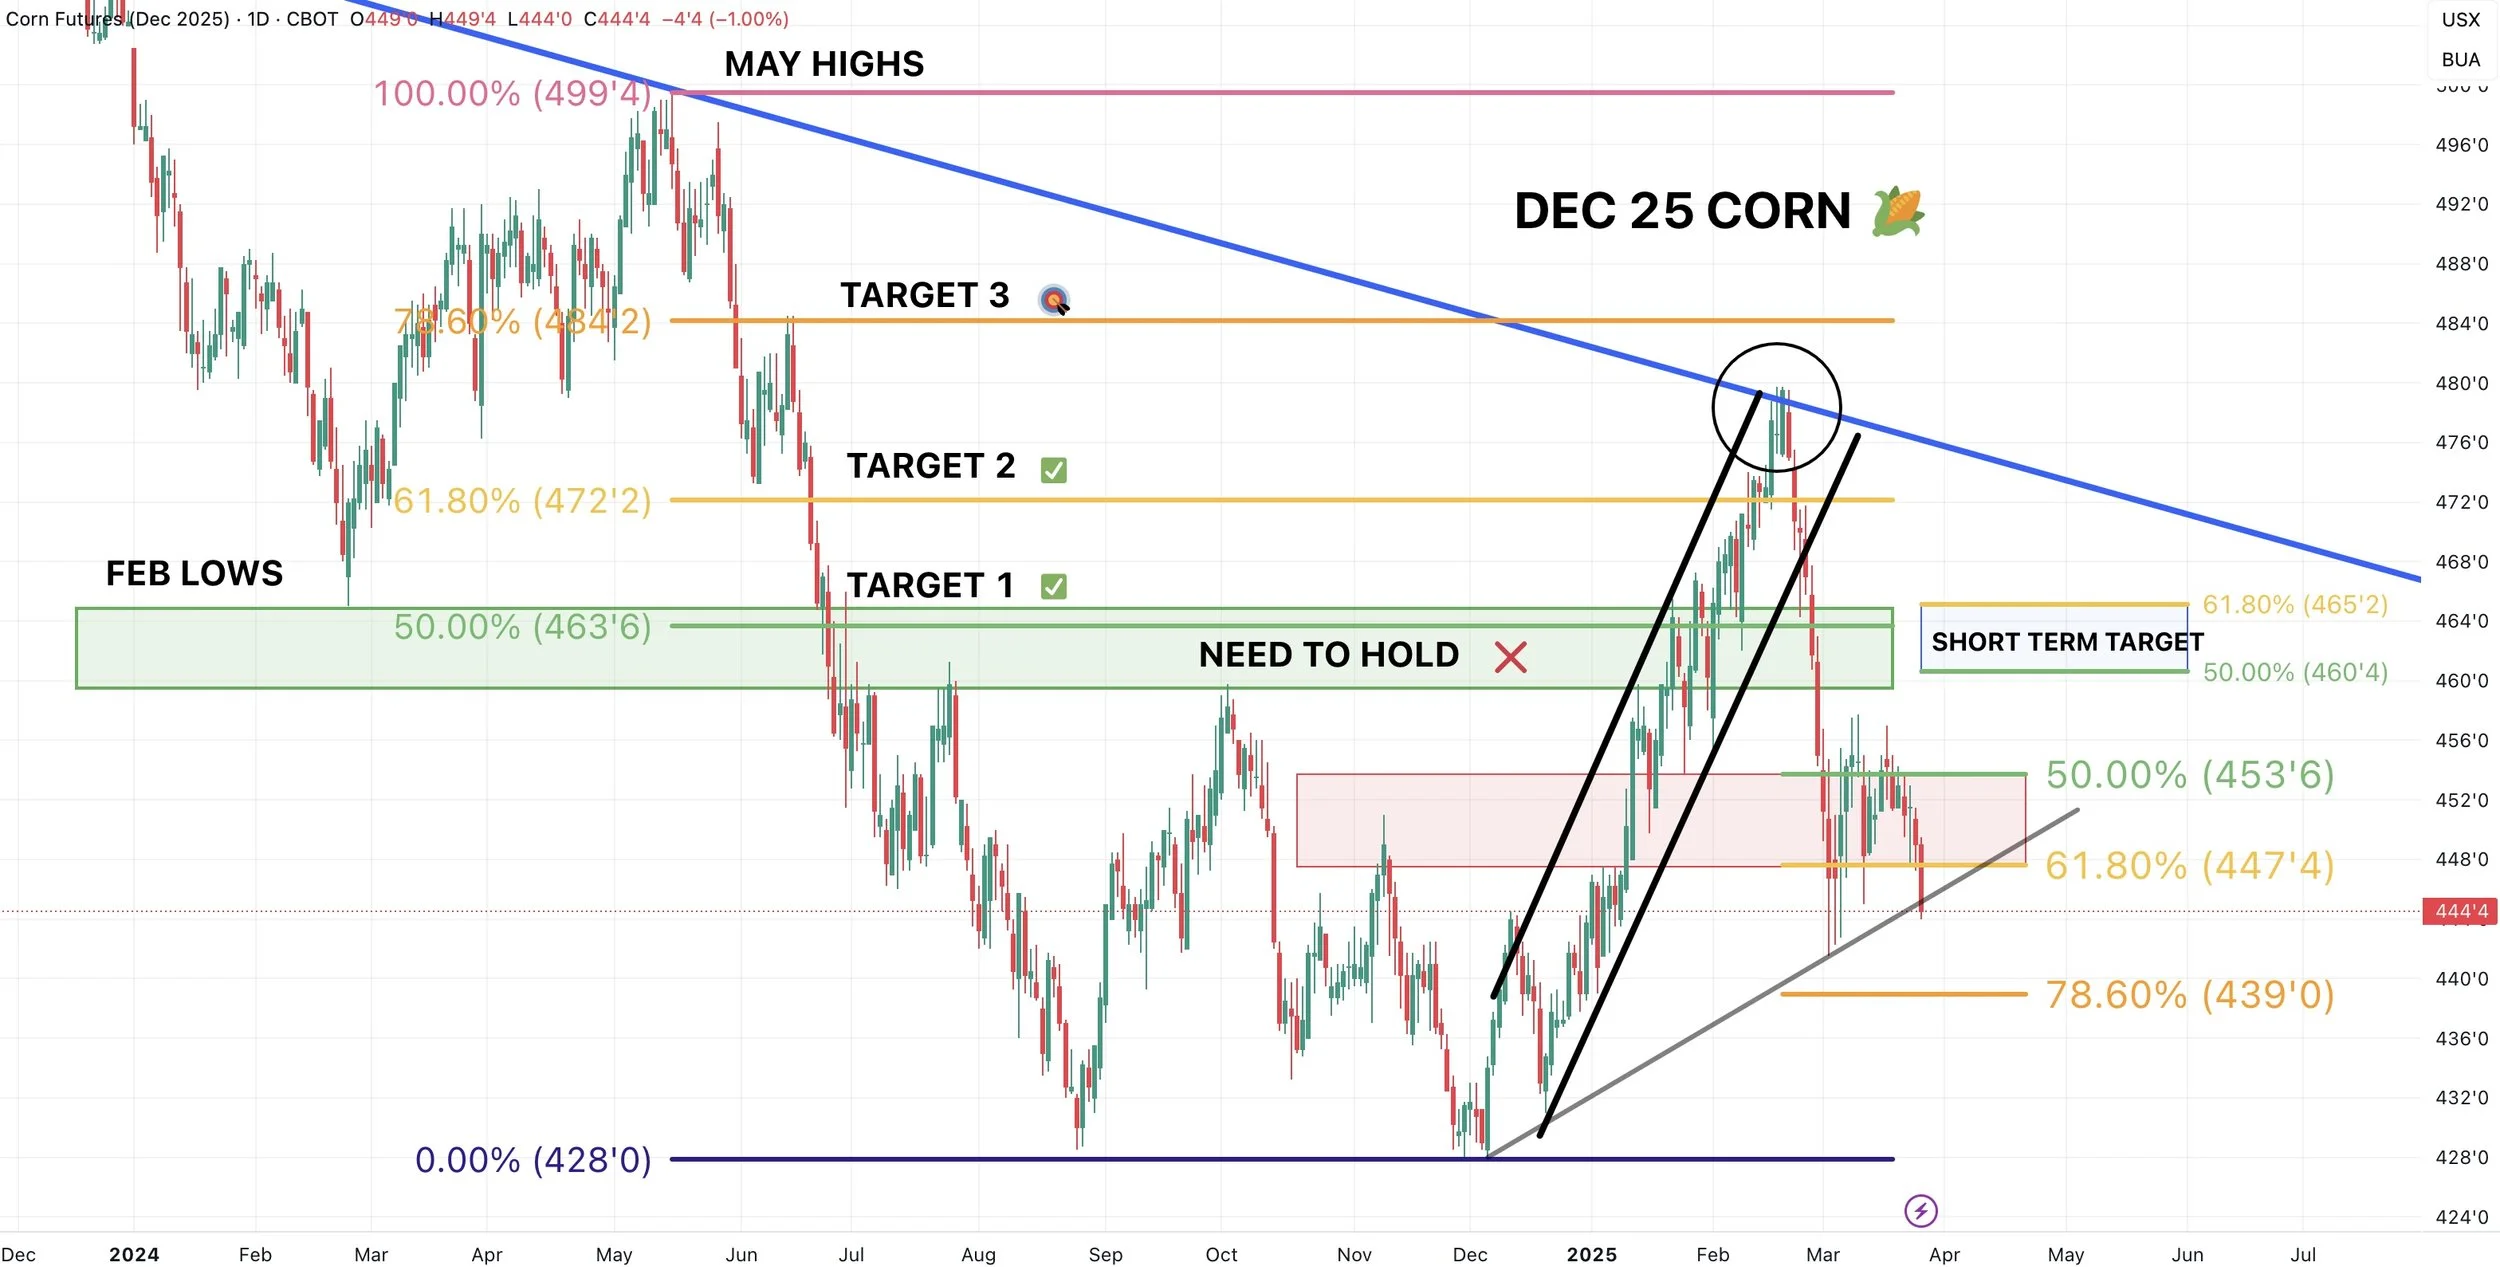
May corn broke key support today, and I am surprised it happened before such a major report.
Why this was key support:
1) 61.8% of the entire rally from $4.14 contract lows to the Feb highs of $5.14 is $4.54
2) 61.8% of this mini rally is $4.56
3) This level was key resistance in Oct, Nov, & Dec. Now support
4) $4.54 is the 200-day MA
If we get a negative report, the next level of major support is $4.36 which is 78.6% of the entire rally. (orange line)

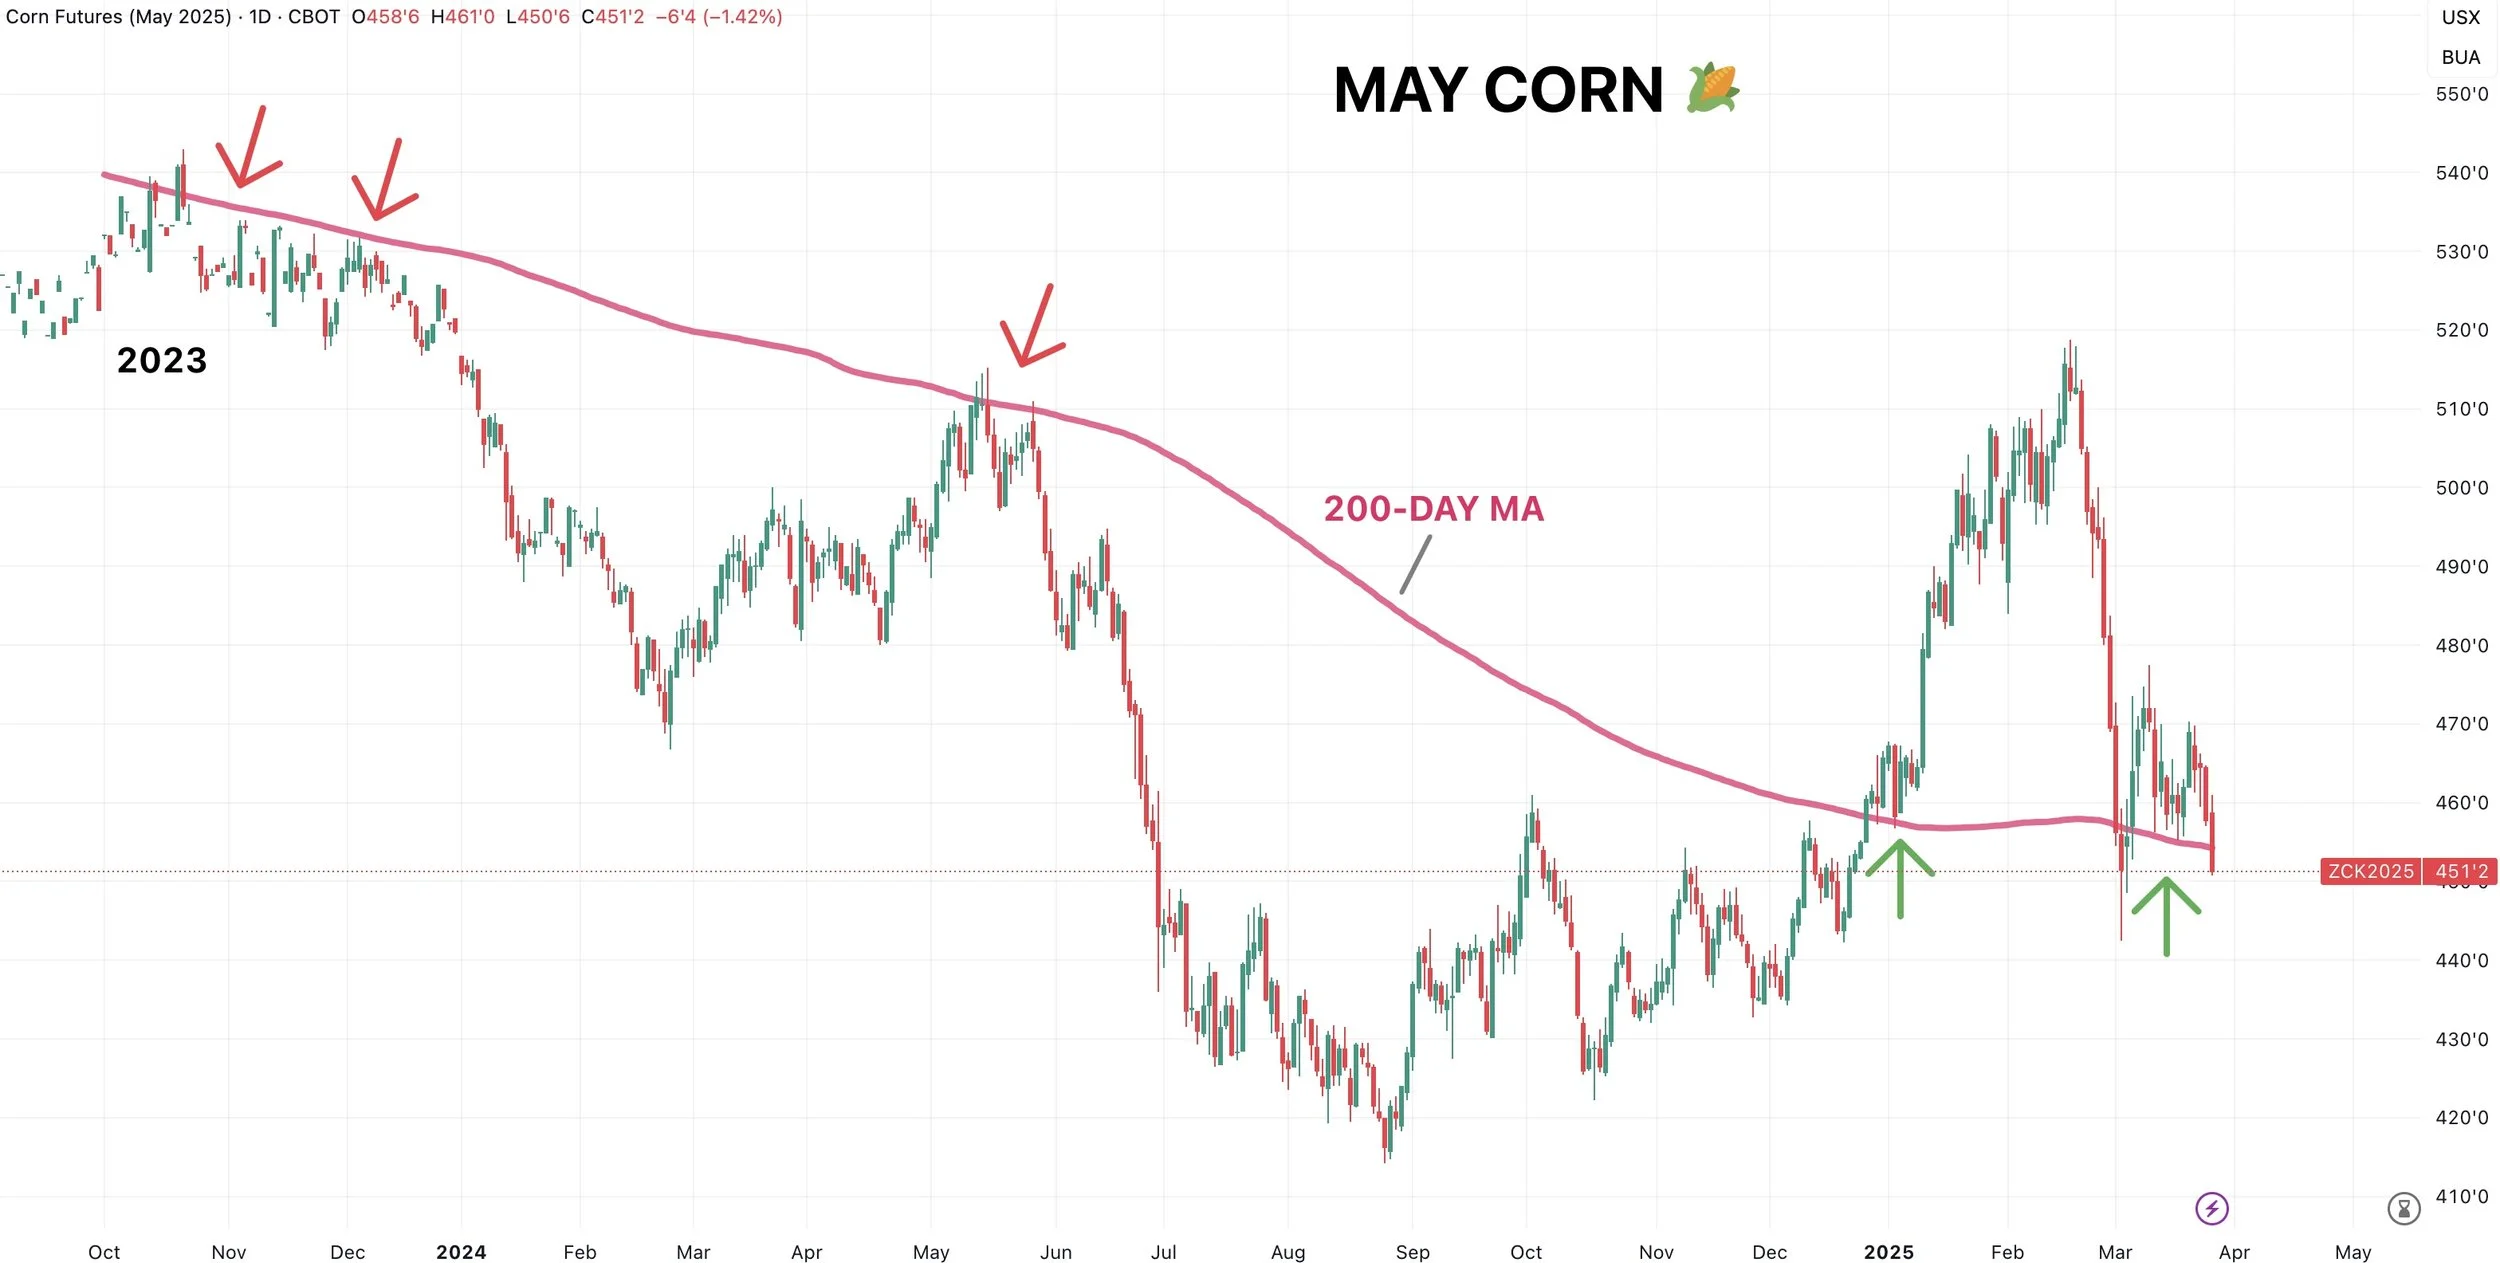
Here is a better visual of the 200-day MA and why it is so important.
It kept a lid on corn since 2023, that large of resistance should be heavy support.
We closed below this today, normally this would be a bad sign (it is still not a good sign).
However this could simply be a "head fake" before the report. This price action would make me a lot more nervous if it wasn’t happening right before a market moving report.
On March 4th we closed below the 200-day MA then reversed higher immediately. If we stay below this for more than a few days then it will be a negative sign.
As the 200-day MA is simply a "trend indicator". Above it signals the trend is higher, below signals the trend is lower.
Again, we are selling off going into the report. What happens if the report isn’t as bearish as everyone thinks it will be? The market has to re-price what it just sold.
July corn is still holding it's 200-day MA by a thread.
Sitting right at it.
Still also holding the 61.8% retracment of the entire rally.
Uptrend also in tact still.
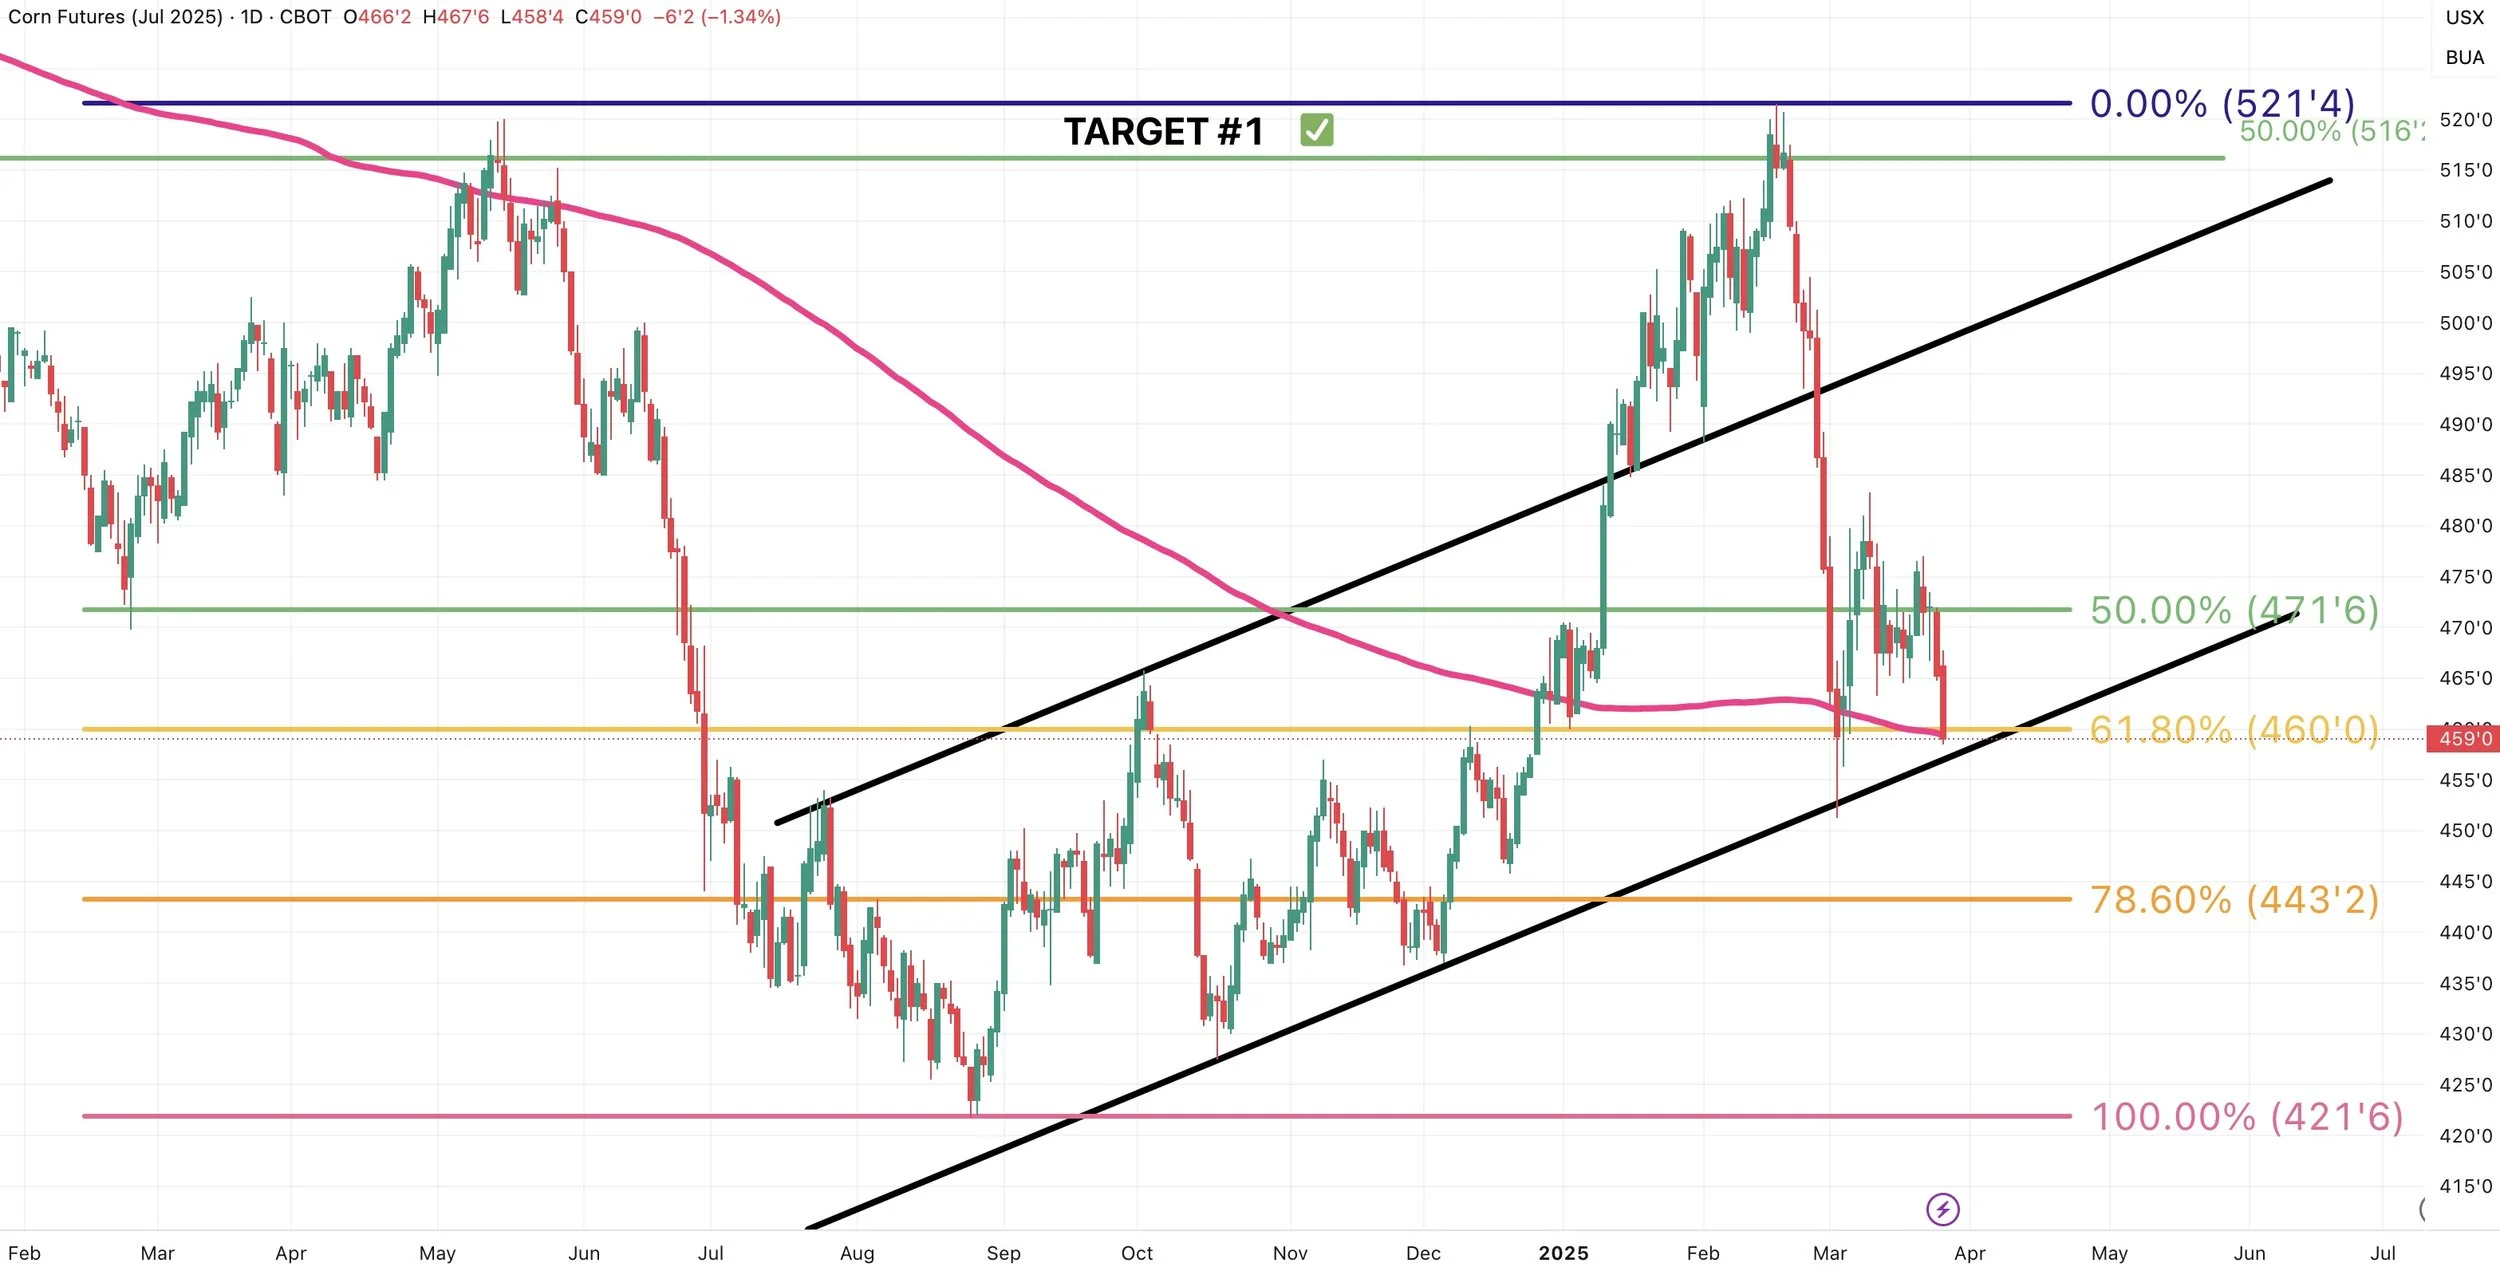
Just like May corn, we broke support in Dec.
So not a great look, but could easily be one of those head fakes before the report.
If the report is indeed bearish like the market thinks it will be, the next level of support is $4.39 (78.6% of the entire rally)
Soybeans
Fundamentals:
The US soybean situation isn’t "bullish" but it has tightened up quiet a bit since last summer.
As it is the tightest since March of last year.
Just like corn, the US soybean situation is tighter right now than it was when beans were +$1.00 higher.
Meaning bulls could very well make the argument beans are "undervalued" here.
Less acres in the US could very easily lead this to getting tighter.
Fun fact: the low in soybeans last year was $9.55 and we are expected to plant 3 million less acres vs last year.

Despite the bearish global picture and record crop out of Brazil, this is the most "bullish" I have been on soybeans in a while.
For the past several months I found it hard to make a bull case for higher prices, as the global story was the 2nd most bearish of all time and the US situation didn’t scream higher prices either.
However, soybeans have now endured every bearish factor out there. The record harvest out of Brazil is now out of the way.
Below is the current new crop balance sheet from the Feb outlook.
With a yield of 52.5 bpa, they have our stocks to use at 7.20%. Which is not bullish, but quiet a bit less than last summers near 13%.

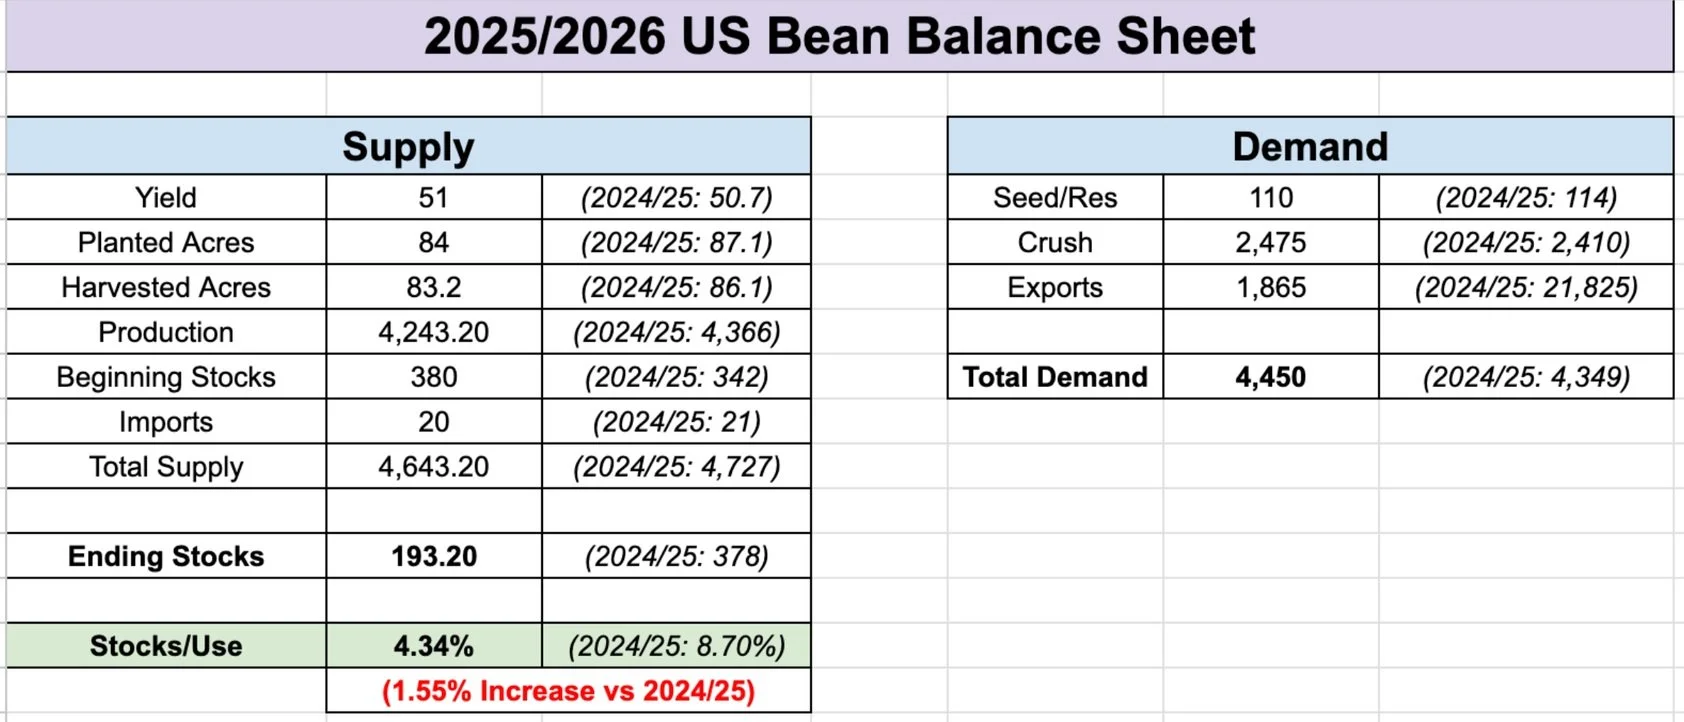
Here is that same balance sheet with a yield of 51 bpa instead.
This would drop our stocks to use below 5%.
Which is where it was back in late 2022 when soybeans were $13 to $15.
This balance sheet does not take any demand changes into account, as there will changes. But to ration demand, prices will have to head higher.
I am not saying beans are going to +$13 by any means. I am just saying that if we do not have an ideal growing season or record yield, the pathway for new crop beans to get tight is there.
Bottom line, despite all of the bearish tailwinds, record global production, and a monster crop out of Brazil. I believe soybeans are becoming undervalued here and there is a clear path to higher prices unless we have some amazing growing season or a trade war.
Lastly, here are some thoughts from the highly respected Grains Gorilla. He was a known bear for a while, but provides facts on why he thinks soybeans are miss priced here. Some great thoughts:
Technicals:
The chart for soybeans is simple and has not changed as we've gone sideways.
This is a must hold level. We have found support here for grueling 276 days (outside of the slip up in December).
It is also 61.8% of the entire rally off contract lows.
If we can hold this level, it sets up a potential massive inverse head & shoulders pattern (bullish pattern).
A close above the 100-day MA would be the first step in saying we might’ve put in a bottom.

Same set up in Nov beans.

Wheat
Fundamentals:
I am not going to touch on wheat a ton here.
We are seeing some pressure from an expected Russia & Ukraine war deal. Which doesn’t really make sense anyways as the war hasn’t provided a rally in 2 years.
The bigger piece of this is that the US stated they would agree to help Russia boost their exports in the Black Sea. Now this is a bearish factor as Russian wheat exports are projected to be down -30% the past 2 years (which is bullish as it means less competition).
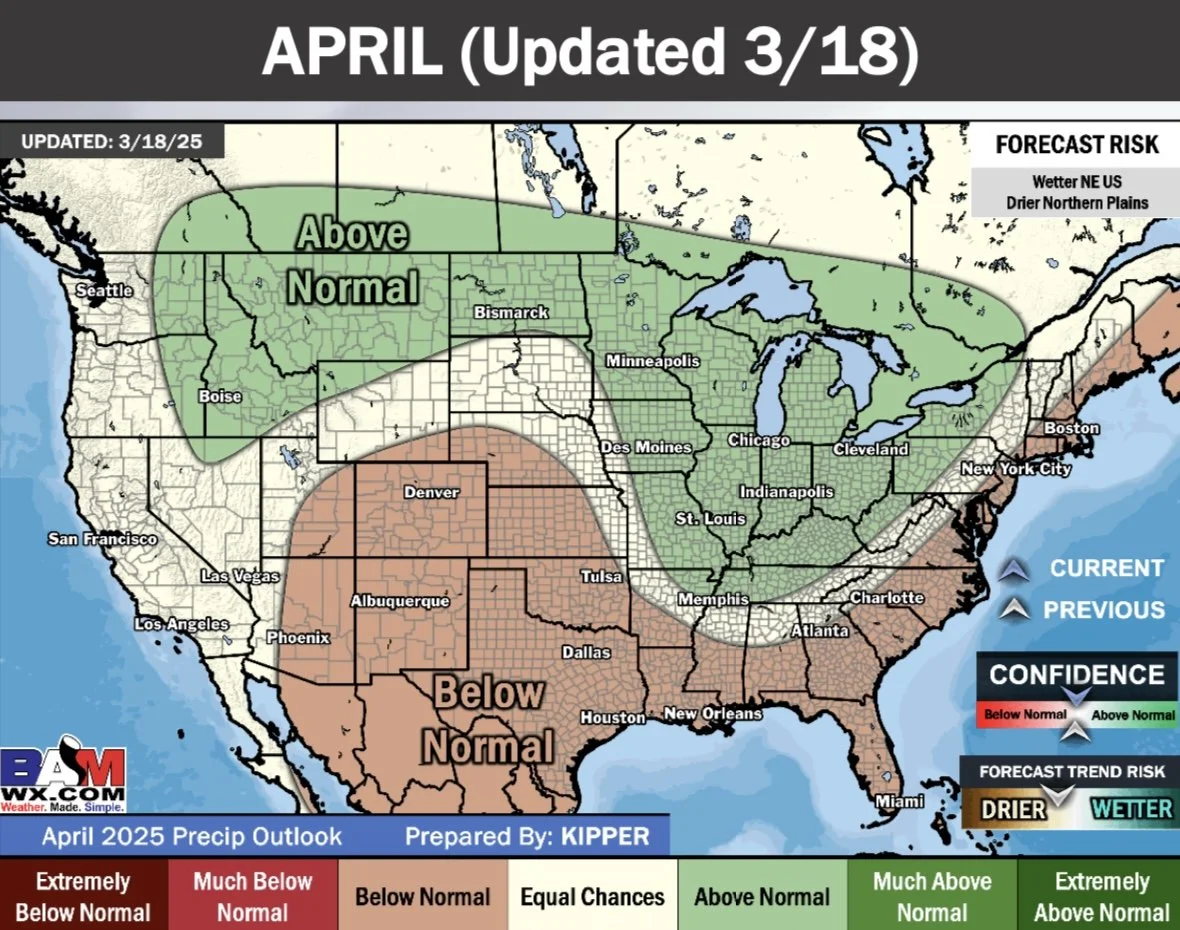
The key growing winter regions have been dry and the forecasts look dry for the next several months.

The global wheat situtation is the tightest in a decade.
Russian wheat stocks are down -35% year over year.
Spring wheat acres could very well fall to an all-time low this year.
Bottom line, just don’t see how wheat is not undervalued here moving forward. Have no interest making sales at these levels personally and won’t below $6.00
Technicals:
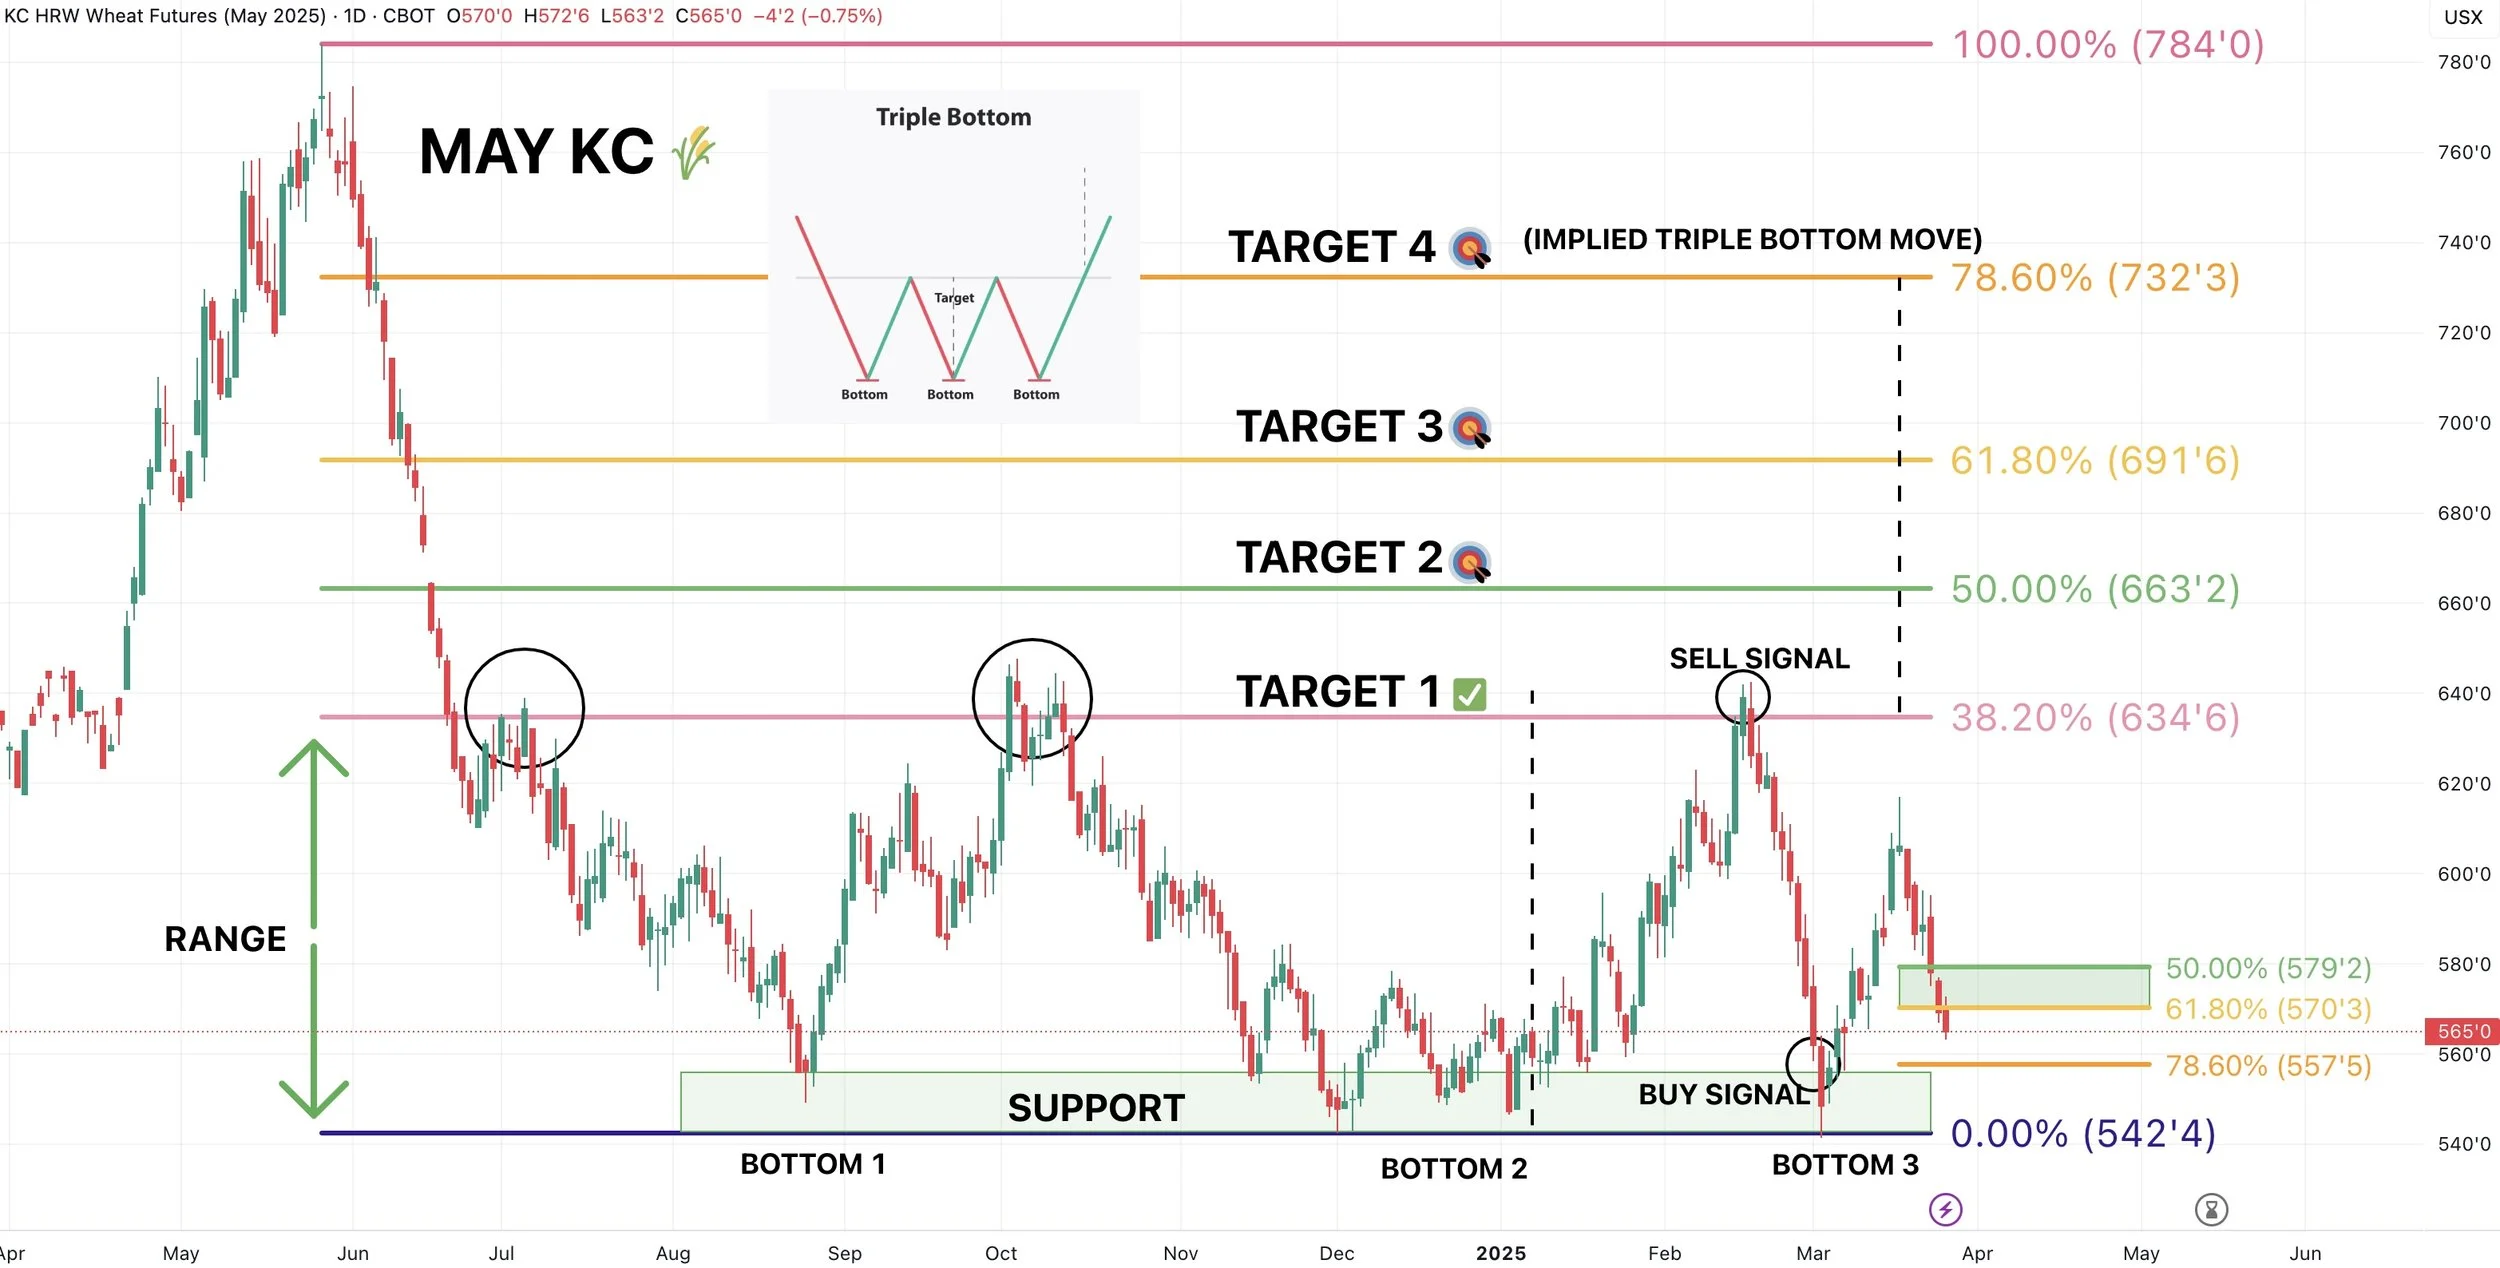
KC wheat is currently below the golden retracement (61.8% of the recent rally). So not the greatest sign here short term.
Next support level is $5.57 (78.6% of the recent rally)
Either way, we are simply trapped in this massive range from the recent lows to the Feb highs. We've been stuck here since last July.
If we can crawl above the Feb highs, then it opens the door a lot higher.
As long as the bottom holds, no concerns.
May wheat simply trapped in this channel.
A test of the bottom of the channel would mean new lows.
Next upside objective is another test of the top of the channel.

Past Sell or Protection Signals
We recently incorporated these. Here are our past signals.
March 19th: 🐮
Cattle hedge & sell signal.
Feb 18th: 🌽 🌾
Old crop KC wheat & old crop corn signal.
Jan 23rd: 🌽 🌱
Corn & beans old crop sell signal.
CLICK HERE TO VIEW
Jan 15th: 🌽 🌱
Corn & beans hedge alert/sell signal.
Jan 2nd: 🐮
Cattle hedge alert at new all-time highs & target.
Dec 11th: 🌽
Corn sell signal at $4.51 200-day MA
CLICK HERE TO VIEW
Oct 2nd: 🌾
Wheat sell signal at $6.12 target
Sep 30th: 🌽
Corn protection signal at $4.23-26
Sep 27th: 🌱
Soybean sell & protection signal at $10.65
Sep 13th: 🌾
Wheat sell signal at $5.98
May 22nd: 🌾
Wheat sell signal when wheat traded +$7.00
Want to Talk?
Our phones are open 24/7 for you guys if you ever need anything or want to discuss your operation.
Hedge Account
Interested in a hedge account? Use the link below to set up an account or shoot Jeremey a call at (605)295-3100.
Check Out Past Updates
3/25/25
6 DAYS UNTIL MAJOR USDA REPORT
3/24/25
HOW TO POSITION YOURSELF BEFORE PLANTING
3/21/25
REASONS TO BE OPTIMISTIC IN GRAINS?
3/20/25
WAS THAT THE BOTTOM IN CORN?
3/19/25
THE PATH HIGHER & THE DOWNSIDE RISKS IN GRAINS
3/18/25
SEASONALS, CATTLE HEDGE, CHARTS & DROUGHT?
3/17/25
WHEAT RALLIES. DON’T GET BACKED INTO A CORNER
3/14/25
MARCH 31ST REPORT THOUGHTS & WHAT’S NEXT FOR GRAINS
3/13/25
EXPLAINING RE-OWNERSHIP VS COURAGE CALLS
3/12/25
TARIFF FEARS. EU, CANADA, & ETHANOL
3/11/25
USDA SNOOZE. RECORD FUND SELLING A CONCERN?
3/10/25
USDA TOMORROW. GETTING COMFORTABLE IN MARKETING
3/7/25
HOW TIGHT IS THE WORLD & US SITUATION?
3/6/25
TARIFFS PUSHED BACK. FUTURE OPPORTUNITIES?
3/5/25
IS GRAINS BIGGEST RISK WEAK CRUDE & DEFLATION?
3/4/25
TRADE WAR BEGINS. 8TH DAY OF PAIN FOR GRAINS
3/3/25
TARIFFS ON TOMORROW. BUY SIGNAL
3/3/25
BUY SIGNAL
2/28/25
WHEN WILL THE BLEEDING STOP?
2/27/25
CORN AT CRITICAL SPOT. USDA ACRE REPORT. WAY TOO EARLY DROUGHT TALK
2/26/25
HISTORY SUGGESTS CORN TOP ISN’T IN? ACRE OUTLOOK TOMORROW
2/25/25
POSITIVE CLOSE. WHAT TO KNOW ABOUT USDA OUTLOOK
2/24/25
USDA OUTLOOK, FIRST NOTICE DAY & BRAZIL
2/21/25
WHAT TO EXPECT MOVING FORWARD IN GRAINS
2/20/25
FIRST NOTICE DAY CONCERNS. MASSIVE CORN ACRES OR NOT?
2/19/25
HOW TIGHT IS THE CORN SITUATION?
2/18/25
MORE DETAILS ON TODAYS SELL SIGNAL
2/18/25
OLD CROP KC WHEAT & CORN SELL SIGNAL
2/14/25
WHEAT BREAKING OUT ON WEATHER RISK. TECHNICALS & FUNDAMENTALS
2/12/25
GLOBAL GRAIN SITUATION, ACRE TALK, CHARTS & MORE
2/11/25
USDA: NOT A BEARISH REPORT. DISAPPOINTING PRICE ACTION
2/10/25
USDA TOMORROW. LONG TERM PATH FOR SUB 10% CORN STOCKS TO USE?
2/7/25
WHY WOULD THE FUNDS EXIT THEIR LONGS?
2/6/25
WHEAT FINALLY CATCHING A BID
2/5/25
COMPLETE THOUGHTS ON MARKETS: BACK & FORTH DISCUSSION
2/4/25
STRONG JANUARY LEAD TO STRONG YEAR? TARIFFS, CHARTS & MORE
2/3/25
TARIFFS PUSHED BACK
1/31/25
TARIFF NEWS ALL OVER THE PLACE. ARE YOU PREPARED FOR POSSIBILITIES?
1/30/25
WHEAT BULL ARGUMENT. TRUMP ADDS TARIFFS
1/29/25
CORN APPROACHES $5.00
1/28/25
TARIFFS, CORN FUNDS, SOUTH AMERICA & MORE
1/27/25
HEALTHY CORRECTION WE TALKED ABOUT & TARIFF NEWS
1/24/25
GRAINS DUE FOR SHORT TERM CORRECTION?
1/23/25
OUR ENTIRE NEW CROP SALES THOUGHTS & OLD CROP SELL SIGNAL
1/22/25
GRAINS TAKE A BREATHER. IS CORN IN A BULL OR BEAR MARKET?
1/21/25
HUGE DAY IN GRAINS. WHAT TO DO WITH OLD CROP VS NEW CROP
Read More
1/20/25
VIDEO CHART UPDATE
1/17/25
TRUMP, CHINA, ARGY & USING THE SPREADS INVERSE
1/16/25
OLD CROP LEADS US LOWER. MARKETING THOUGHTS
1/15/25
SIGNAL & HEDGE ALERT QUESTIONS EXPLAINED. IS $6 CORN EVEN POSSIBLE?
1/14/25
MORE DETAILS ON TODAYS HEDGE ALERT & SELL SIGNAL
1/14/25
CORN & SOYBEANS HEDGE ALERT/SELL SIGNAL
1/13/25
USDA GAME CHANGER OR NOT?
1/10/25
BULLISH USDA FOR CORN & BEANS
1/9/25
USDA OUT TOMORROW
1/8/25
2 DAYS UNTIL USDA. BE PREPARED
1/7/25
THE HISTORY OF THE JAN USDA & MORE
1/6/25
MAJOR USDA REPORT FRIDAY
Read More
1/3/25
UGLY DAY ACROSS THE GRAINS
1/2/25