
HISTORY SUGGESTS CORN TOP ISN’T IN? ACRE OUTLOOK TOMORROW
MARKET UPDATE
Did you take advantage of last weeks corn & wheat sell signal?
Last Weeks Signal: Click Here
Subscribe if you’d like the next one.
Extended access to our sale from last week:
You can scroll to read the usual update as well. As the written version is the exact same as the video.
Timestamps for video:
Overview & News: 0:00min
History Suggest Top Isn't In?: 3:40min
Corn: 7:30min
Soybeans: 8:30min
Wheat: 10:00min
Want to talk or put together a market plan?
(605)295-3100
Futures Prices Close

Overview
Grains lower across the board as they continue this multi-day correction following +1 year highs in the corn market and 3 month highs in the wheat market last week.
So what has been pressuring the market?
First Notice Day:
First notice day is Friday and has added pressure to the market. This can be bearish because it means that longs must close their positions by Friday to avoid taking physical delivery of grain. Which usually leads to sell pressure.
This is also more bearish in a market with a carry. As a carry leads to more deliveries. The market is saying we want your corn later, not today.
We are in a unique situation this year. We have a carry from March to May due to the massive farmer selling. But an inverse from May to Dec as the old crop situation is tighter this marketing year vs next.
The market is paying farmers to carry corn from March to May, but the opposite from May to Dec.
We talked about our concerns with first notice day last week. If you missed it: Click Here
Tariffs:
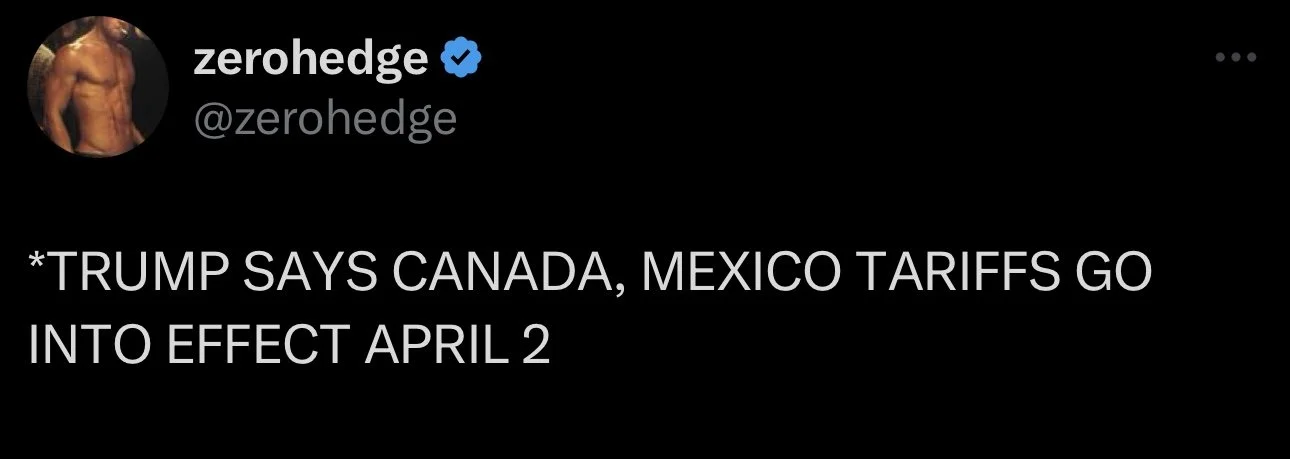
Originally Trump announced the tariffs for next week were still on schedule for Mexico and Canada.
However, it was announced today that those tariffs would be pushed back until April 2nd but still in effect.
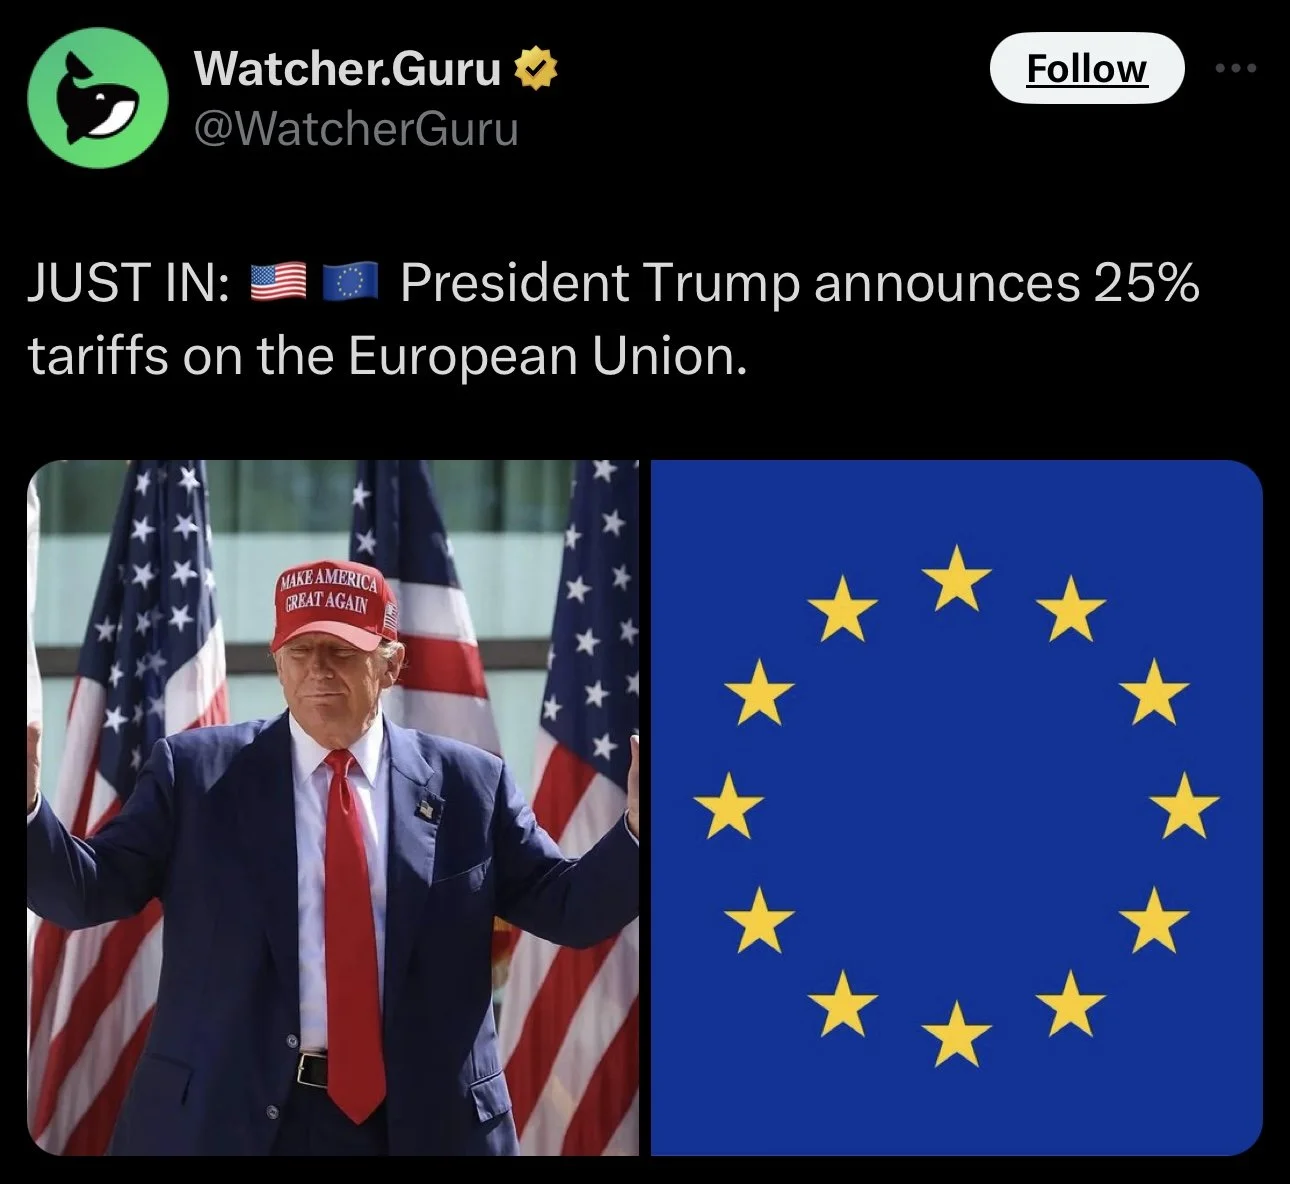
Trump also announced 25% tariffs on the EU.
Mexico's President said she is confident Mexico & Trump will come to an agreement. If not, she said they will respond back with tariffs of their own. Canada said the same thing.
Overall, the entire tariff situation seems more like a negation tactic for Trump rather than a real risk. But the market is going to trade the headlines.
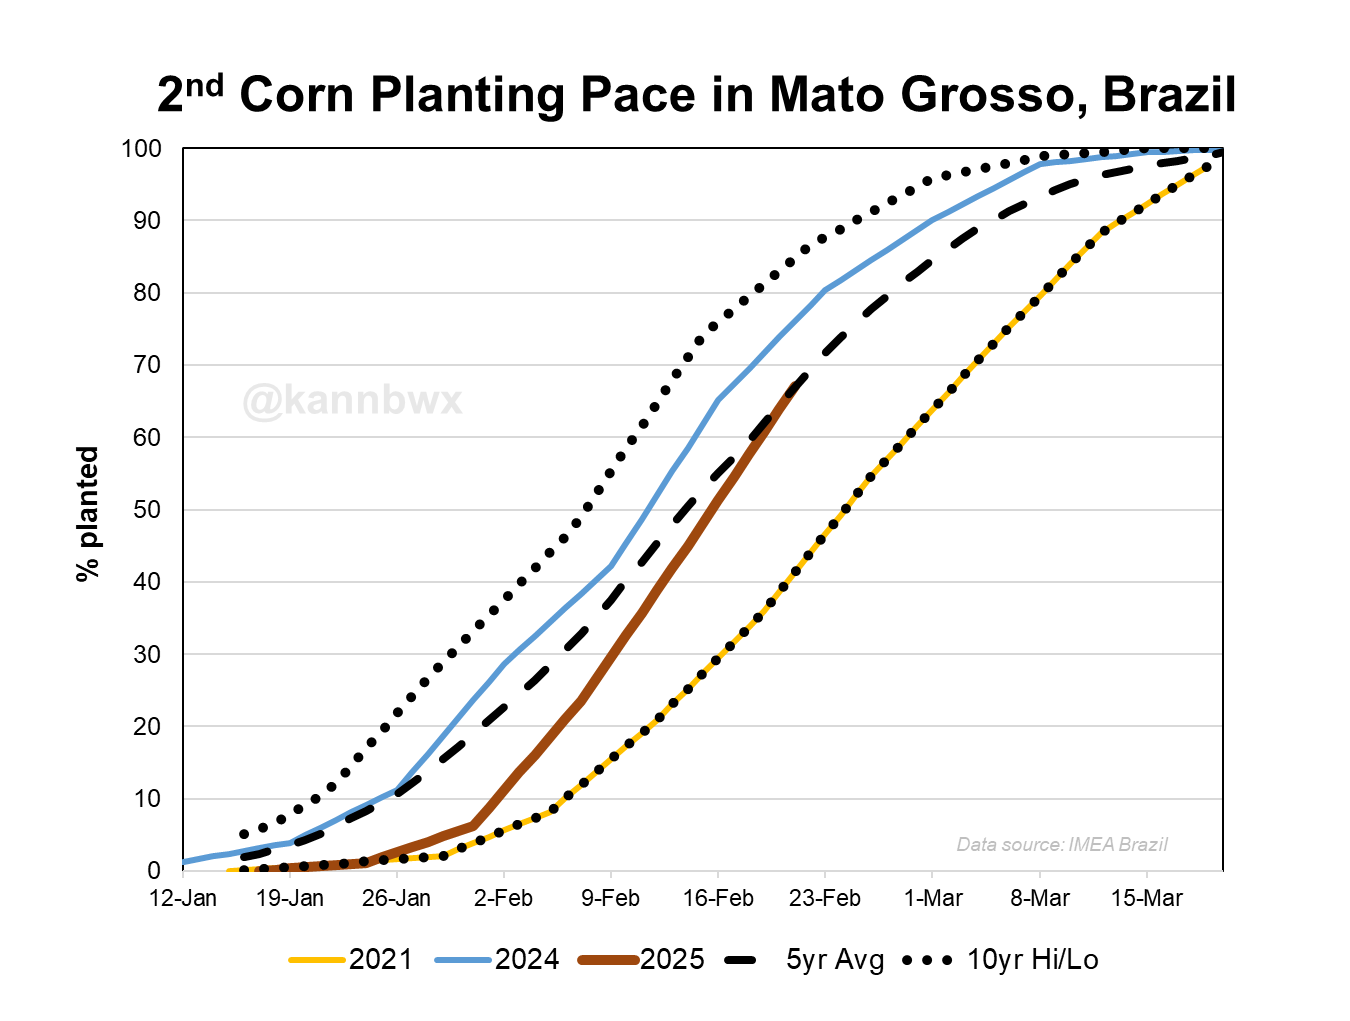
South America Improvement:
Bean harvest and corn planting have ramped up fast.
The planting for the 2nd corn crop in Brazil is now actually on the average pace, after one of the slowest starts on record.
There is still plenty of time for a weather scare in the 2nd corn crop but it looks like that crop won’t be planted super late anymore which minimizes the risks of crop loss.
Chart from Karen Braun
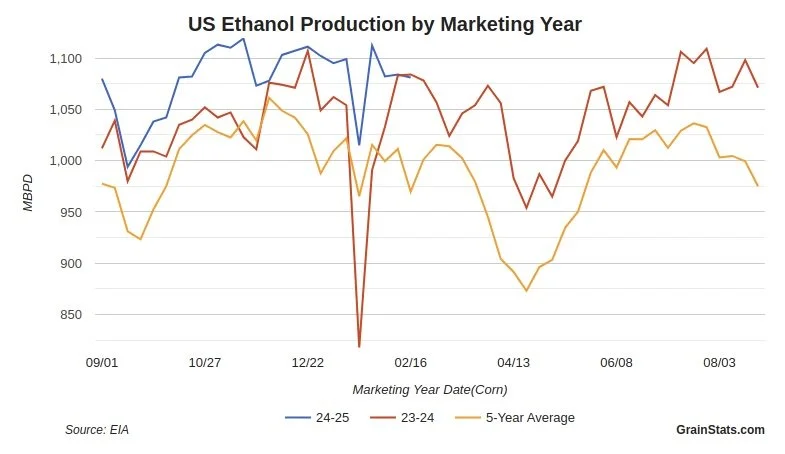
Near Record Ethanol Stocks:
Corn was actually trading higher until the ethanol stocks number came in.
Ethanol stocks came in at multi-year highs just short of the all-time record.
Chart from GrainStats
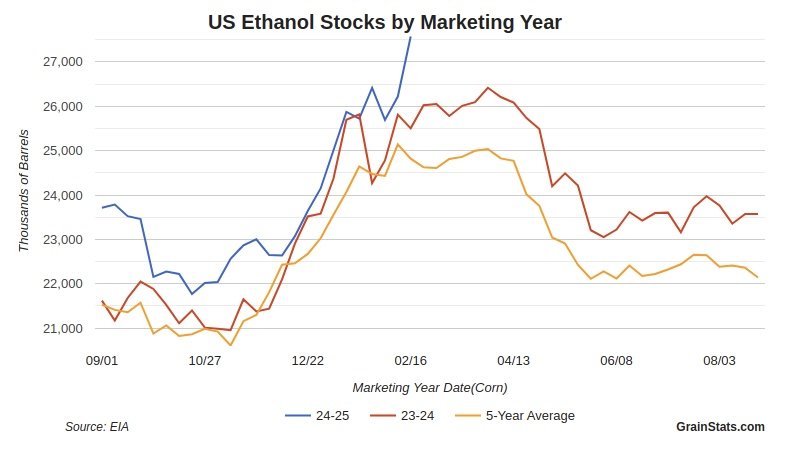
This is a bearish factor.
Why?
It means ethanol plants have plenty of supply, which means ethanol production is running ahead of "needed" pace.
Ethanol production has been a bright spot for corn the past several months.
But when supply is high, it suggests we might see production take a step back. As supply is out pacing demand.
Chart from GrainStats
USDA Outlook Forum:
Here are the estimates for the report tomorrow morning.
The trade range for the estimates for both corn & beans is the highest in 3 years.
I think we could very easily see a "sell the rumor, buy the fact".
We have sold off going into this report. Everyone knows corn acres will be high. Everyone is expecting a bearish report.
The market has been pricing in bigger acres. The funds who are near record long are well aware of high acres.
These numbers will also be taken with a grain of salt as they are pure guesses and don’t matter nearly as much as March or June ones. Even the March planting intentions reports are simply a starting point. We don’t get an accurate idea of acres until June.
Tomorrow's numbers might move the market, but they will not be trend changing numbers.

Here is tomorrows 2025/26 balance sheets for the outlook.
The USDA always starts with high acres and high yields.

History suggests corn top isn’t in?
Years the market has topped in February? 1 (2013)
Years the market has topped in January? 1 (2023)
Years the market has topped in March? 0
Here is a chart showing where front month corn has made it's yearly highs since 2004.
We have made our highs in May to July 12 of the past 20 years.
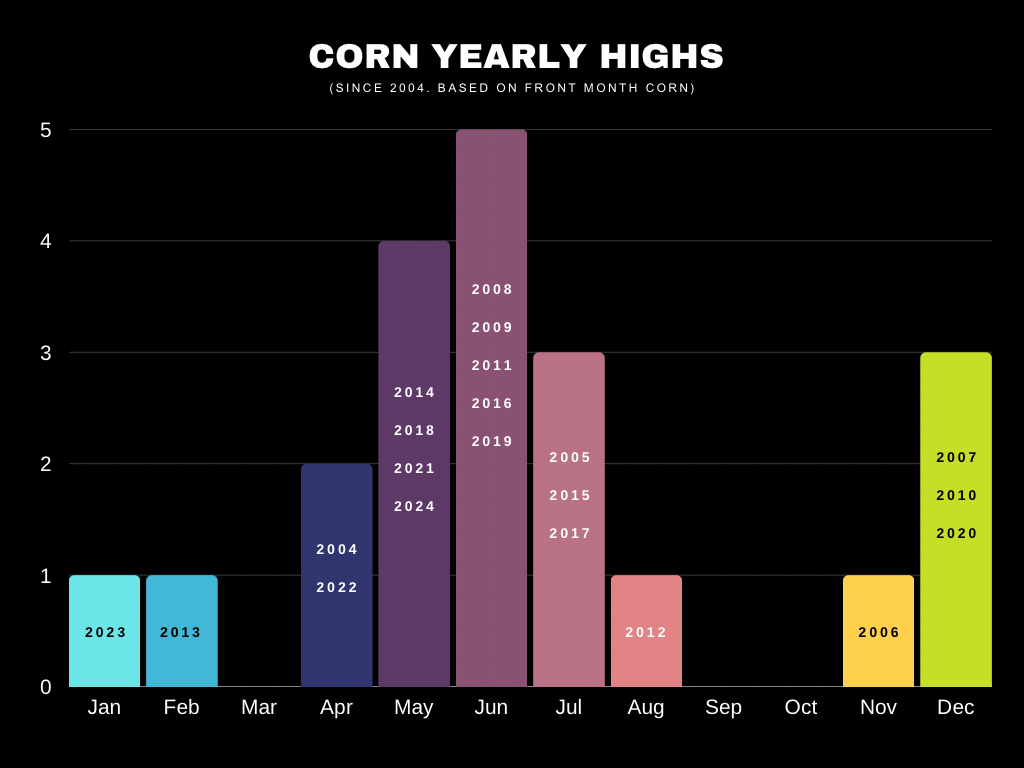
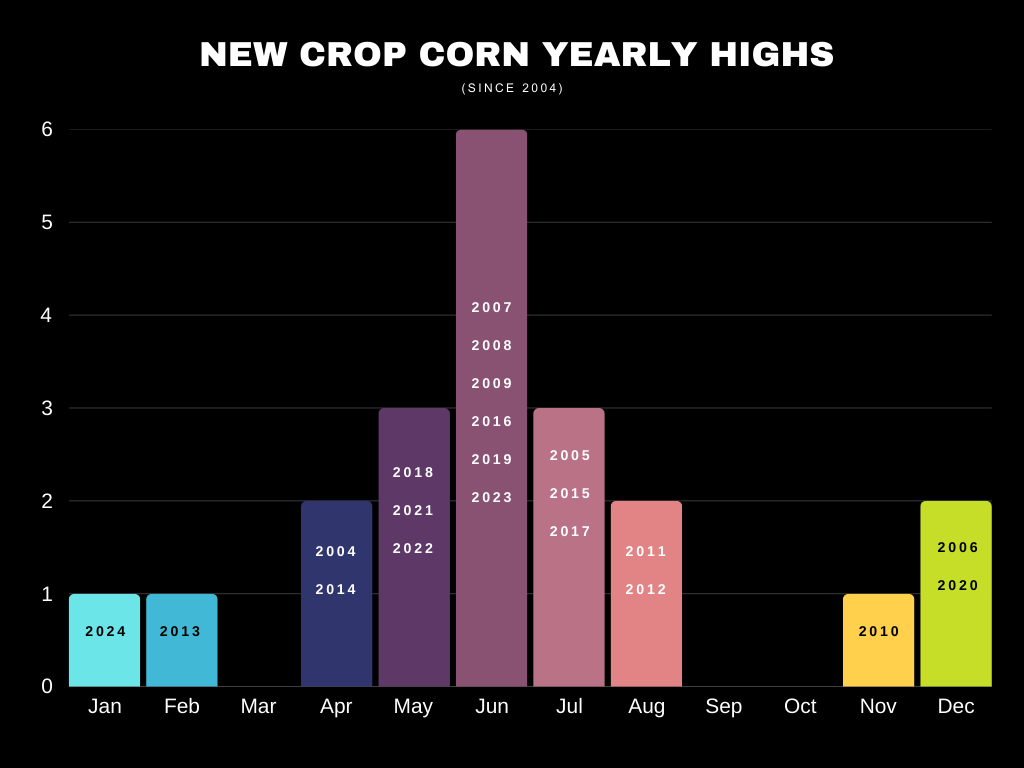
If you look at new crop, you can see the seasonally opportunity we usually get.
Of course you have outliers such as last year where we peaked Jan 1st and continued lower the rest of the year, or 2013 where we peaked in February.
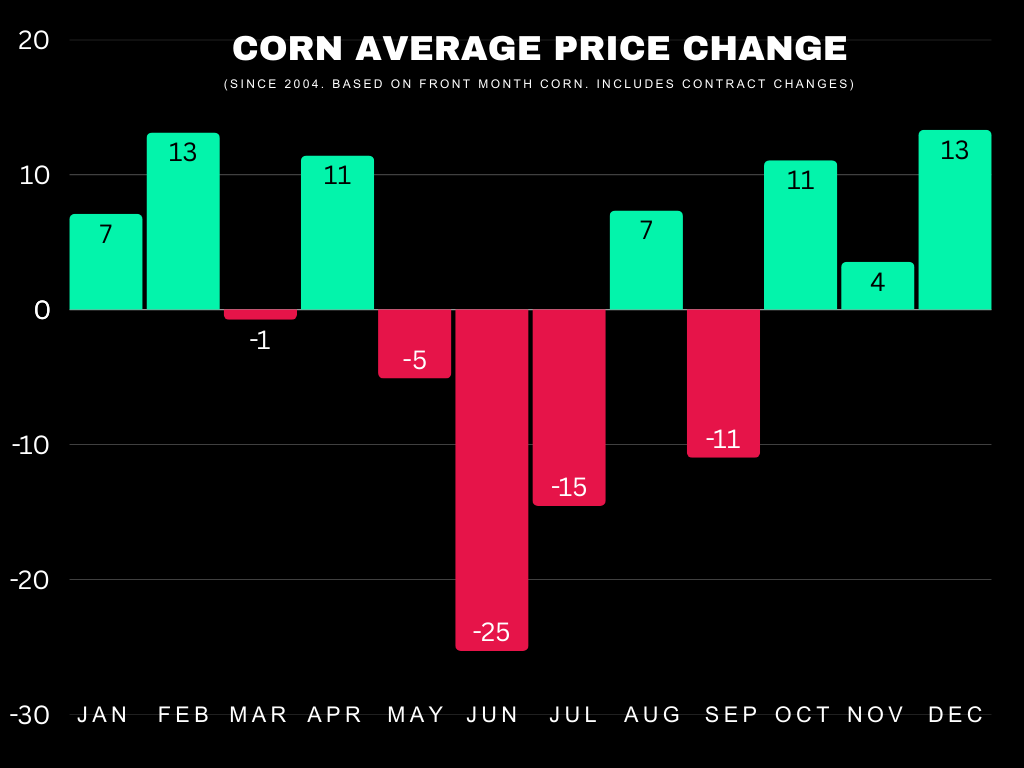
Here is the average monthly price changes for corn.
If May, June & July are where we usually top out then why are they the weakest months?
That is because those seasonal highs is often followed by a brutal seasonal sell off.
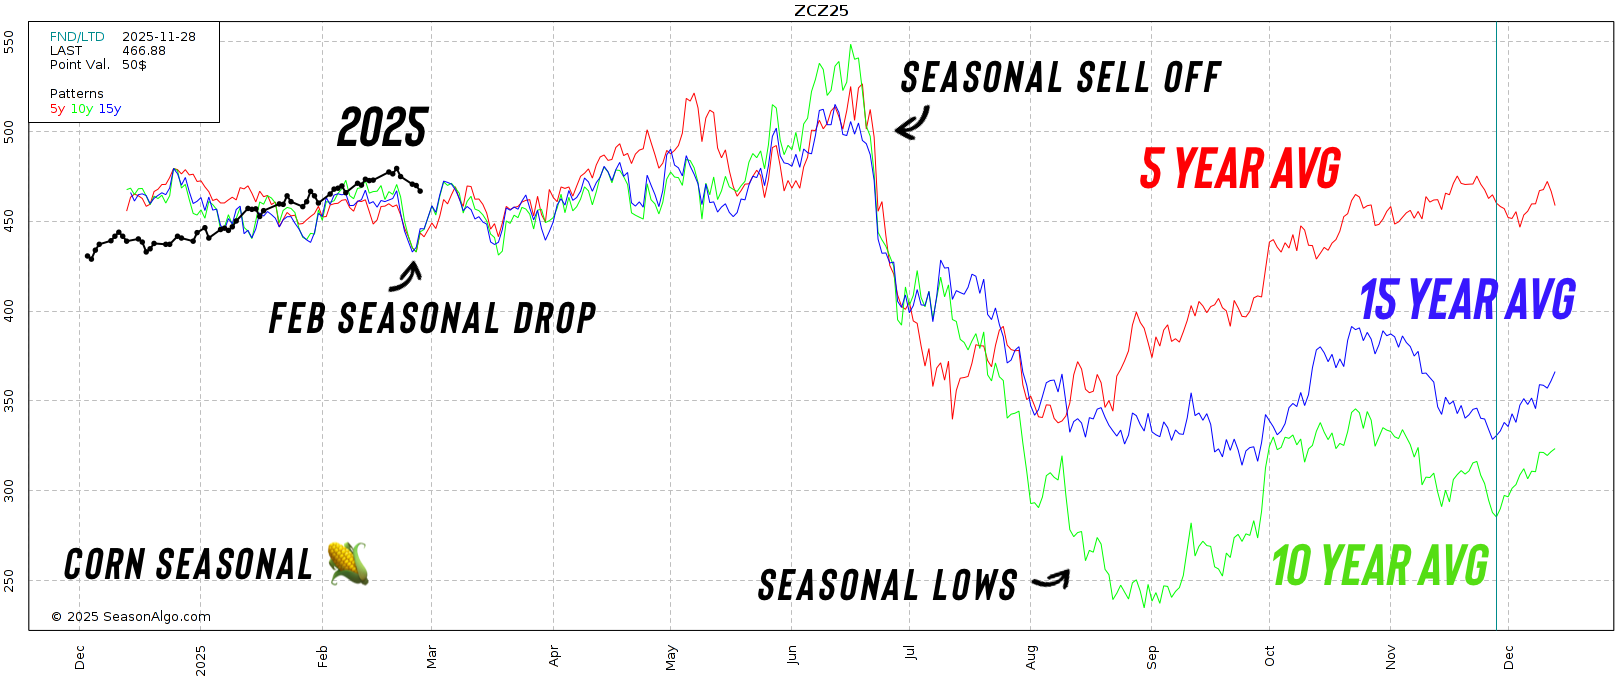
Here is a visual of that usual sell off.
This is the 5,10 and 15 year seasonals for new crop corn.
Notice that we also seasonally get a decent correction towards the end of February like we are now.
With highs being made in May to June, then a nasty sell off in mid-June before bottoming around harvest time.
Of course you still want to be managing your risk, hence why we have alerted several incremental sell signals along this rally.
With signals at: $4.55, $4.86, $5.00, and $5.16 (based on May contract)
But the point is that history suggests the odds we put in our yearly highs here in February aren’t super high. Possible but unlikely.
We almost always get a pricing opportunity later in the year.
That usually comes in the form of a "drought scare".
A drought scare and a real drought are very different.
2023 we had a drought scare that led to major short lived rally.
2012 we had a real drought.
Even if we get crazy high acres, if the trade just believes there is a chance for yield to be lowered it'll cause an opportunity.
Why?
For example:
Based on the USDA's current guesses for the 2025/26 balance sheets, here is roughly how it would look like even with 95 million acres.
(USDA Current): 182 yield = 15% stocks to use ratio
(Scenario): 172 yield = 8.5% stocks to use ratio
This does not have to even become a reality.
The market just needs to believe for a moment that yield isn’t what is advertised.
This is why we usually post highs in May to July.
Of course, there will be years like last year where we do not get one, but they do not happen often.
To add on to this, we have never reached a 180 yield. Extra acres makes hitting a high national yield even harder.
What about soybean seasonals?
Unlike corn where the US is the dominant player. The US is the 2nd biggest player on the global bean market. Behind Brazil. So it revolves around more than one growing season where as corn almost entirely revolves around the US growing season.
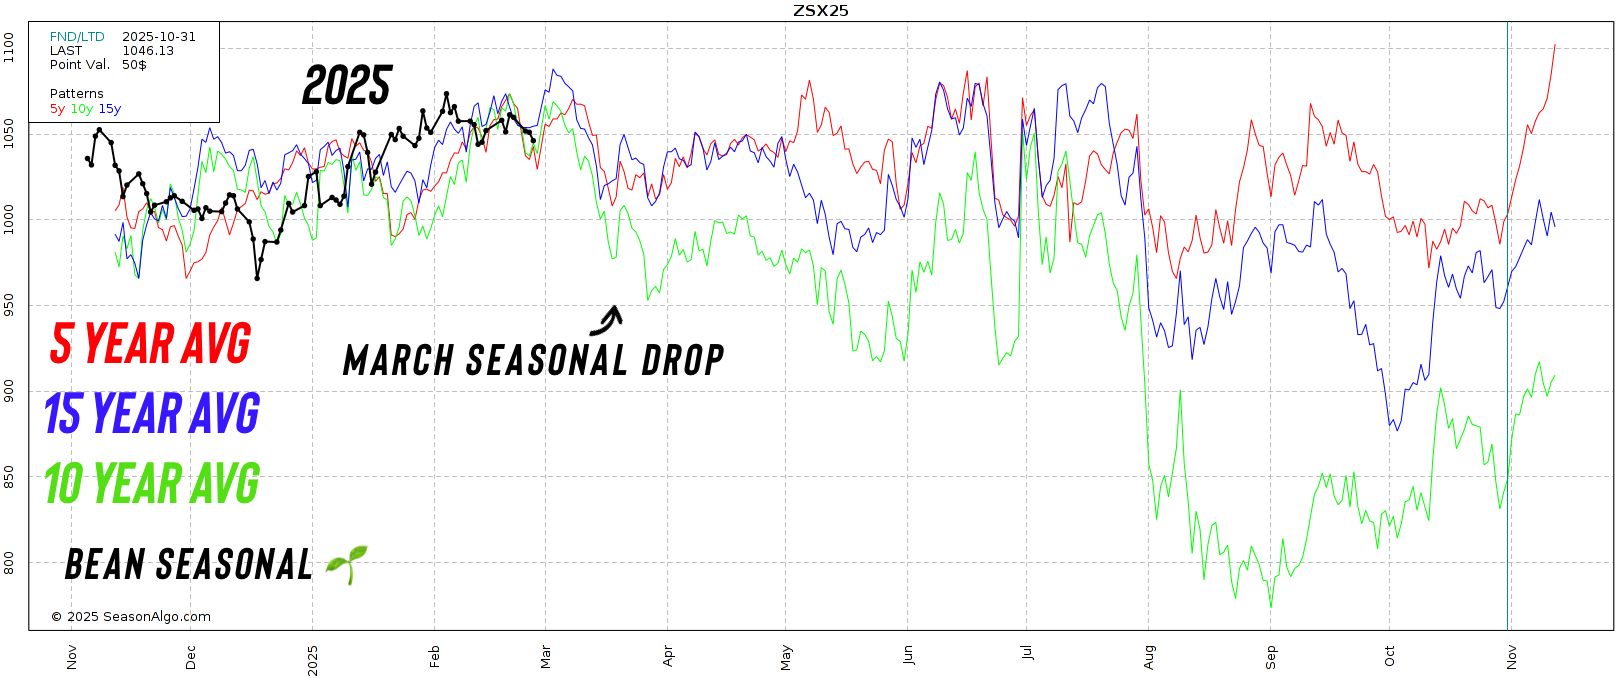
Here is the soybean seasonal.
Really no common pattern besides making a bottom around harvest time like corn.
Something to note is that we do seasonally sell off in March for beans.
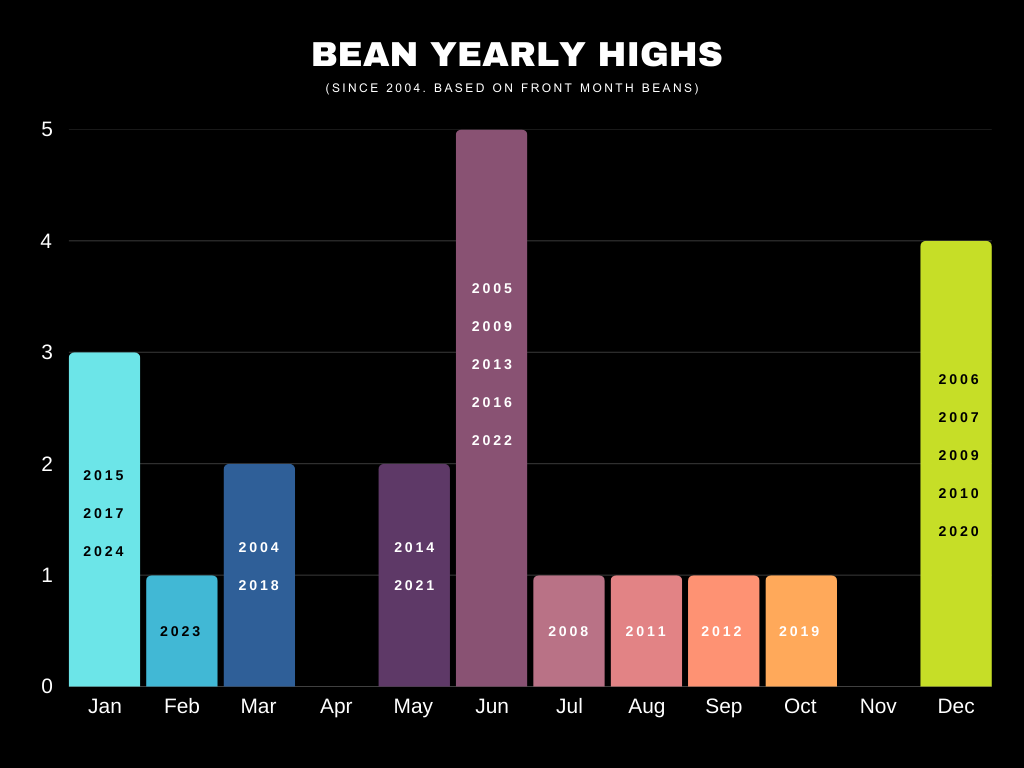
Here is a monthly breakdown of where soybeans have made their highs.
Again, a lot harder to gauge than corn.
Sometimes we get that end of year rally or into January.
Sometimes we get that June crop scare.
Today's Main Takeaways
Corn
Fundamentals:
Short term there is no magical bull story.
Long term there are still plenty of reasons to think we can go higher.
There is simply not a reason to get overly bearish.
The world situation is the tightest in a decade.
Exports will need bumped.
The funds are still near record long with no reason to bail just yet.
Technicals:
Not much to update on May corn after hitting the $5.14 sell signal target.
We have some channel support here that makes me think we bounce.
Ultimately, as long as the $4.80 level hold there is no reason to get bearish.
If $4.80 does not hold, then we likely make a trip to the $4.60's and find support there.

For Dec corn, we are potentially breaking this uptrend.
Bulls want to hold that green box.

Soybeans
Fundamentals:
Right now we still have the Brazil harvest limiting upside.
What happens to corn in the US after harvest?
It usually finds a bottom.
So perhaps once Brazil's harvest is out of the way, soybeans can find a little momentum.
Soybeans are realistically running out of time to fall apart.
We've already endured most of Brazil's harvest. The focus is soon going to shift to less acres in the US. No matter how big the Brazil crop is, it's not enough to push beans to $9 or we would be there by now.
The thought of less acres in the US should keep a floor under beans, because things in the US have a realistic path to get pretty tight despite the bearish global situation.
Again, I am not super bullish on beans because demand is going to be limited with the Brazil crop online and we have an ample global supply. But I think there will be opportunities in the future.
Technicals:
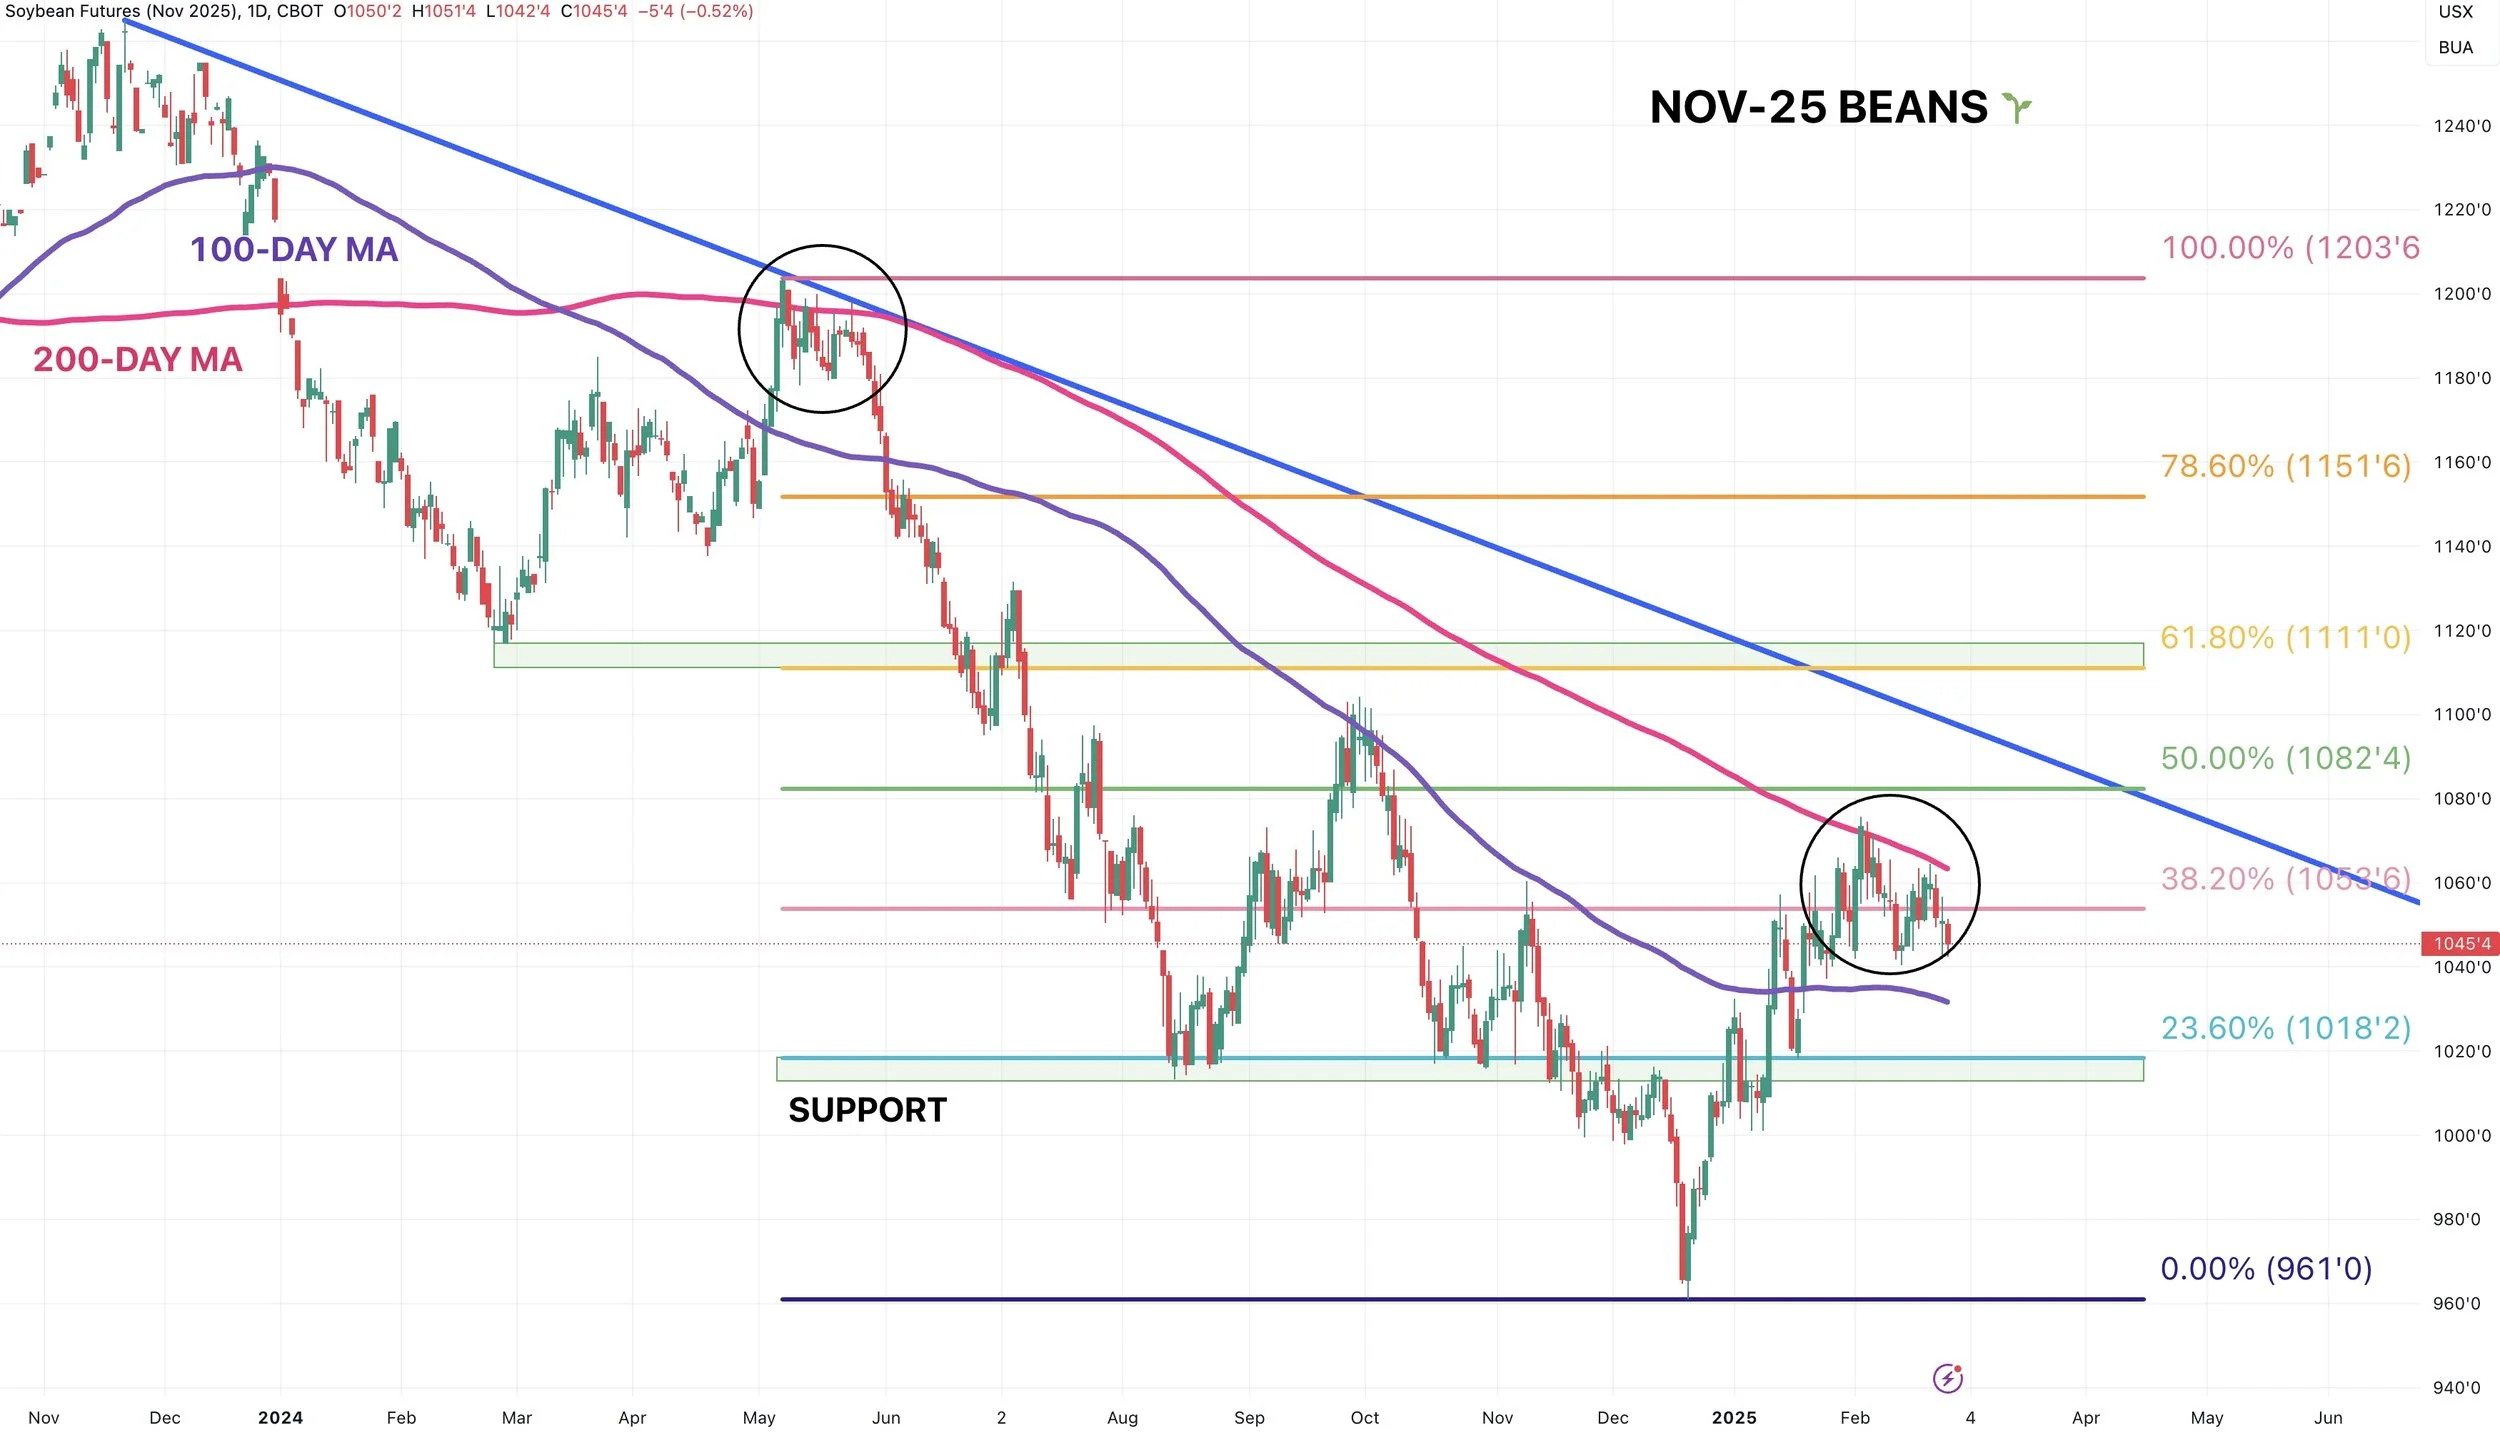
The chart for beans is pretty simple.
We are stuck between the 100 & 200 day MA.
If we break below the 100-day, the funds hit the sell button and drive us down to $10.00
If we break above the 200-day, the funds get long.
Soybeans have been trading sideways for a month. Often times when a market consolidates for a long time, it is getting ready to breakout in either direction.

Exact same story in new crop soybeans.
Wheat
Fundamentals:
Short term the winterkill story is gone like we expected. So the wheat market lacks fresh news which often leads to lower prices.
Moving forward, still plenty of reasons to be bullish long term.
Tightest global situation in over a decade.
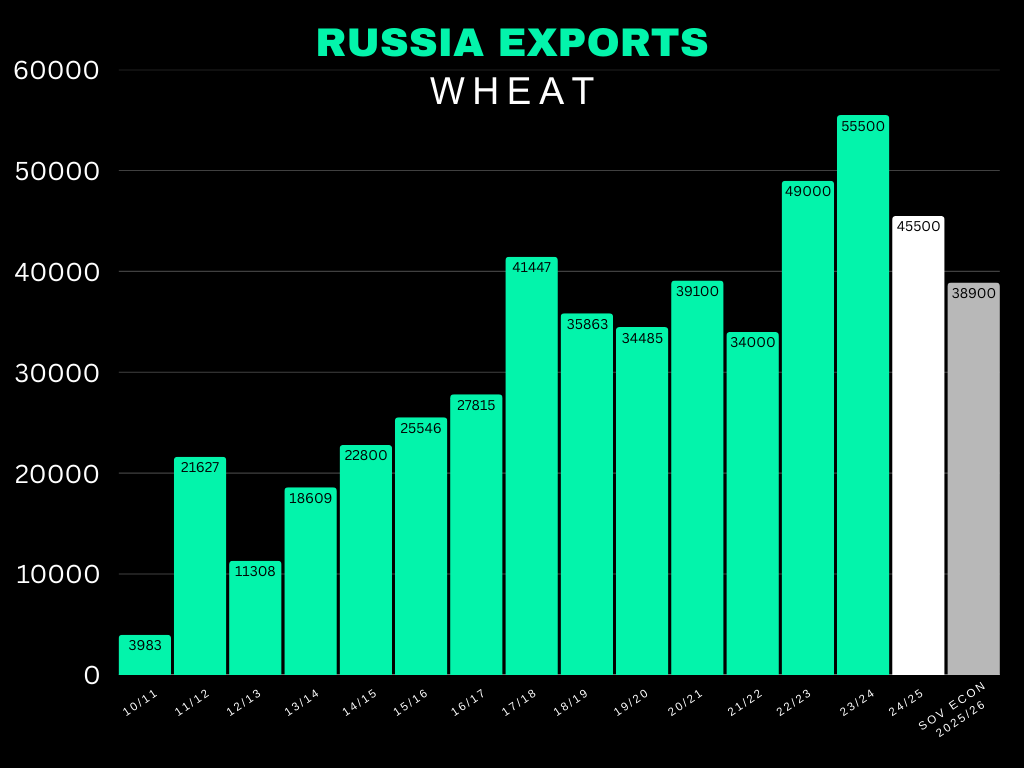
SovEcon came out with their 2025/26 Russian wheat exports.
They expect them to be down -15% from this year, and down a massive -30% from last year.
What happens to a market when the worlds leading exporter drops their exports by -30%?
Makes the global balance sheets tighter and gives the chance for the US to earn more business.
Technicals:
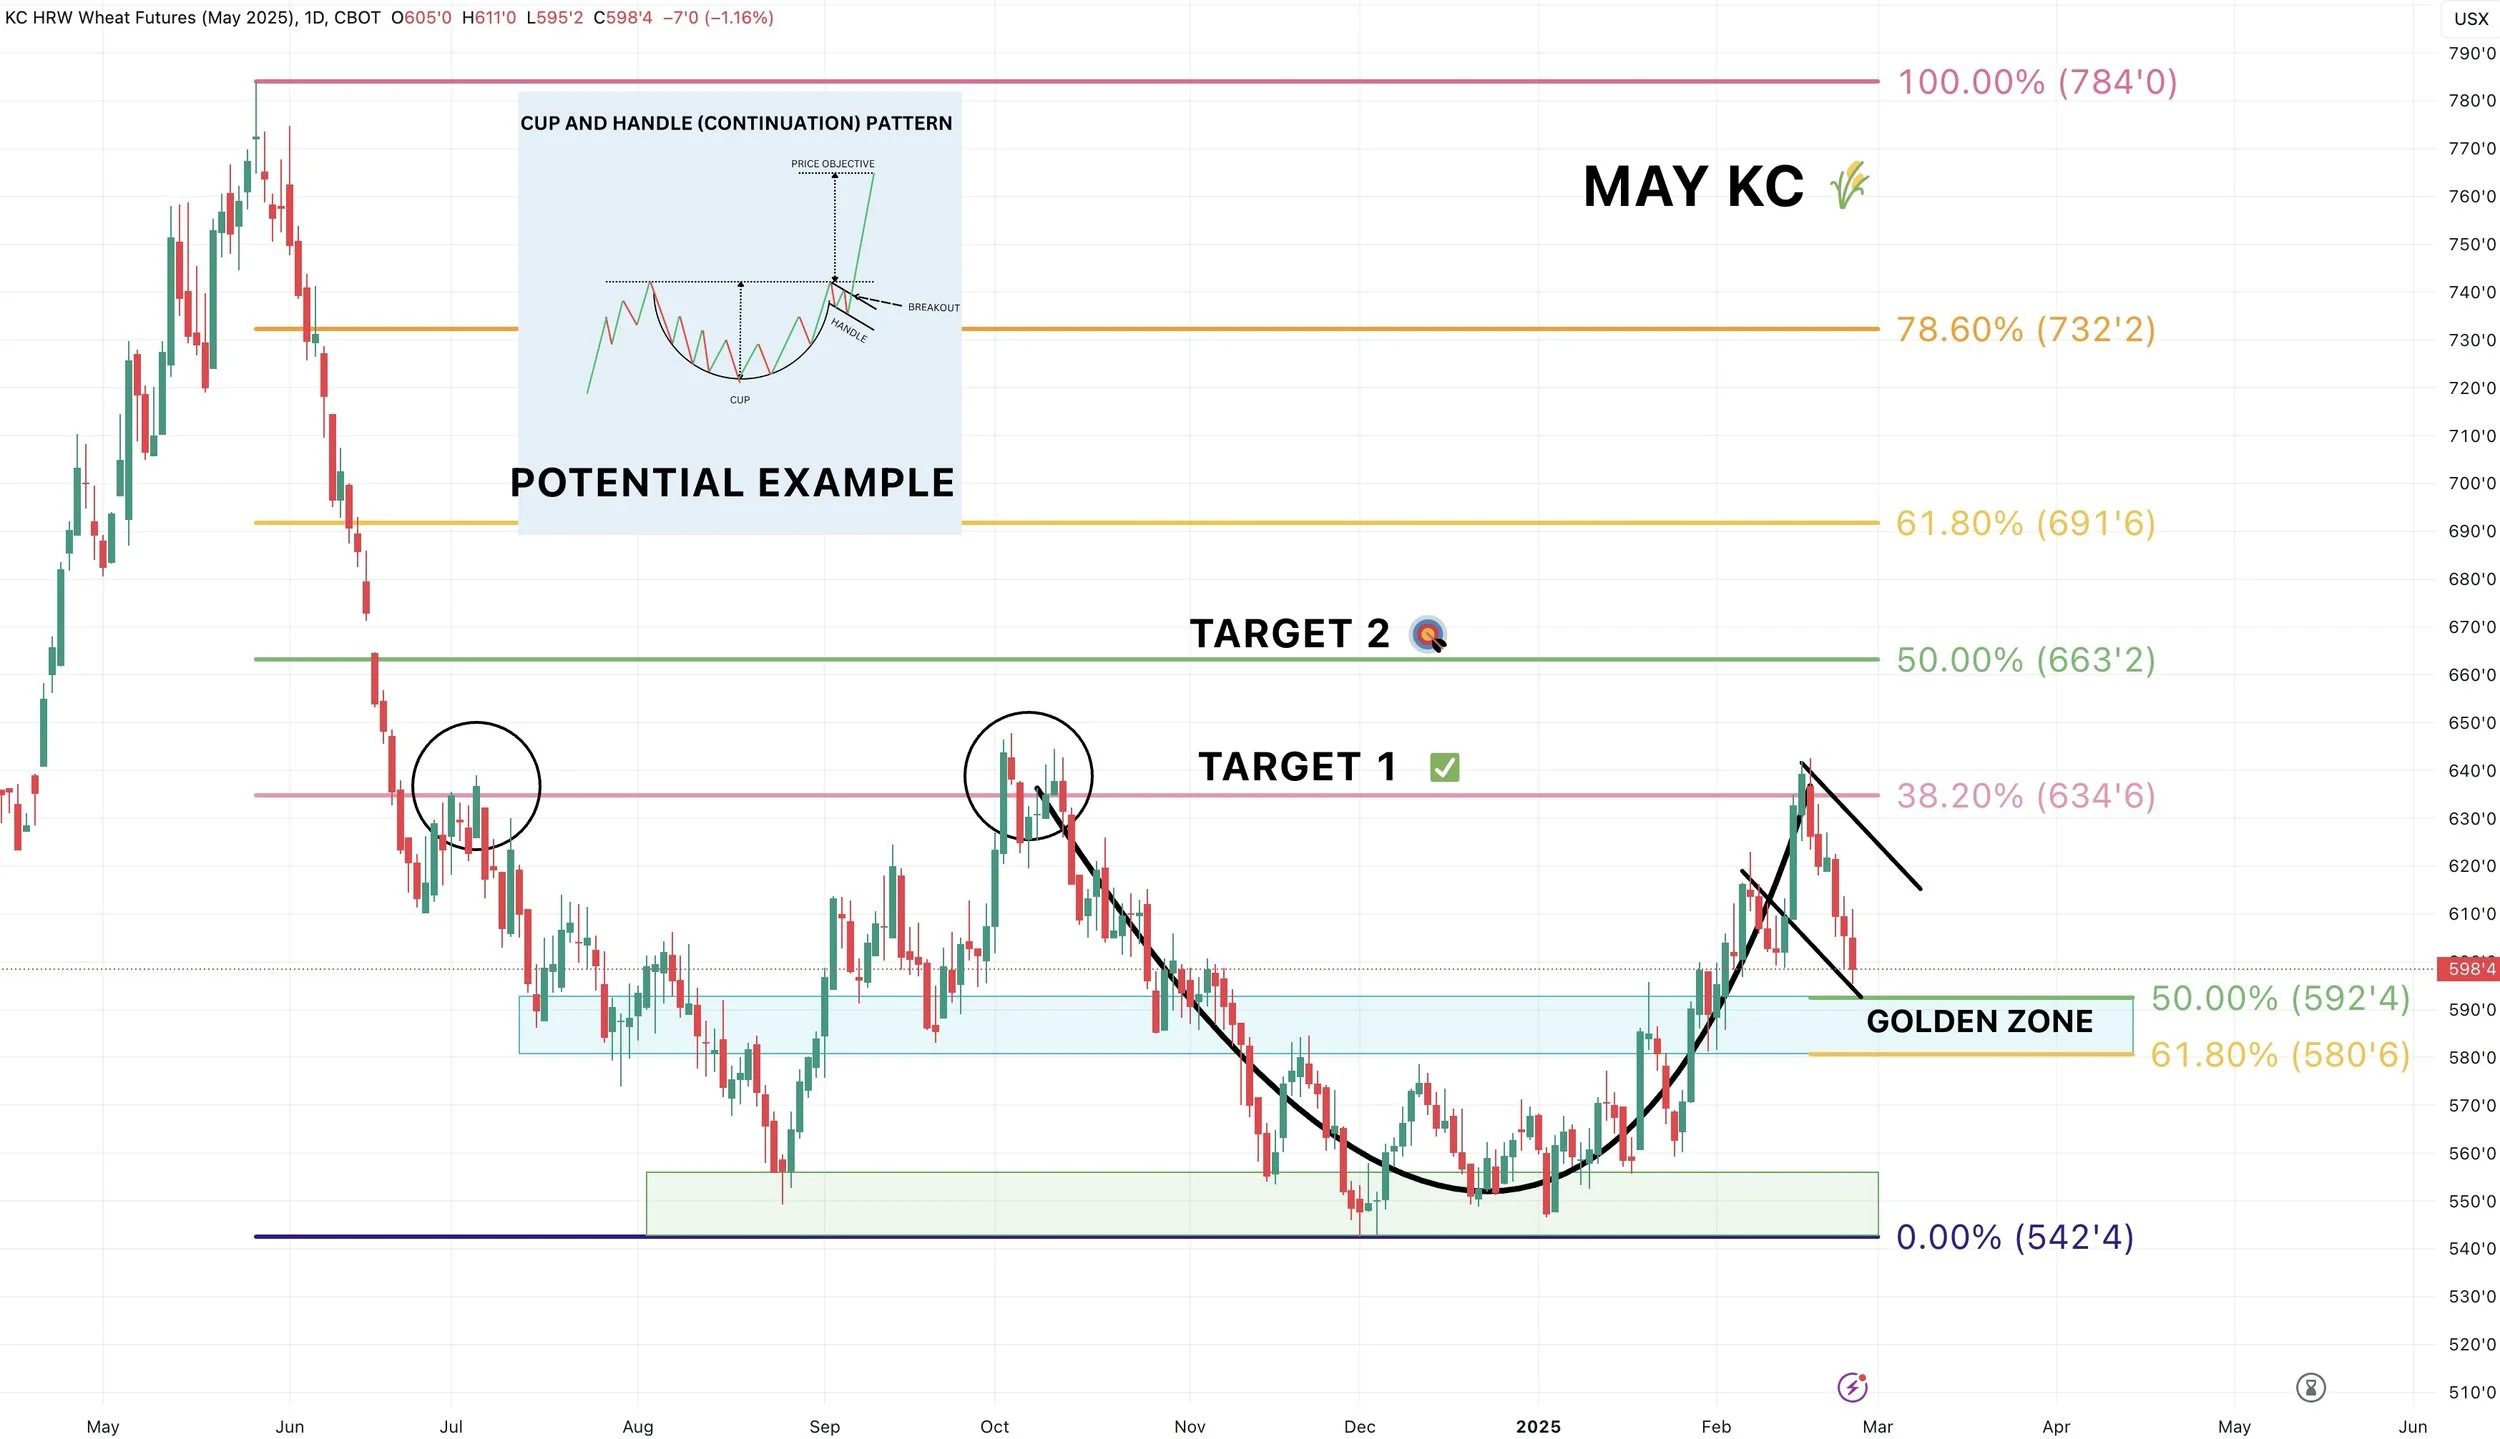
For KC wheat, we are now -35 cents off that sell signal target.
Currently sitting right above this golden zone (50-61.8% of the entire recent rally).
Bulls want to hold that blue box.
If not, we go re-test the old lows.
I still think we are in the process of potentially forming a bullish cup & handle pattern but need to hold $5.80 otherwise it becomes invalid.
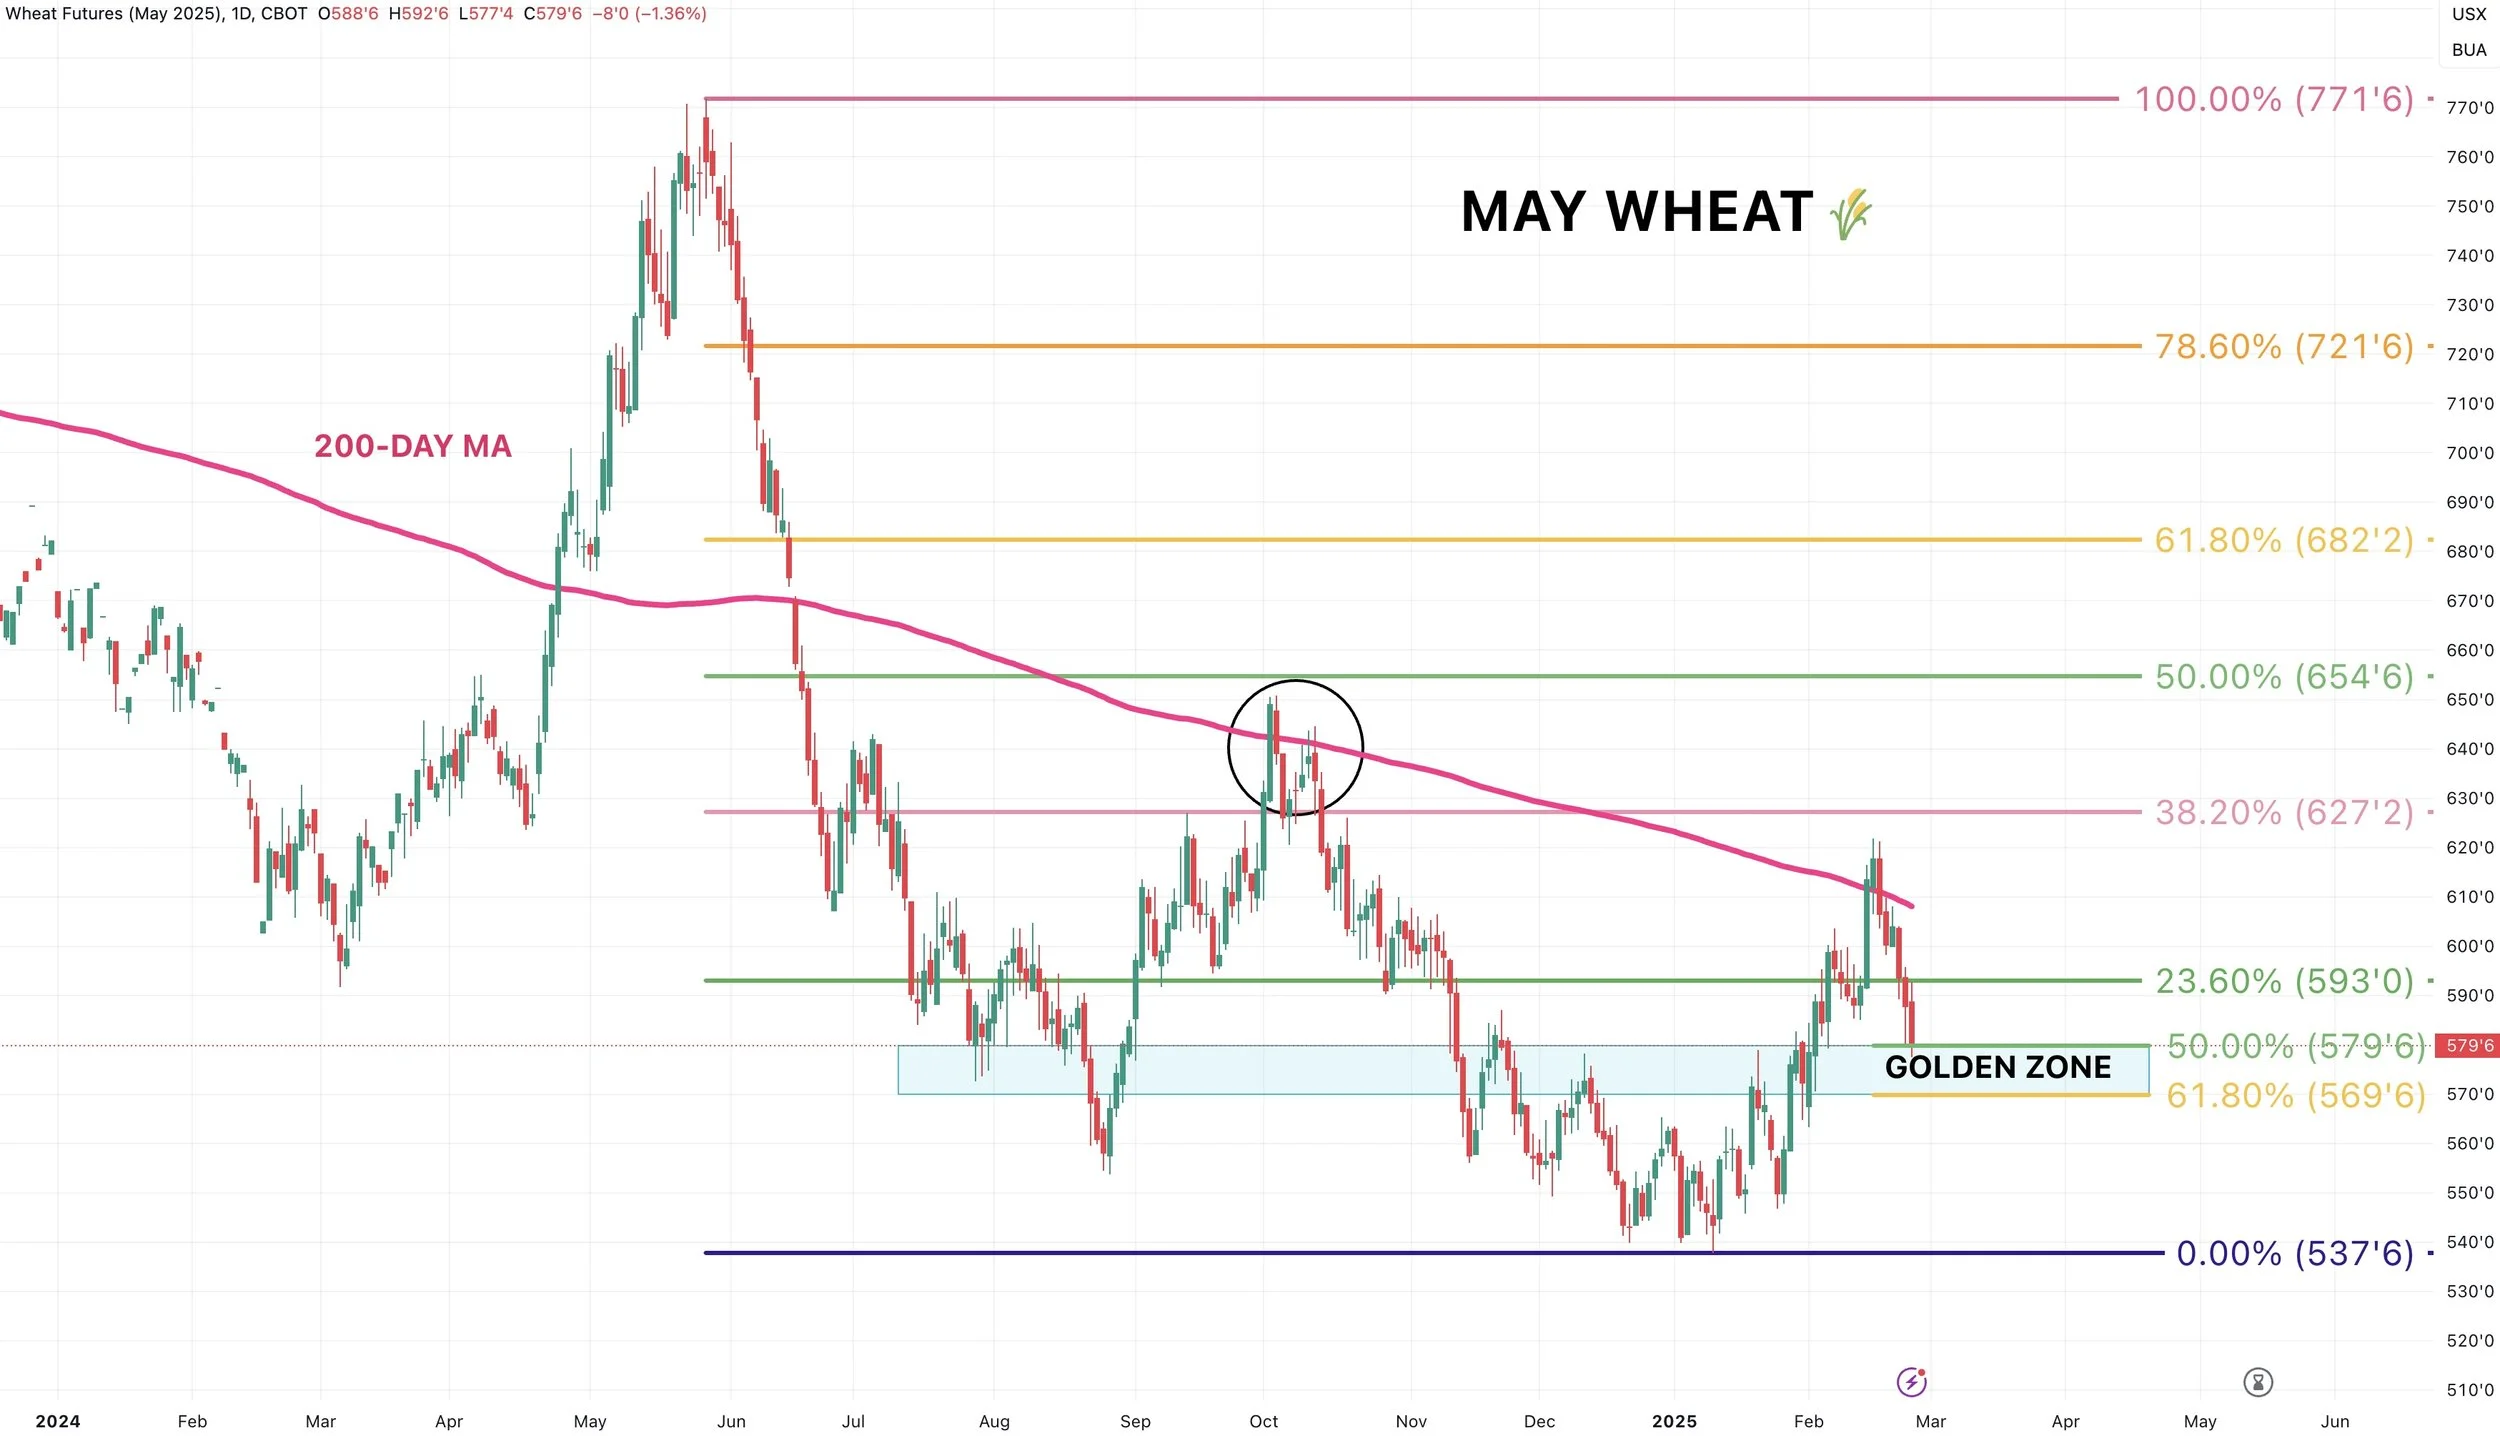
Just like KC, Chicago is also sitting right above the golden zone.
Bulls want to hold $5.69
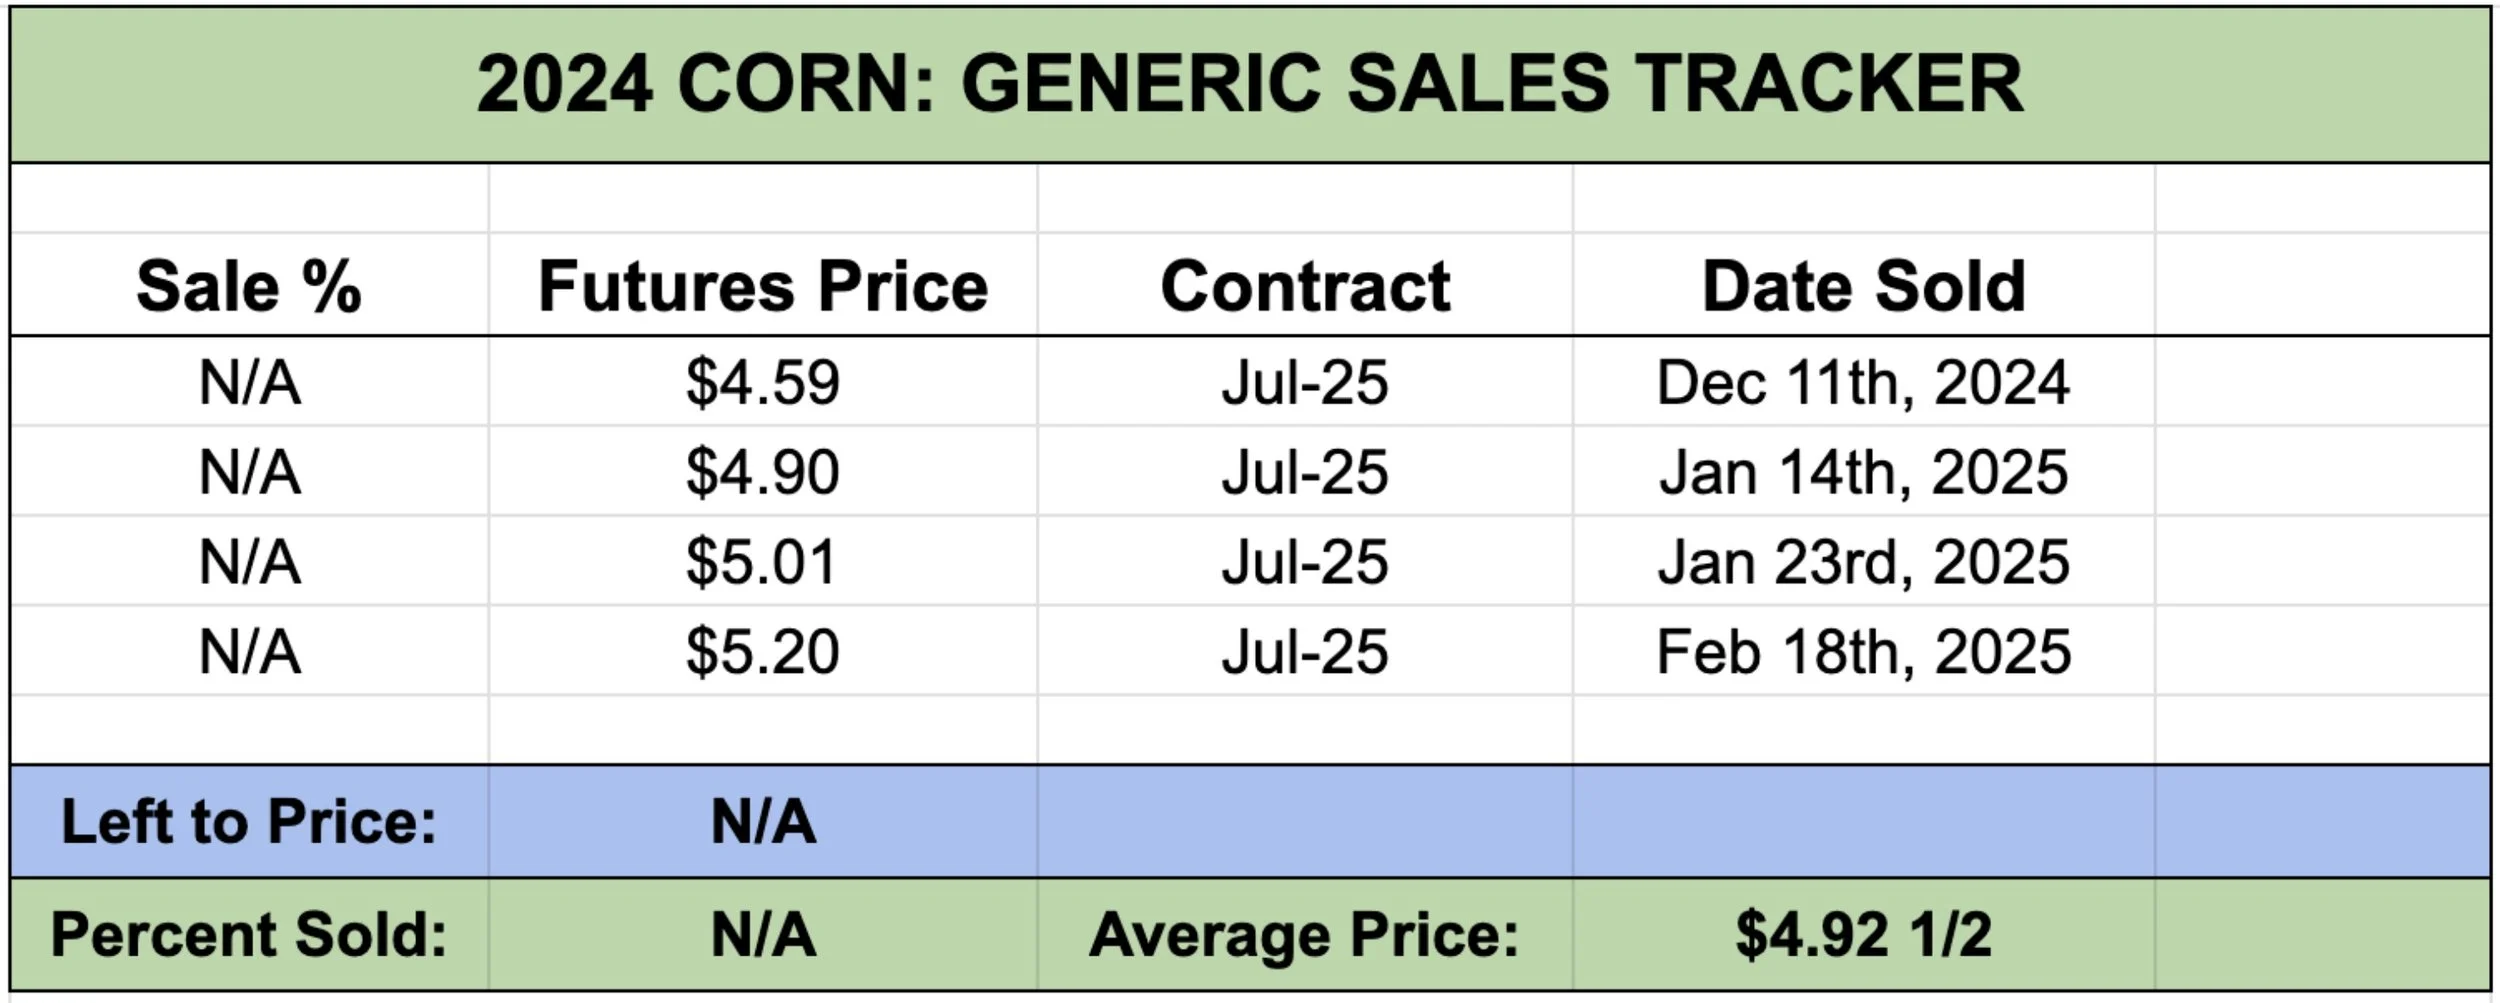
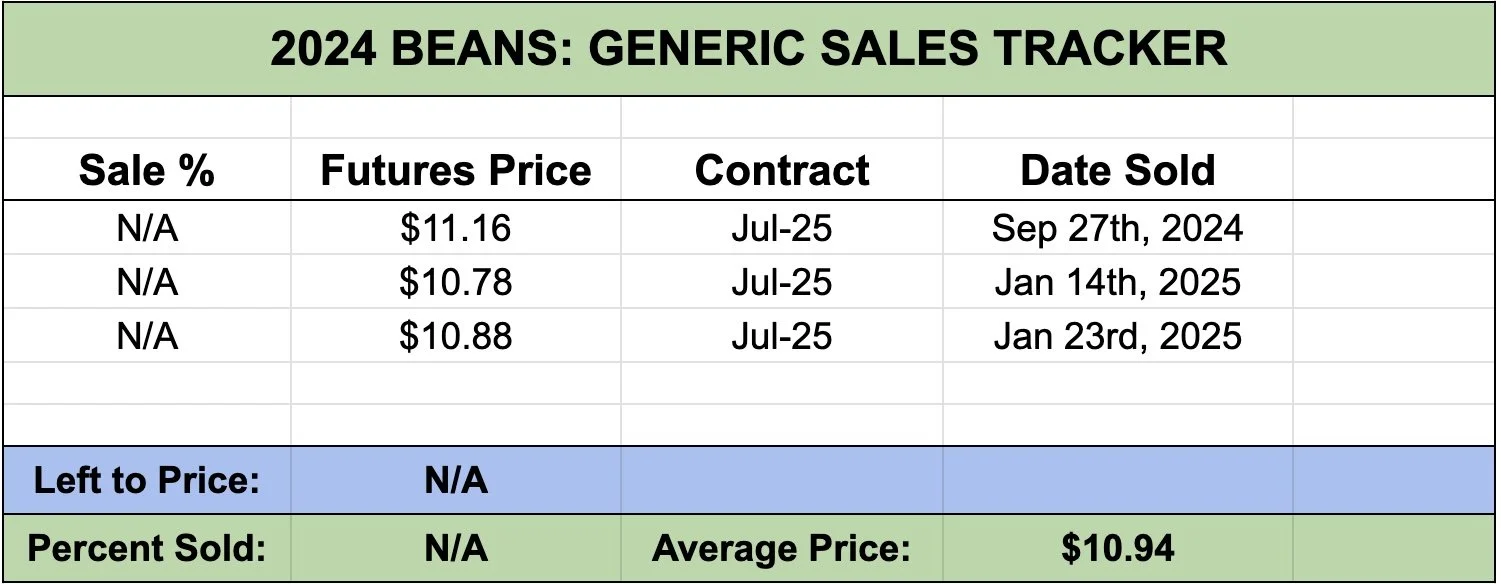
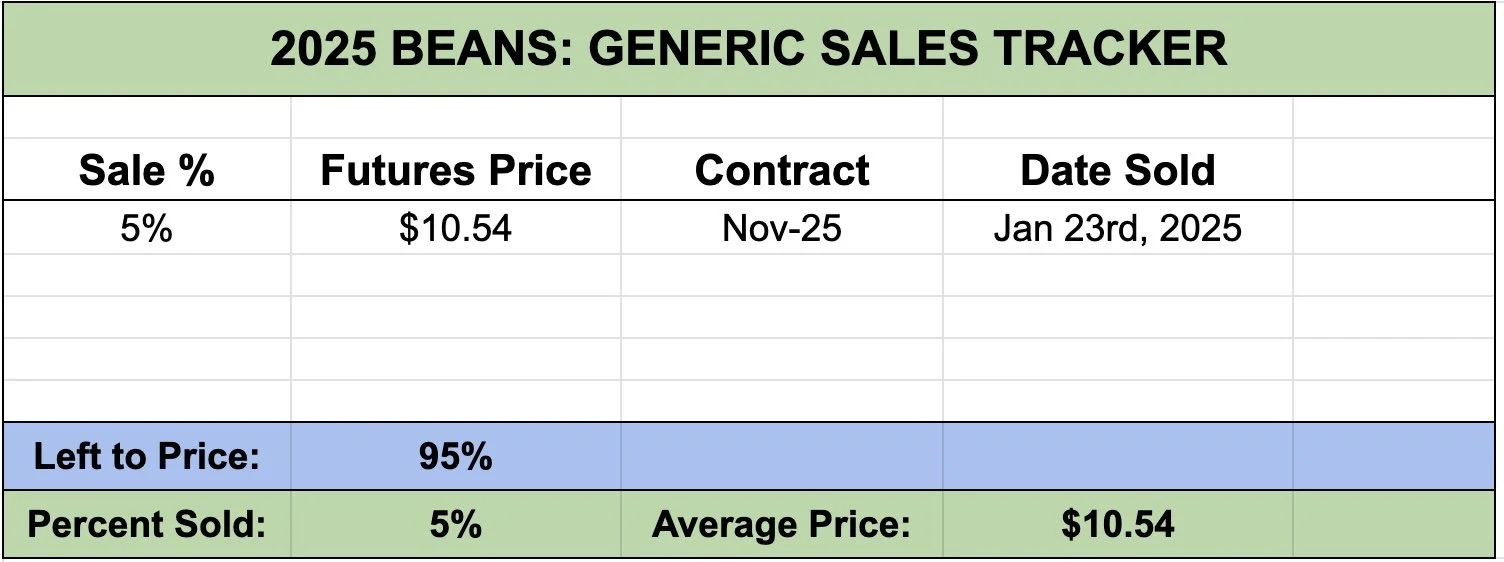
Generic Cash Sales Tracker
Due to requests here is our generic cash sales trackers.
This does not include any hedge recommendations etc. Simply cash.
This is futures prices.
For old crop there is no percentages as we only recently started tracking our generic sell signals. Future new crop sales will have percentages as we continue to make sales.
This will be included at the bottom of every update.

Past Sell or Protection Signals
We recently incorporated these. Here are our past signals.
Feb 18th: 🌽 🌾
Old crop KC wheat & old crop corn signal.
Jan 23rd: 🌽 🌱
Corn & beans old crop sell signal.
CLICK HERE TO VIEW
Jan 15th: 🌽 🌱
Corn & beans hedge alert/sell signal.
Jan 2nd: 🐮
Cattle hedge alert at new all-time highs & target.
Dec 11th: 🌽
Corn sell signal at $4.51 200-day MA
CLICK HERE TO VIEW
Oct 2nd: 🌾
Wheat sell signal at $6.12 target
Sep 30th: 🌽
Corn protection signal at $4.23-26
Sep 27th: 🌱
Soybean sell & protection signal at $10.65
Sep 13th: 🌾
Wheat sell signal at $5.98
May 22nd: 🌾
Wheat sell signal when wheat traded +$7.00
Want to Talk?
Our phones are open 24/7 for you guys if you ever need anything or want to discuss your operation.
Hedge Account
Interested in a hedge account? Use the link below to set up an account or shoot Jeremey a call at (605)295-3100.
Check Out Past Updates
2/25/25
POSITIVE CLOSE. WHAT TO KNOW ABOUT USDA OUTLOOK
2/24/25
USDA OUTLOOK, FIRST NOTICE DAY & BRAZIL
2/21/25
WHAT TO EXPECT MOVING FORWARD IN GRAINS
2/20/25
FIRST NOTICE DAY CONCERNS. MASSIVE CORN ACRES OR NOT?
2/19/25
HOW TIGHT IS THE CORN SITUATION?
2/18/25
MORE DETAILS ON TODAYS SELL SIGNAL
2/18/25
OLD CROP KC WHEAT & CORN SELL SIGNAL
2/14/25
WHEAT BREAKING OUT ON WEATHER RISK. TECHNICALS & FUNDAMENTALS
2/12/25
GLOBAL GRAIN SITUATION, ACRE TALK, CHARTS & MORE
2/11/25
USDA: NOT A BEARISH REPORT. DISAPPOINTING PRICE ACTION
2/10/25
USDA TOMORROW. LONG TERM PATH FOR SUB 10% CORN STOCKS TO USE?
2/7/25
WHY WOULD THE FUNDS EXIT THEIR LONGS?
2/6/25
WHEAT FINALLY CATCHING A BID
2/5/25
COMPLETE THOUGHTS ON MARKETS: BACK & FORTH DISCUSSION
2/4/25
STRONG JANUARY LEAD TO STRONG YEAR? TARIFFS, CHARTS & MORE
2/3/25
TARIFFS PUSHED BACK
1/31/25
TARIFF NEWS ALL OVER THE PLACE. ARE YOU PREPARED FOR POSSIBILITIES?
1/30/25
WHEAT BULL ARGUMENT. TRUMP ADDS TARIFFS
1/29/25
CORN APPROACHES $5.00
1/28/25
TARIFFS, CORN FUNDS, SOUTH AMERICA & MORE
1/27/25
HEALTHY CORRECTION WE TALKED ABOUT & TARIFF NEWS
1/24/25
GRAINS DUE FOR SHORT TERM CORRECTION?
1/23/25
OUR ENTIRE NEW CROP SALES THOUGHTS & OLD CROP SELL SIGNAL
1/22/25
GRAINS TAKE A BREATHER. IS CORN IN A BULL OR BEAR MARKET?
1/21/25
HUGE DAY IN GRAINS. WHAT TO DO WITH OLD CROP VS NEW CROP
Read More
1/20/25
VIDEO CHART UPDATE
1/17/25
TRUMP, CHINA, ARGY & USING THE SPREADS INVERSE
1/16/25
OLD CROP LEADS US LOWER. MARKETING THOUGHTS
1/15/25
SIGNAL & HEDGE ALERT QUESTIONS EXPLAINED. IS $6 CORN EVEN POSSIBLE?
1/14/25
MORE DETAILS ON TODAYS HEDGE ALERT & SELL SIGNAL
1/14/25
CORN & SOYBEANS HEDGE ALERT/SELL SIGNAL
1/13/25
USDA GAME CHANGER OR NOT?
1/10/25
BULLISH USDA FOR CORN & BEANS
1/9/25
USDA OUT TOMORROW
1/8/25
2 DAYS UNTIL USDA. BE PREPARED
1/7/25
THE HISTORY OF THE JAN USDA & MORE
1/6/25
MAJOR USDA REPORT FRIDAY
1/3/25
UGLY DAY ACROSS THE GRAINS
1/2/25
LONG TERM CORN UPTREND? JANUARY DROP OFF IN BEANS? LONG TERM WHEAT FACTORS
1/2/25
CATTLE HEDGE ALERT
12/31/24
MASSIVE DAY FOR GRAINS. FLOORS? 2025 SALES? GAME PLAN? CHART BREAKDOWNS
12/30/24
GRAINS FADE EARLY HIGHS
12/27/24
STILL LONG TERM UPSIDE POTENTIAL, BUT TAKE ADVANTAGE OF 6 MONTH CORN HIGH
12/26/24
CORN ABOVE 200-DAY MA. ARGY DRY. BEANS +44 CENTS OFF LOWS
12/23/24
CORN & BEANS TALE OF 2 STORIES. BEANS REJECT OLD SUPPORT
12/20/24
PERFECT BOUNCE IN CORN. SIMPLE BEAN BACKTEST BEFORE LOWER?
12/19/24
THE SOYBEAN PROBLEM. NEW WHEAT LOWS. CORN UPTREND
12/18/24
BEANS BREAK SUPPORT & OPEN FLOOD GATES
12/17/24
SINK OR SWIM TIME FOR SOYBEANS
12/16/24
SOYBEANS & WHEAT FIGHTING LOWS. WILL CORN DEMAND CONTINUE
12/13/24
POST USDA COOL OFF
12/12/24
CORN CORRECTION. WHY WE ALERTED SELL SIGNAL YESTERDAY
12/11/24
USDA PRICED IN? FAIR VALUE OF CORN? BEAN BREAKOUT?
12/11/24
CORN SELL SIGNAL
12/10/24
USDA BREAKDOWN
12/9/24
USDA TOMORROW
12/6/24
CORN TRYING TO BREAKOUT. MAKING MARKETING DECISIONS
12/5/24
OPTIMISTIC BOUNCE IN GRAINS
12/4/24
WHEAT UNDERVALUED? MOST RISK IN BEANS. HAVE A GAME PLAN
12/3/24
BEANS HOLDING DESPITE LACK OF BULLISH STORY
12/2/24
TRUMP & BRAZIL HURDLES
11/27/24