USDA ACRES & STOCKS REPORT IN 3 DAYS
MARKET UPDATE
Prefer to Listen? Audio Version
Futures Prices Close
Overview
Markets mixed as soybeans rally and take back nearly all of Friday's sell off. Wheat manages to close higher despite closing -12 cents off the early highs. Corn continues to chop around in this tight range, down just a penny and a half today.
Thursday we have the USDA acres and stocks report.
The USDA outlook forum had 91 million for corn, and beans at 87.5 million.
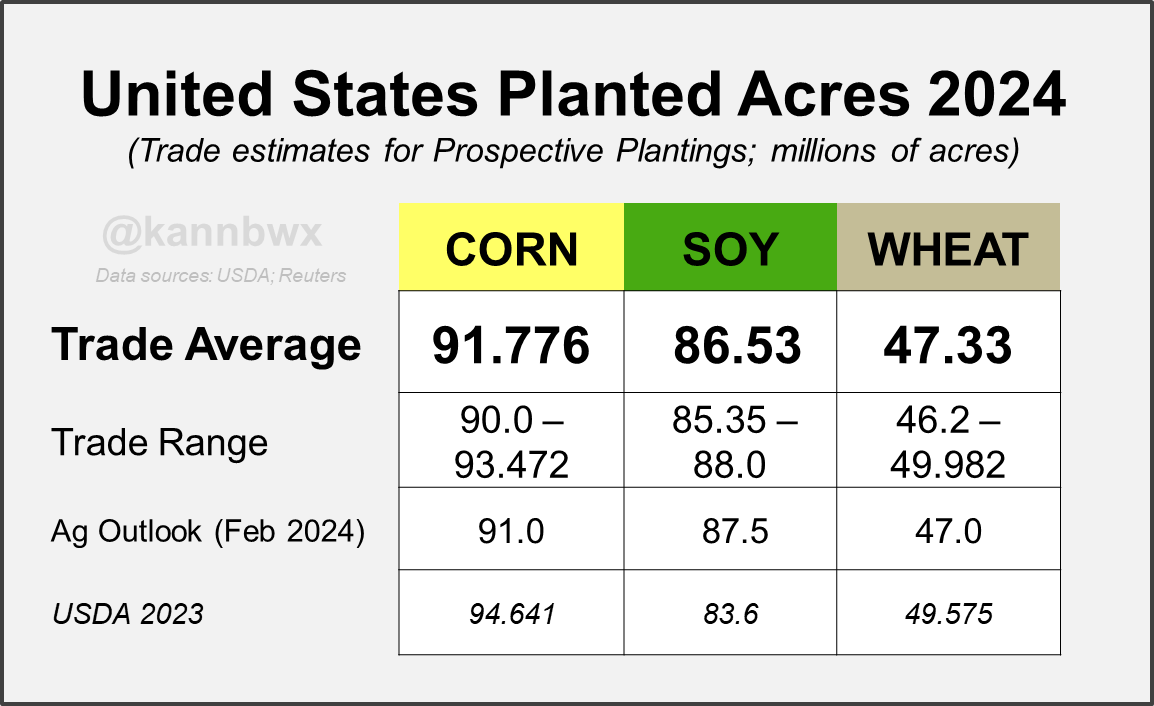
The estimates for the this report have corn coming in at 91.78 million. Which is nearly +1 million higher than the USDA outlook forum but still smaller than last year's 94.64 million.
The estimates for soybeans are 86.53 million, down -1 million from the USDA outlook but nearly +3 million more than last year.
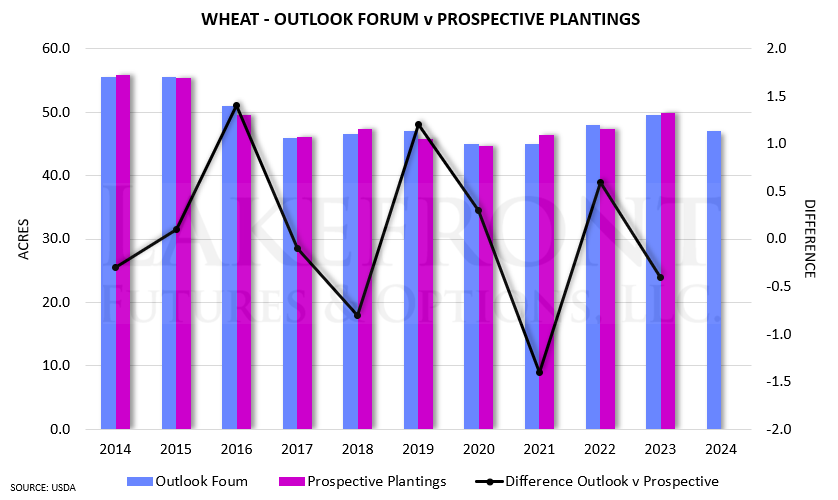
Wheat acre estimates are slightly higher than the USDA outlook, but down over -2 million from last year.
Here are the estimates from Karen Braun:
Here were Pro Farmers farmer survey results:
Corn: 91.75 million, down -2.9 million
Soybeans: 89.75 million, up +3.15 million
Spring wheat: 10.9 million, down -300k
Cotton: 10.5 million, up +270k
There is many who believe that the current cotton acre estimates will be too low, given the recent price action difference in cotton vs other crops such as corn and wheat.
From Wright on the Market:
"Our clients in the south east US are saying that cotton is going to take 10-20% of the corn acres this spring."
Let's take a look at some history for this upcoming report.
Keep in mind, the actual results of this report are impossible to predict.
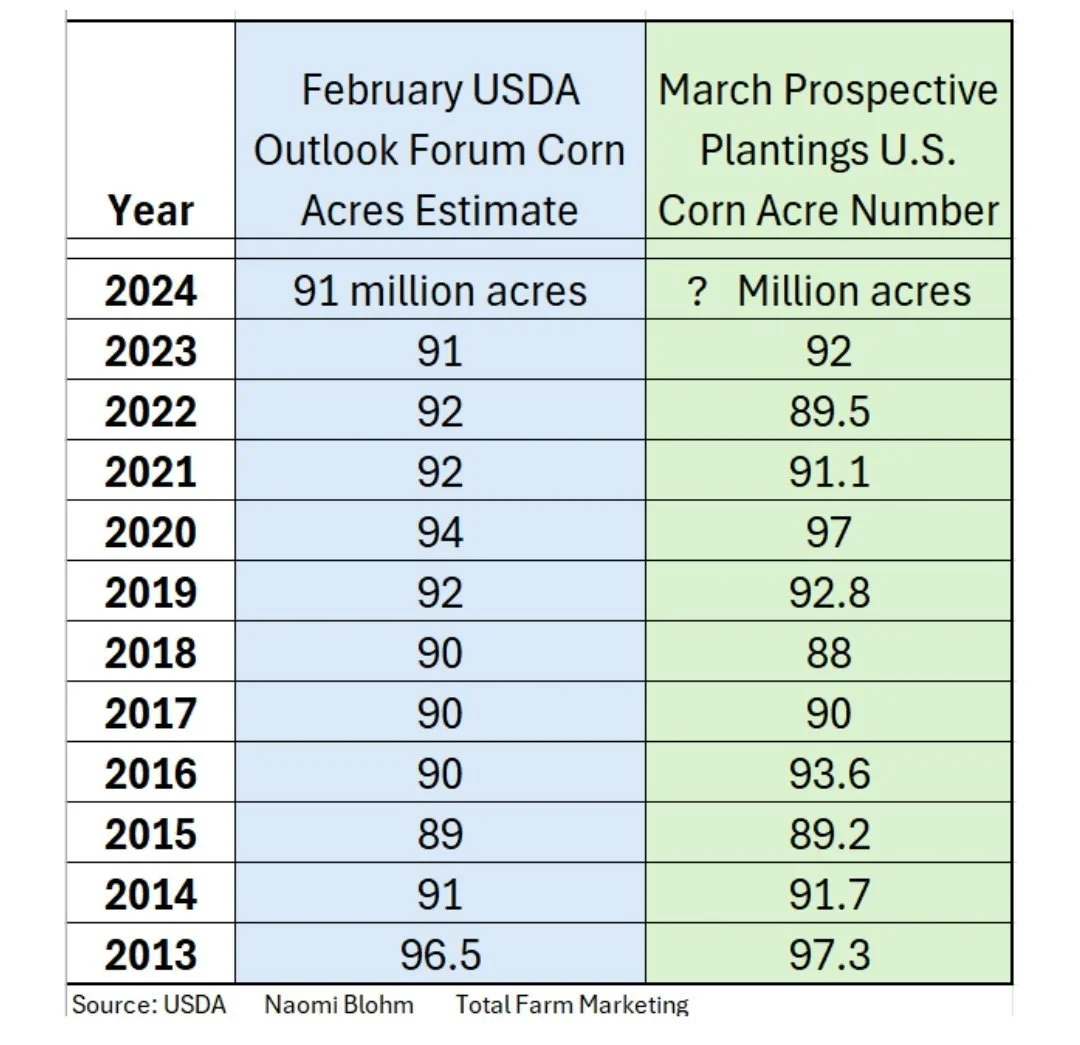
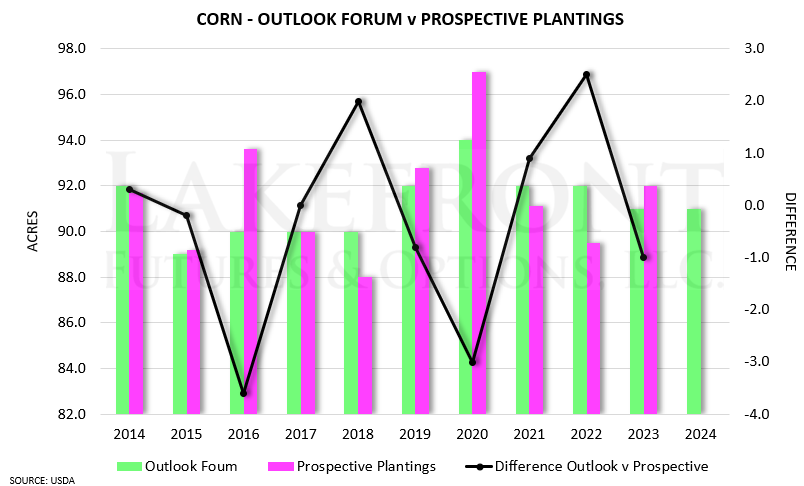
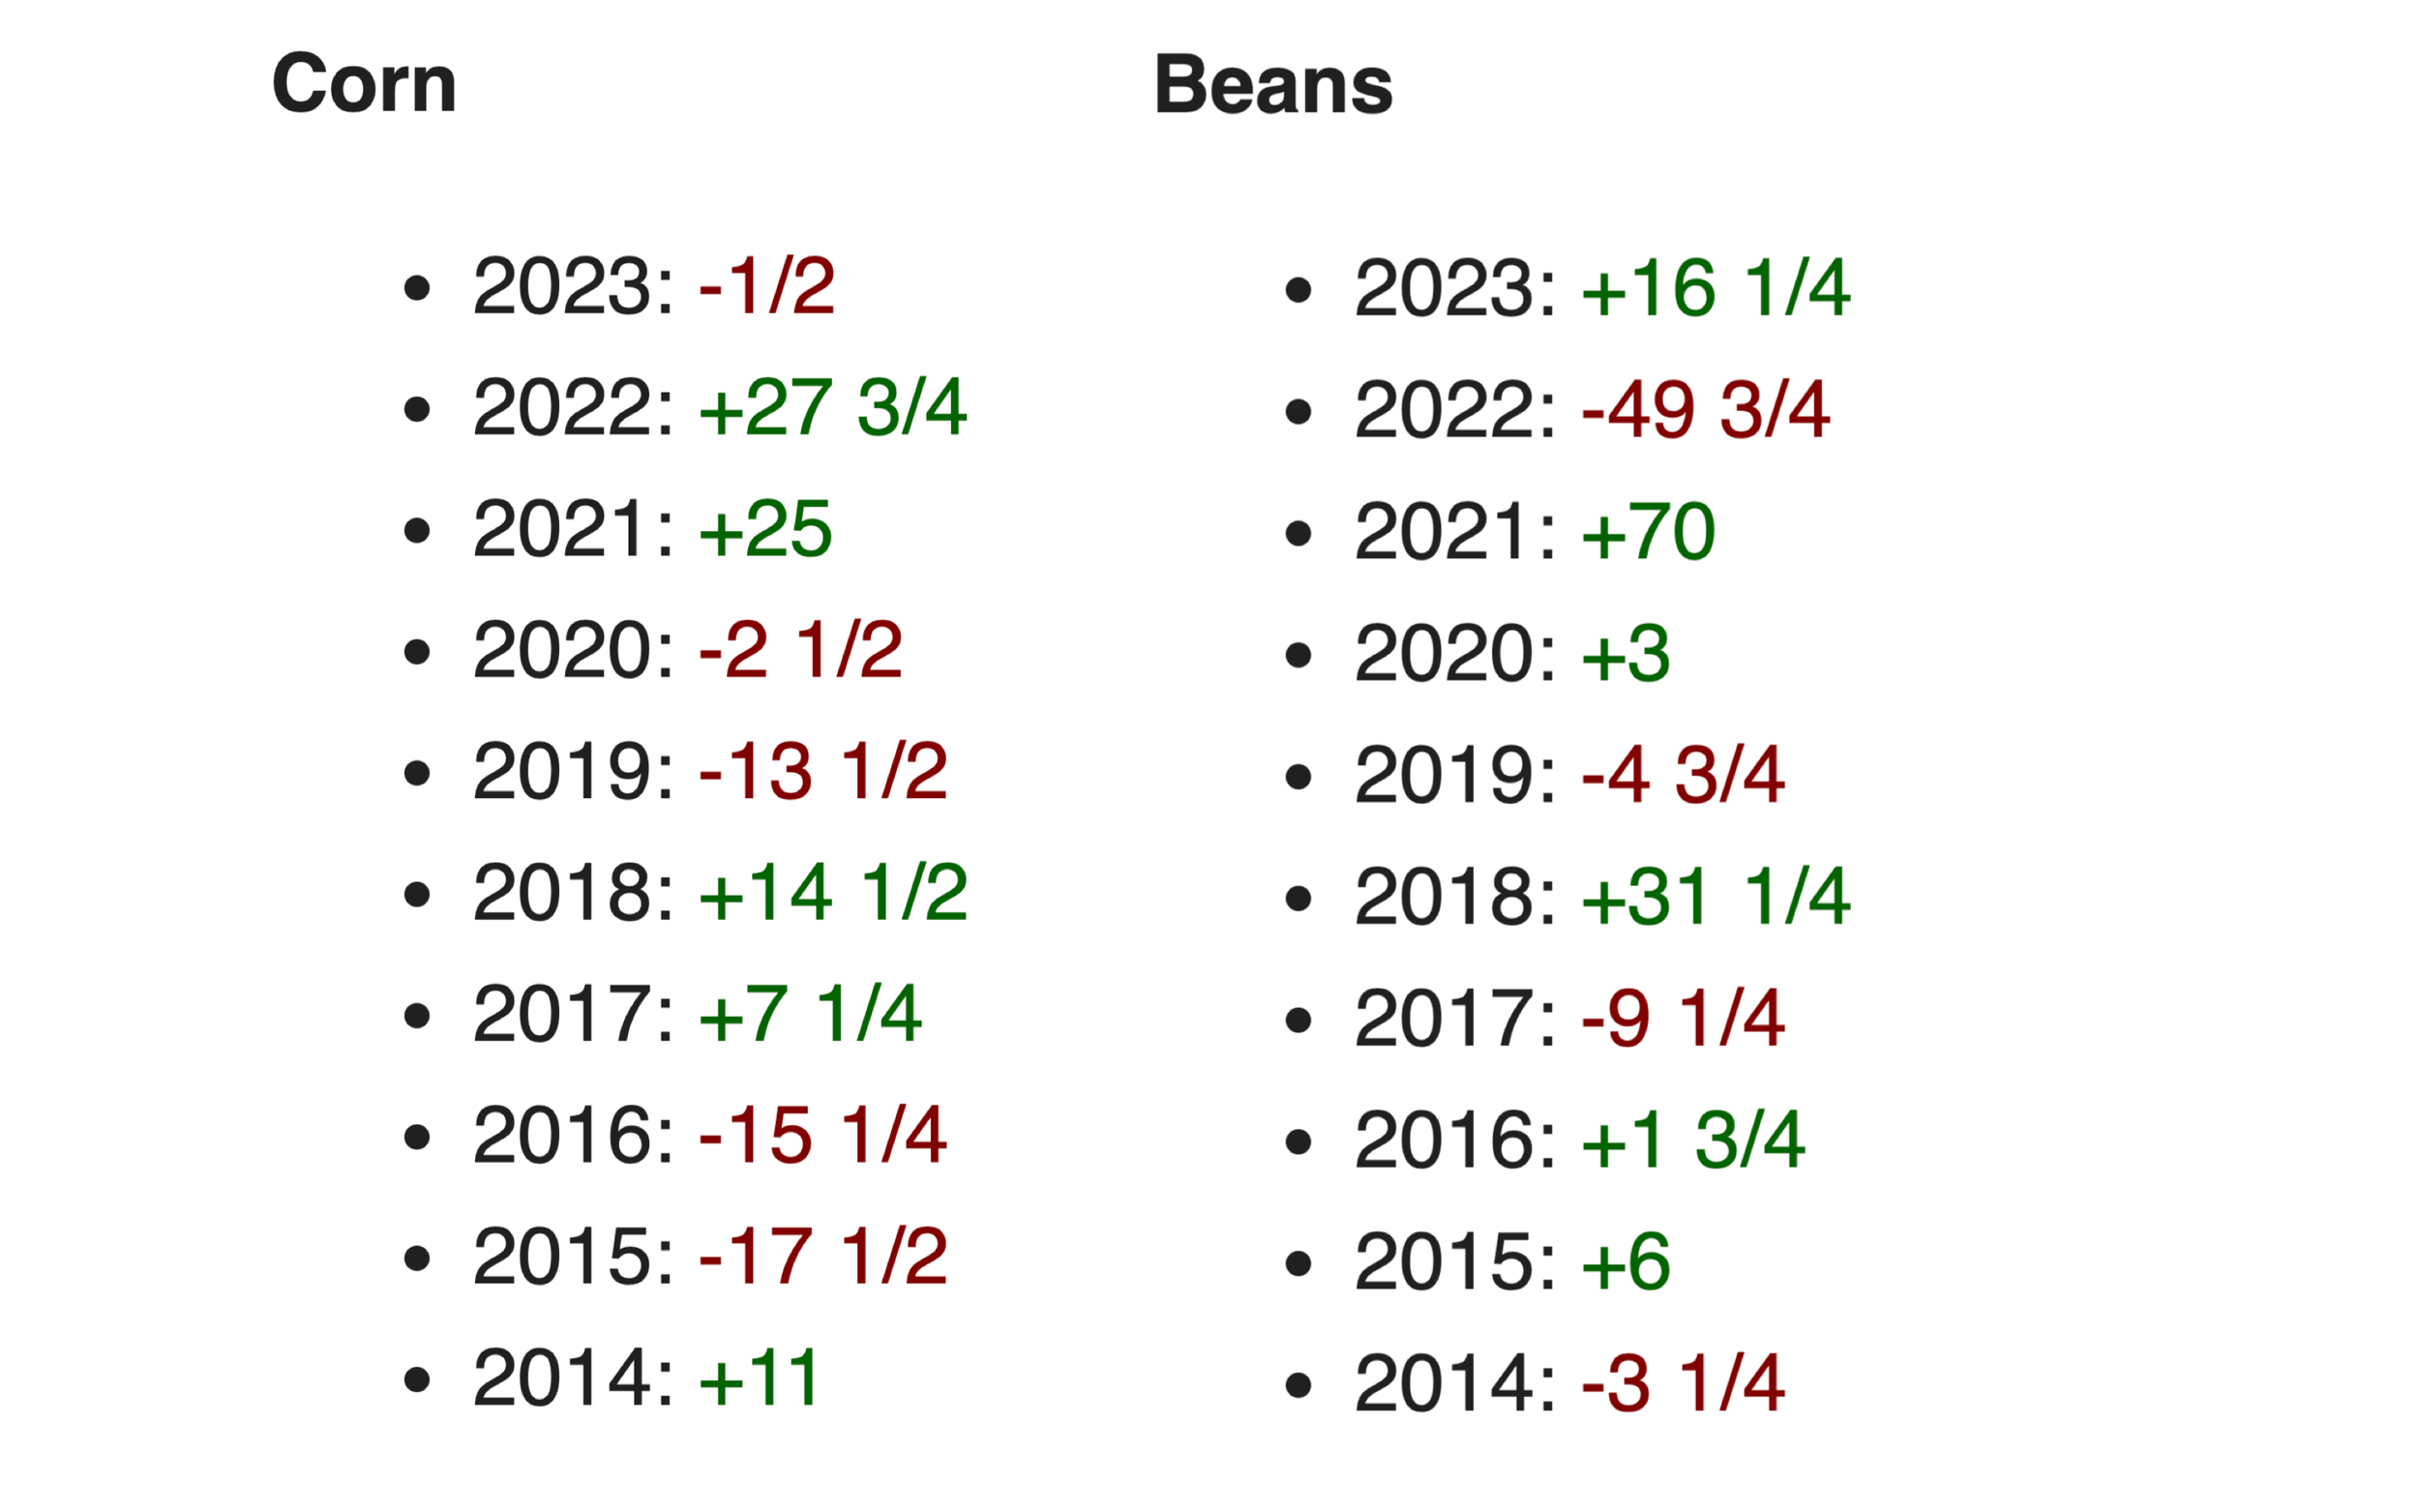
For corn, the prospective plantings acres have came in higher than the USDA outlook forum the past 7 of 11 years.
The prospective plantings have came in lower than the USDA outlook just 3 times. However, 2 of those 3 years have came within the past 3 years alone. In 2022, 2021, and 2018.
Here is a chart from Naomi Blohm of all the numbers.
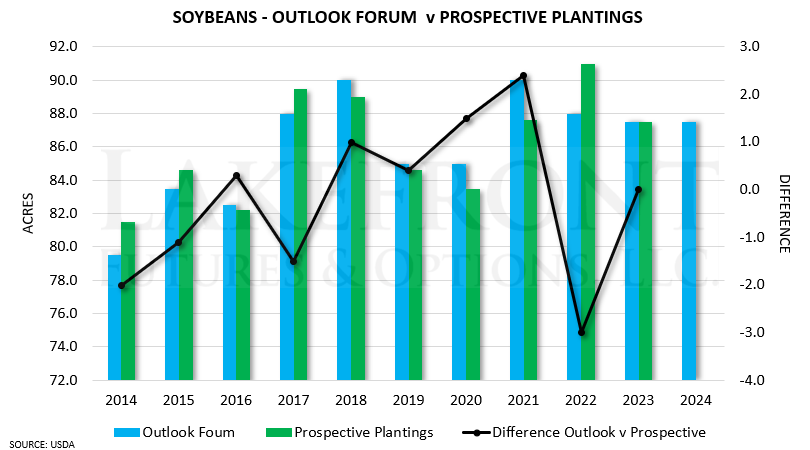
Soybean prospective plantings for this report have came in higher 4 times in the past decade. 2014, 2015, 2017, and 2022.
They have came in lower than the USDA outlook 5 times in the past decade. In 2016, 2018, 2019, 2020, and 2021.
Here is a chart from Darin Fessler of all 3 main grains and how the prospective planting numbers have shaped up compared to the USDA outlook.
From Karen Braun:
"Are US corn acres going to be bearish on Thursday? Not sure, but new-crop CBOT soybeans have been trading around 2.5 times that of corn so far this year, a ratio not recently associated with the shockingly large corn intentions. It's just one factor though, no guarantees."
So essentially she is pointing out that historically when the corn to soybean ratio is high (meaning corn is trading a lot lower than soybeans are in comparison) we tend to not see as bearish of planting intentions.
When the ratio is low (meaning corn is trading higher in comparison to soybeans) we tend to more bearish planting intentions.
The thought process is here is that when corn prices are low, producers often won’t go out of their way to plant extra corn.
Lastly here is the price action from the day of this upcoming report in past years.
As you can see, this report is often times a very big market mover.
Since this report does have the ability to……….
The rest of this is subscriber-only content. Subscribe to keep reading and get every update along with 1 on 1 marketing planning. We go over the upcoming report, managing risk, the South America crop, the US weather, soybean carryout and more.
KEEP READING FOR FREE
Try our daily updates completely free for 30 days.
Want to Talk?
Our phones are open 24/7 for you guys if you ever need anything or want to discuss your operation.
Hedge Account
Interested in a hedge account? Use the link below to set up an account or shoot Jeremey a call at (605)295-3100 or Wade at (605)870-0091
Check Out Past Updates
3/22/24
PRE-USDA REPORT POSITIONING
3/21/24
GRAINS FAIL TO HOLD OVERNIGHT RALLY
3/20/24
MORE SHORT COVERING LEADS TO MORE SHORT COVERING
3/19/24
WHEAT LEADS WITH RUSSIA TARIFF RUMORS
3/18/24
ARE YOU PREPARED FOR 160 OR 190 BU CORN?
3/15/24
BULLISH & BEARISH FACTORS DRIVING GRAINS
3/14/24
ARE YOU COMFORTABLE WITH THIS VOLATILITY?
3/13/24
RALLY TAKES A PAUSE
3/12/24
CONAB A LOT SMARTER & SMALLER THAN USDA
3/11/24
CORN 4TH DAY HIGHER & KEY REVERSAL IN WHEAT
3/8/24
USDA RECAP: POOR REPORT, GREAT REACTION

