
CORN & WHEAT BREAK OUT: EVERYTHING YOU NEED TO KNOW

Overview
Grains mixed following yesterday's USDA report. With corn & wheat leading us higher, while beans were lower despite having a friendlier looking report than corn with the USDA raising corn yield.
As you all know, yesterday the USDA threw a curveball and raised corn yield from 183.1 to 183.6 despite nearly everyone seeing this as a head scratcher given the poorer finish to the crops we had.
But like we mentioned yesterday, the report was not actually bearish for corn, despite an increase in yield.
Even though yield increased, we saw carryout drop yet again via a bump in demand.
Yield is the headline. But carryout is all that matters.
Intially the trade saw this headline so we saw corn pressured, but the trade realized the balance sheet does not look worse than it did. So we rallied back and closed green despite an increase in yield. To me, that is a friendly sign.
Here is a good quote from the highly respected trader Brian Splitt that basically sums up yesterdays price action:
"If the market wants to go up after seeing these numbers, it's because the market just wants to go up now."
This is the reason many believe yield should not have been increased.
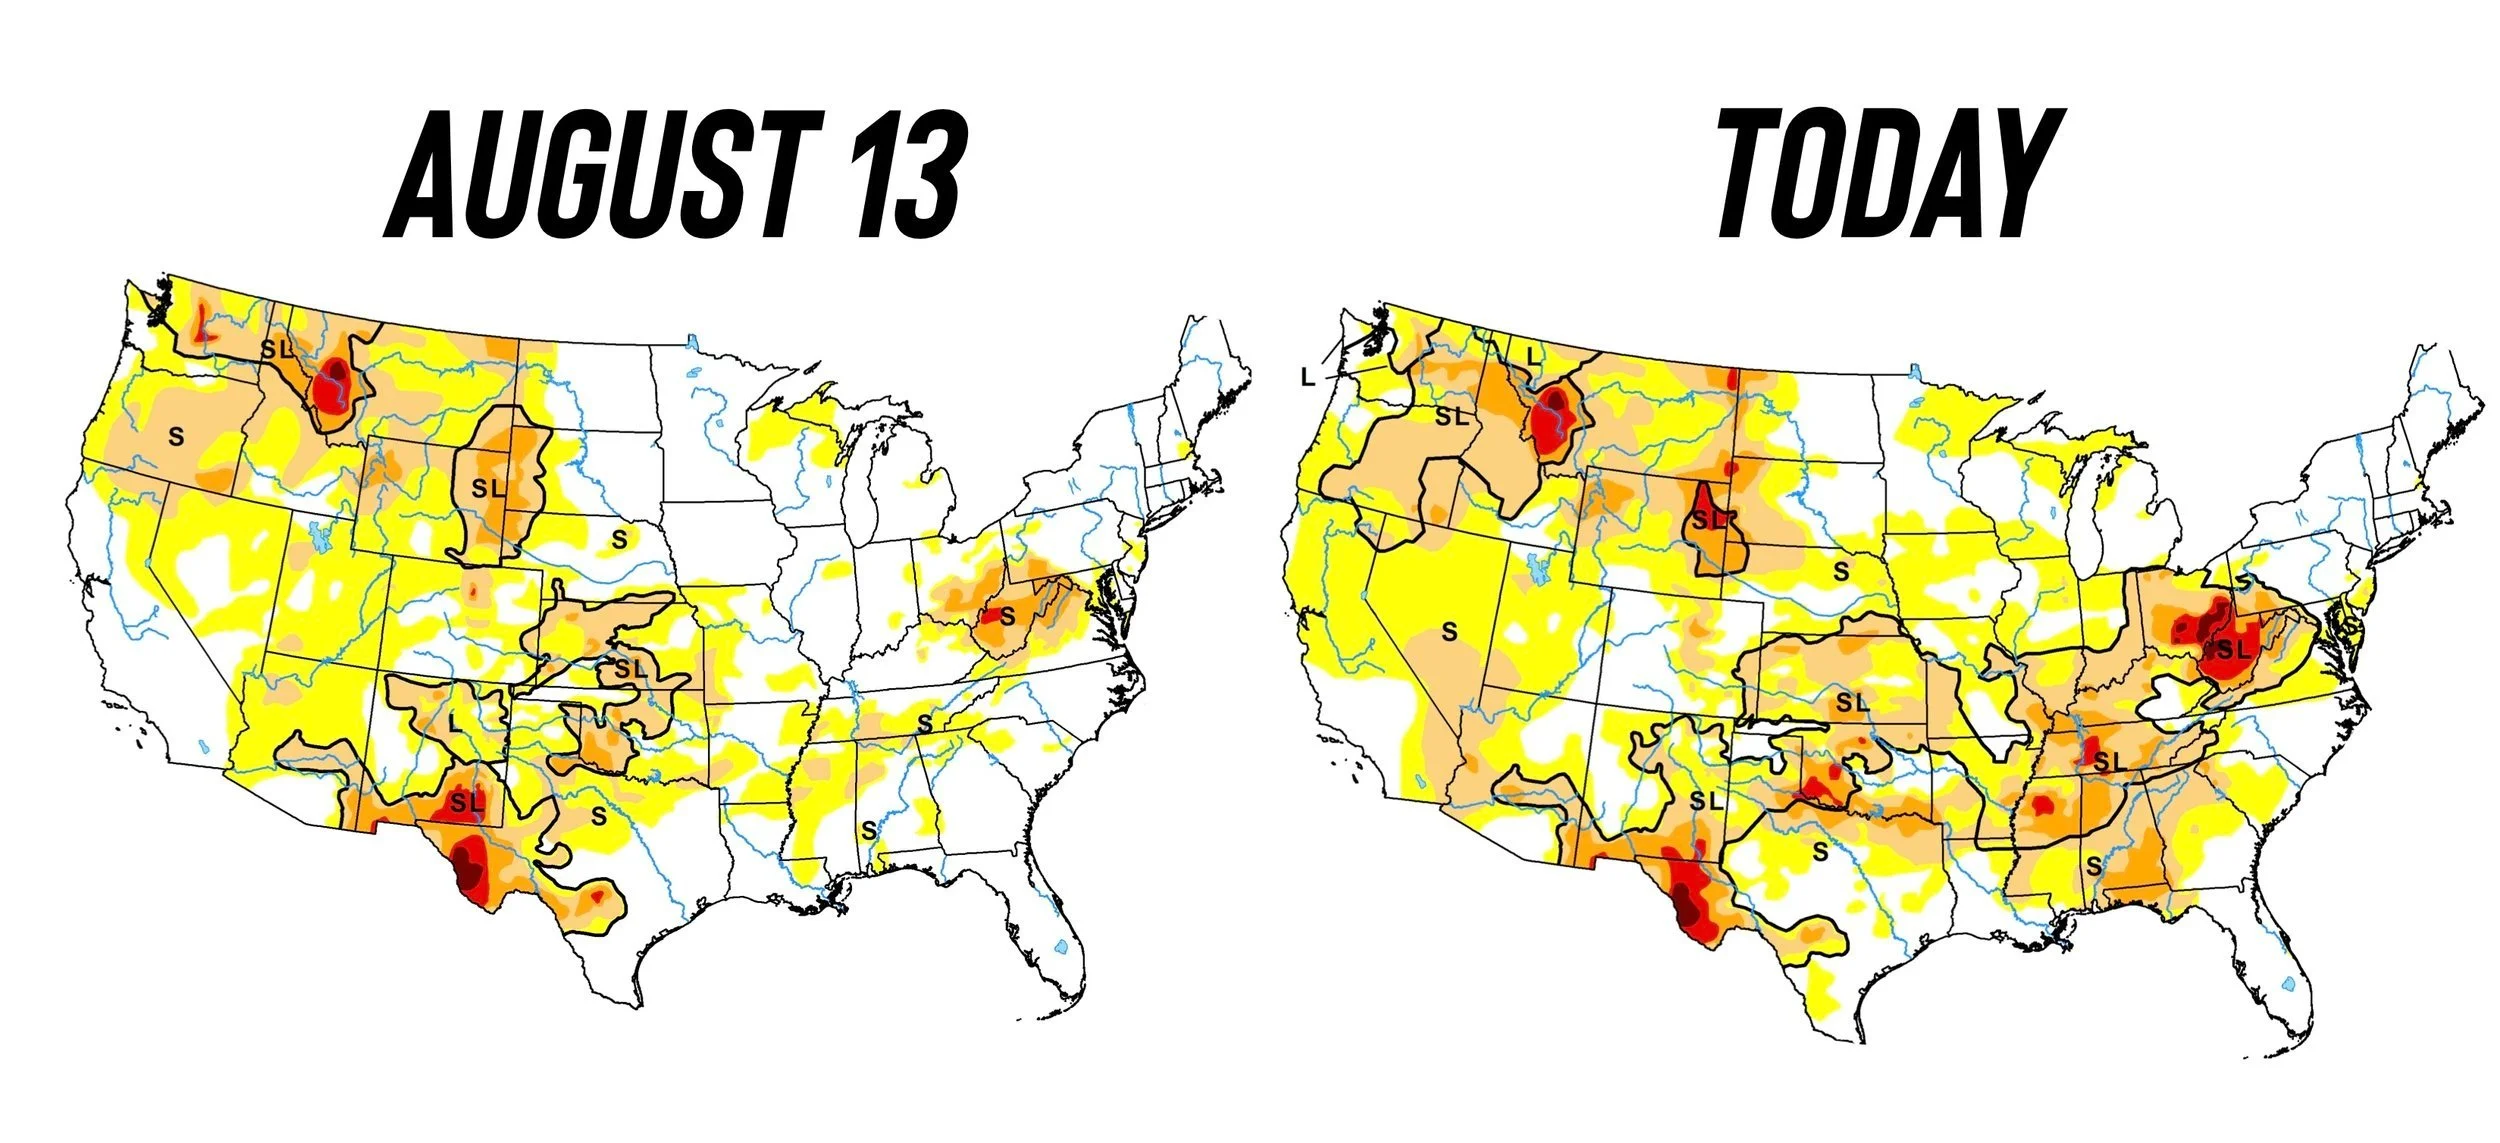
Here is a drought monitor change. Not exactly an ideal finish.
Here are a few other quotes from respected individuals across the ag industry.
Arlan Suderman of StoneX:
"The market has greater confidence that the size of the corn & bean crops has been priced in following yesterdays report. Midwest forecast is also wetter, suggesting that we won’t be bringing in two record crops quiet as quickly, easing storage issues a bit."
Karen Braun:
"Market got caught looking the wrong way on corn yield, but the bigger number doesn’t feel terribly catastrophic for the balance sheet right now? As long as corn can find demand, supplies may be kept in check."
Jason Britt President of Central States Commodities:
"Hearing more and more clients tell me this is not the finish for soybeans they had hoped for. Don’t think the USDA recognizes this tomorrow, but I do believe we have had our highest bean yield print."
From Darren Frye of Water Street:
"Not a lot of soybeans have been harvested, but the reports we are hearing have been just okay. Some are better than last year, but 70-80% of them are equal to or slightly less than last year."
Darrin Fessler of Lake Front Futures:
"180 & 52 is my guess where the crop is today. I've been talking about the heat & dryness the last 3-5 weeks impacting the finish."
River Problem
Mississippi river levels are severely low.
This has happened the last 2 years as well at this time (2022 & 2023).
We had a hurricane down south, but from what it looks like the hurricane did not bring as much rain as expected.
This is not something we want to see at harvest time. As it harms exports which could lead to pressure on grain prices.
During growing season, rain is negative for prices for the most part. But now, rain would be seen as a friendly factor as it will help the river levels and also slow down some of the supply that is going to hit the markets at harvest.
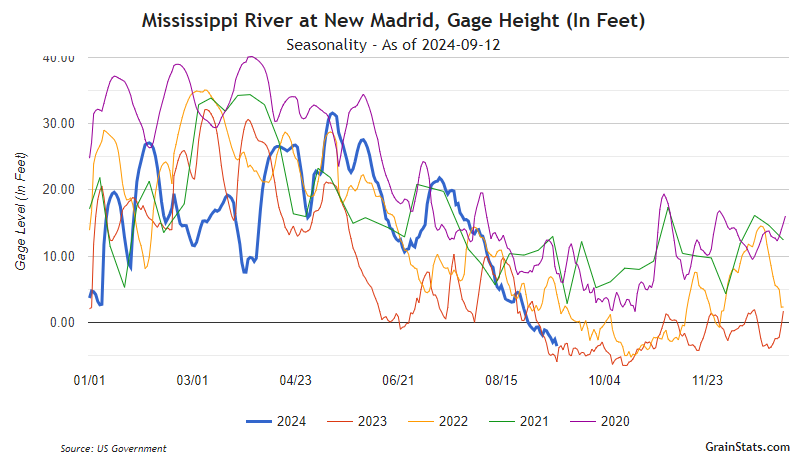
(Chart Credit: GrainStats)
The Funds
The funds have been record short grains all year long.
They have finally again started buying.
They are still heavily short, which leaves room for them to buy more.
And until we get deeper in harvest, if the funds want to buy it will not be negated by farmer selling like it had in the past.
(Example: Funds were buying corn on the August sell off, yet prices kept dropping because it was met with farmer selling from all of the basis contracts that needed to be priced etc.)
(Chart Credit: Karen Braun)
Typically we do NOT share full updates like this on social.
Make sure you subscribe for future ones along with our signals & 1 on 1 plans.
Try 30 days completely free: CLICK HERE
Today's Main Takeaways
Corn
Amazing two days of price in corn.
Despite a bump in yield, the increase in demand essentially offset the balance sheet.
When yield goes higher, yet carryout drops. That is a good sign. That is now the 2nd report in a row where this has happened.
Some are skeptical that the USDA has demand too high for corn, but that goes to show that they too believe these low prices will create demand.
As for the report, they have 5 of the top 6 growing states producing a record crop:
NE: 195 (Record by 1 bpa)
IA: 212 (Record by 8 bpa)
IL: 222 (Record by 8 bpa)
IN: 210 (Record by 7 bpa)
SD: 162 (Ties record)
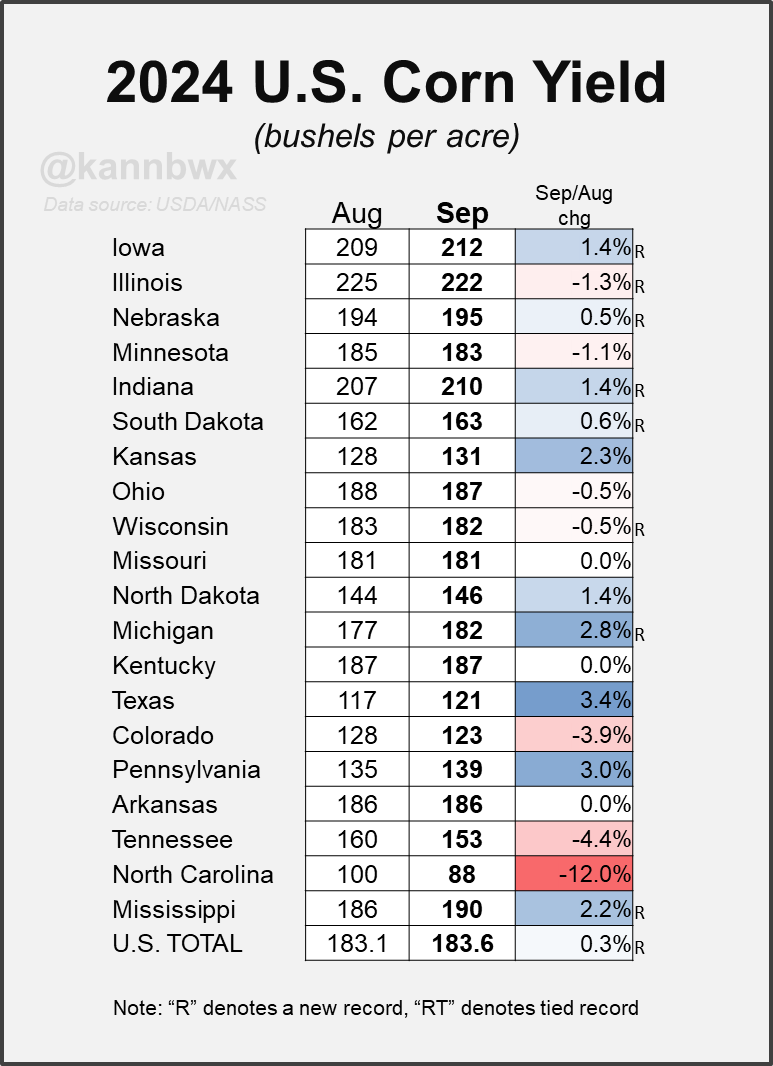
(Chart Credit: Karen Braun)
Bottom line, these lower prices are creating demand like we've been talking about for a long time now.
I think we will get a decent shot and opportunity to take some risk off before all the harvest supply hits the market.
Because do not get me wrong, when this supply hits the market, prices will take it on the chin.
But for now, I do not see any reason we can’t go higher until so.
We have the funds short. No farmer selling for now. The charts are turning up.
Here is how I see prices playing out:
We continue higher until harvest, get some pretty heavy pressure when we get that harvest supply, and then continue higher looking towards next spring and summer.
Next year we will likely be looking at a lot less acres. Another thing to be aware of is that if yield does fall closer to 180, it will cut our carryout heavily well below 2 billion bushels.
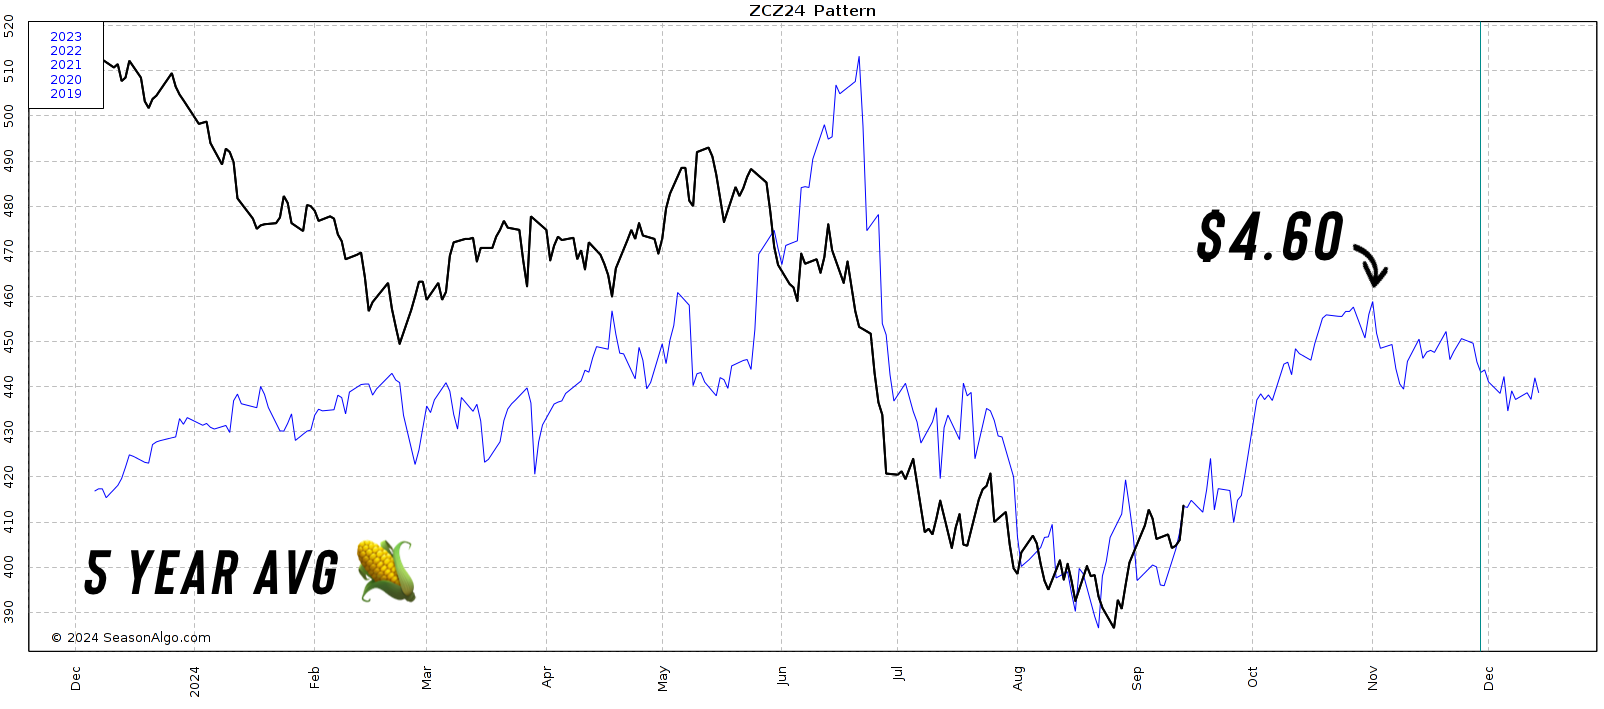
Seasonal Chart
We are right on track for this 5 year seasonal pattern for corn thus far.
IF we were to follow this completely, it would have us topping out at $4.60 November 1st.
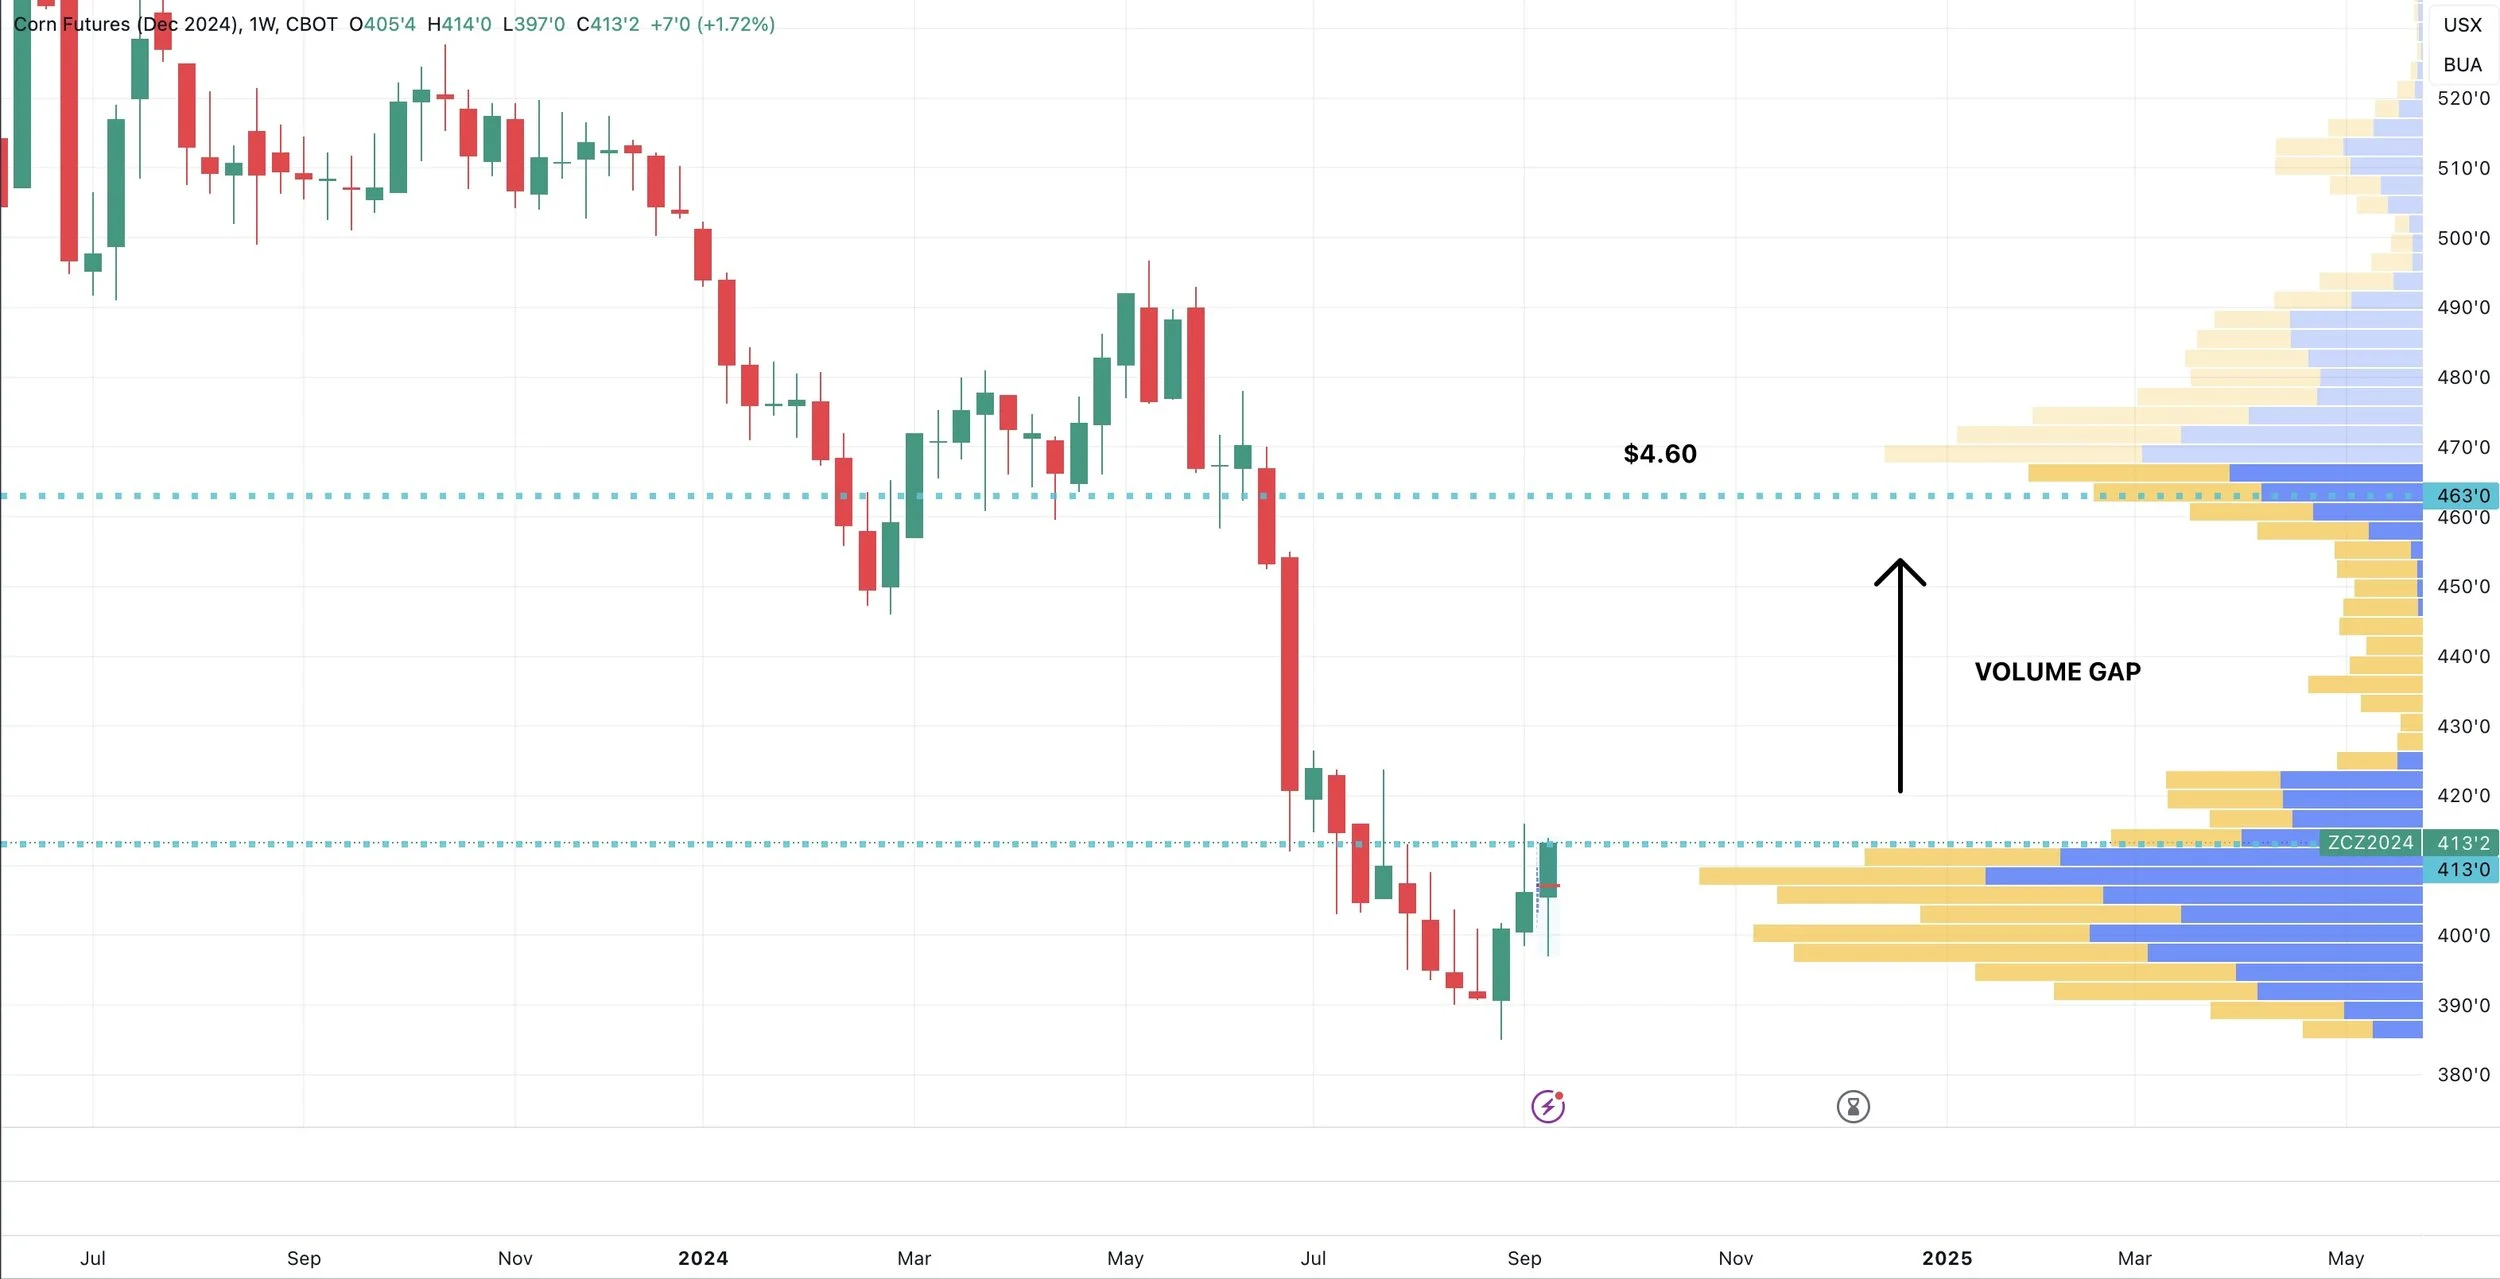
Interestingly, here is a weekly corn chart that shows volume.
As you can see, due to the fast brutal sell off in July, the entire move down created a volume gap.
We currently have a massive volume gap up to $4.60.
What is a volume gap & what does it mean?
They are areas of low volume and prices can move very quickly through them to the next volume shelf.
So perhaps that $4.60 area will again be where we make our fall highs.
Altough we will probably advise taking some risk off before hand especially for those that have to move stuff off the combine.
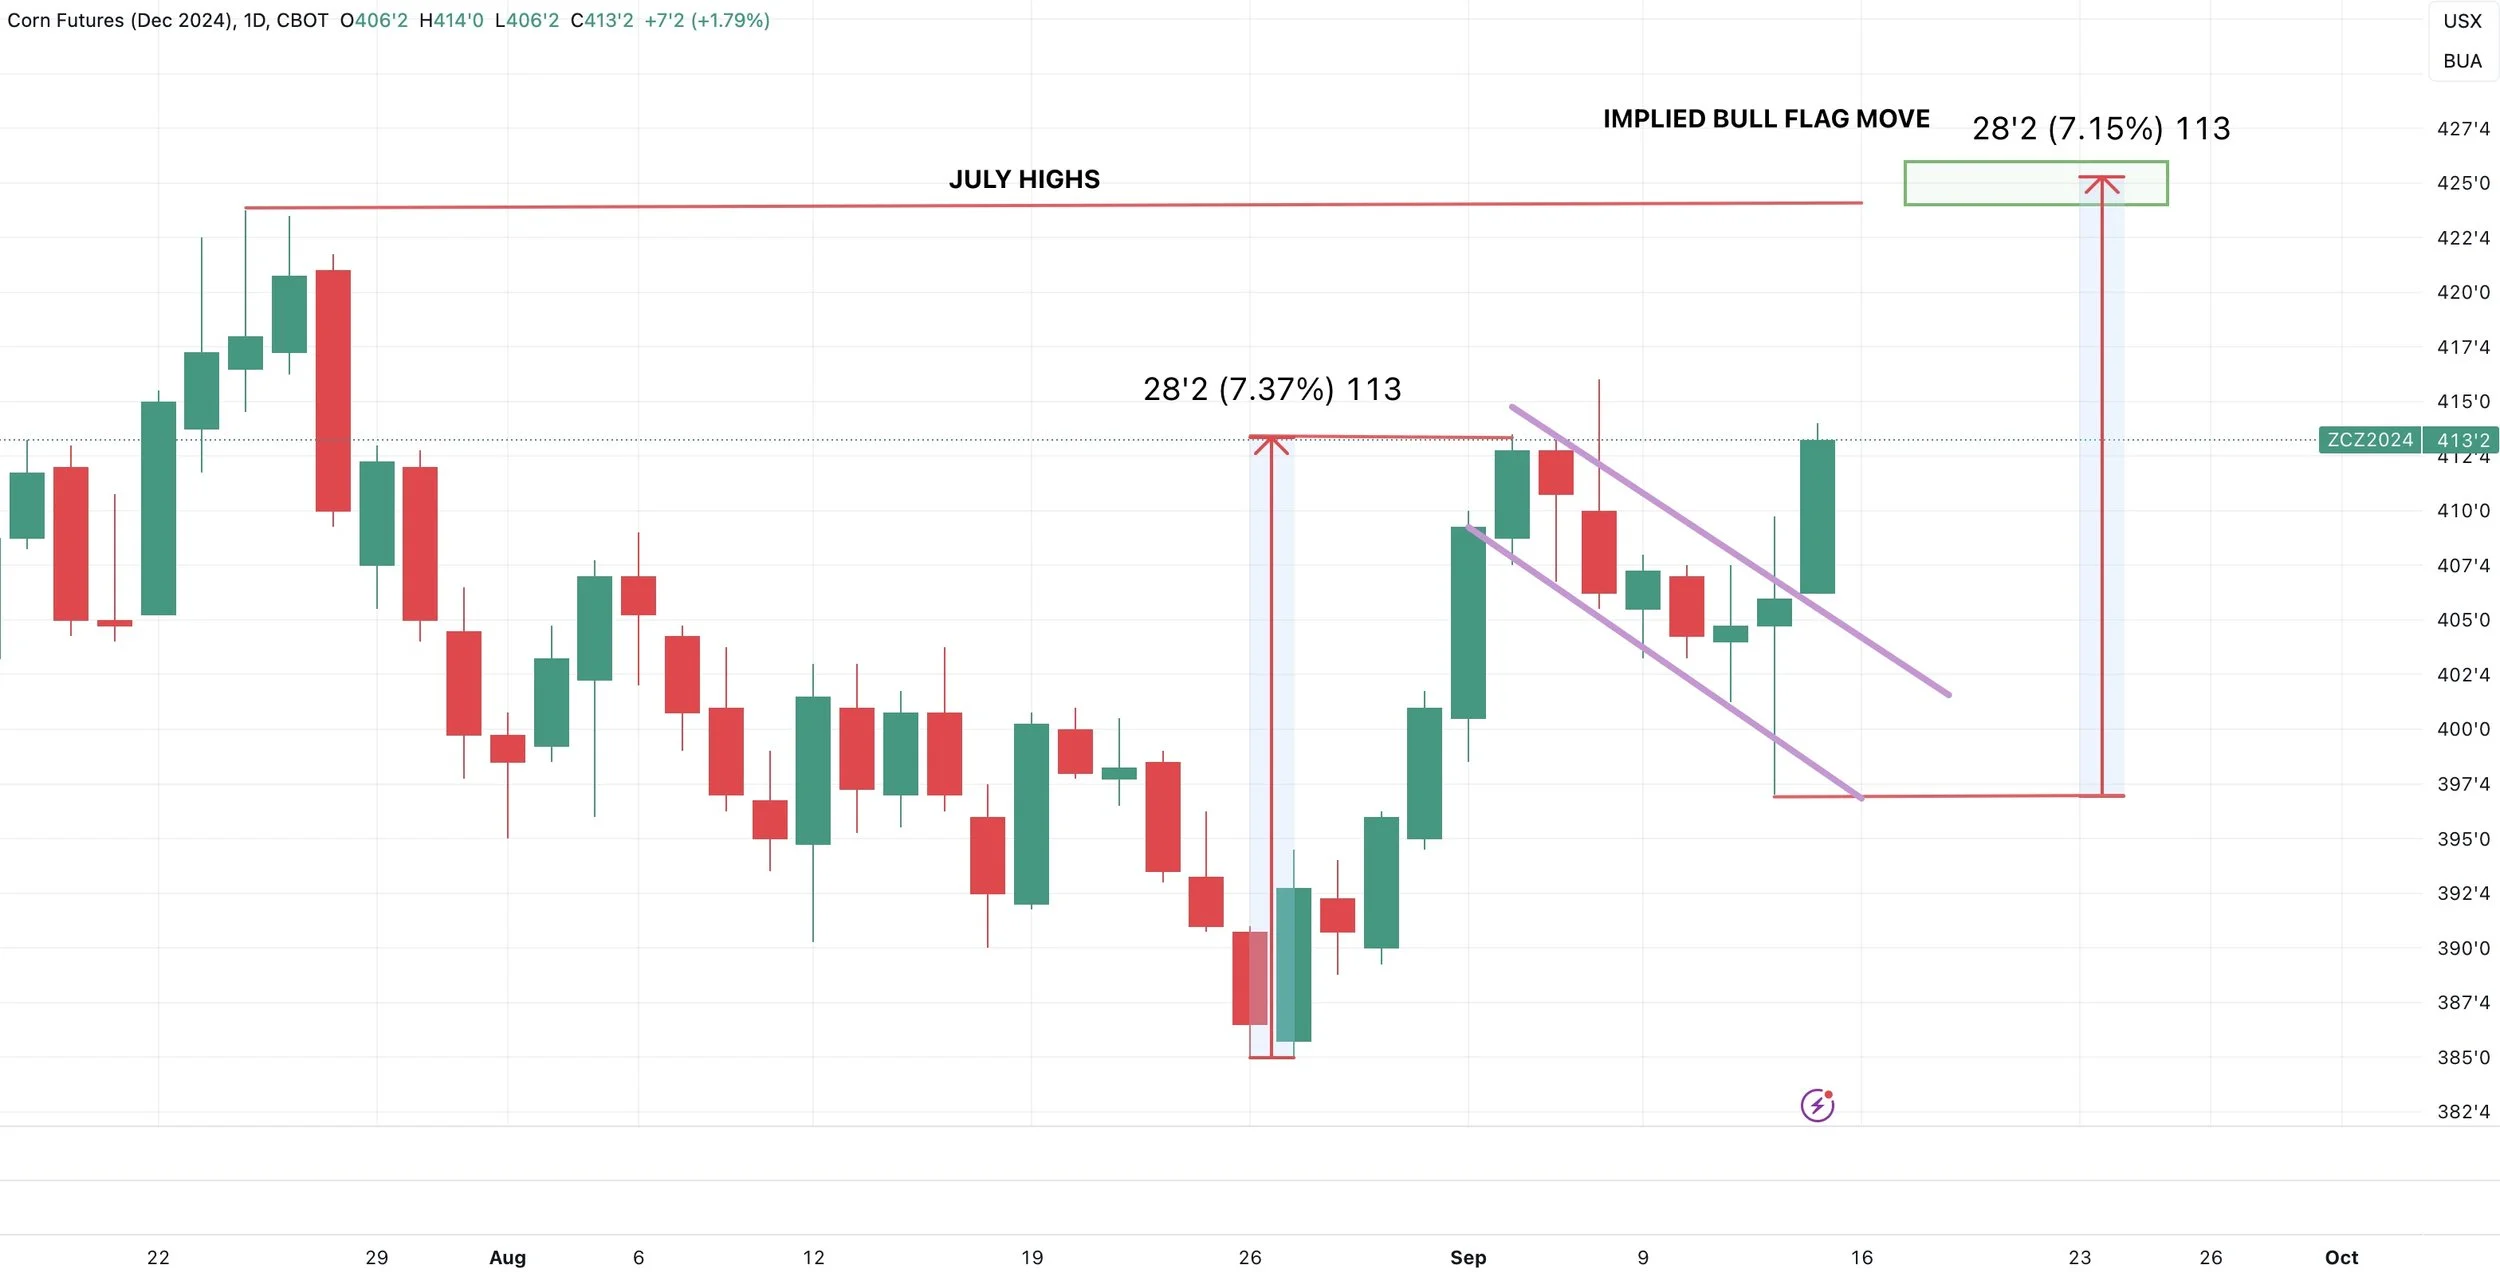
Weekly Dec Corn
If you scrolled past yesterday's audio and looked at my charts, you would’ve seen that I posted a potential bull flag forming in corn.
Today it looks like we confirmed the bull flag breakout.
This bull flag has an implied move up to our July highs around $4.23 to $4.26
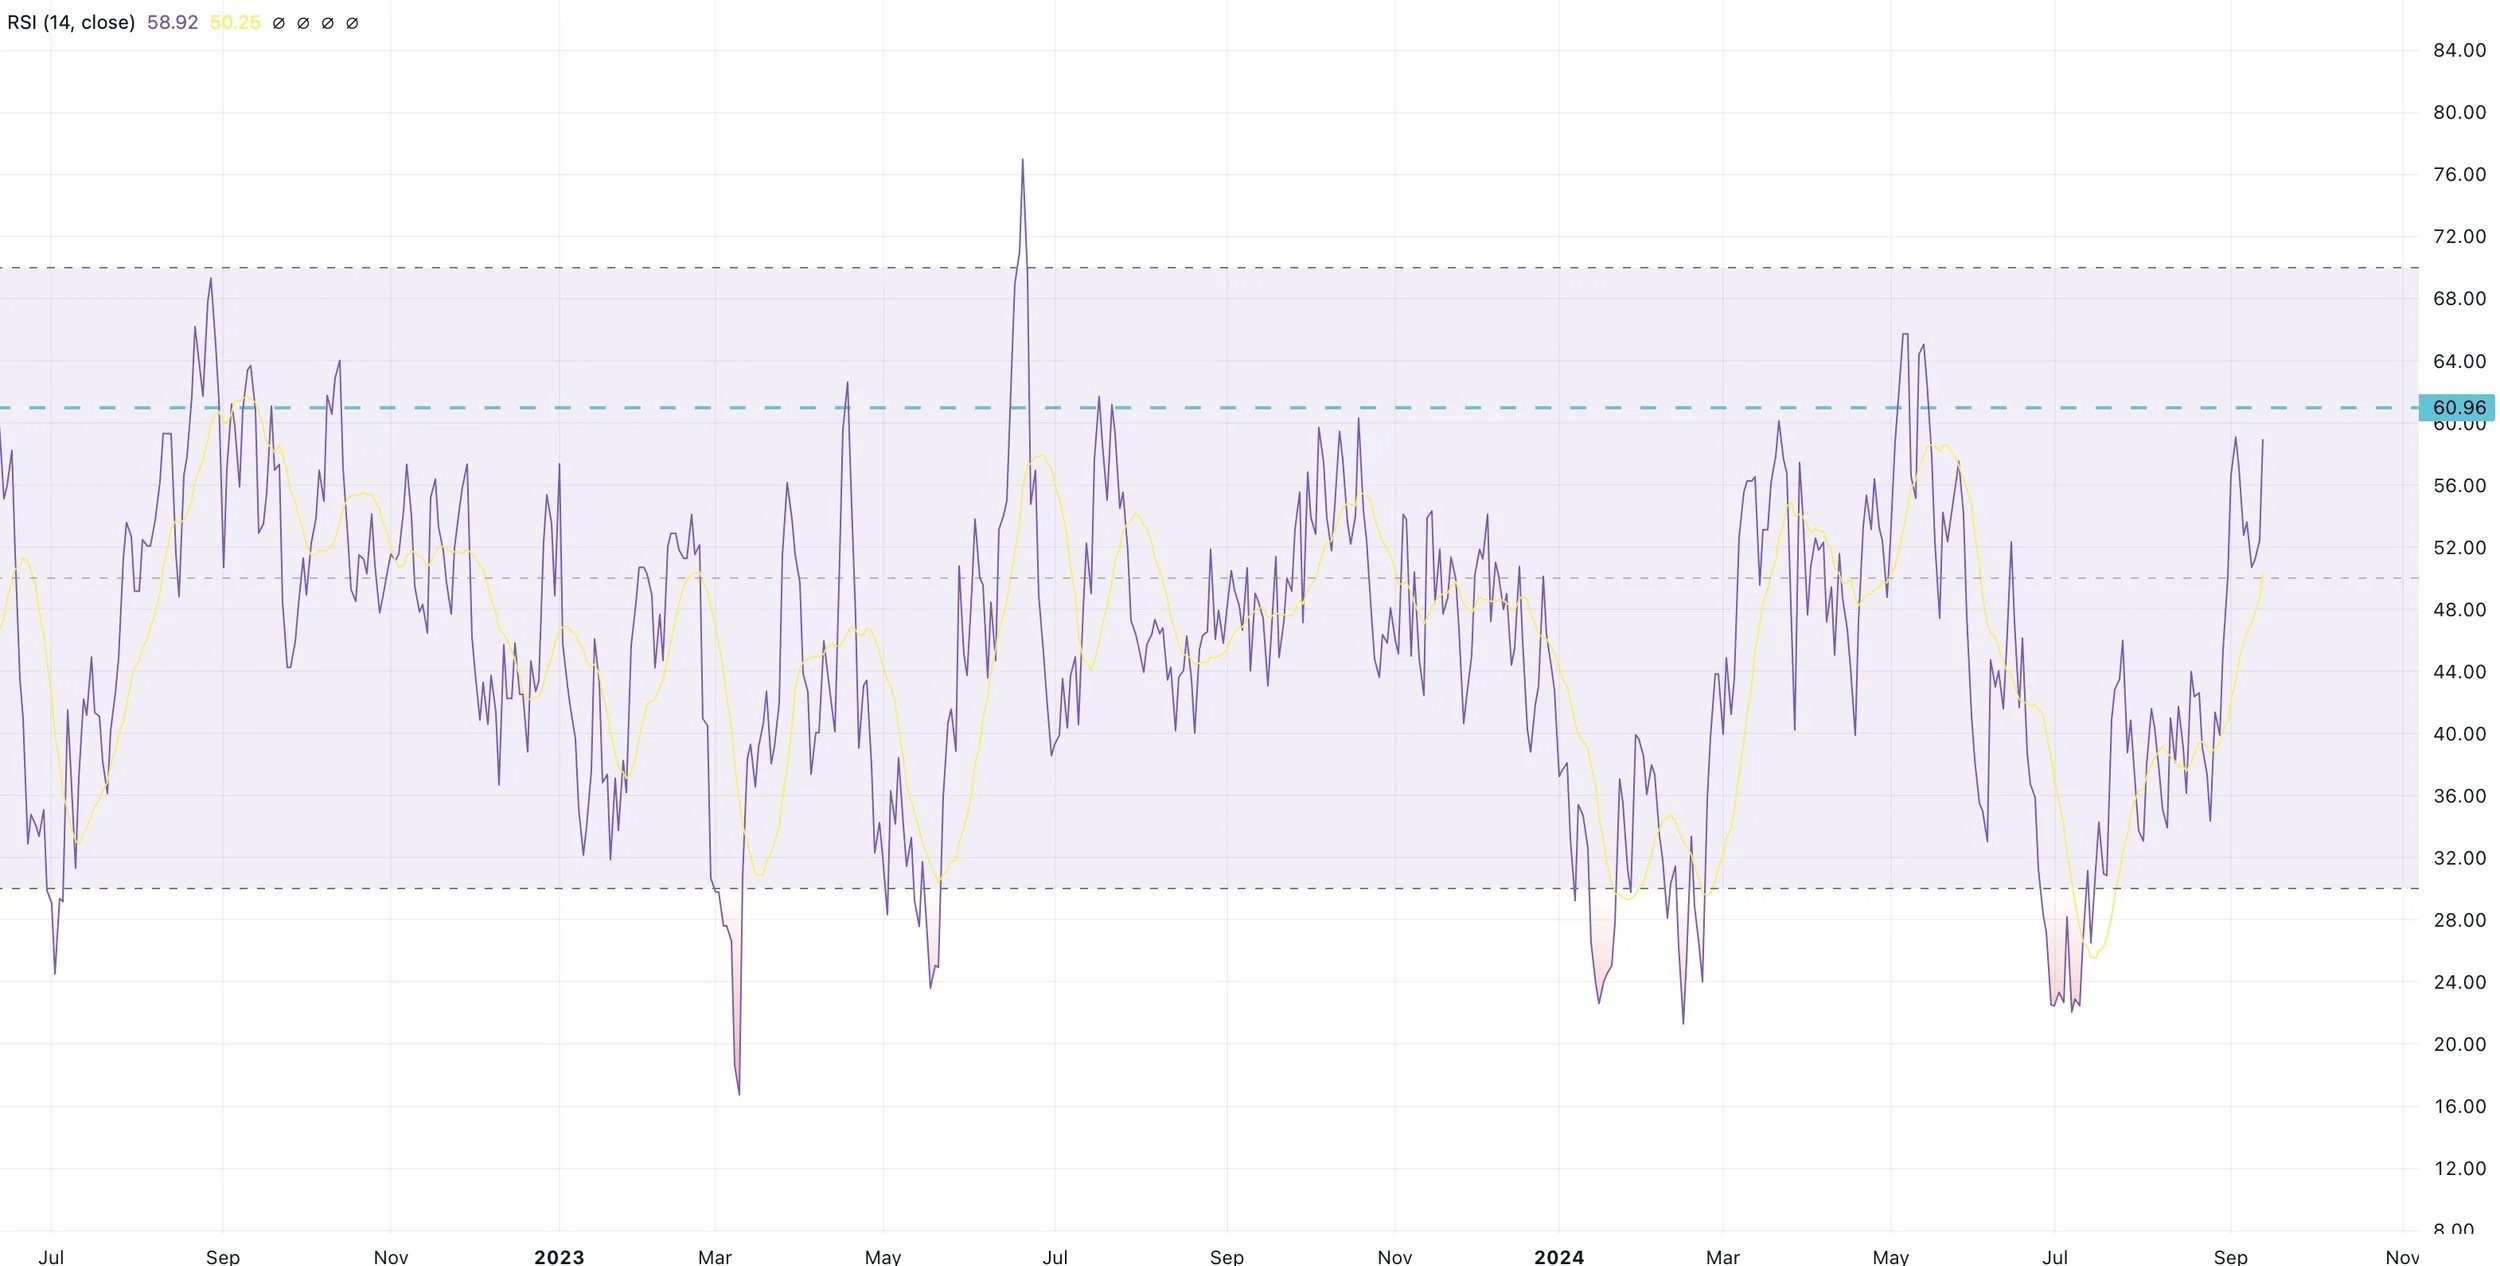
Daily Dec Corn
One thing I want to be aware of short term is the RSI.
We are not overbought yet, but we are nearing levels where we have previously topped out at.
What the RSI means is simply how overbought or oversold a chart is.
Like Our Updates?
Try for Free: CLICK HERE
Soybeans
Soybeans were up double digits, but gave back all of their gains. Posting an ugly close.
We were lower mostly due to lack of news, and we simply hit resistance on the charts and failed.
Yesterday's USDA report was a "snooze". No major changes.
But what the report did do was increase the likelihood that we saw our highest yield print of the year.
They raised corn, but not beans when all of the talk not long ago was how Pro Farmer thought we'd have a monster 55 bpa crop.
Brazil
Brazil is going to soon be the number #1 factor in the bean market.
IF it stays dry, it COULD be a major market mover.
As you all know, they are having their driest dry season on record.
Here is their drought change the past 52 weeks.
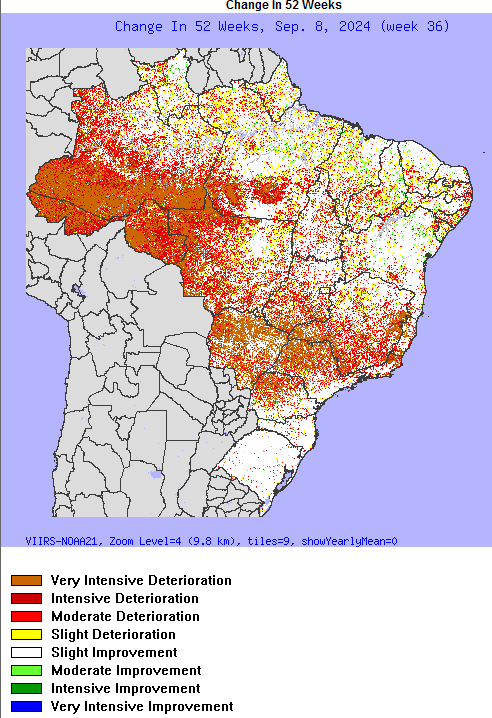
Typically the rainy season starts right about now but doesn’t really pick up full swing until October.
However, they still have not got any rain. Which has already pushed back their planting.
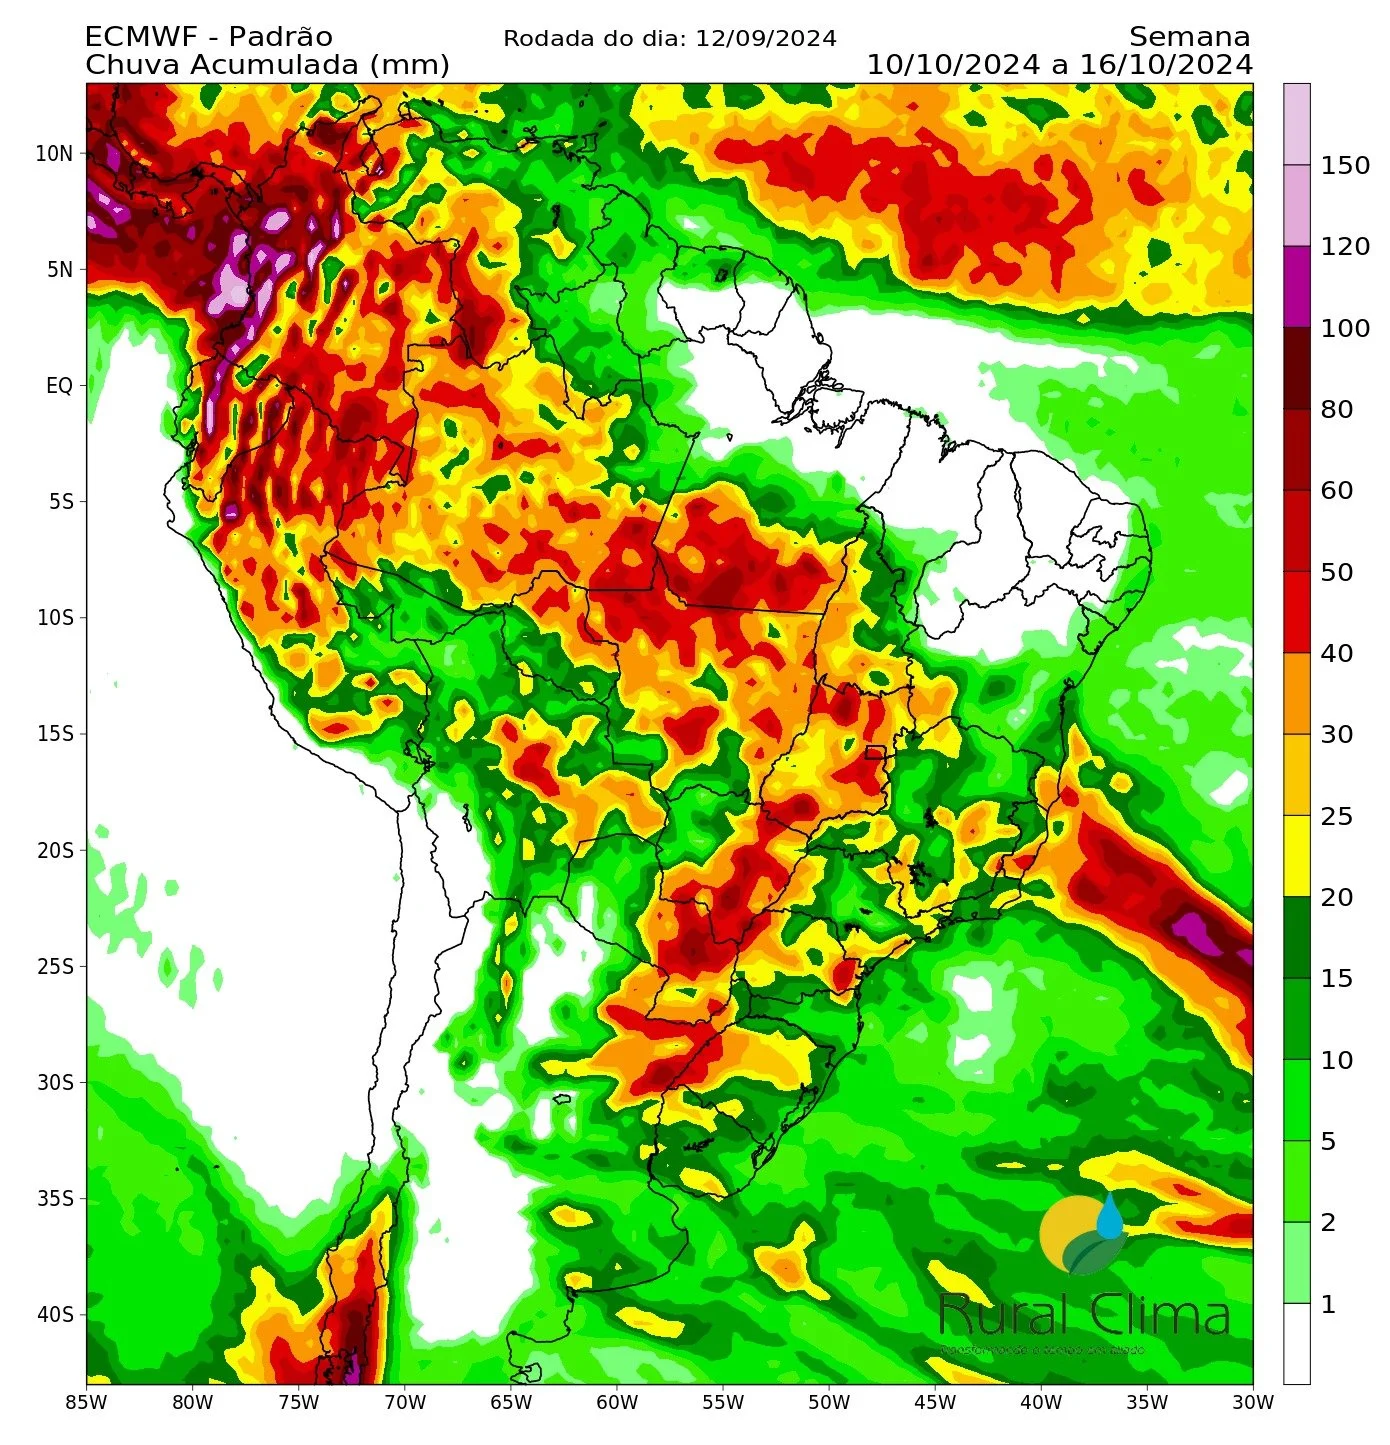
Tthe forecasts are now throwing in rain for early October. Which was part of the reason beans were under pressure today, but these long range forecasts have not been accurate at all thus far.
October 10th to 16th
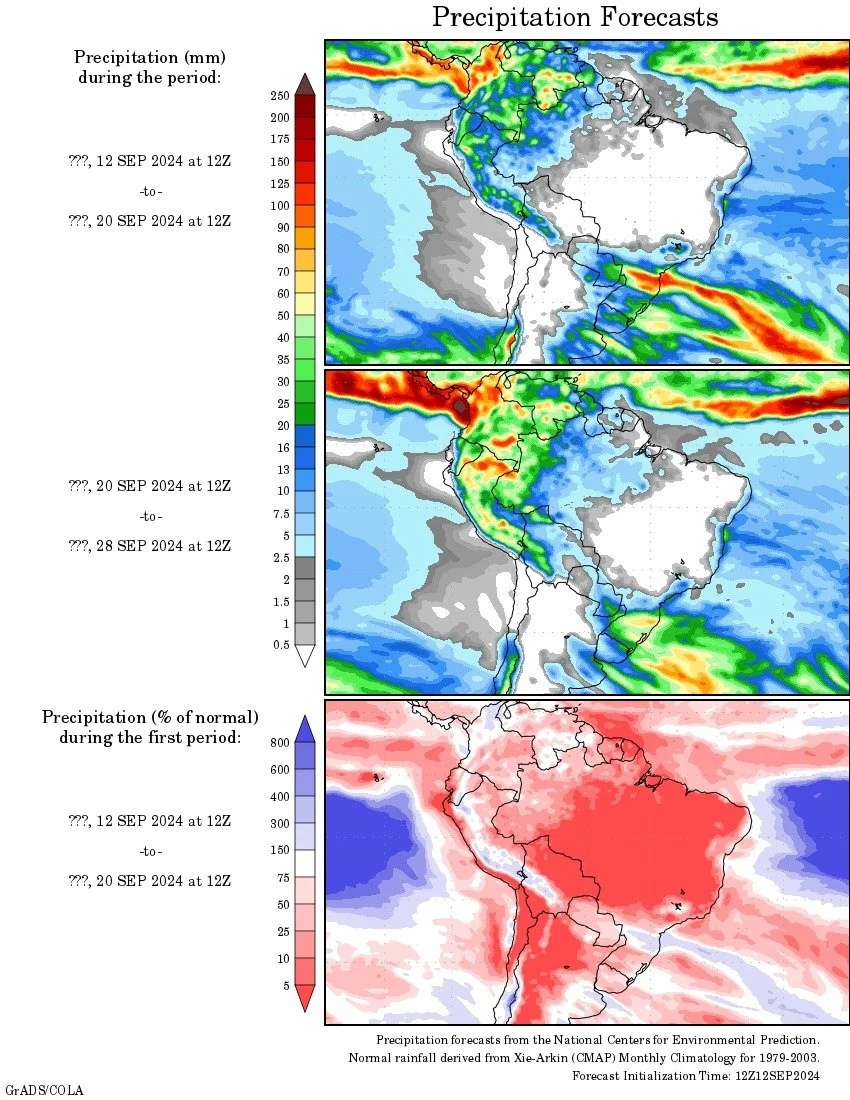
Late September
Sep-Oct-Nov Outlook Anomaly
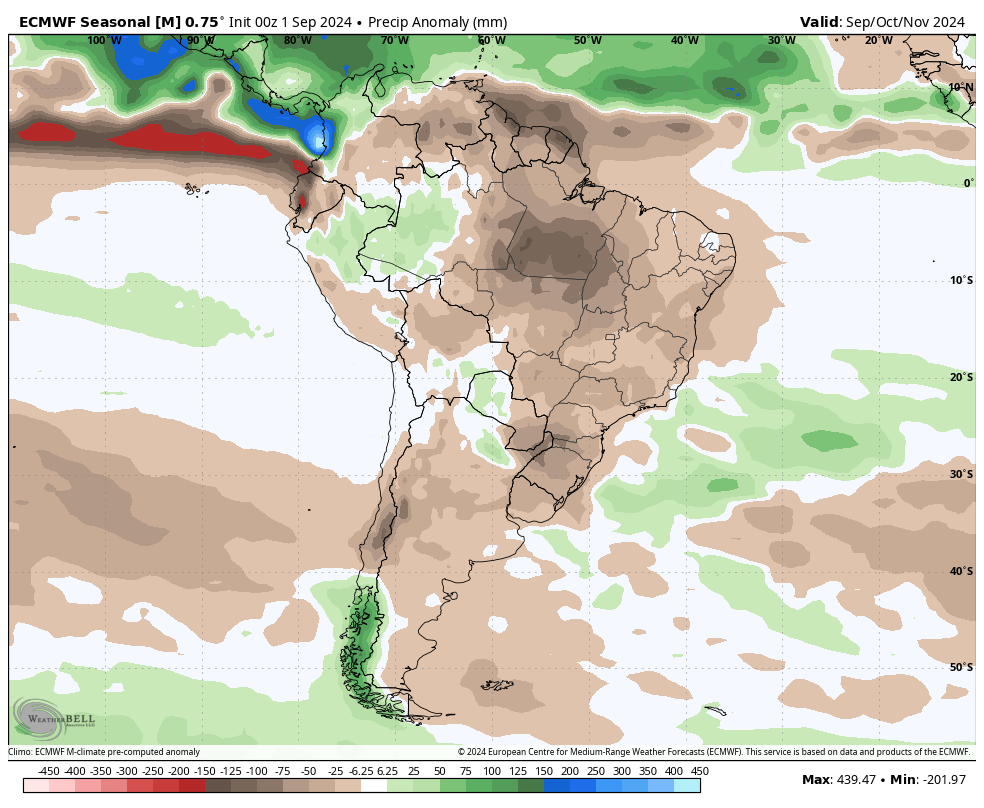
But keep in mind that these long range forecasts have not been reliable at all. They have been calling for rains for weeks only to eventually take the rain out of the forecasts.
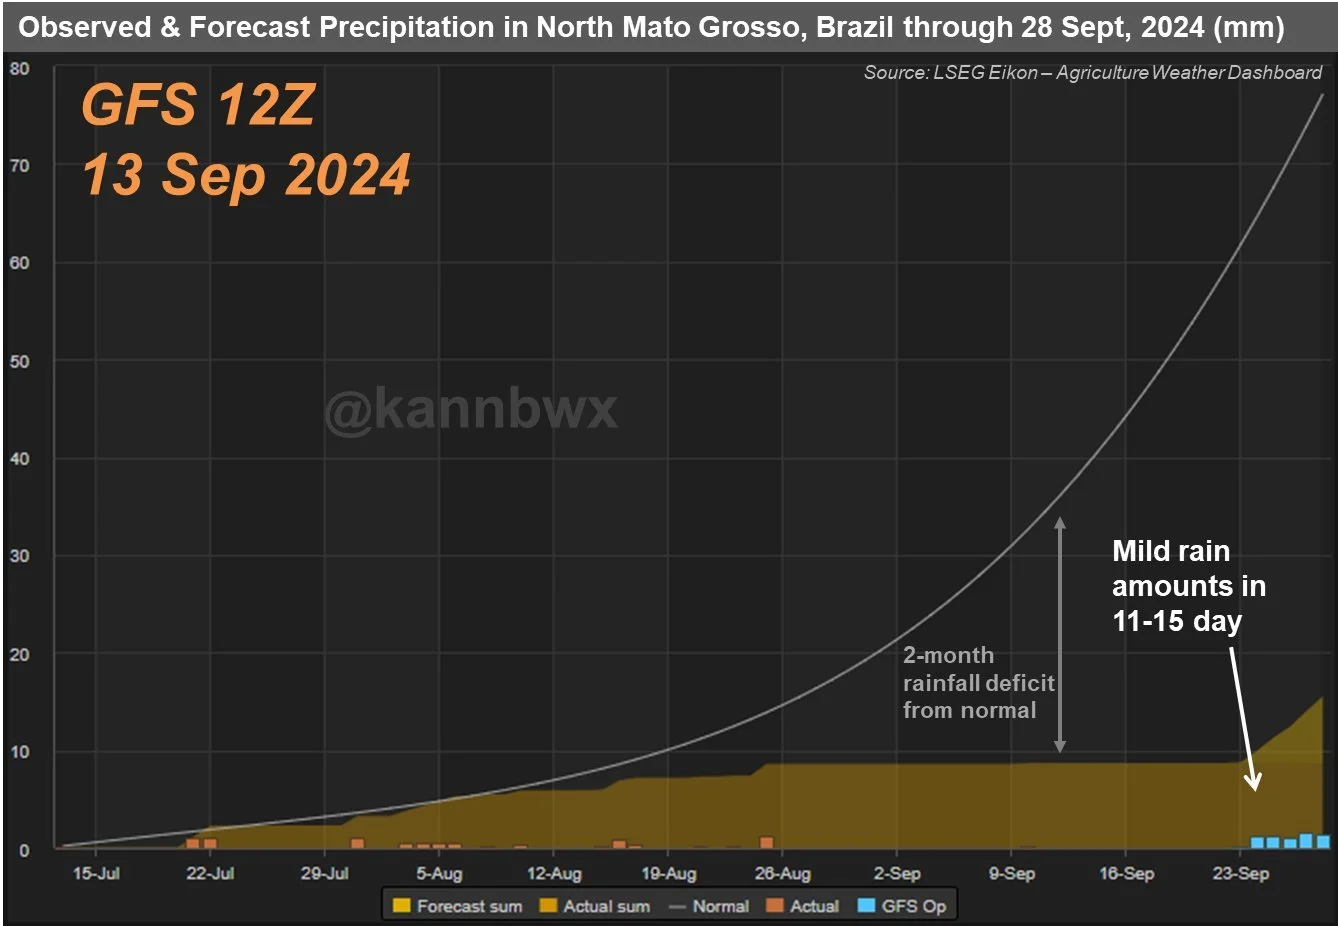
Here is a great chart from Karen Braun that shows how inaccurate the GFS rain forecasts have been.
The big yellow box on the bottom is the rain they forecasted to fall.
The non existent pink boxes is rain that actually fell.
The blue boxes are what the GFS currently forecasts.
The grey uptrend is their normal rainfall for the time of year. As you can see, they are well behind.
Now yes, one single monsoon rain could fix all of their problems, but if that rain does not come it will be a major benefit to soybean prices. Even if the market just believes for a few weeks that Brazil isn’t going to get rain, the market will react.
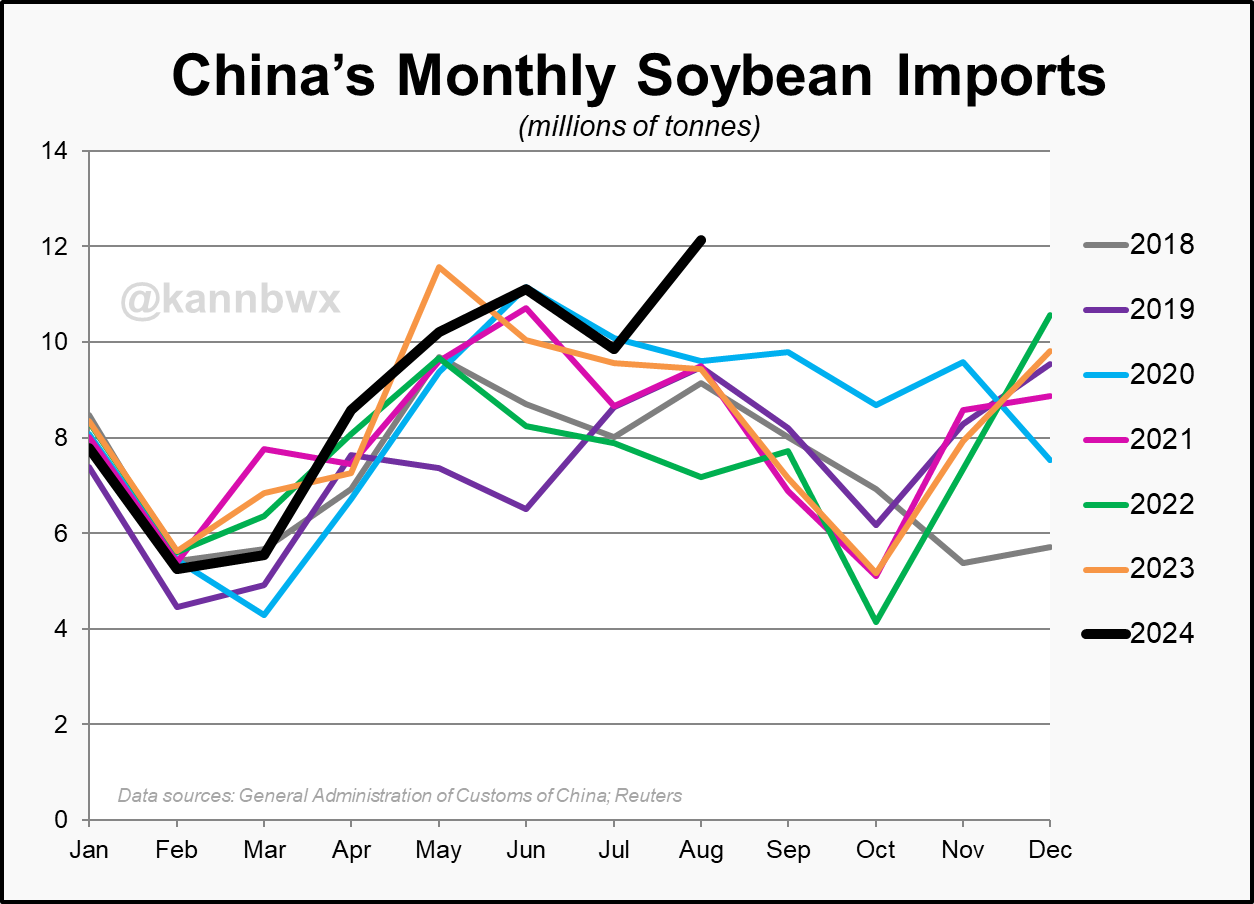
A major thing to watch is still China.
In August, China imported an all-time record amount of beans for the month.
However, a large portion was from Brazil.
But it goes to show that China likes and needs beans.

(Chart Credit: Karen Braun)
Soybeans off the gulf are also the cheapest in the world.
US beans will remain cheaper than Brazil until January.
So we need China to continue to step in.
The next few months will be key for exports.
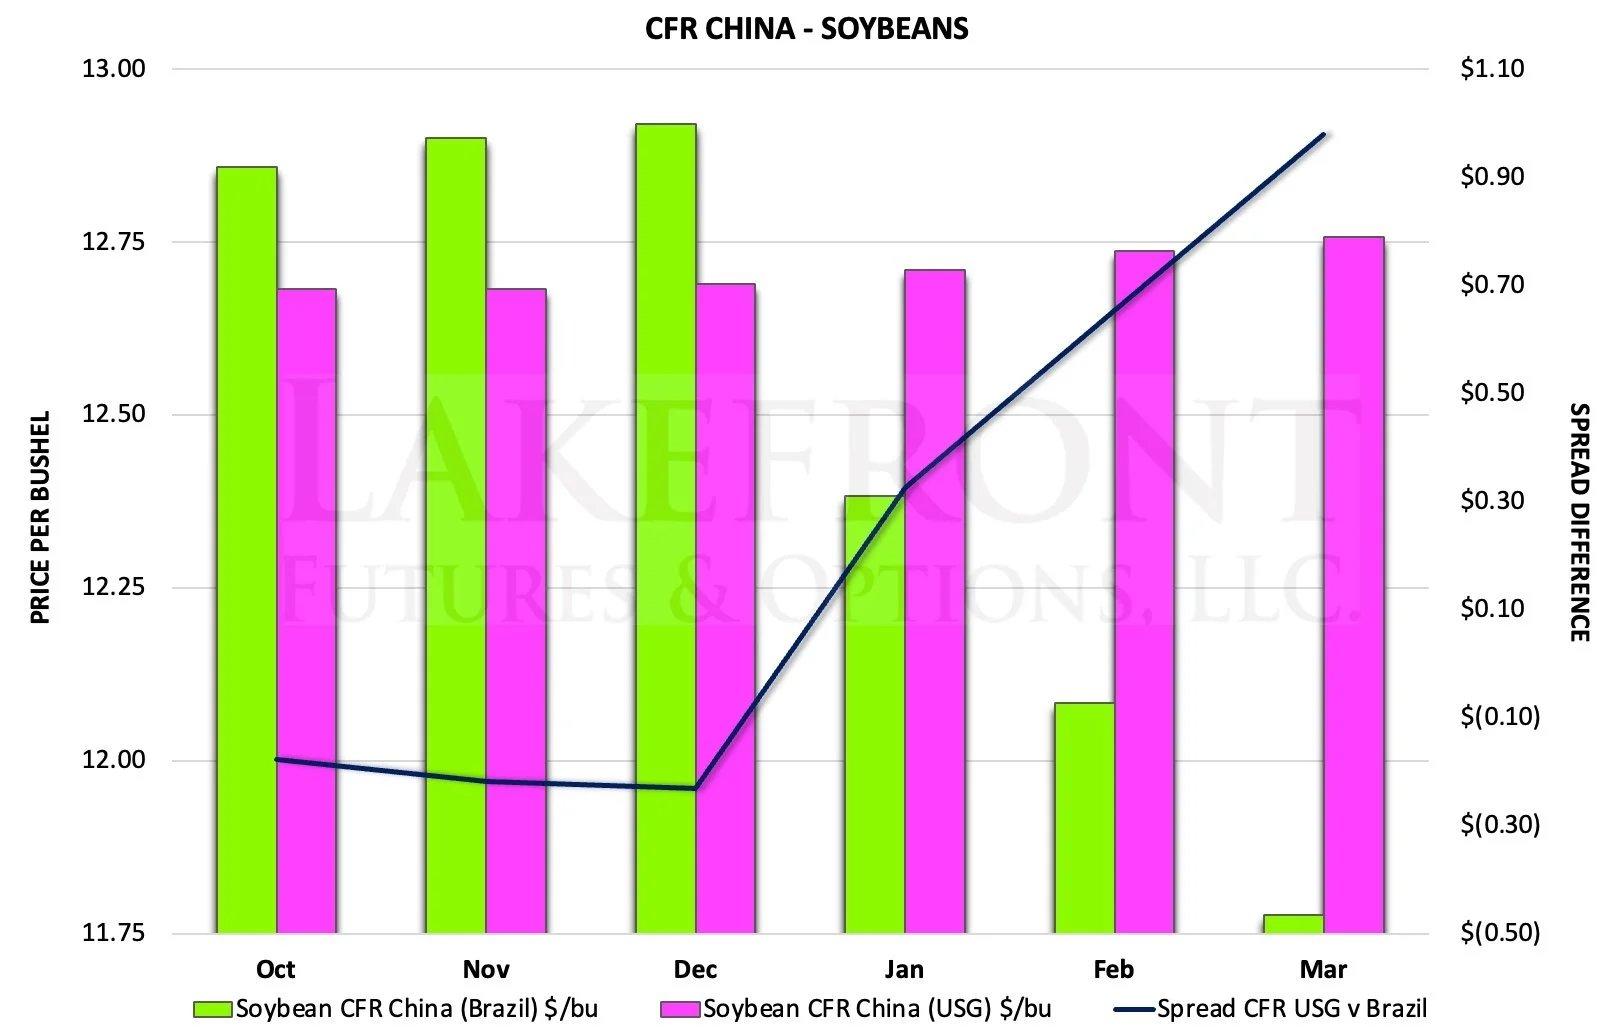
(Chart Credit: Lake Front Futures)
Here is a chart from GrainStats showcasing bean export sales.
As you can see, we had that nice pop but have since stepped back.
Watch daily flash sales closely. If we continue to get more, it will be a good sign of things to come.
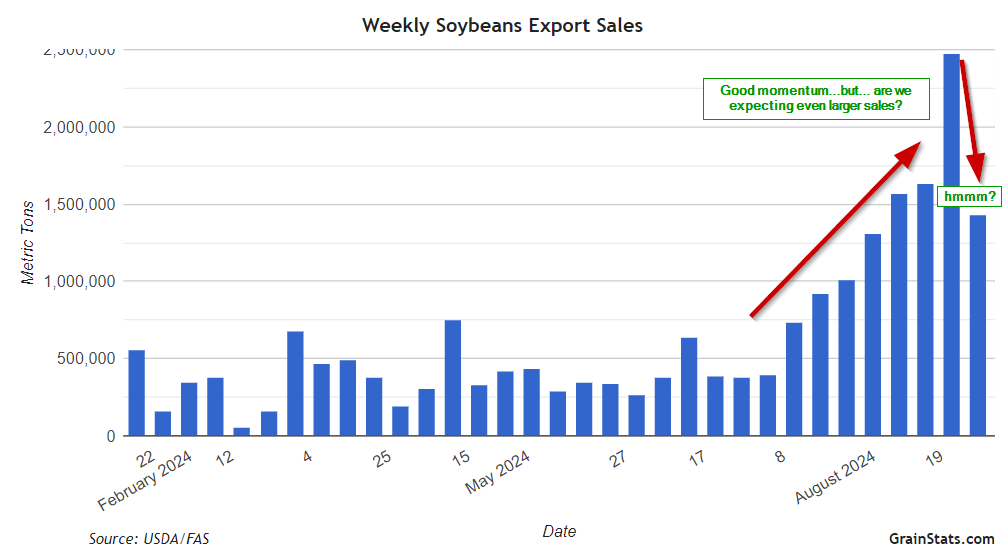
(Chart Credit: GrainStats)
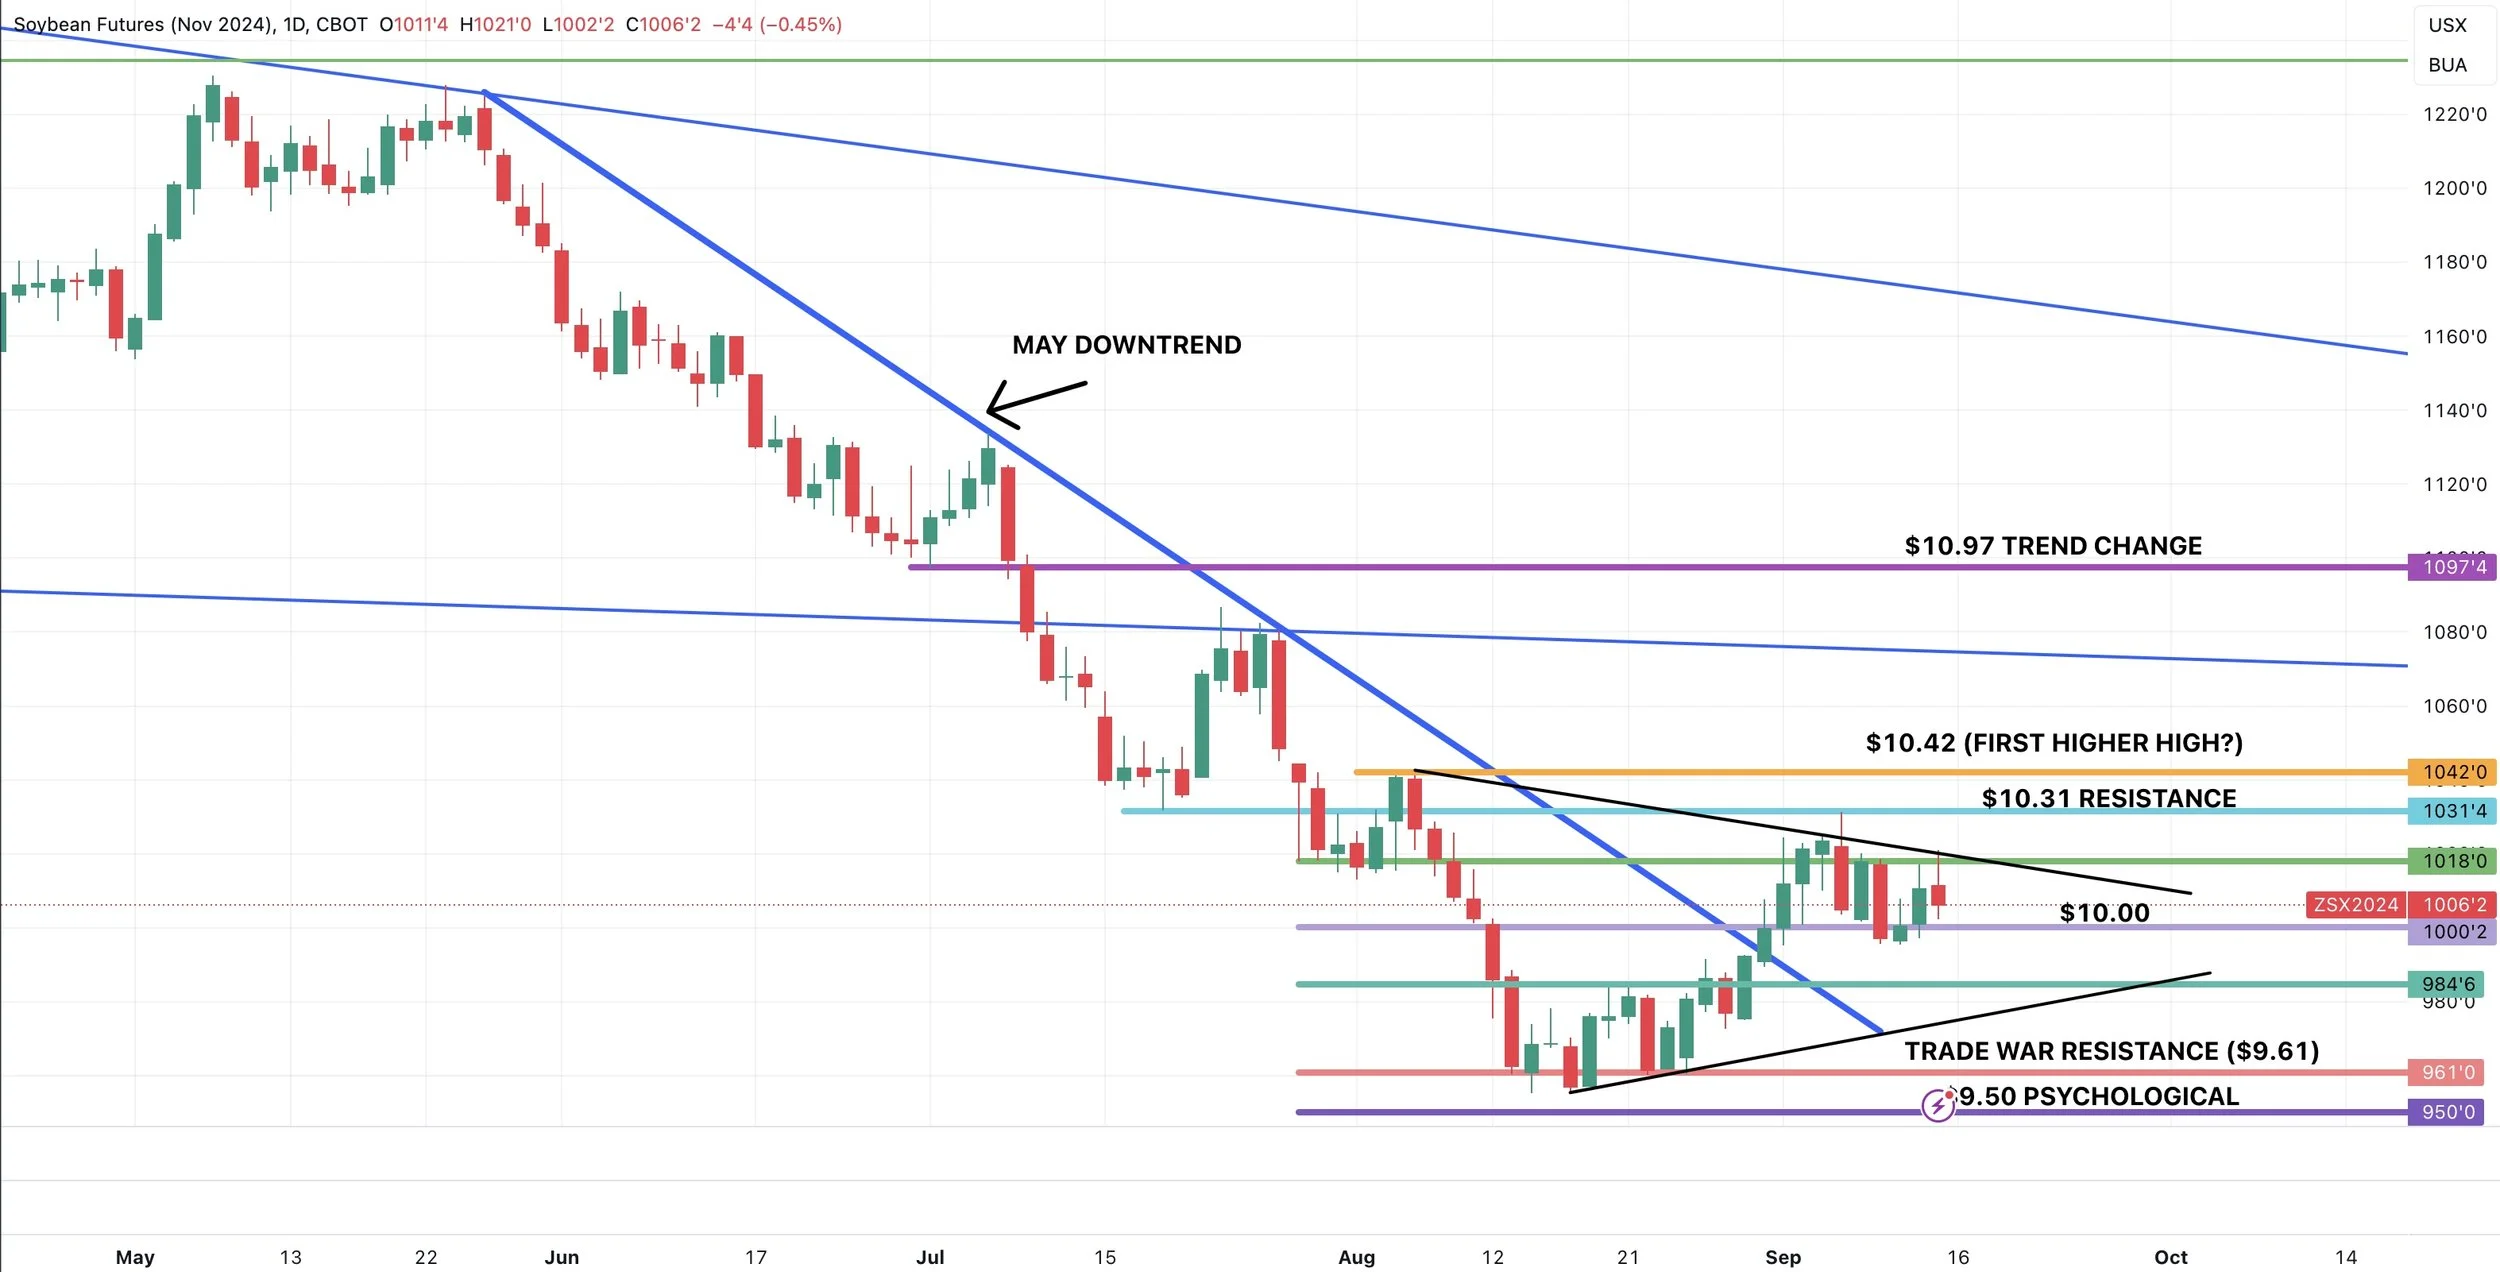
Looking at the chart, we are really just range bound here for now. (Between the black lines).
$10.00 remains the key support.
$10.42 still remains the level I want to take out to confirm a bottom, as that would mark our first higher high.
Daily Nov Beans
Wheat
SELL SIGNAL:
We like taking some risk off the table here on today's rally. Via either a few sales or adding downside protection on unpriced bushels until you make the sale. We broke key resistance on the charts, but I am skeptical as to how much of today's action was war headline driven vs technical & real fundamentals. Scroll to the bottom to see how I’d spread my risk.
SELLING CALLS STRATEGY:
Every marketing plan should be different but here are some of the things we like to do for those of you growing wheat.
These should be done for 20% of your crop.
To understand where we feel your operation should be at and to align correct sale recommendation to you please call 605-295-3100.
For growers growing Soft Wheat, HRW, or DNS.
Selling Dec 6.30 cbot wheat calls 16 cents - 10%
Selling March 7.00 cbot wheat calls for 16 cents - 10%
Selling July 2025 CBOT futures with a 15 -20 cent trailing stop 20%
We will be waiting for basis, and feel comfortable that MPLS and KC will gain against CBOT wheat. We are using July to maximize carry.
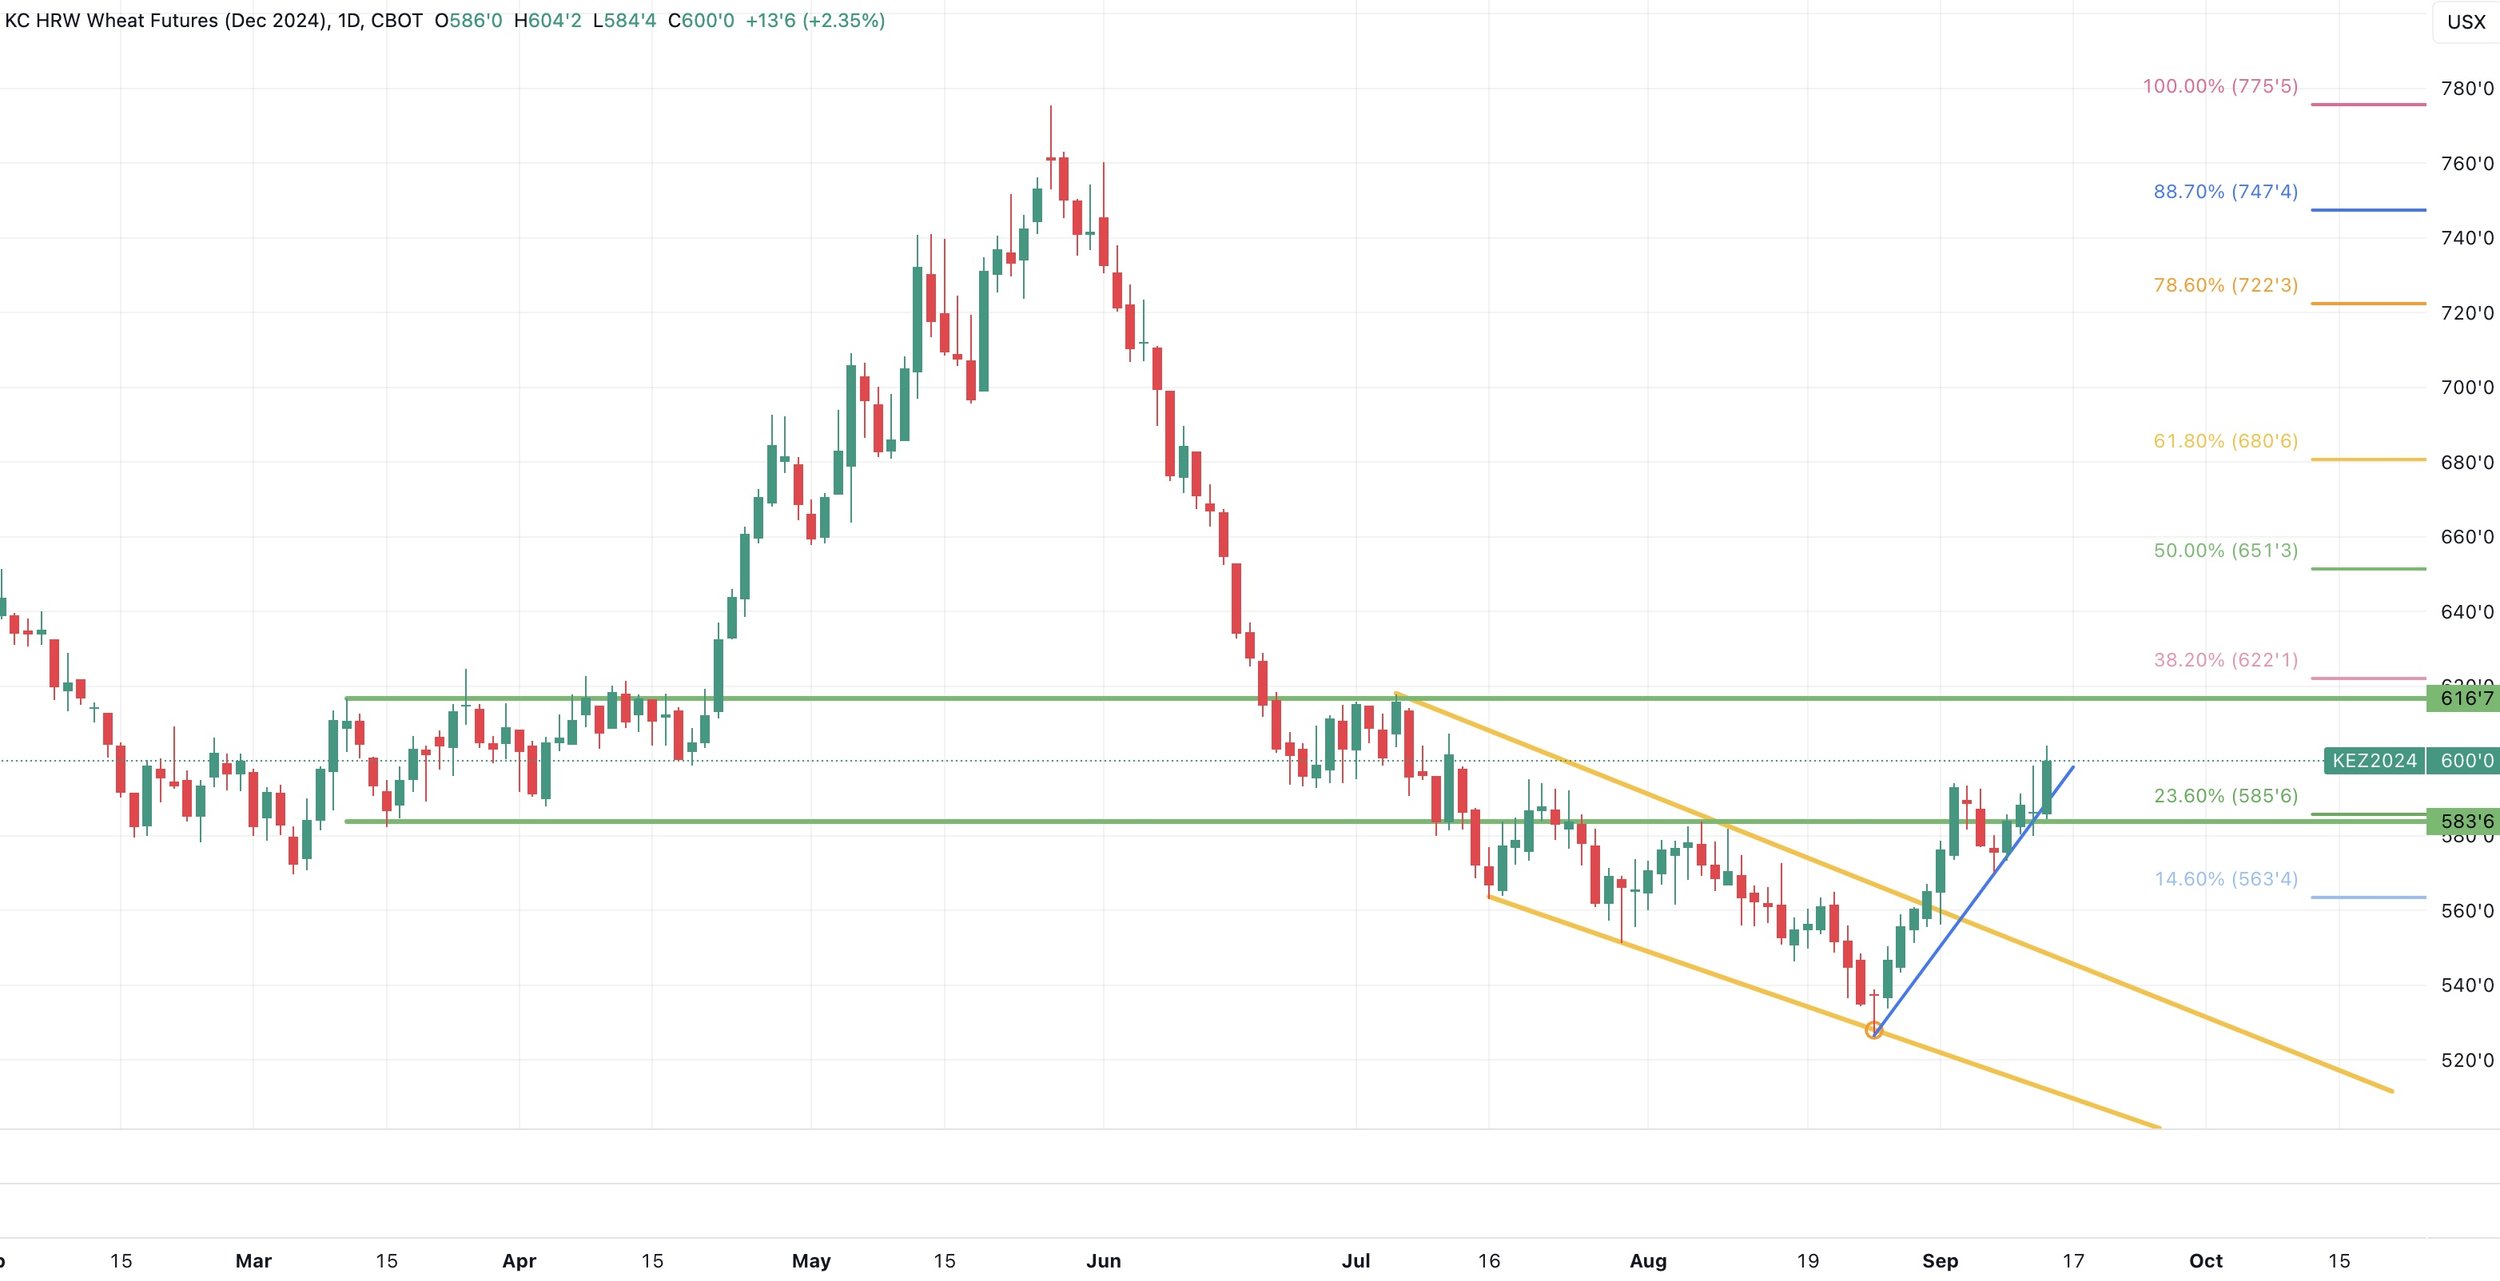
Wheat gets a nice rally today and finally breaks that key $5.80 level I've been talking about for 2 months now.
Wheat was led higher by two things.
War news & technicals.
A Ukraine vessel of wheat was struck by a missle overnight. Russia says that Putin sent a clear message to the west that it will face consequences if it allows Ukraine to hit Russian territory with a missile.
The reason we posted a sell signal is simply given the fact that I am unsure as to how much of this rally was driven by the war news or by the technicals.
Because if it was more war driven, we all know that these war rallies are often quickly sold.
Even so, I do think wheat still has more room to run.
Arlan Suderman from StoneX had a great summary as to why wheat could go higher from here:
"Wheat is the interesting market to watch, with implications for corn. Europe's crop likely has more downgrades, along with Russia. Still dry in Russia winter wheat areas. Russia may need to restrict exports in last half of marketing year. Global exporter stocks otherwise tight."
To go along with that, these low prices are going to lead to less acres. As the charts are finally starting to break out.
So I like taking some risk off here, and spreading out your risk if we do continue to go higher.
My next two targets are $6.12 and $6.40.
So an example would be to scale into sales or puts on unpriced grain at each target on the way up. Some here, some at $6.12 etc.
My personal opinion is that we will get $6.12, but there is nothing wrong with rewarding a +70 cent rally in 2 weeks.
Looking at the chart, we broke a brutal 65 day range. Breaking a range of that significance can often lead to more upside.
Daily Dec Chicago

Daily Dec KC
Want to Talk?
Our phones are open 24/7 for you guys if you ever need anything or want to discuss your operation.
Hedge Account
Interested in a hedge account? Use the link below to set up an account or shoot Jeremey a call at (605)295-3100.
Check Out Past Updates
9/12/24
USDA RAISES YIELD BUT REPORT WASN’T ALL THAT BEARISH
9/11/24
USDA TOMORROW. MAKE OR BREAK SPOT ON CHARTS
9/10/24
USDA THURSDAY
9/9/24
LOWS ARE IN UNLESS SOMETHING FUNDAMENTALLY CHANGES?
9/6/24
GRAINS WEAK. OUTSIDE DOWN DAY ON CHARTS
9/5/24
GRAINS GET HEALTHY CORRECTION. GETTING READY TO PROTECT DOWNSIDE
9/4/24
GRAINS CONTINUE RUN. WAYS TO PLAY THE MARKET. WHAT’S YOUR SITUATION?
9/3/24
GRAINS CONTINUE BREAK OUT FROM LOWS
8/30/24
ANOTHER STRONG DAY. GETTING MORE CONFIDENT BUT NO CONFIRMATION
8/29/24
CHANCE FOR A BOTTOM, BUT STILL CAUTIOUS. DIFFERENT MARKETING APPROACHES
8/28/24
WHEAT FOLLOW THROUGH WHILE CORN & BEANS GIVE BACK
8/27/24
DECENT PRICE ACTION. BASIS CONTRACTS. ROLLING VS FUTURES. NOT FALLING FOR BIG AG TRAP
8/26/24
FIRST NOTICE DAY PRESSURE & CROP TOUR RECAP
8/23/24
CROP TOUR SHOWS MASSIVE BEAN YIELD
8/22/24
UGLY DAY FOR WHEAT & BEANS, STILL RISK, CROP TOURS, CAPTURING CARRY
8/21/24
CROP TOUR DAY 3. NOT HUGE MOVEMENT
8/20/24
CROP TOUR SO FAR & COMPARISON TO USDA
8/19/24
CROP TOUR BOUNCE
8/16/24
RISK REMAINS LOWER. MANAGE YOUR RISK
8/15/24
DEMAND, BIG US CROPS & BRAZIL DROUGHT
8/14/24
DEAD CAT BOUNCE
8/13/24