ELECTION & USDA NEXT WEEK
AUDIO COMMENTARY
Beans still holding August lows
Deliveries lighter than exp for beans
South America completely caught up
Zero threat in SA currently. Real risk
Seasonals in our favor
Election & USDA next week
Usually Nov report not major mover
Moisture in plains pressuring wheat
Plenty of global wheat issues
Watching the spreads
Risk with corn first notice day
Demand still feels stout
Be comfortable with risks
What to do marketing wise?
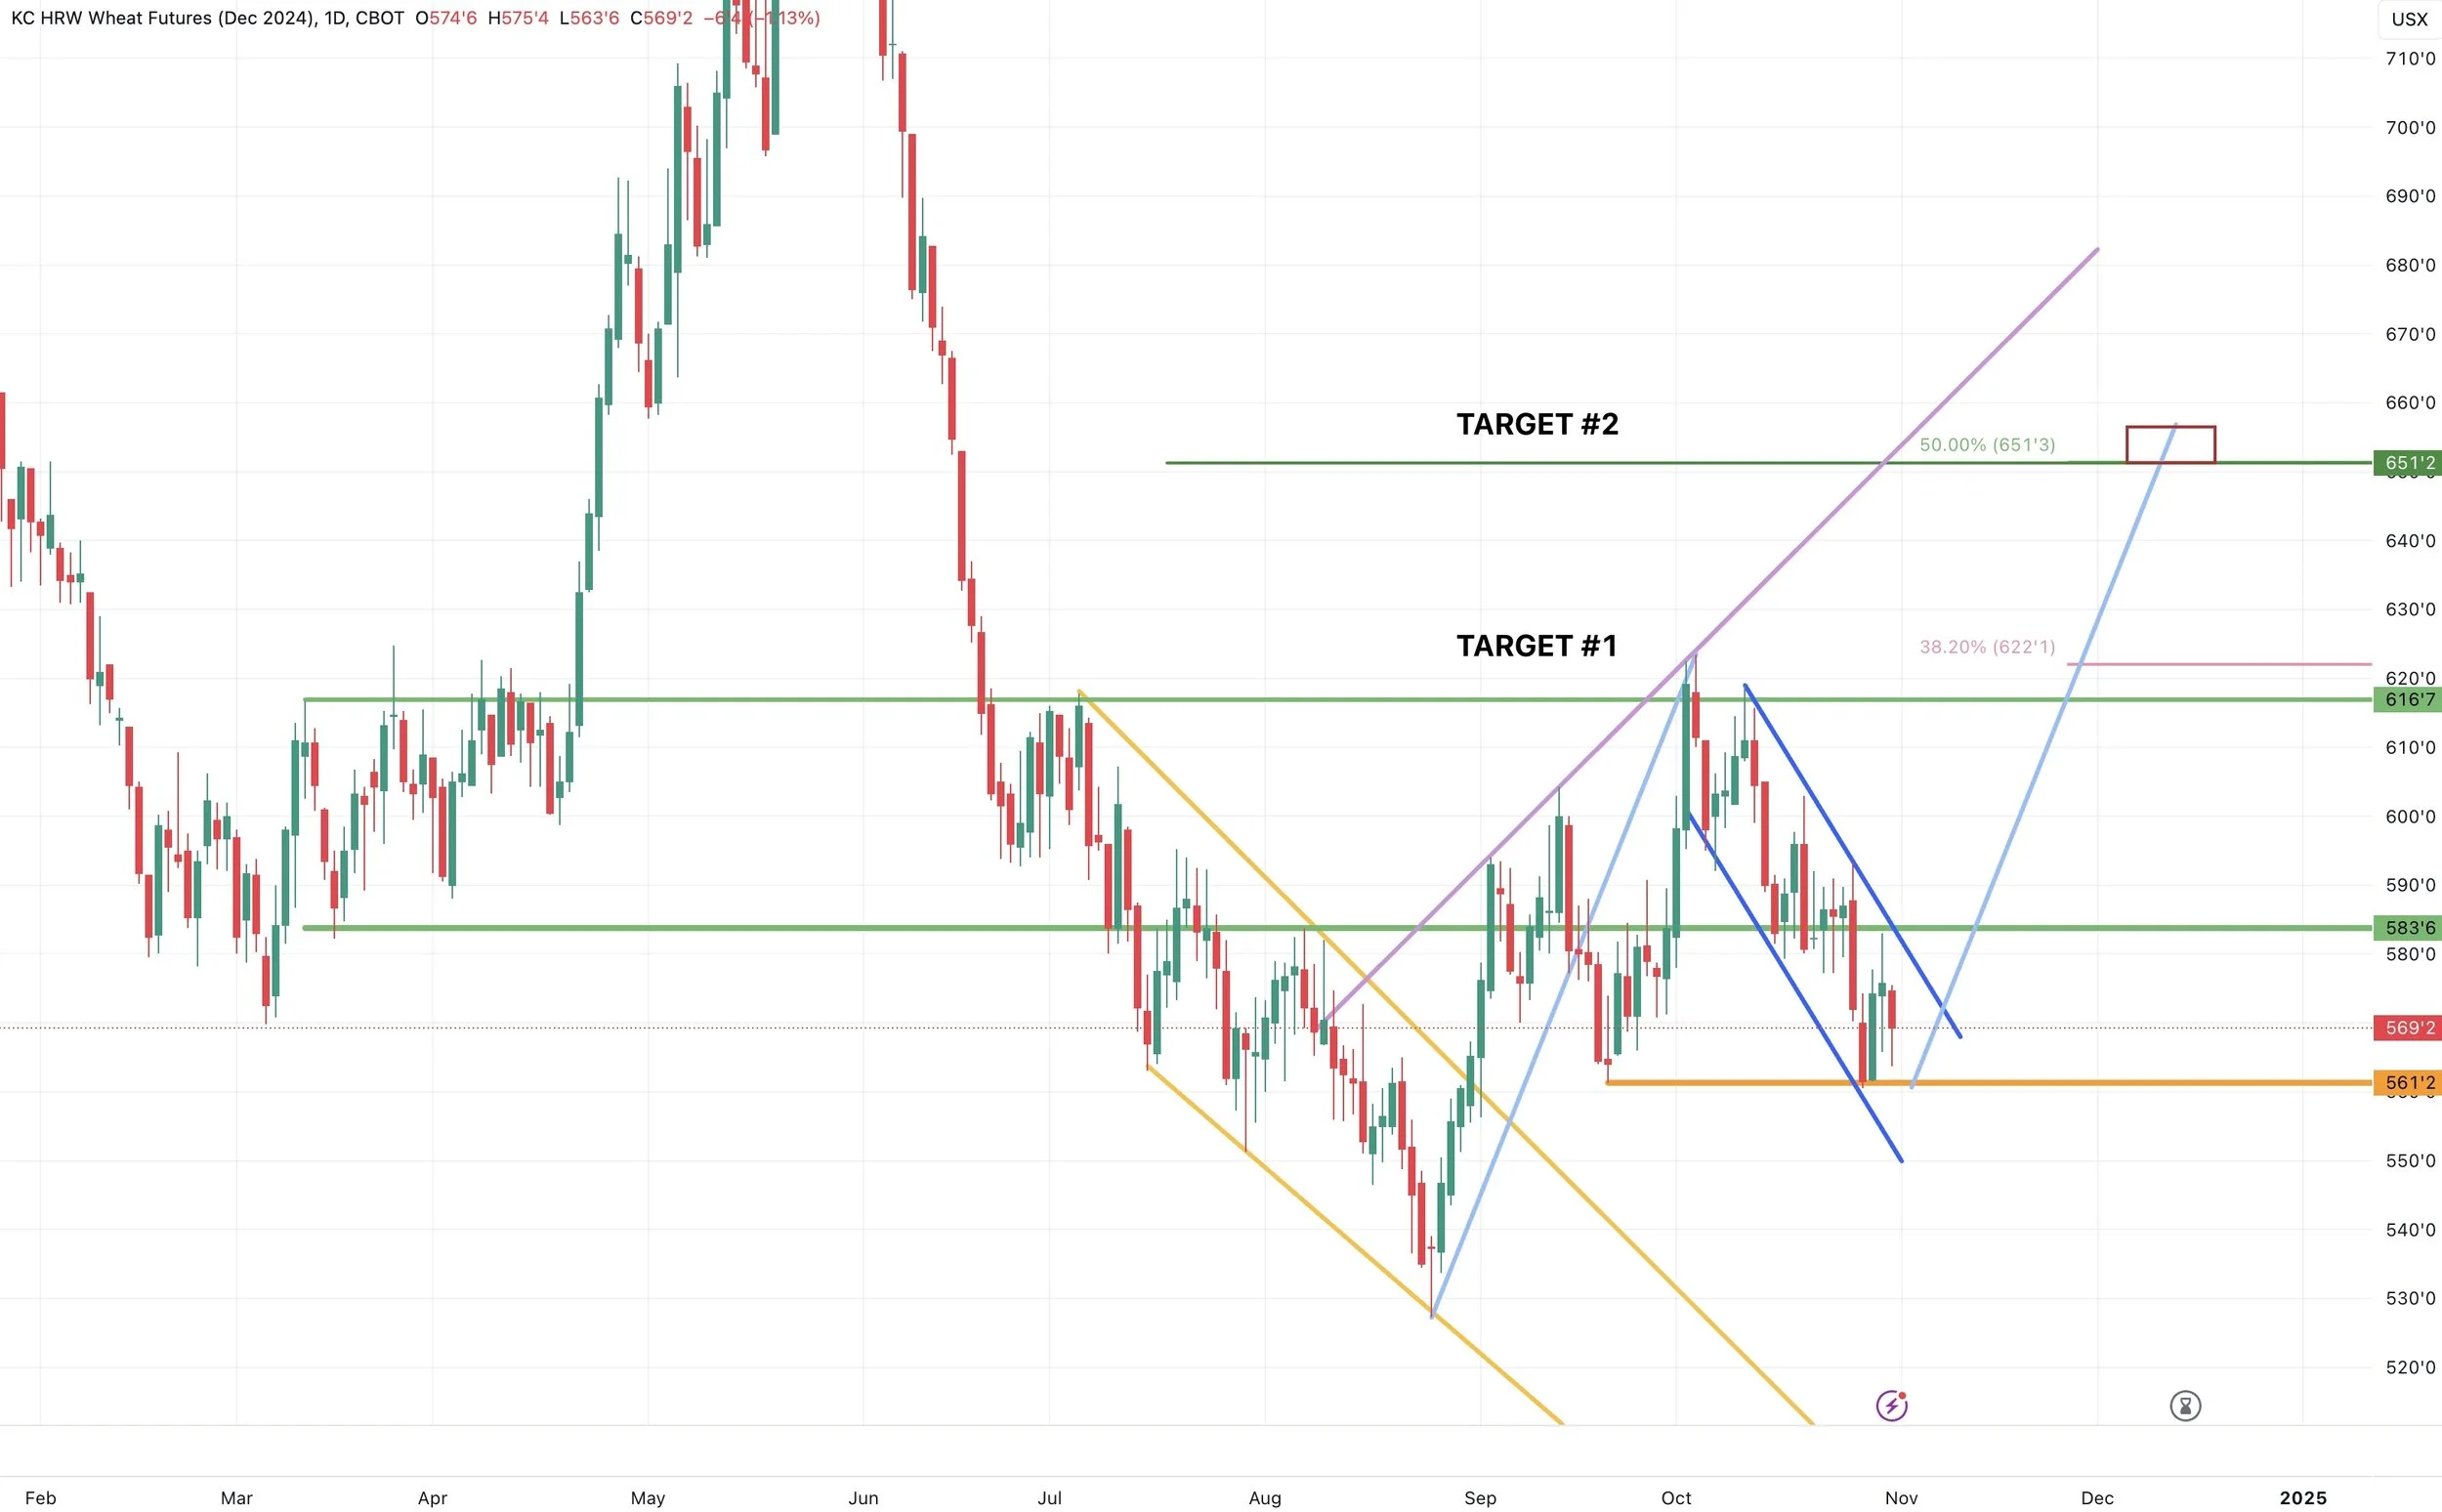
Bull flag in wheat? Chart below*
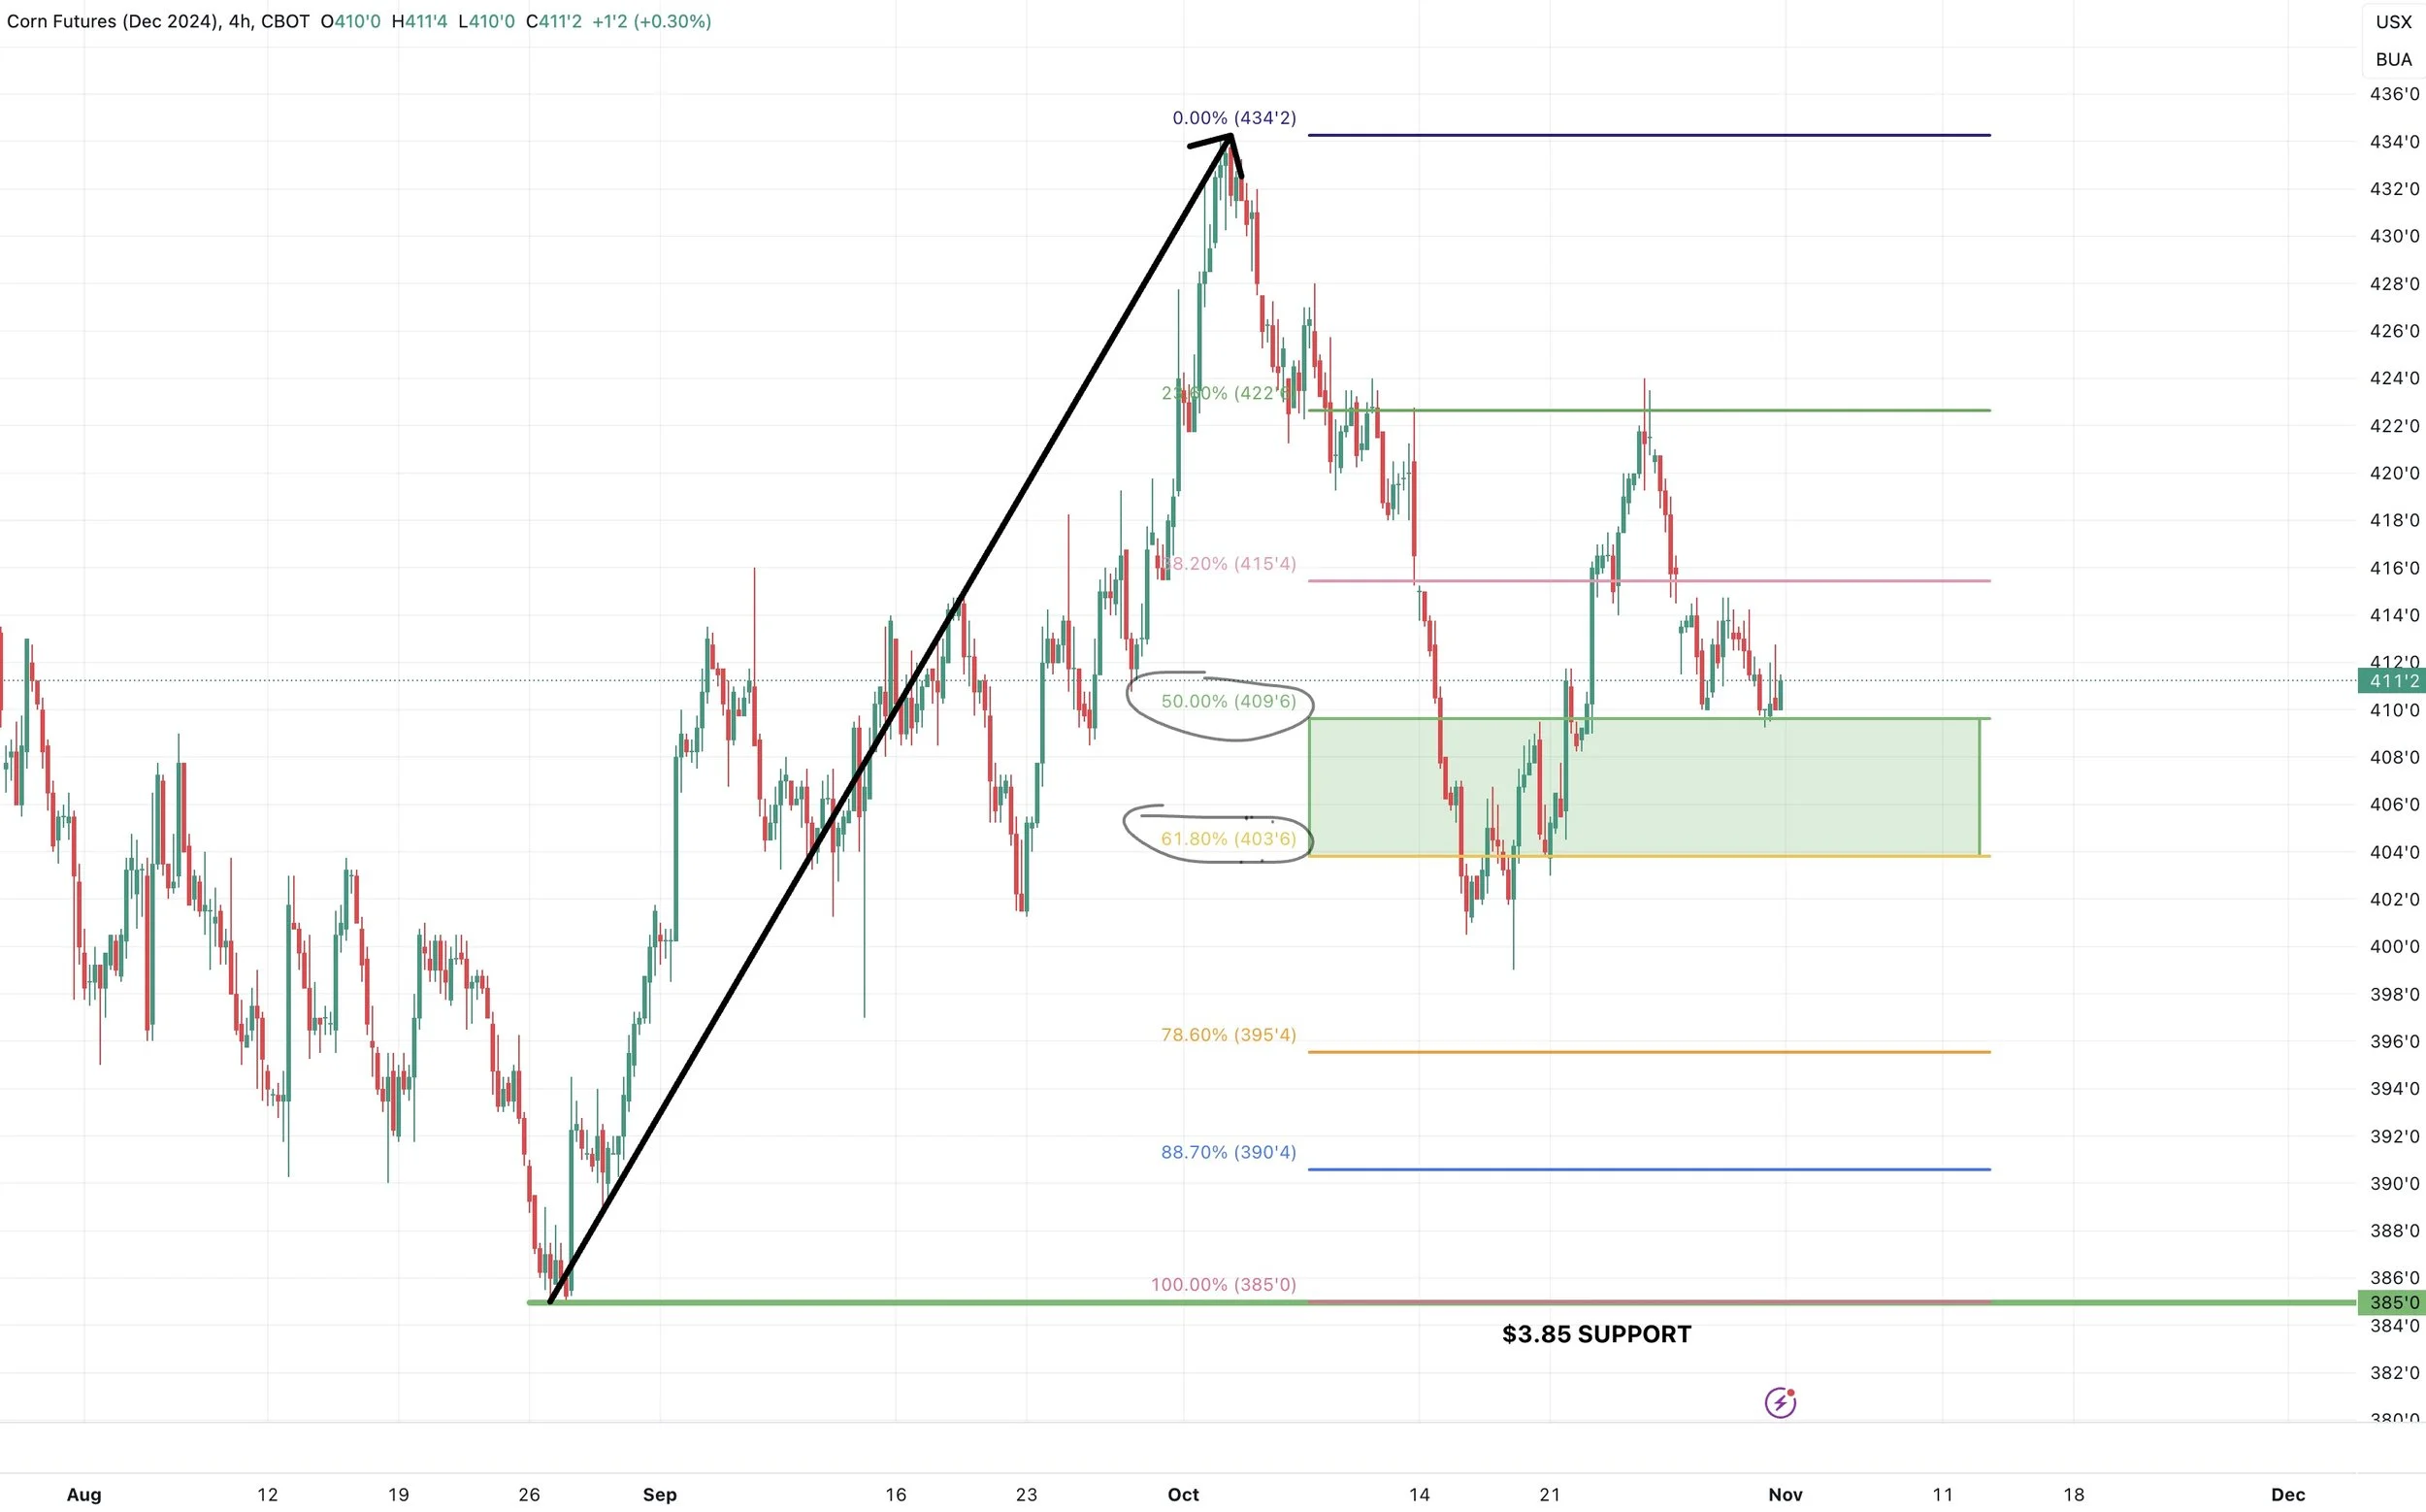
Corn find a bottom? Chart below*
ALL CHART BREAKDOWNS BELOW*
Listen to today’s audio below
You only got HALF of today’s audio.. subscribe for full access to our updates, signals & 1 on 1 market plans.
TRY 30 DAYS FREE
Want to talk? (605)295-3100
CHART BREAKDOWNS
Corn 🌽
The two levels to watch are $4.00 and $4.26
A break above or below decides the direction
But I want to show you why I think we “could” have found a bottom.
Scroll to check out the 4 hour chart and see why.
Here is a 4 hour chart.
Those colorful horizontal lines are retracement levels. They represent how much (%) we have given back of the entire rally from $3.85 to $4.34
In an uptrend, a correction usually bounces between 50% and 61.8% (green box).
We did just that on the recent mini rally.
Now take a look at the next chart.
Again, usually in a simple correction you give back 50% to 61.8% of a rally.
This chart shows the retracements of that recent mini rally.
Again, we are finding support in that green box.
So I think there is a decent chance corn bottoms somewhere in here.
HOWEVER, $4.00 is still the key level to hold.
If we fail to hold $4.00.. there is nothing stopping us from those $3.85 lows.
Beans 🌱
We have a potential double here at $9.76
That level needs to hold.
Looking to the upside, I can’t even consider saying we have put in a bottom until we clear $10.14
Here is a 4 hour chart just to give you a more detailed view.
Trapped in this $10.14 to $9.76 range. So need to break above $10.14
Chicago 🌾
Wheat has a very interesting “potential” setup here.
We found support right at that 61.8% retracement from the $5.22 to $6.17 rally.
Good spot to bounce if we are going to do so.
Take a look at the next chart to see the potential bull flag
Here is a 4 hour chart.
We have a “potential” bull flag.
To confirm a break out, we would need to bust above that dark blue line.
The implied move if it broke out here would be the $6.40-50 range.
I would like to see us hold $5.57
(Make sure to check out KC chart below)
KC Wheat 🌾
Very similar set up in KC.
Implied move would take us to around $6.50 “IF” we broke out.
Again this is a very “potential” move and has not been confirmed.
If we cannot hold $5.61 we could still go quiet a bit lower, as there is little support beneath.
Past Sell or Protection Signals
We recently incorporated these. Here are our past signals.
Oct 2nd: 🌾
Wheat sell signal at $6.12 target
Sep 30th: 🌽
Corn protection signal at $4.23-26
Sep 27th: 🌱
Soybean sell & protection signal at $10.65
Sep 13th: 🌾
Wheat sell signal at $5.98
May 22nd: 🌾
Wheat sell signal when wheat traded +$7.00
Want to Talk?
Our phones are open 24/7 for you guys if you ever need anything or want to discuss your operation.
Hedge Account
Interested in a hedge account? Use the link below to set up an account or shoot Jeremey a call at (605)295-3100.
Check Out Past Updates
10/30/24
SEASONALS, CORN DEMAND, BRAZIL REAL & MORE
10/29/24
WHAT’S NEXT AFTER HARVEST?
10/25/24
POOR PRICE ACTION & SPREADS WEAKEN
10/24/24
BIG BUYERS WANT CORN?
10/23/24
6TH STRAIGHT DAY OF CORN SALES
10/22/24
STRONG DEMAND & TECHNICAL BUYING FOR GRAINS
10/21/24
SPREADS, BASIS CONTRACTS, STRONG CORN, BIG SALES
10/18/24
BEANS & WHEAT HAMMERED
10/17/24
OPTIMISTIC PRICE ACTION IN GRAINS
10/16/24
BEANS CONTINUE DOWNFALL. CORN & WHEAT FIND SUPPORT
10/15/24
MORE PAIN FOR GRAINS
10/14/24
GRAINS SMACKED. BEANS BREAK $10.00
10/10/24
USDA TOMORROW
10/9/24
MARKETING STYLES, USDA RISK, & FEED NEEDS
10/8/24
BEANS FALL APART
10/7/24
FLOORS, RISKS, & POTENTIAL UPSIDE
10/4/24
HEDGE PRESSURE
10/3/24
GRAINS TAKE A STEP BACK
10/2/24
CORN & WHEAT CONTINUE RUN
10/1/24
CORN & WHEAT POST MULTI-MONTH HIGHS
9/30/24


