BEANS PULLBACK & DROUGHT CONTINUES
Overview
What a wild week and a half it’s been since my last market update. Since then we have seen corn rally +70 cents and beans $1.30 even with today’s near 40 cent loss. In my last update June 12th, I mentioned we would be going a lot higher if it stayed dry come the end of June.
Following a $2 rally from our lows on May 31st, soybeans see some heavy pressure for essentially the first time on this rally. The pressure in the beans leaked over to corn futures as well.
There wasn’t a ton of reason for the major sell off in beans today. Bean oil got hit hard, but that’s the wrong reason to be selling beans. Likely a lot of profit taking given the massive rally the past two weeks.
We have some rains in the northern plains but not much if any across the I-states as it remains very dry. I think selling on a big break like today is a mistake especially with conditions and weather the way they are.
Pullbacks like the ones today are necessary in a bull market to keep the rally going. Parabolic uptrends are not healthy. So today’s correction was expected to happen sooner or later, but I think it sets us up better to continue this bull run.
Until we see some ground breaking shift in the weather pattern and get this extreme timely rain I don’t see why we wouldn’t continue to climb higher. Personally I wouldn’t want to be short over the weekend with the lack of moisture in the forecasts and knowing that we will very likely see crop conditions continue to deteriorate.
Today's Main Takeaways
Corn
Corn futures follow beans lower here today, as December closed down 8 cents, but managed to close 7 cents off it's lows.
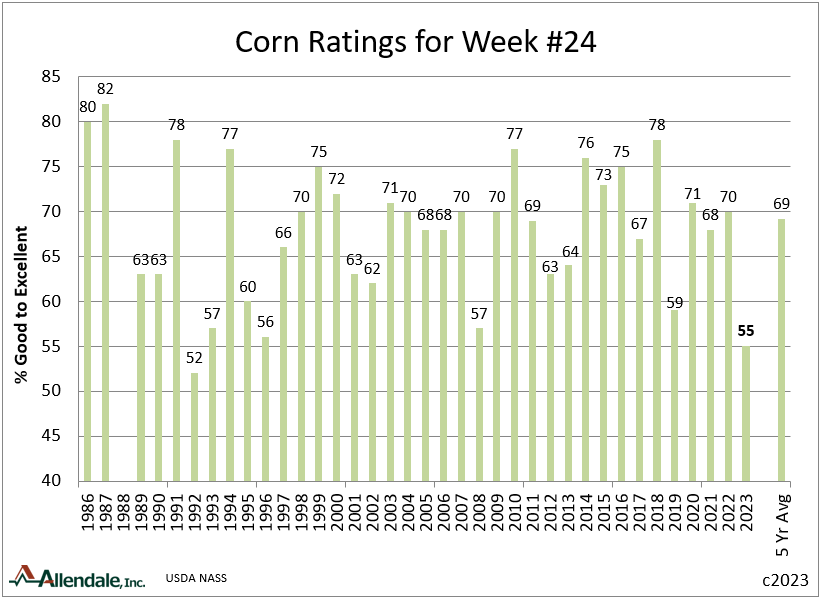
Crop conditions continue to fall. As the latest update showed corn ratings declining -6% down to 55% rated good to excellent. This was 3% worse the trade has been expecting. The lowest for this week since 1992. And the worst for any week of any year since 2012.
For comparison:
This year: 55% rated G/E
Last year: 70% rated G/E
2013: 64% rated G/E
2012: 63% rated G/E
Flat out the worst conditions in 30 years.
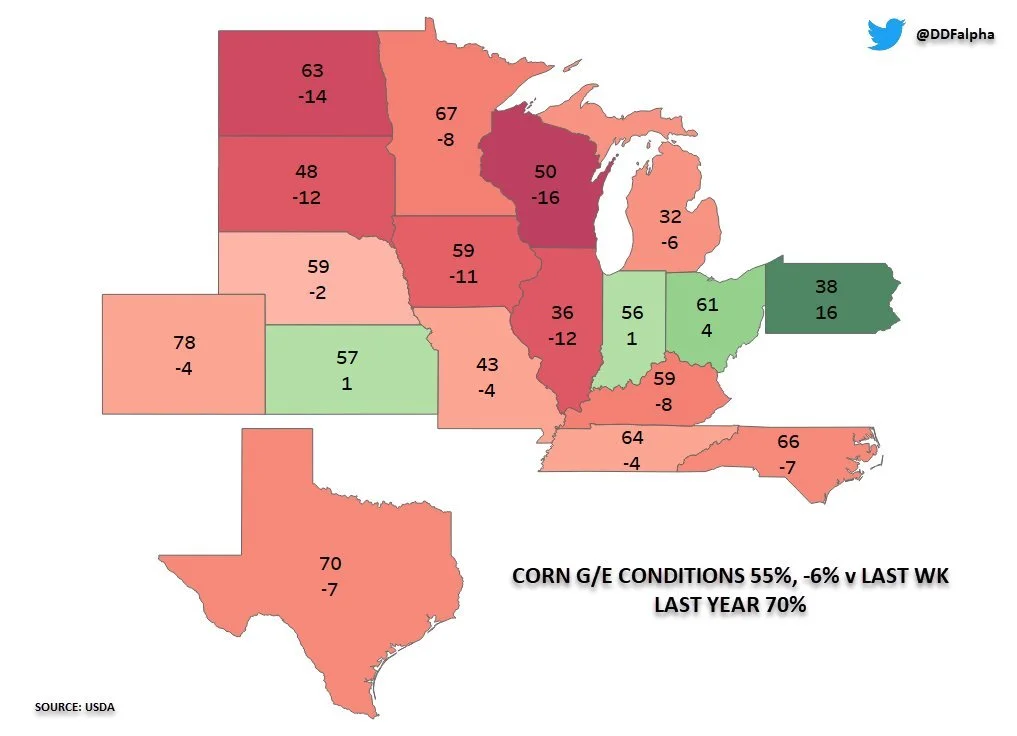
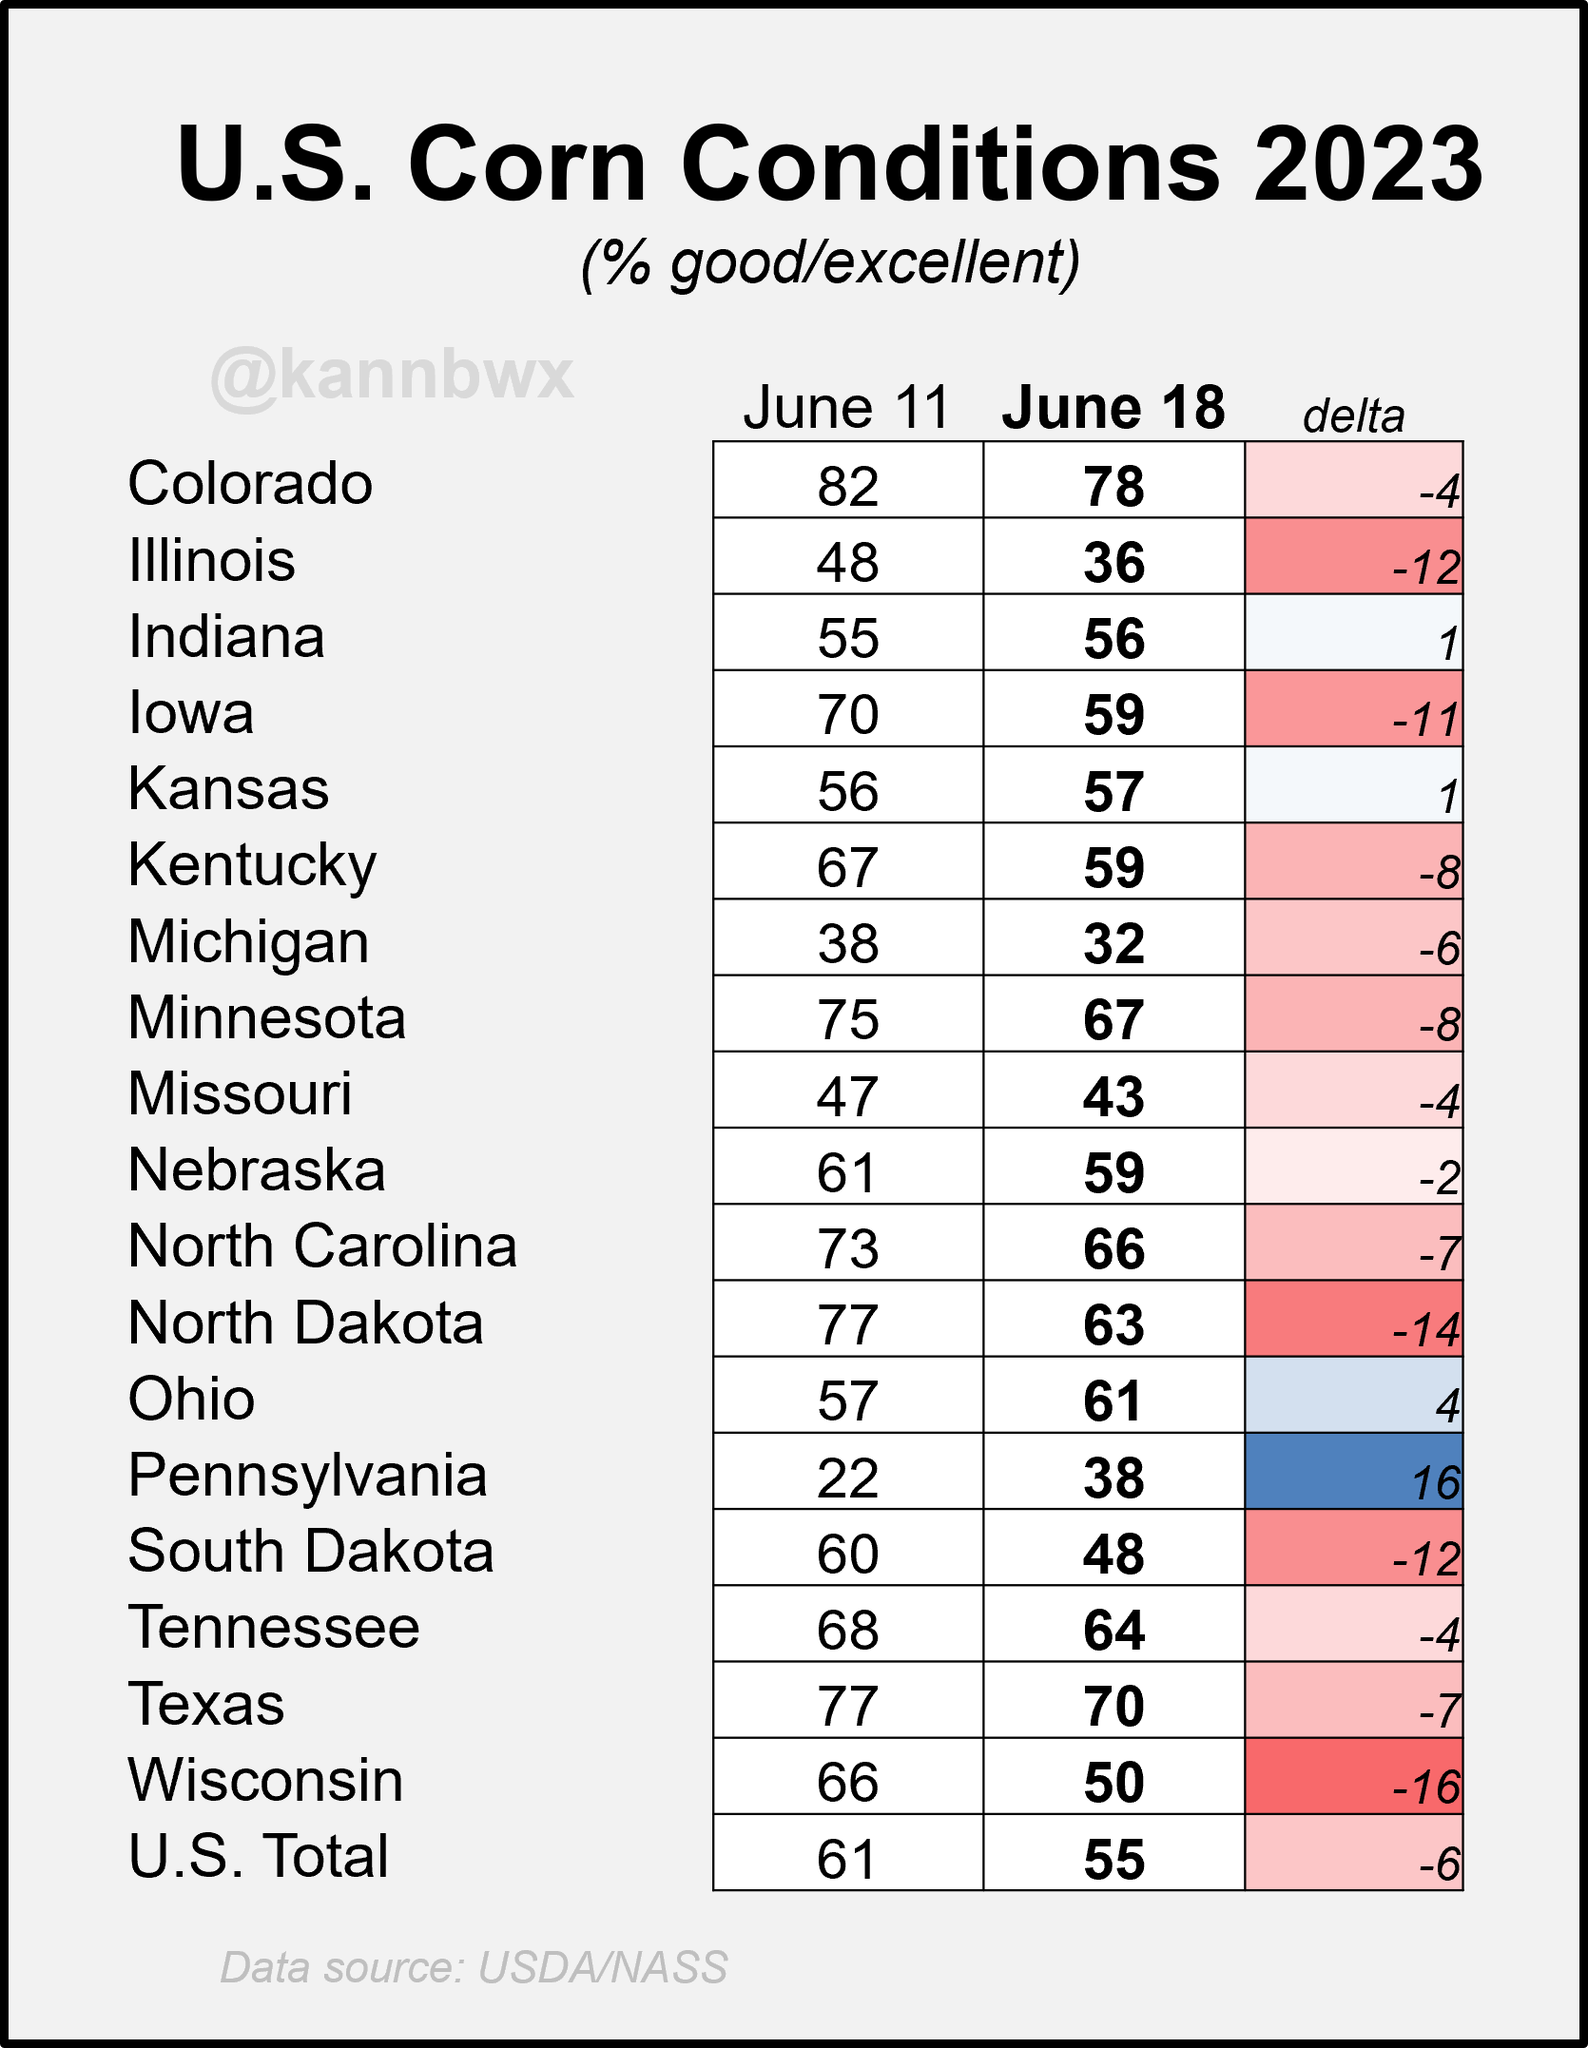
Some notable changes from last week:
Illinois: -12% (38% rated G/E)
Iowa: -11% (59% rated G/E)
Michigan: -6% (32% rated G/E)
Wisconsin: -16% (50% rated G/E)
North Dakota: -14% (63% rated G/E)
South Dakota: -12% (48% rated G/E)
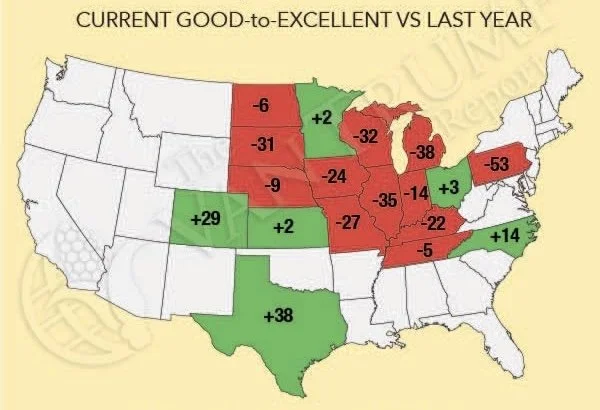
Below is a map showcasing the changes from last year.
Crop conditions are 15% worse than they were at this time last year, yet the USDA thinks yield is somehow 8 bushels per acre higher? Not a chance.
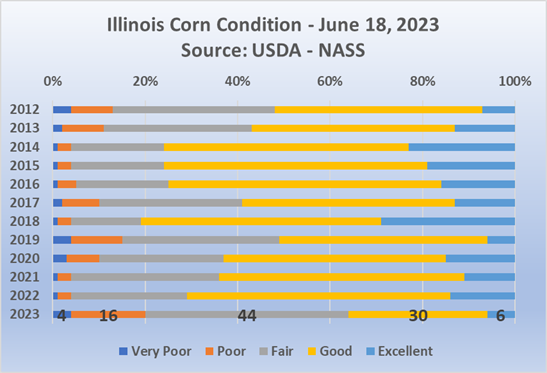
Here is a quick comparison of Illinois crop conditions for every year since 2012. They are currently worse than every year including 2012.
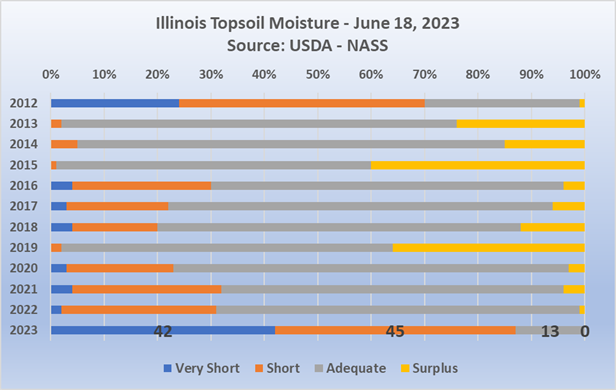
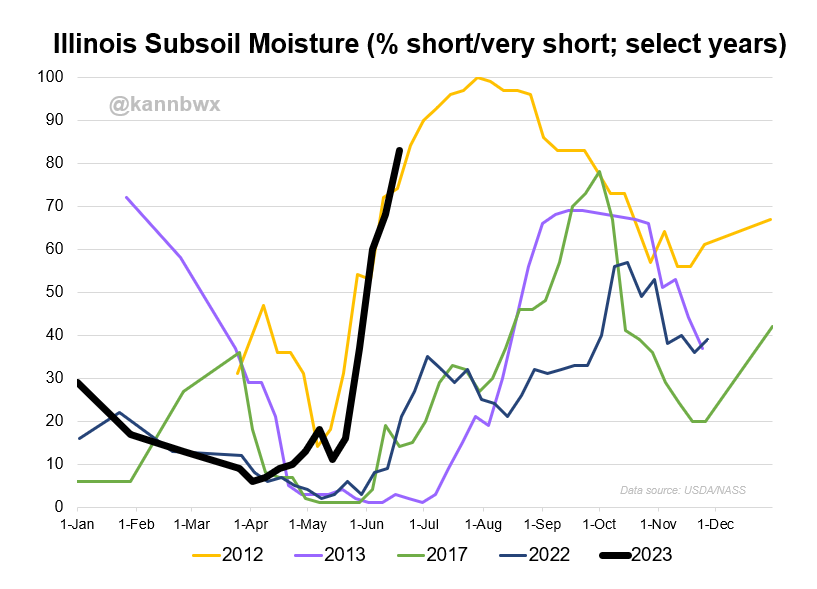
Here is the topsoil and subsoil moisture situations in Illinois compared to those same years. Again, take notice that they are the shortest they have ever been this week since they starting tracking it. Currently sitting 87% short to very short, with only 13% sitting at normal levels.
This year is lining up exactly on par with 2012.
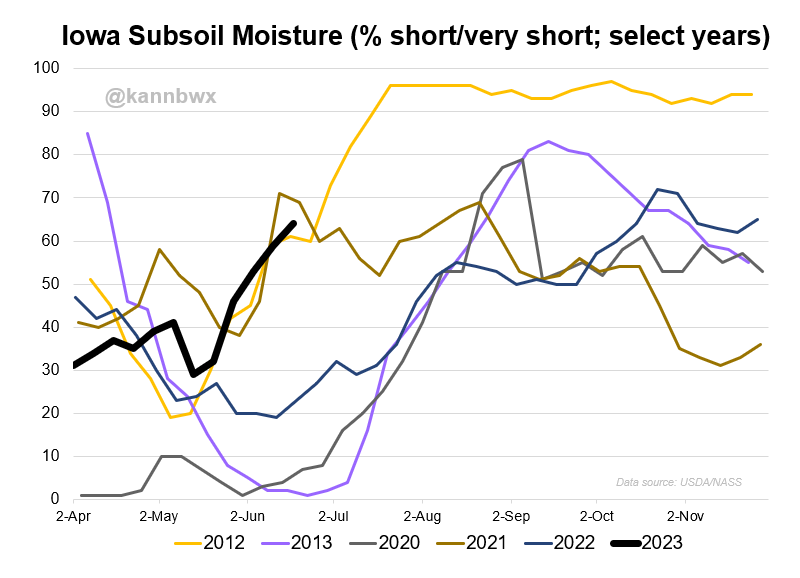
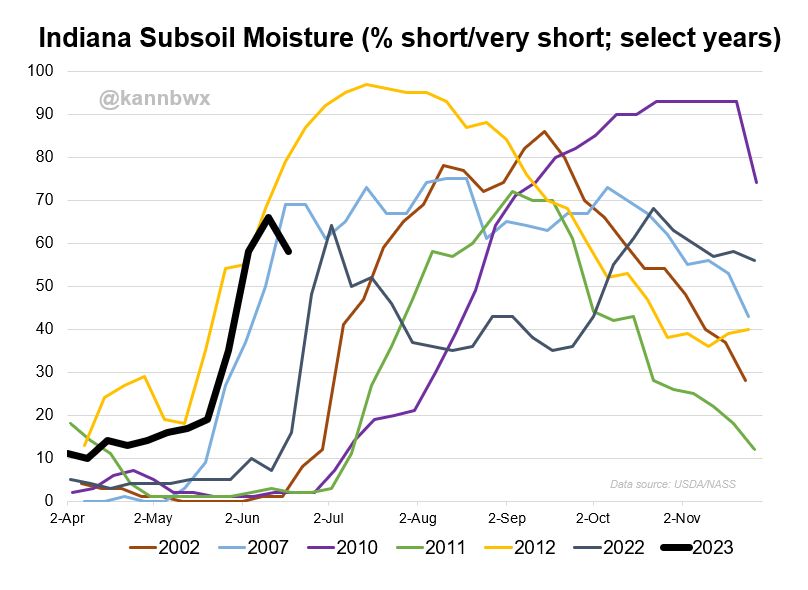
Here is the other I-states of Iowa and Indiana.
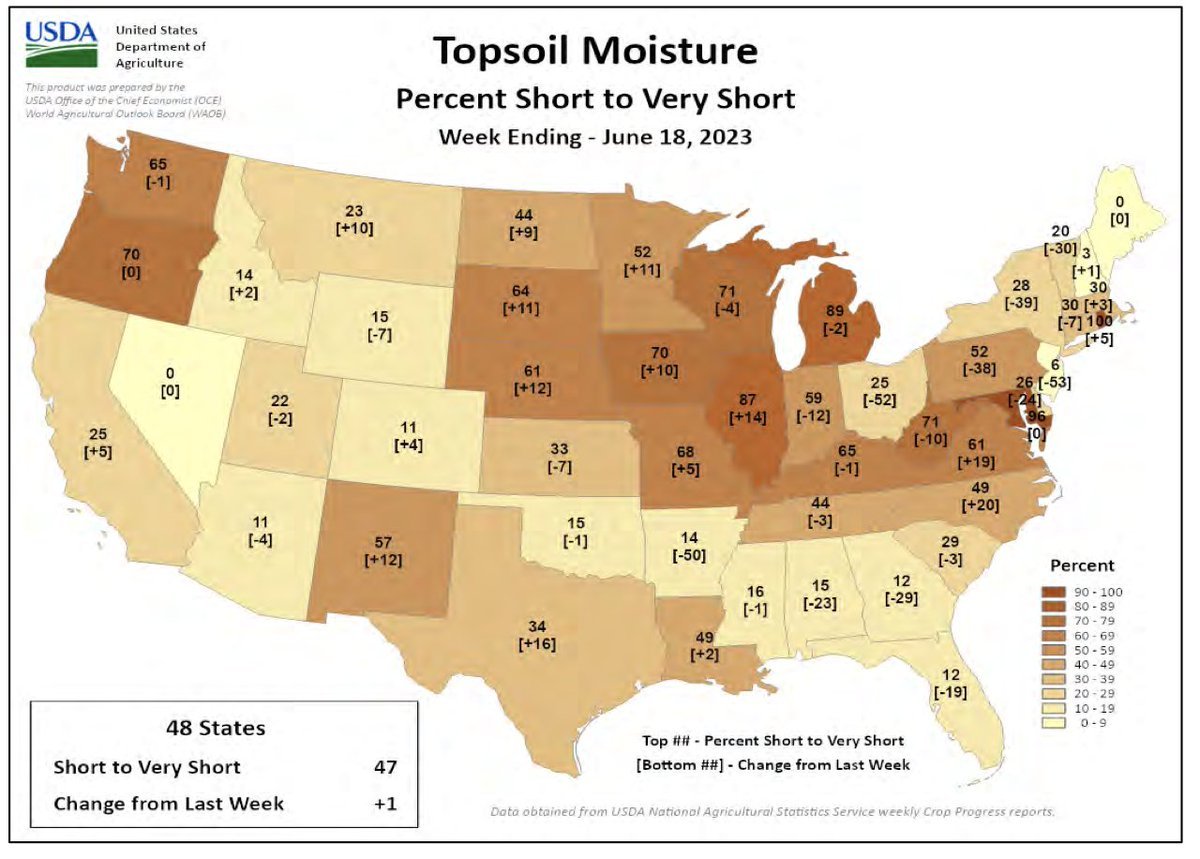
Illinois isn't the only one. Nearly all of the corn belt and I-states are very short topsoil moisture.
Illinois: 87% short
Iowa: 70% short
Minnestoa: 71% short
Wisconsin: 89% short
Indiana: 59% short
Missouri: 68% short
Both Dakotas: +60% short
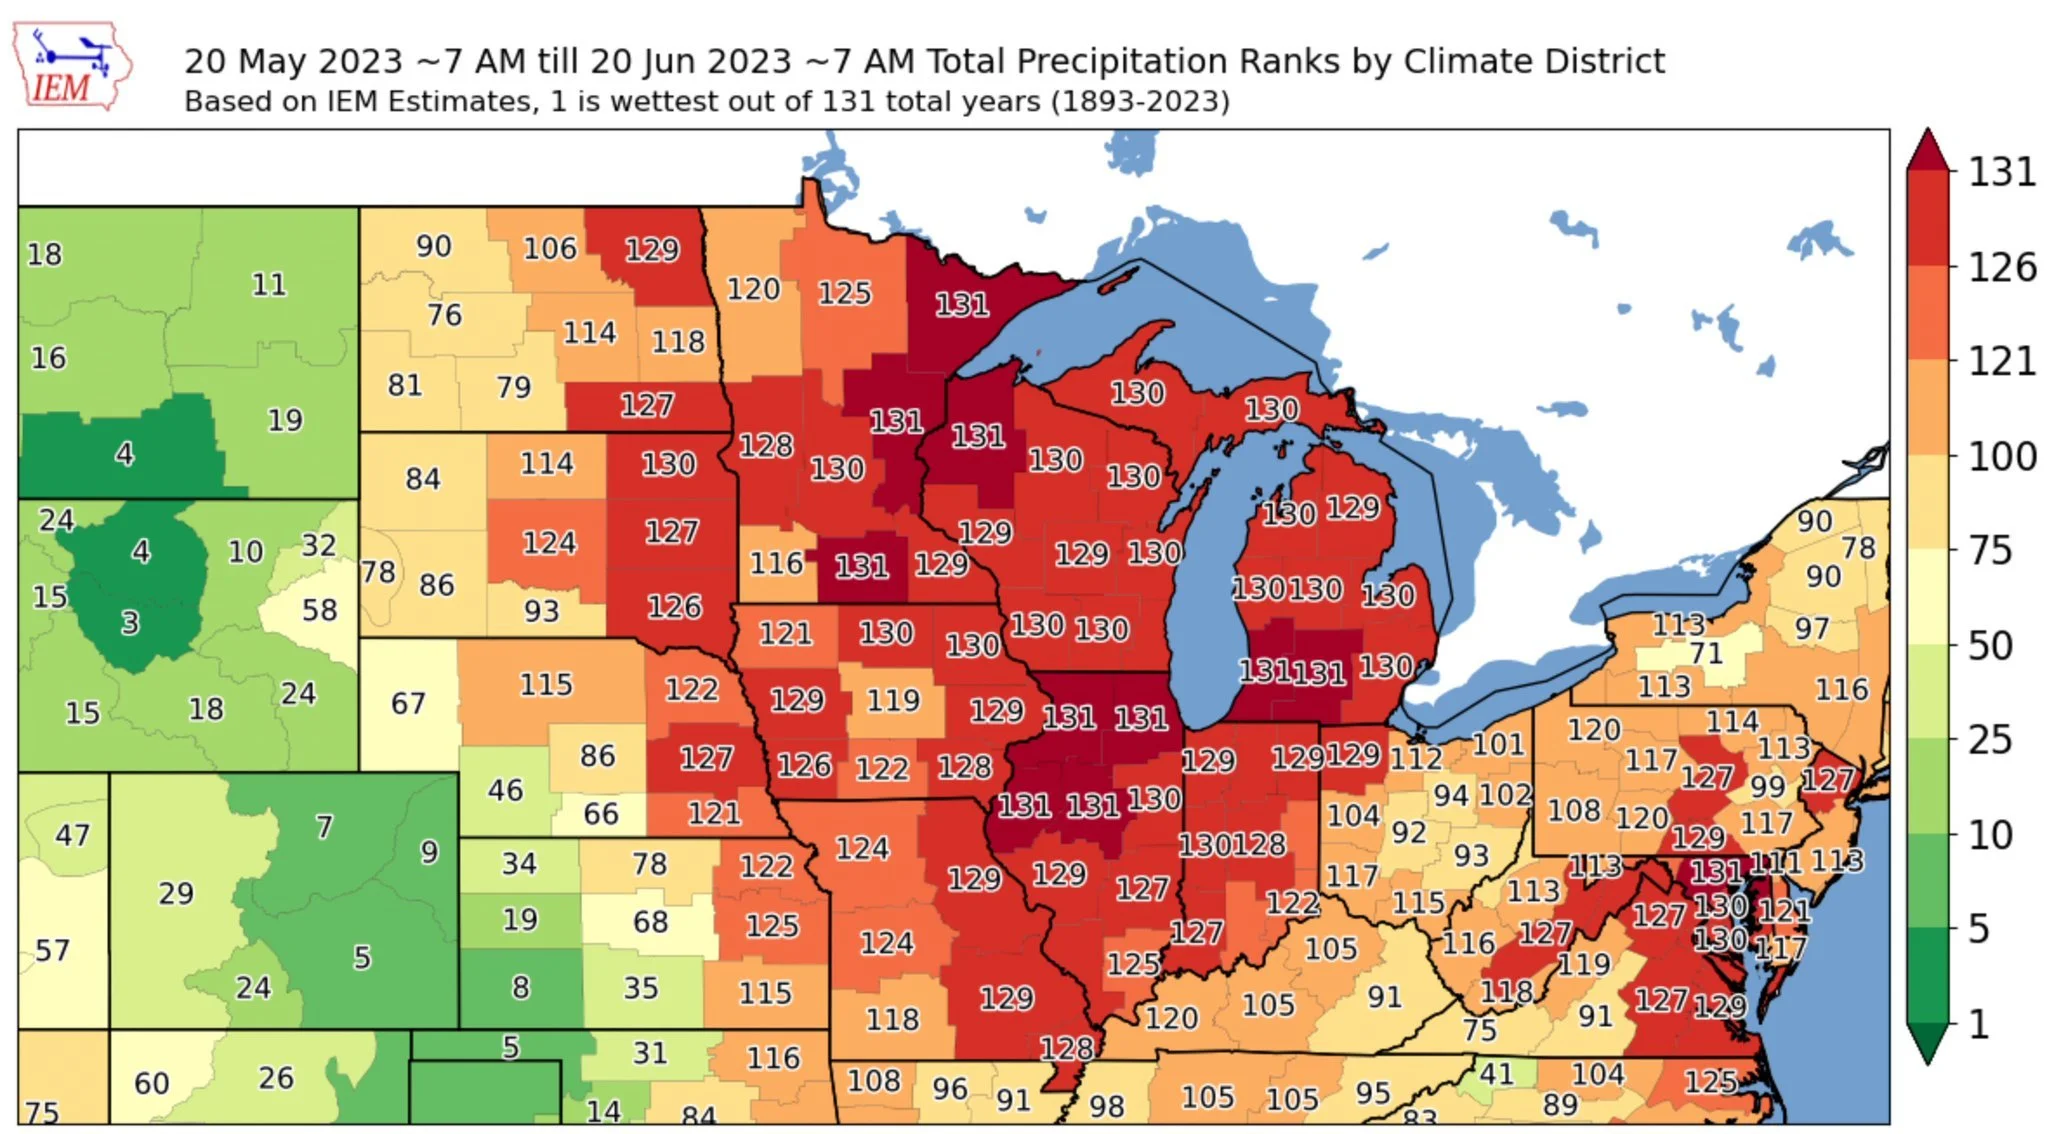
Here is a map of the midwest that ranks precipitation over the past 131 years. A large portion of the I-states are experiencing nearly if not the driest year in 131 years.
Now let’s take a look at the drought situation.
67% of corn is experiencing drought. A big 7% increase from just last week.
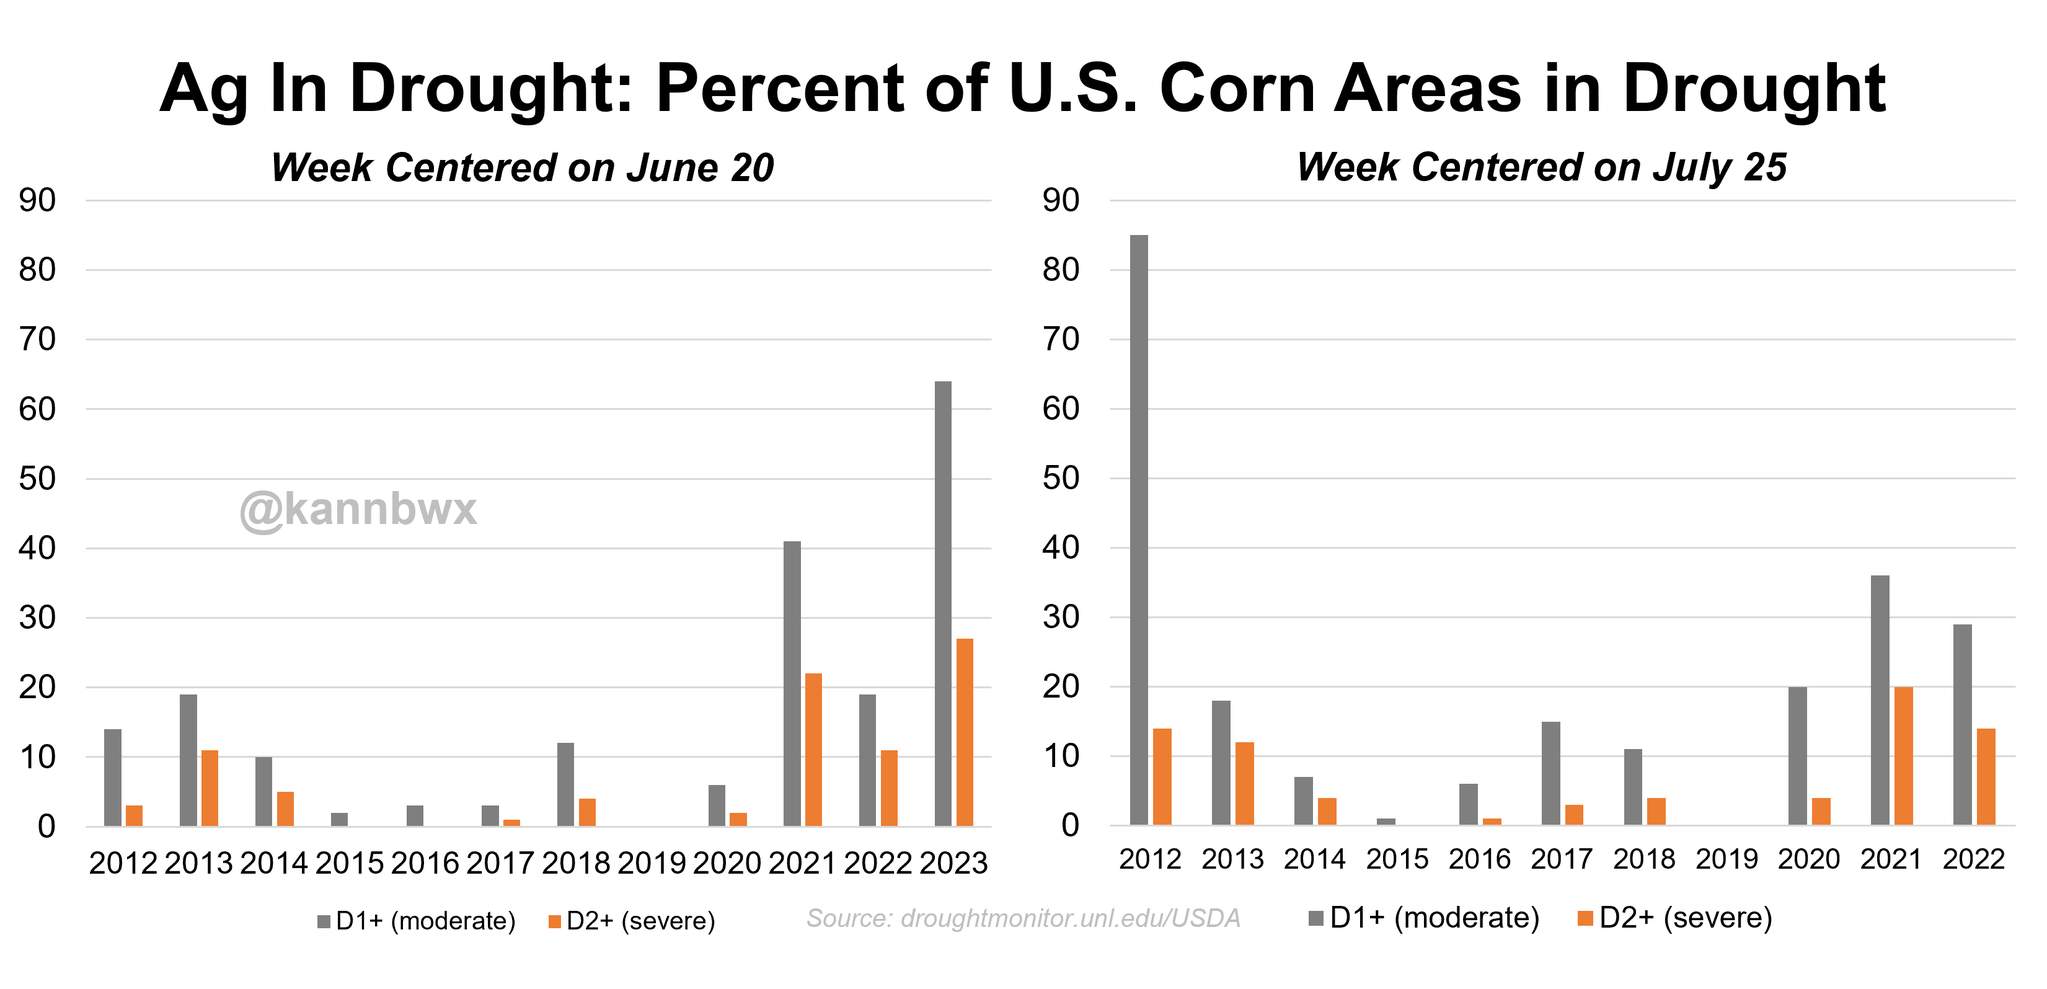
Here is a chart comparing the history of corn areas covered in drought. The one on the left is the week's for June 20th, the one on the right is for the week's of July 25th.
For this week, this is the most drought coverage we have seen on record.
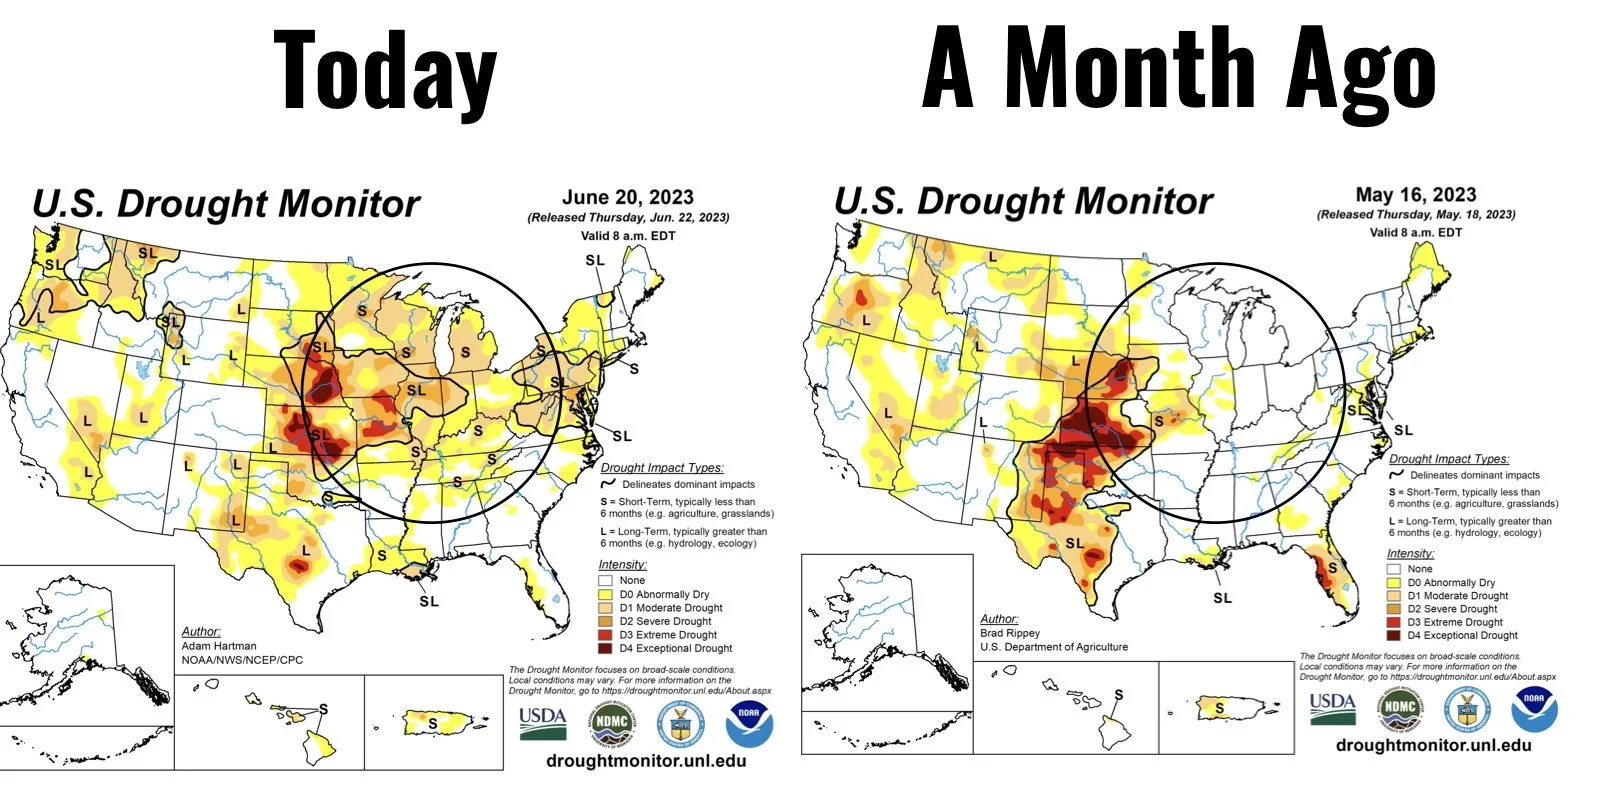
Now let’s compare drought monitors.
First, let’s compare the change from just 4 weeks ago.
The drought is obviously expanding and moving east over the corn belt.
Here is a closer look at the midwest. As you can see, a major change.
Now let's compare last year, since the USDA apparently thinks yield is somehow someway supposedly higher than last year.
Now two more comparisons. The two years everyone has been comparing 2023 to for months now.
First is 2013. We said months ago this wasn’t a repeat of 2013, because it's not even close. We didn’t have a drought across the corn belt in 2013. It’s pretty crazy looking back the amount of people who told us this year was going to be a repeat of 2013 just by looking at this comparison.
Now for 2012. The year we have been comparing since last September.
If you take a look at the midwest, we are actually much drier across pretty much the entire corn belt.
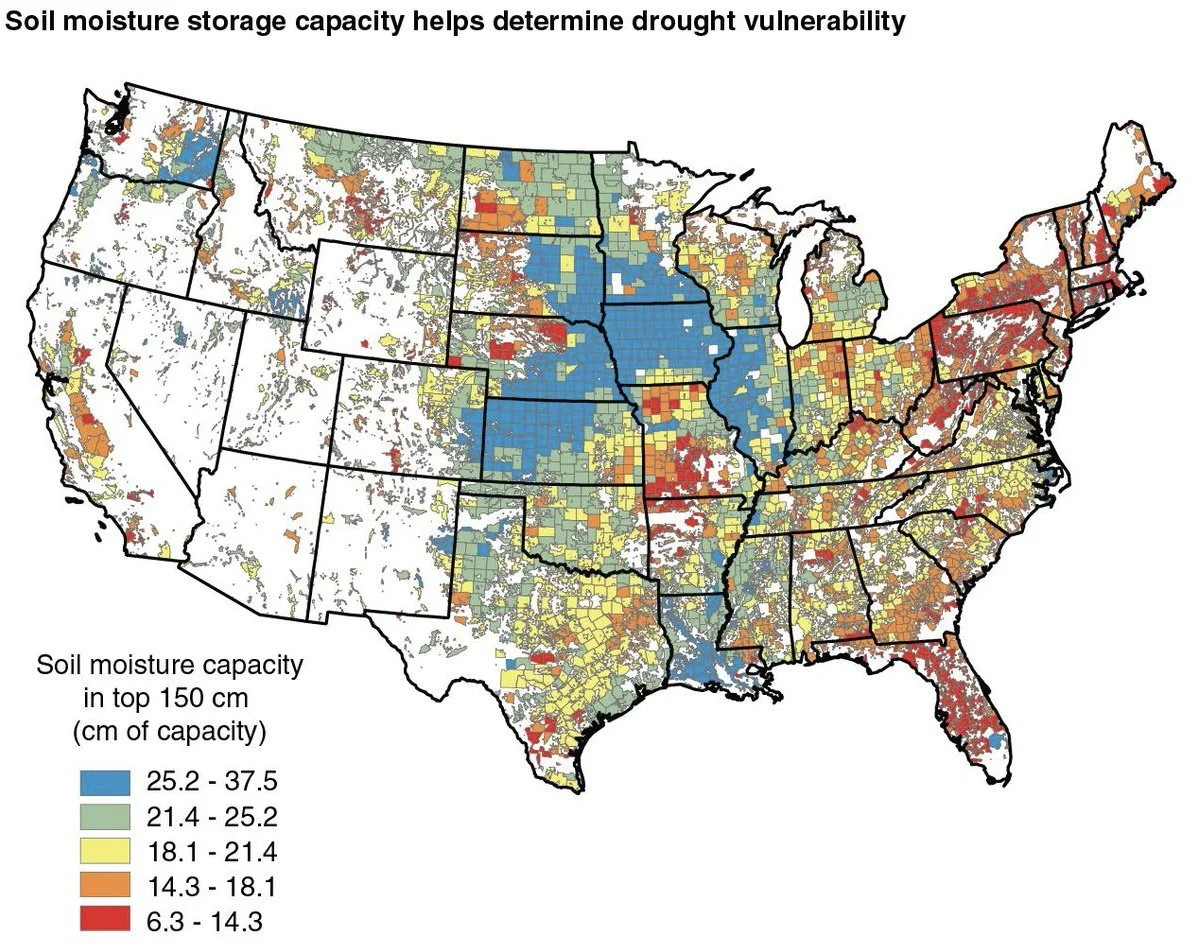
Here is a map that shows soil moisture capacity. A lot of the areas such as Iowa and Illinois that are able to hold a higher capacity for moisute (thus making it less vulnerable to drought) are the ones who are experiencing the worst drought already. Again, further pushing the argument for how dry it really is.
This week's corn condition index score fell to 348. The lowest since 1988. In 1988 the national yield was 84.6, down from 119 and a move 29% below trend line yield.
If we were to see that same drop this year, that would bring us to 129 bushels an acre yield.
In 2012 we saw yield drop from 164.5 to 123, a 25% reduction.
A 25% drop from this year's 181 would be 136 bushels per acre.
Now a 30% cut isn’t the most realistic scenario. But could we see yield sub 160 or even push 150? It’s a real possibility. A 10% drop from trend line would bring us to the 163 range. A 20% drop would be 145 bpa.
The 1-3 week weather outlook into the 1st week of July shows no drought busting rains. Wait until the real heat starts to come the next few weeks as we inch closer to July. If it stays dry the upside in our markets is ridiculously high.
Farms.com Risk Management said,
"The funds have just started their panic buying as they finally throw int eh towel but this is just the start of the vertical move higher so look for $7 corn futures by next Friday. Depending what Mother Nature does and the USDA says we could see $9 corn futures by mid-August."
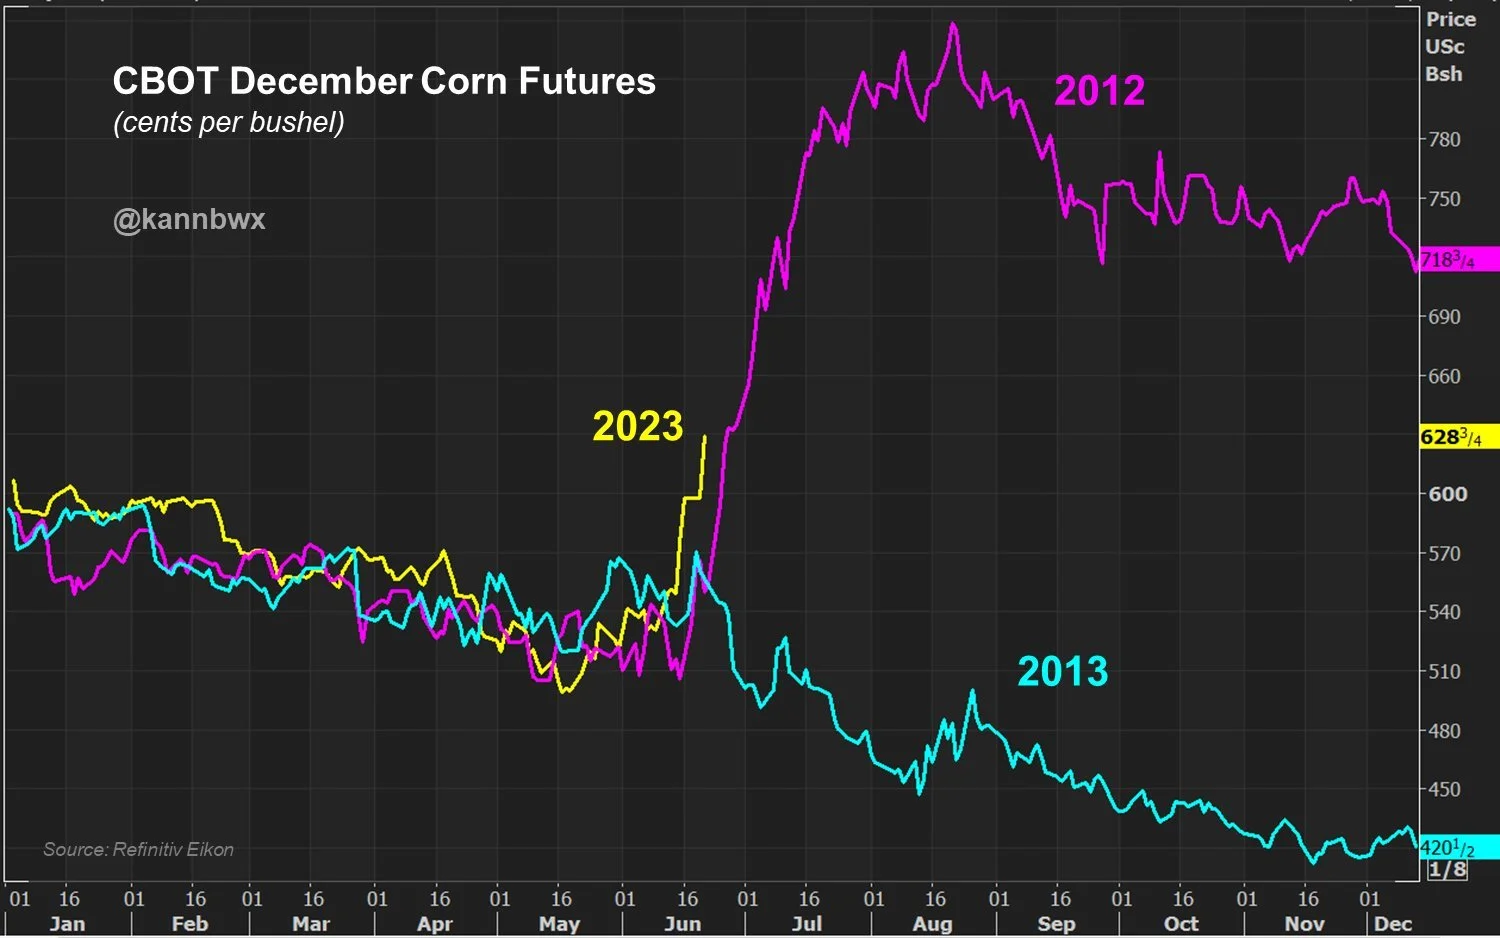
I completely agree with their statement. July corn is only 40 cents away from $7. Which isn't that big of a rally compared to the moves we've seen the past two weeks.
I know this year isn't 2012, but if the story winds up being anything similar the sky is the limit.
Remember when I showed this same exact chart over a month ago?
The 2012 comparisons continue and the potential upside is unreal.
Overall, demand is the only concern and argument bears have. It's weather bulls vs demand bears. I think weather will ultimately trump any other factor.
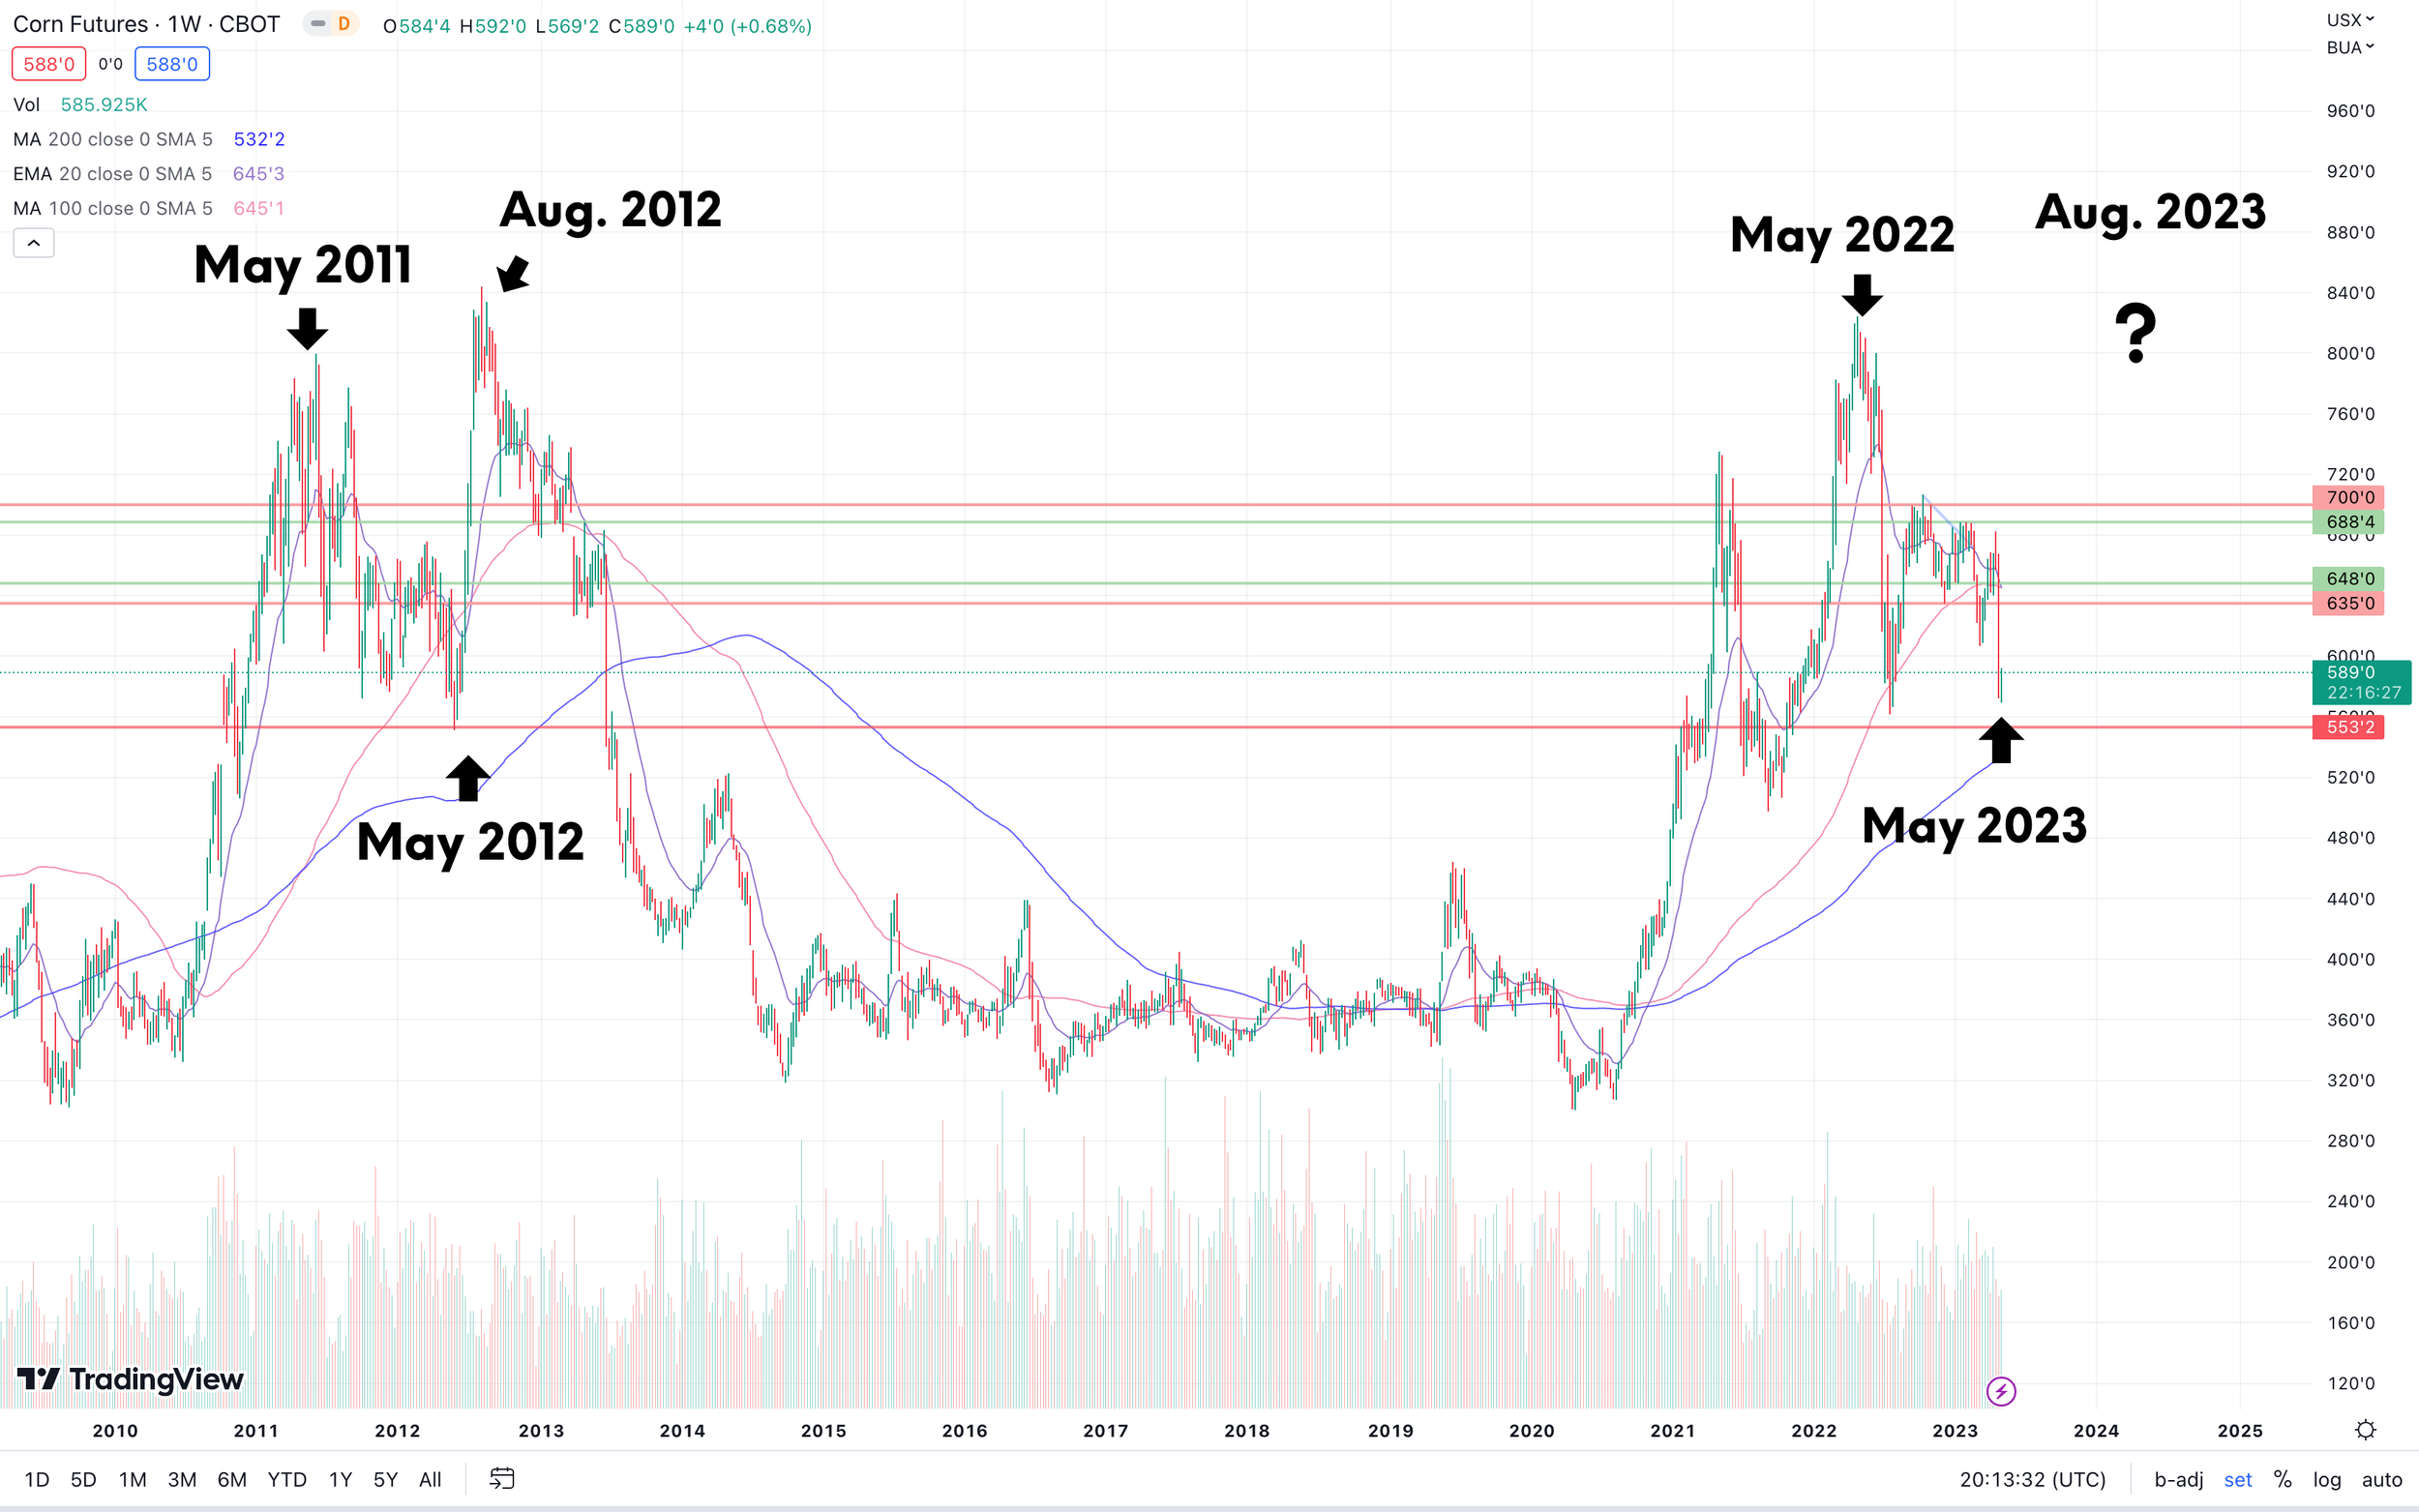
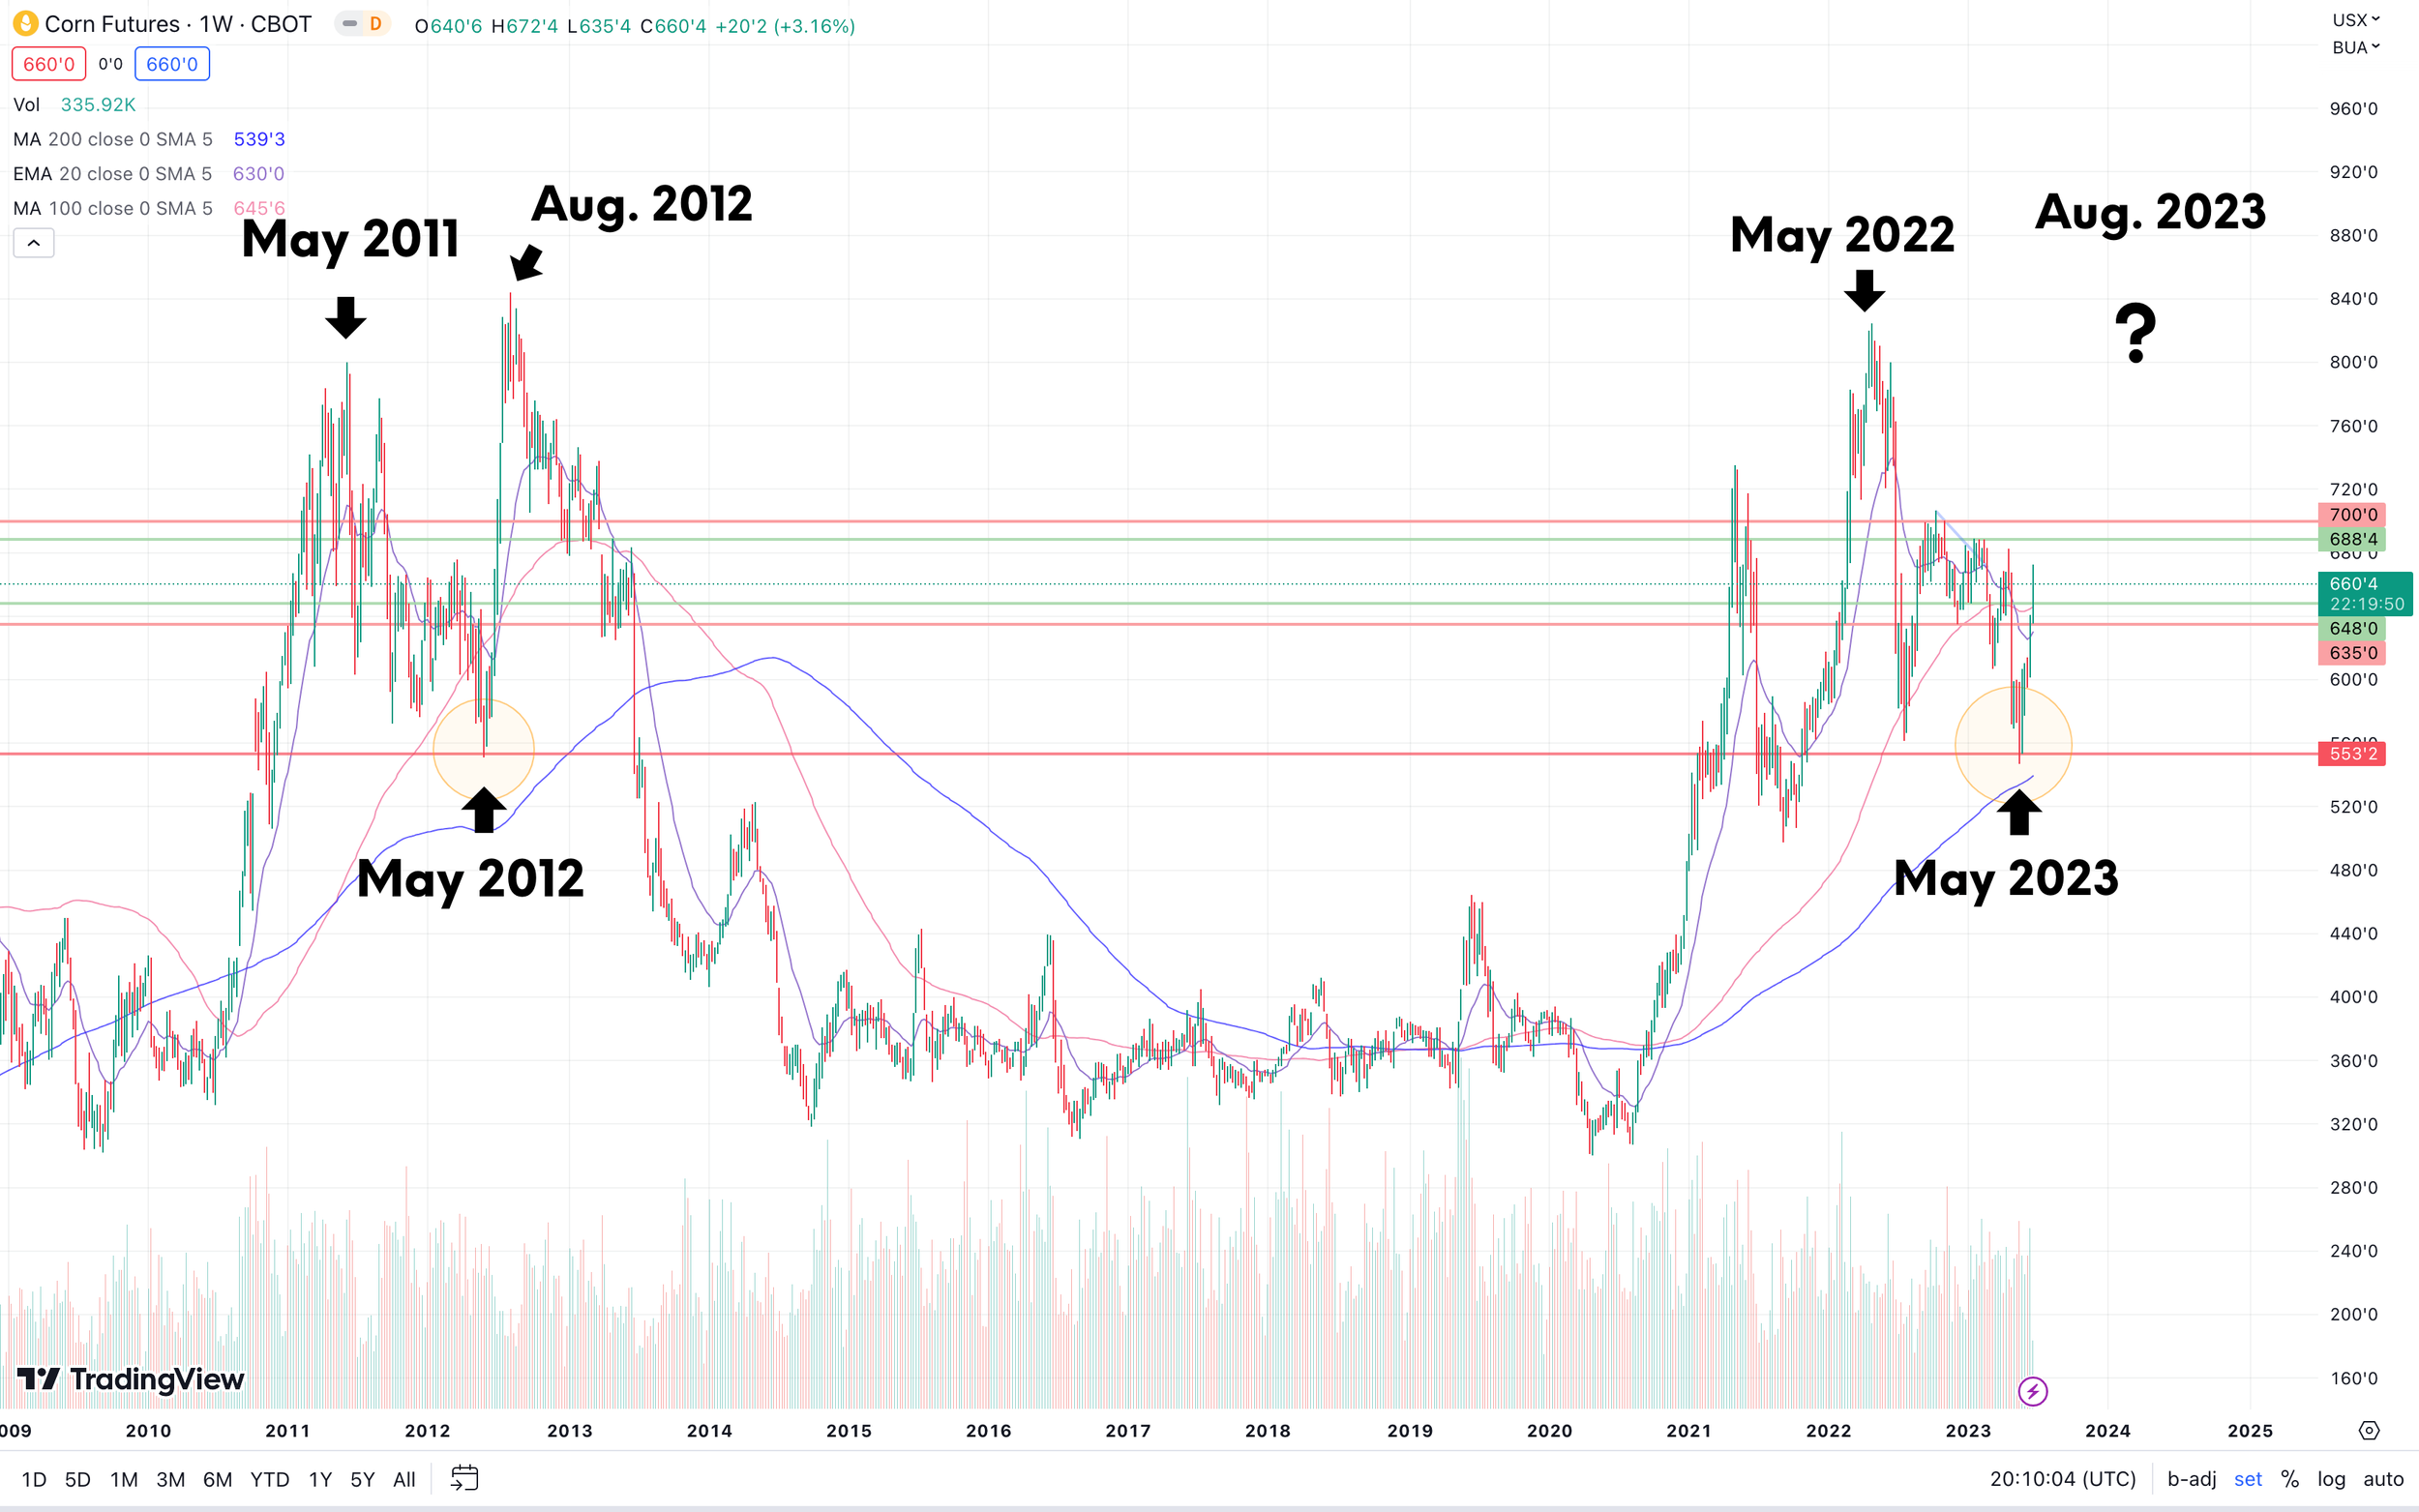
For those of you that have been subscribers for some time now, you might remember this next chart I posted the first week of May on corn's brutal sell off where I called for a bottom and similar price action to that of 2012.
Here is how the chart is shaping up as of today. A near identical scenario is playing out.
How high can we go? It all comes down to Mother Nature. But if it does indeed stay dry, watch out the next few weeks. If it is still dry come July 4th weekend, we could be in for a wild ride and the potential upside is ridiculous.
Soybeans
Soybenas hit hard today with the fall out in bean oil, as the EPA heavily pressured bean oil. November beans closed down 37 1/2 cents, but managed to climb back 17 cents off their early lows.
Today's sell off was due to…..
The rest of the post is subscriber-only content. Please subscribe to continue reading and to receive every one of our exclusive updates via text & email.
HONEYMOON SALE ENDS SUNDAY
Get every single one of our exclusive updates sent via text & email for a massive discount.
Unsure? Try a 30 day free trial HERE
OFFER: $299/yr or $29/mo
ORIGINALLY: $800 or $80
Become a Price Maker, Not a Price Taker
Check Out Past Updates
6/22/23 - Audio
DON’T FEAR THIS VOLATILITY
6/20/23 - Audio
VOLATILE MARKETS
6/19/23 - Audio
CORN SUPPLY RALLY
6/16/23 - Audio
ARE THE GRAINS ABOUT TO GO PARABOLIC
6/15/23 - Audio
2023 IS WORSE THAN 2012
6/15/23 - Audio
CAN CORN BREAK MAGIC LINES?
6/13/23 - Audio
2012 REPEAT OR WORSE
6/12/23 - Market Update
CROP CONDITIONS CONTINUE TO FALL
6/12/23 - Audio
WHY THIS YEAR ISN’T 2013
6/11/23 - Weekly Grain Newsletter
NAVIGATING THE USDA REPORT & DROUGHT


