CORN LEADS VOLATILE WEATHER MARKET
Overview
Grains closed mixed in a wild volatile day. Corn leads the charge up over a dime with the ever changing forecasts and poor crop conditions yesterday. Wheat initially found strength from war headlines and was off to the races, trading anywhere from 20 to 24 cents higher before coming well off those highs, as both KC and Minneapolis ultimately ended the day slightly red.
The volatility in corn was due to the forecasts, as they are ever changing and the trade takes notice. One hour there is rain, the next they take the rain out.
The two most popular weather models are the American and European models. One says it will rain in the corn belt next week, while the other says it will remain as dry as it has been the past two weeks.
Wheat rallied off the back of more war headlines as Russia blew up a dam in Ukraine, but wheat futures ultimately gave back all of their gains as forecasts show some rain to drought distressed areas.
***
In case you missed it, Sunday's Weekly Newsletter
AI Drought & Price Predictions - Read Here
Today's Main Takeaways
Corn
July corn rallies a dime in an up and down day full of volatility.
First we are going to go over yesterday's crop conditions.
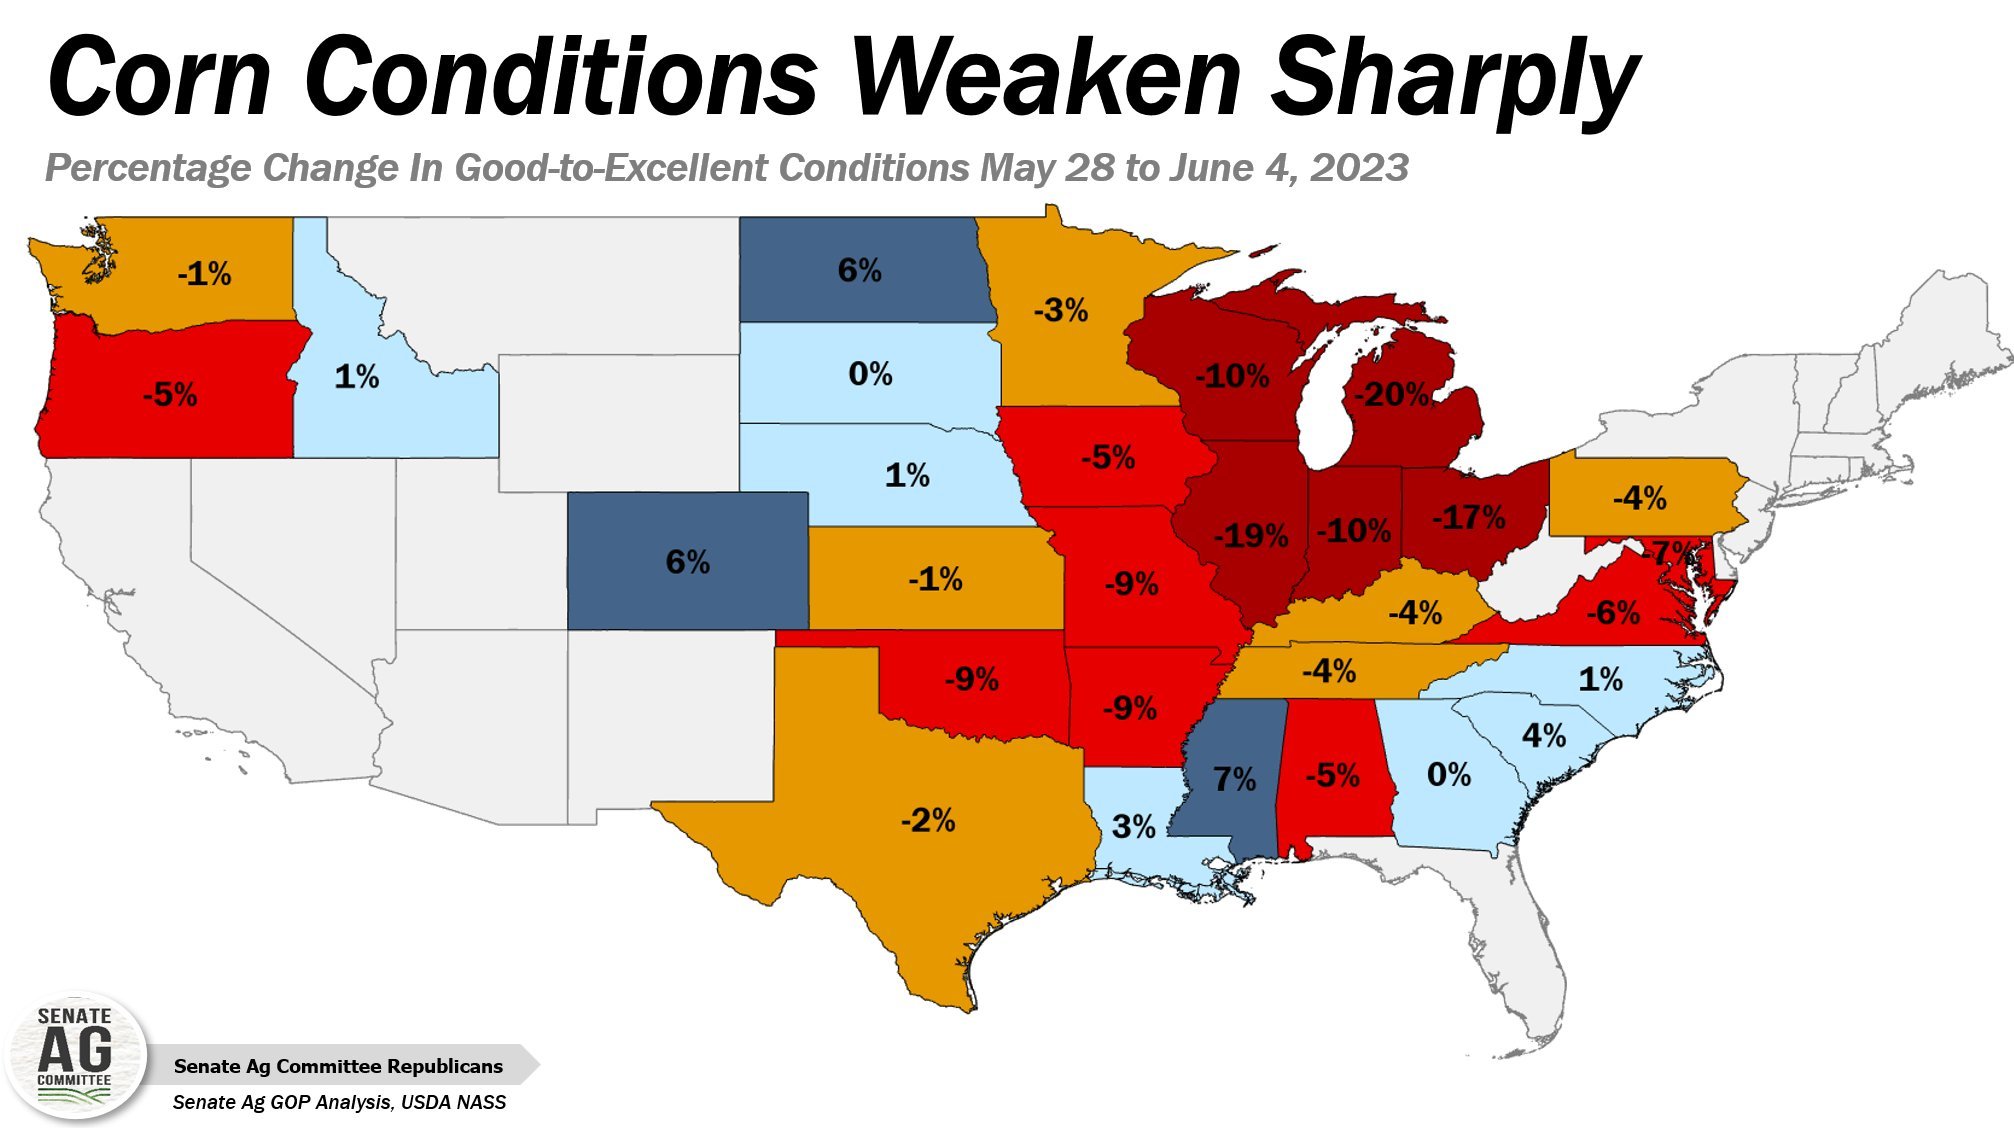
Notable Changes vs Last Week:
Illinois: -19%
They are at their lowest good to excellent rating (50%) since 2002.
Indiana: -10%
Michigan: -20%
Missouri: -9%
Ohio: -17%
Wisconsin: -10%
The only states with a greater improvement of more than 1% were Colorado and North Dakota who both improved by 6%.
Below is a map showcasing the changes from last week. Notice the states in dark red..
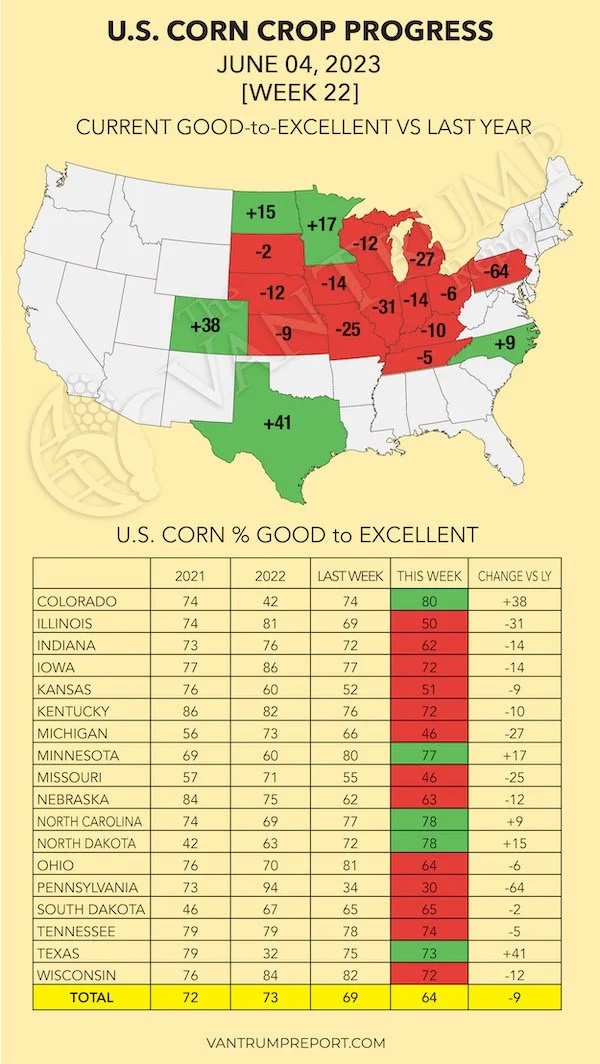
Next is a map that shows the difference between this year and last year from the Van Trump Report.
Notice how much of a worse situation we are in around the corn belt than we were last year?
Notable Changes vs Last Year:
Illinois -31%
Indiana -14%
Iowa -14%
Michigan -27%
Pennsylvania -64%
Wisconsin -12%
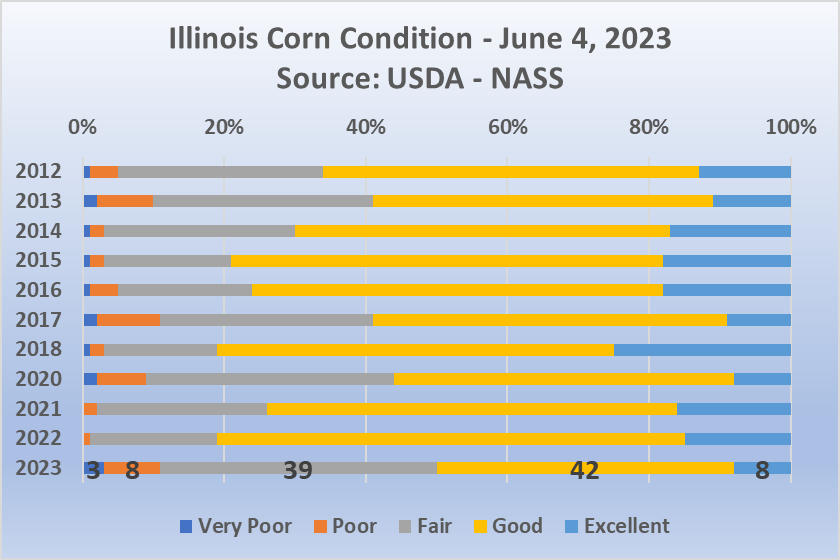
Illinois alone came in nearly 20% worse than it was already at last week. Keep in mind, Illinois was our second largest producing state last year. Now their corn crop is rated at just 50% good to excellent. That is the worst on record since 2002.
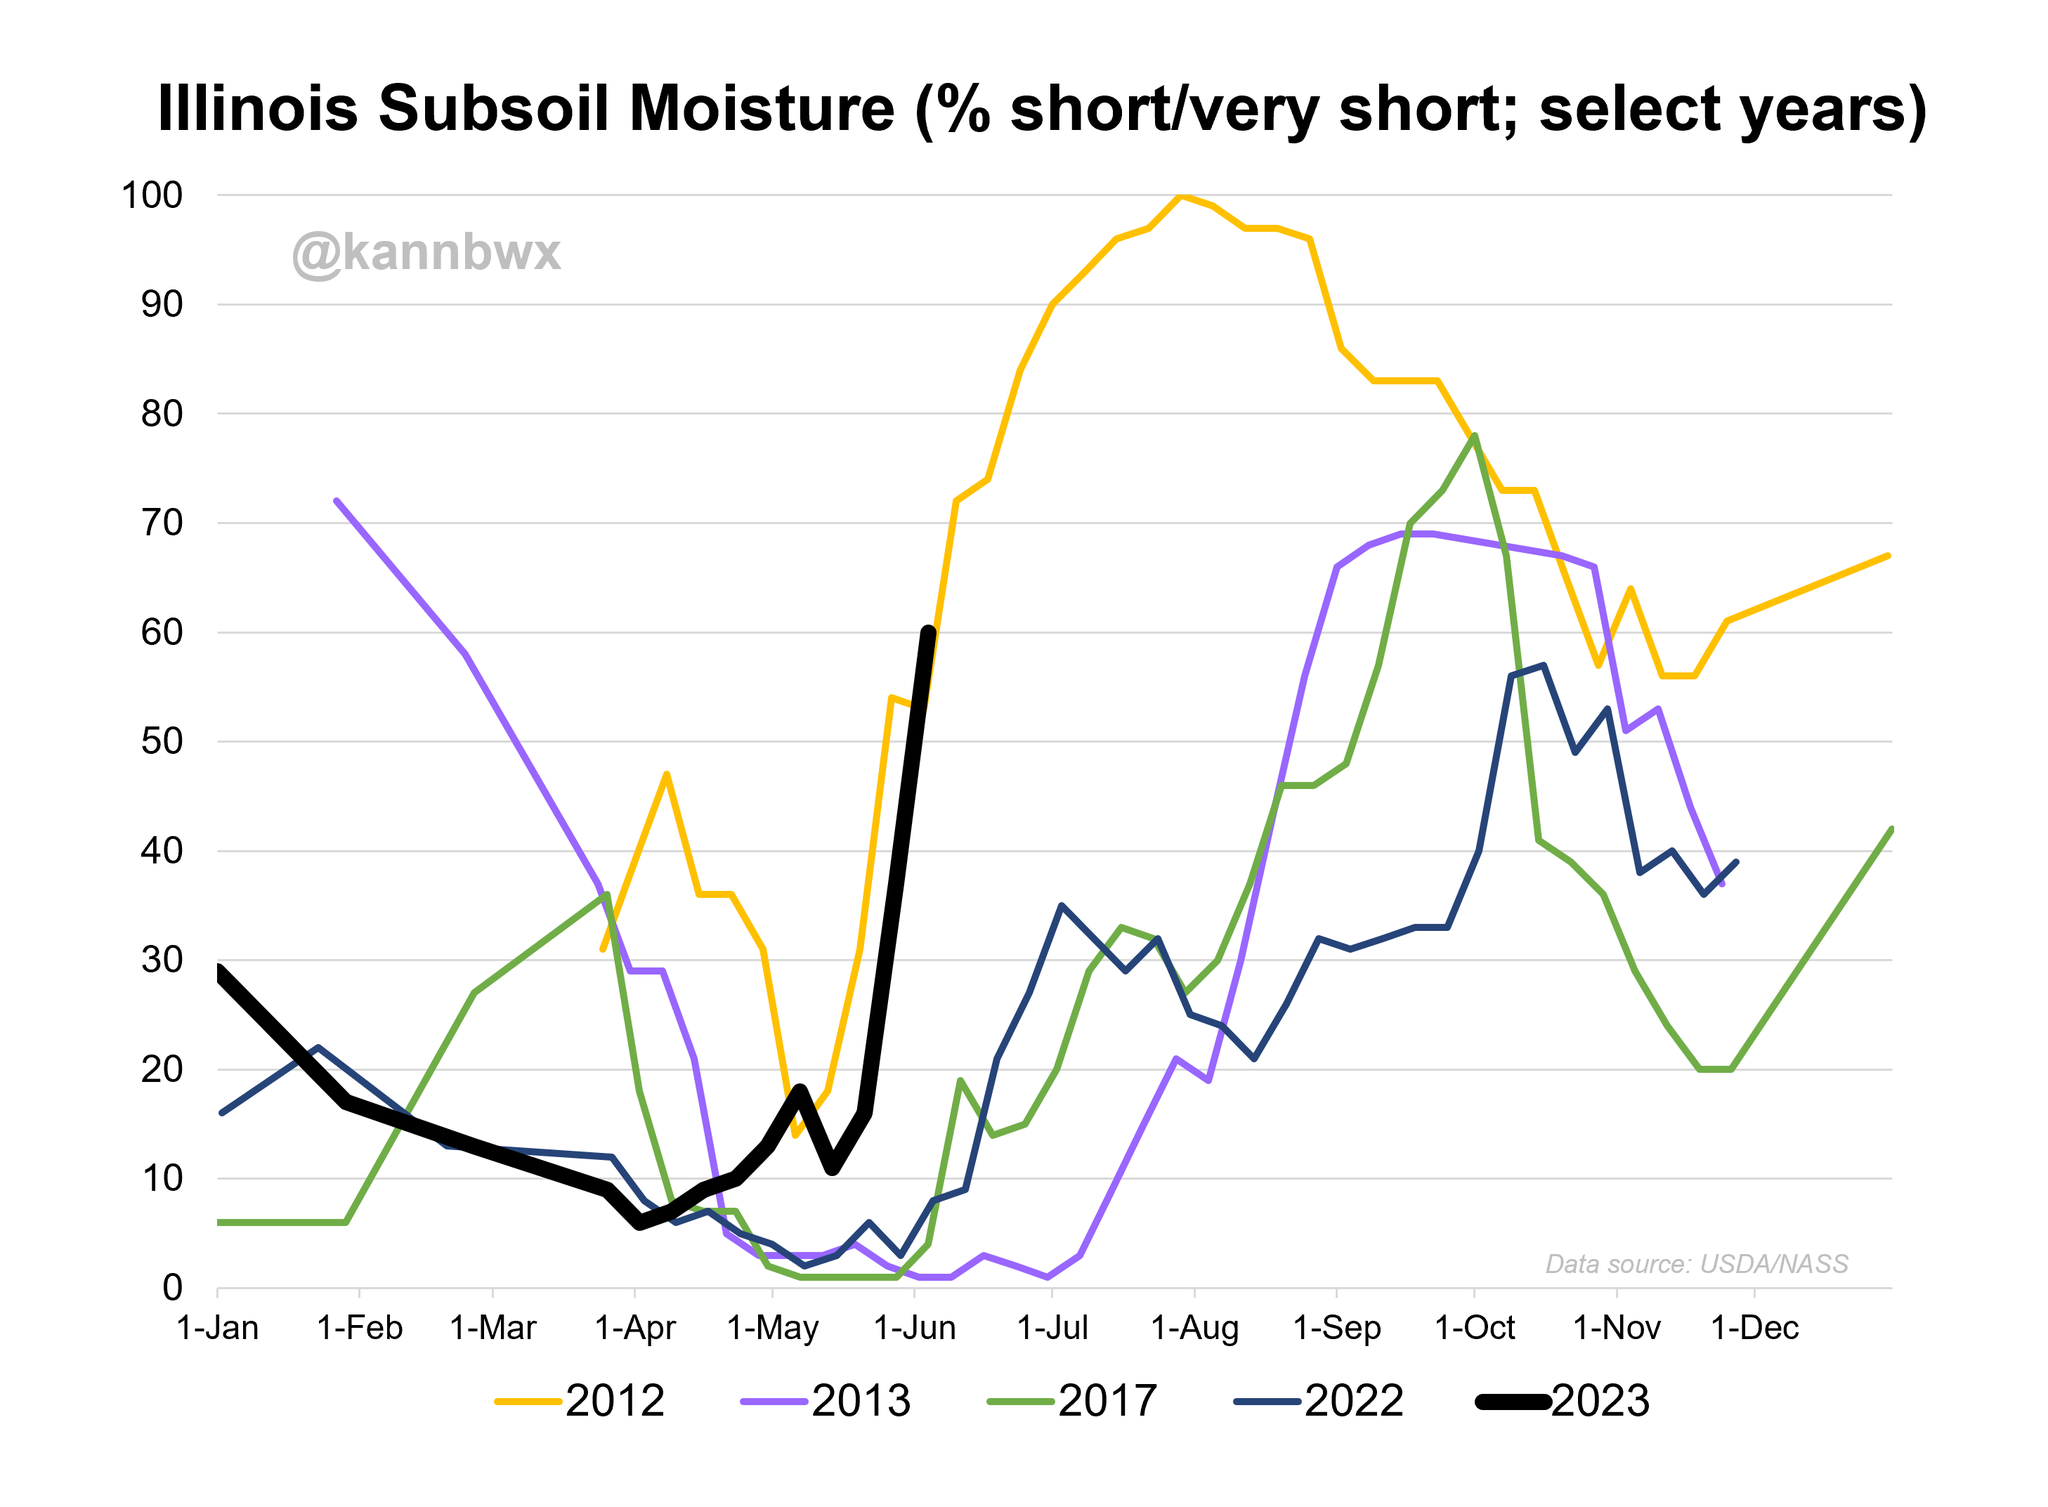
Take a look at the Illinois subsoil situation comparison between these years. 60% of Illinois is short to very short subsoil. A 16% increase over the past 2 weeks.
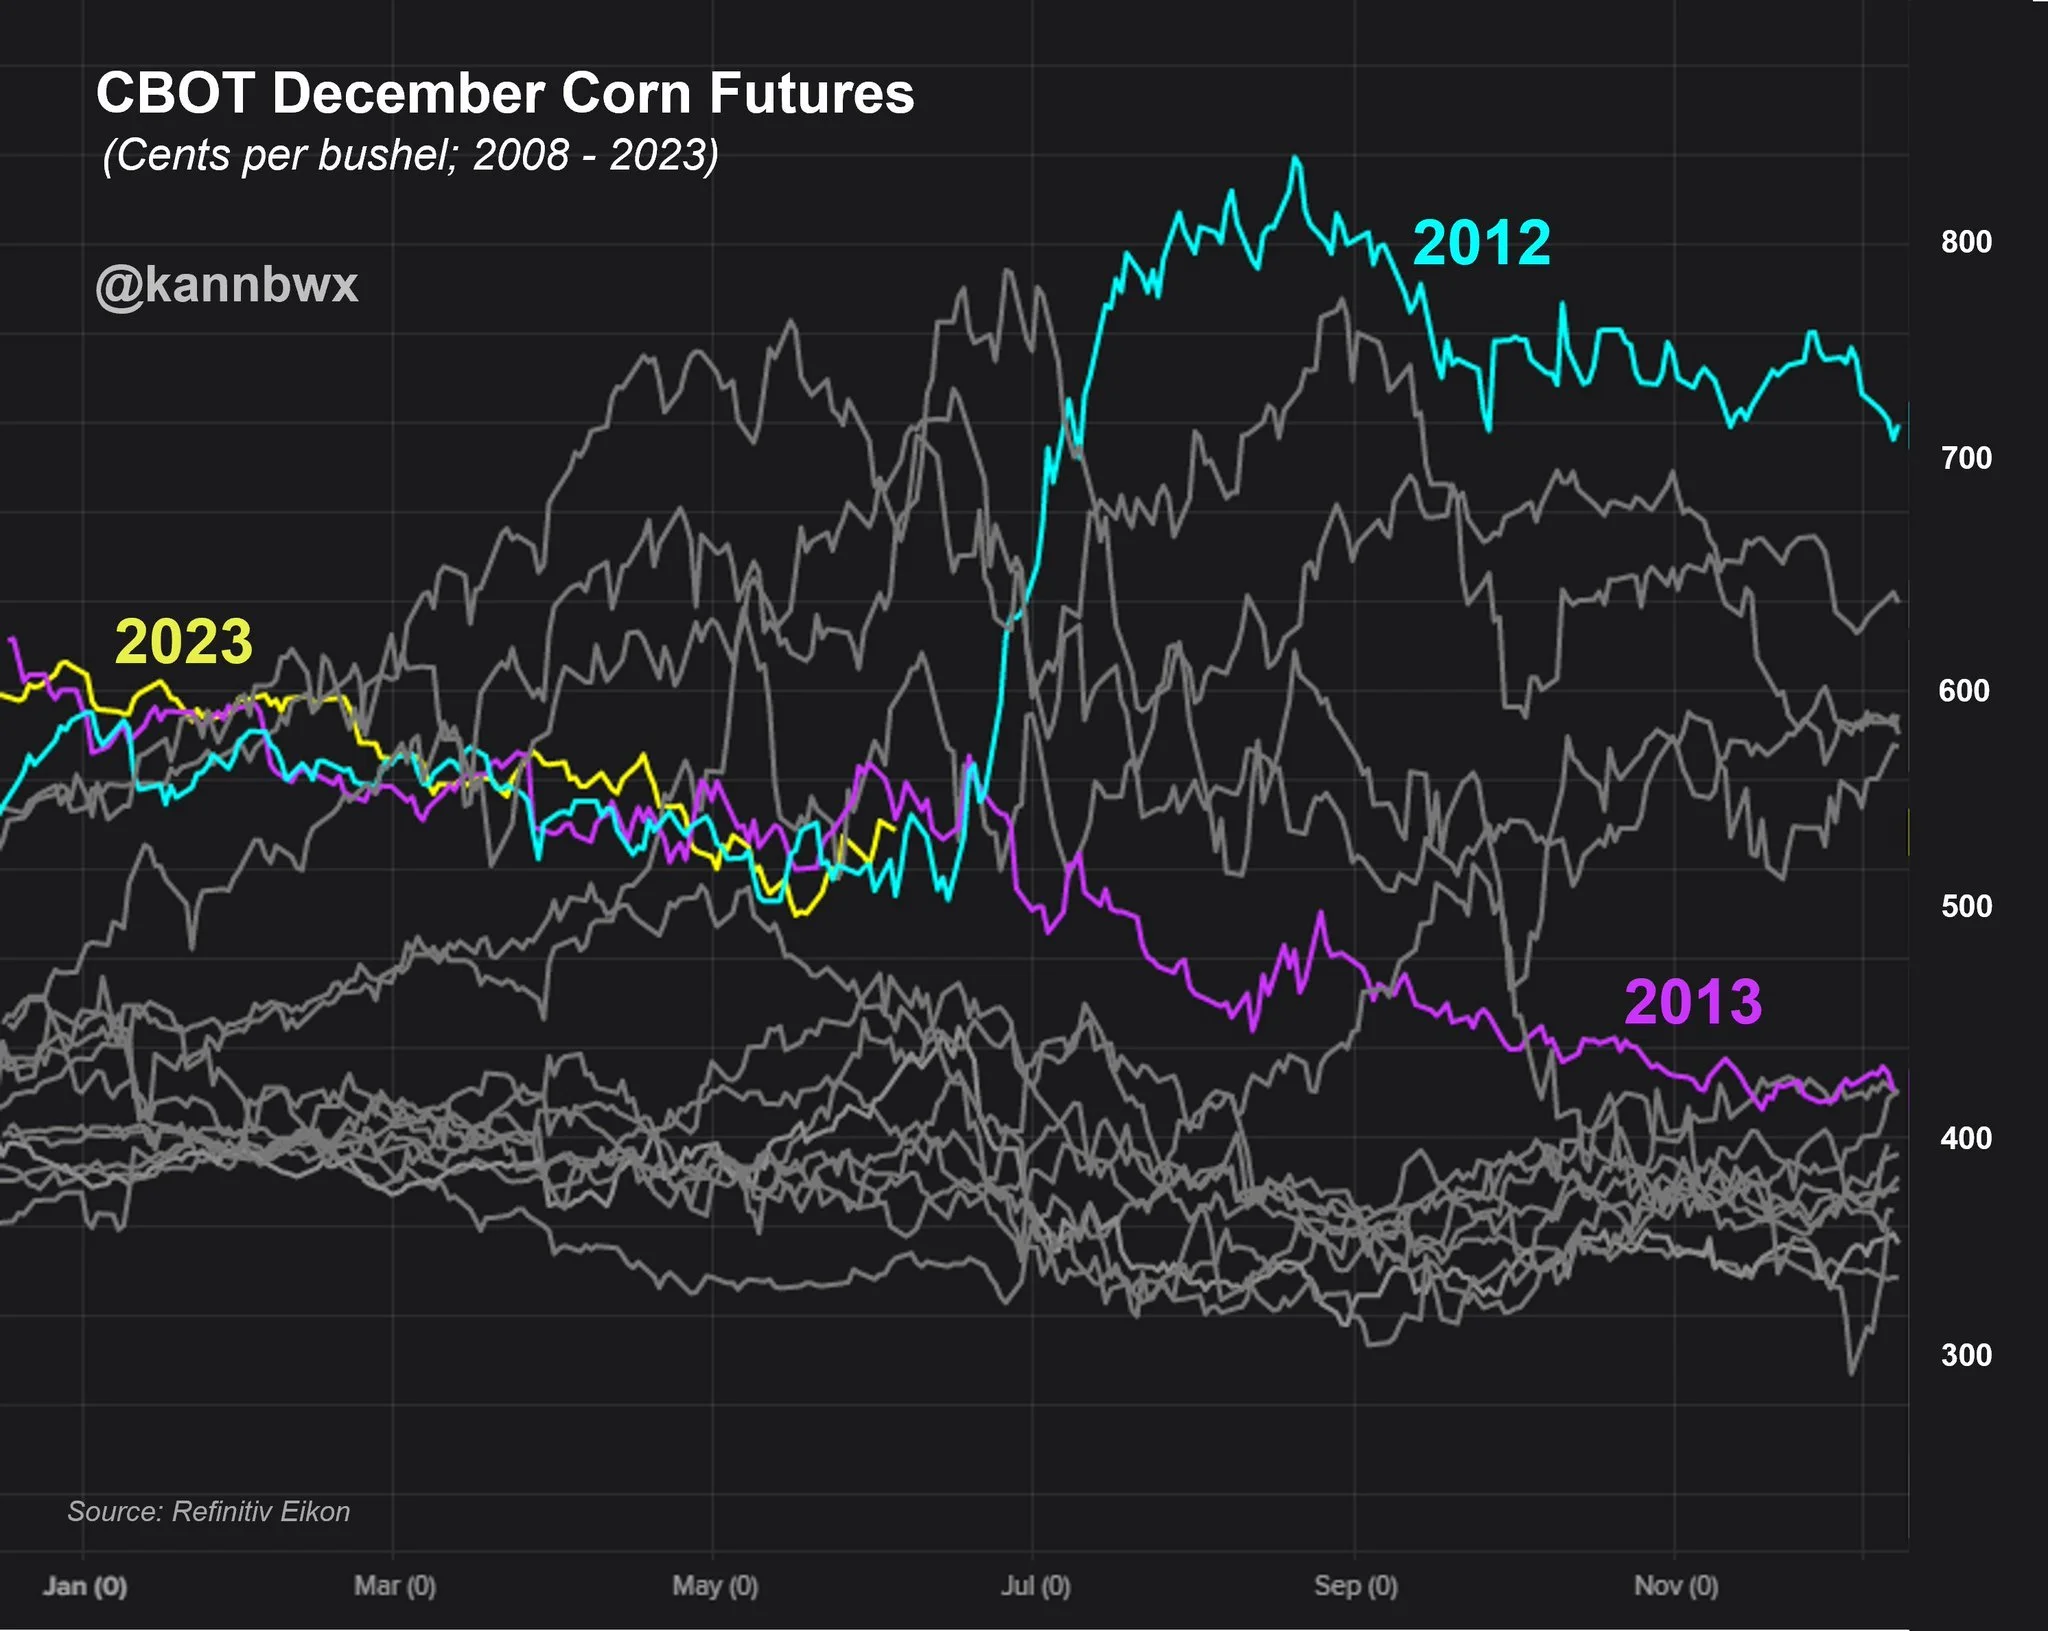
Which year does this year replicate? 2012. Not 2013.
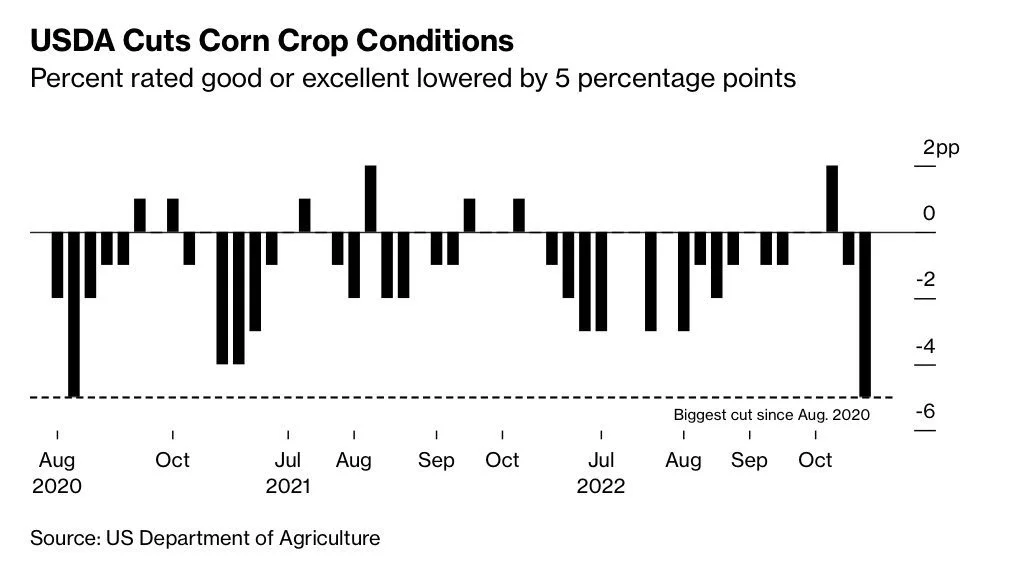
Overall our corn was cut 5%, from 69% to 64%. This is the single biggest decrease we have seen since August of 2020.
This 64% is 9% worse than where we were at last year.. yet the USDA thinks we are at +180 yield...?
There is virtually zero chance we see yield remotely close to what the USDA currently has.
Yes typically, the USDA does like to slow play this upcoming report. As they very rarely make significantly large changes. So do not be shocked if we again see the USDA kick the can down the road and wait until July to make the changes it needs to make. I would be surprised if we don’t get at least a fractional decrease, but do not want to be overly anticipation of this massive decrease come Friday.
I think the USDA and the trade realizes all of the problems later towards the end of this month. If it stays dry, we have the ability to make a very similar bull run to that of 2012.
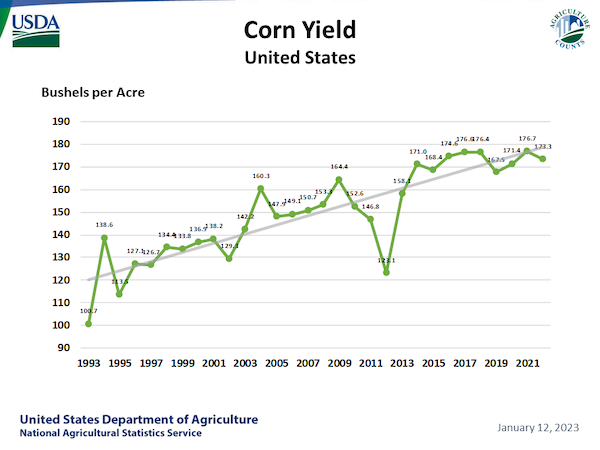
Below is a chart that shows the USDA corn trendline yield. A clear upward trend in place. But are we due for a big miss to the downside? The USDA giving us this absurd unrealistic high yield to start gives us all the more power for a big swing and a miss.
Going forward it is more of the same. Do we get rain, do we not get rain. The forecasts have been all over the place. They put rain in, then they take it out. It looks like they do have some spotty rain in the forecasts, but will these actually pan out, who knows. In general these rain falls will likely be less than expected and I don’t see the drought in the corn belt going away unless we get some very timely rain.
2012 or 2013?
Below is a chart from Karen Braun that show cases the similarities between 2012, 2013, and 2023. The 3 years are nearly identical up to this point. We will likely know which year we will get by the end of June. In their respective years, 2012 took off at the end of June while 2013 did the complete opposite and crumbled.
Which way 2023 decides to go will all come down to weather. Do we get the rains a good majority of the crop desperately needs? Or does the drought continue?
I am no weather expert, but we are indeed already much drier than that of 2012. Yes our crop isn’t made in May and no 2 years are the same. But if it stays dry, we could very easily replicate something similar to that of 2012.
The date to watch out for? June 22nd is the date we sky rocketed and fall off in those two years.
Want to Get Updates Like These?
Try our free trial. Completely free for 30 days. Receive all of our exclusive updates via text & email.
Soybeans
Soybeans manage to close green, in a day where they traded in a 24 cent range. Closing essentially in the middle up +3 cents. At one point trading 12 cents higher and at one point trading 12 cents lower.
Similar to corn, soybean crop conditions came in at some of their lowest conditions in nearly a decade. Coming in at their lowest since 2014.
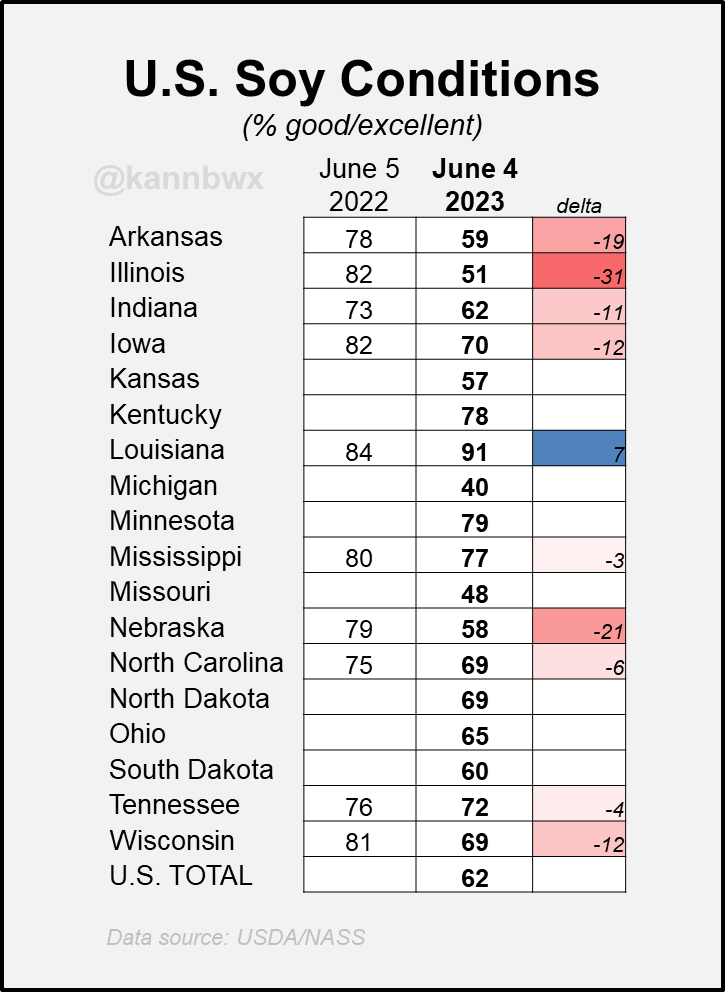
Some national and state level conditions were available at this same week last year, so below is a chart with the available comparisons. The top grower of Illinois is sitting at just 51% rated good to excellent, and took the biggest hit when compared to last week.
Notable Changes from Last Year:
Illinois: -31%
Arkansas: -19%
Indiana: -11%
Iowa: -12%
Nebraska: -21%
Wisconsin: -12%
The only state that is doing better than last year is Louisiana, by just 7%.
Not a ton has changed surrounding beans. The US bean crop is now 91% planted, which is much faster than our traditional pace of 76%.
The big question going forward now is, will this planted crop hold up and actually produce the record crop the USDA has forecasted at a 52 bushel per acre yield?
Similar to corn, most will argue it is still far too early to see any major changes come Friday. For beans I would have to agree it is a little early.
The dryness and weather wont directly correlate to beans as much as it will to come in the coming days, but will nonetheless be the biggest factor in the markets.
Going forward there is also some other question marks and potential wild cards surrounding China and their covid situation along with demand, then we have Brazil's massive crop which is a negative. But actually getting the crop out of the country is a different story.
I'm not quite as bullish beans here short term as I am corn. But if it stays dry one can imagine we see beans follow corn higher, with a potentially bigger demand story developing later this summer for beans.
I also want to keep in mind that nearly every state came in well below where it did last year for crop conditions, and there is still an entire growing season left for beans will a ton of possible weather stories and wild cards.
Below is a chart that shows the top producing states for beans. Keep in mind, that state at the top (Illinois) just came in 1/3 worse than it did last year.
Wheat
Wheat futures initially screamed higher with the attacks on the dam in Ukraine. But ultimately all fell off far from their highs. As Chicago ended 20 cents off its highs, KC was 27 cents off its highs, and Minneapolis was 22 cents off its highs.
Despite the war headlines the wheat market continues struggle to maintain these rallies. Essentially what happened today was that Russia blew up a dam in Ukraine. Millions of hectares of Ukrainian farmland will be affected. As a result, the world market won’t get millions of tons of grain immediately this year. Is this the end of the war wild cards? It doesn’t look like the issues are going away. Is the grain deal going to be over? Who knows, but there are many problems and headaches surrounding the entire deal.
Why did wheat break lower after rallying? It was mostly due to more rains popping up in areas of Kansas and Nebraska in 7 to 10 day forecasts.
Another big headline we saw was in Australia. As Australia's wheat production is forecasted to plunge 34% from their record 2022-23 crop to 26.2 million metric tons. The planted area is only expected to drop 2%, but yields are expected to be reduced by the effects and development of El Niño. This El Niño is expected to make the weather extremely dry.
Crop conditions yesterday weren’t anything extremely noteworthy. Spring wheat saw some small increases to their good to excellent rating. While winter wheat was bit of a mixed bag with increases to both the good and poor ratings.
Going forward, wheat will still be a weather and war driven market as it has been for months.
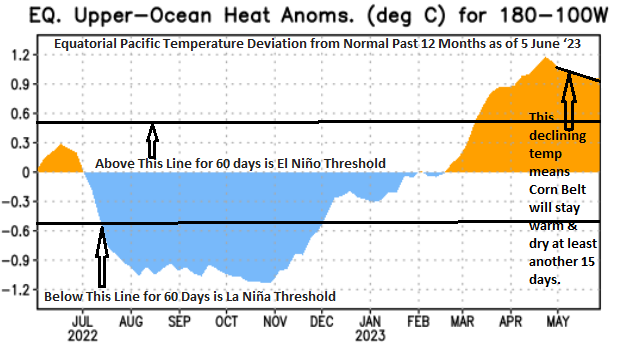
El Niño
From Wright on the Market,
The graph below is the latest ENSO temperatures. The declining temp means that the corn belt will stay warm and dry for at least another 15 days.
The Charts
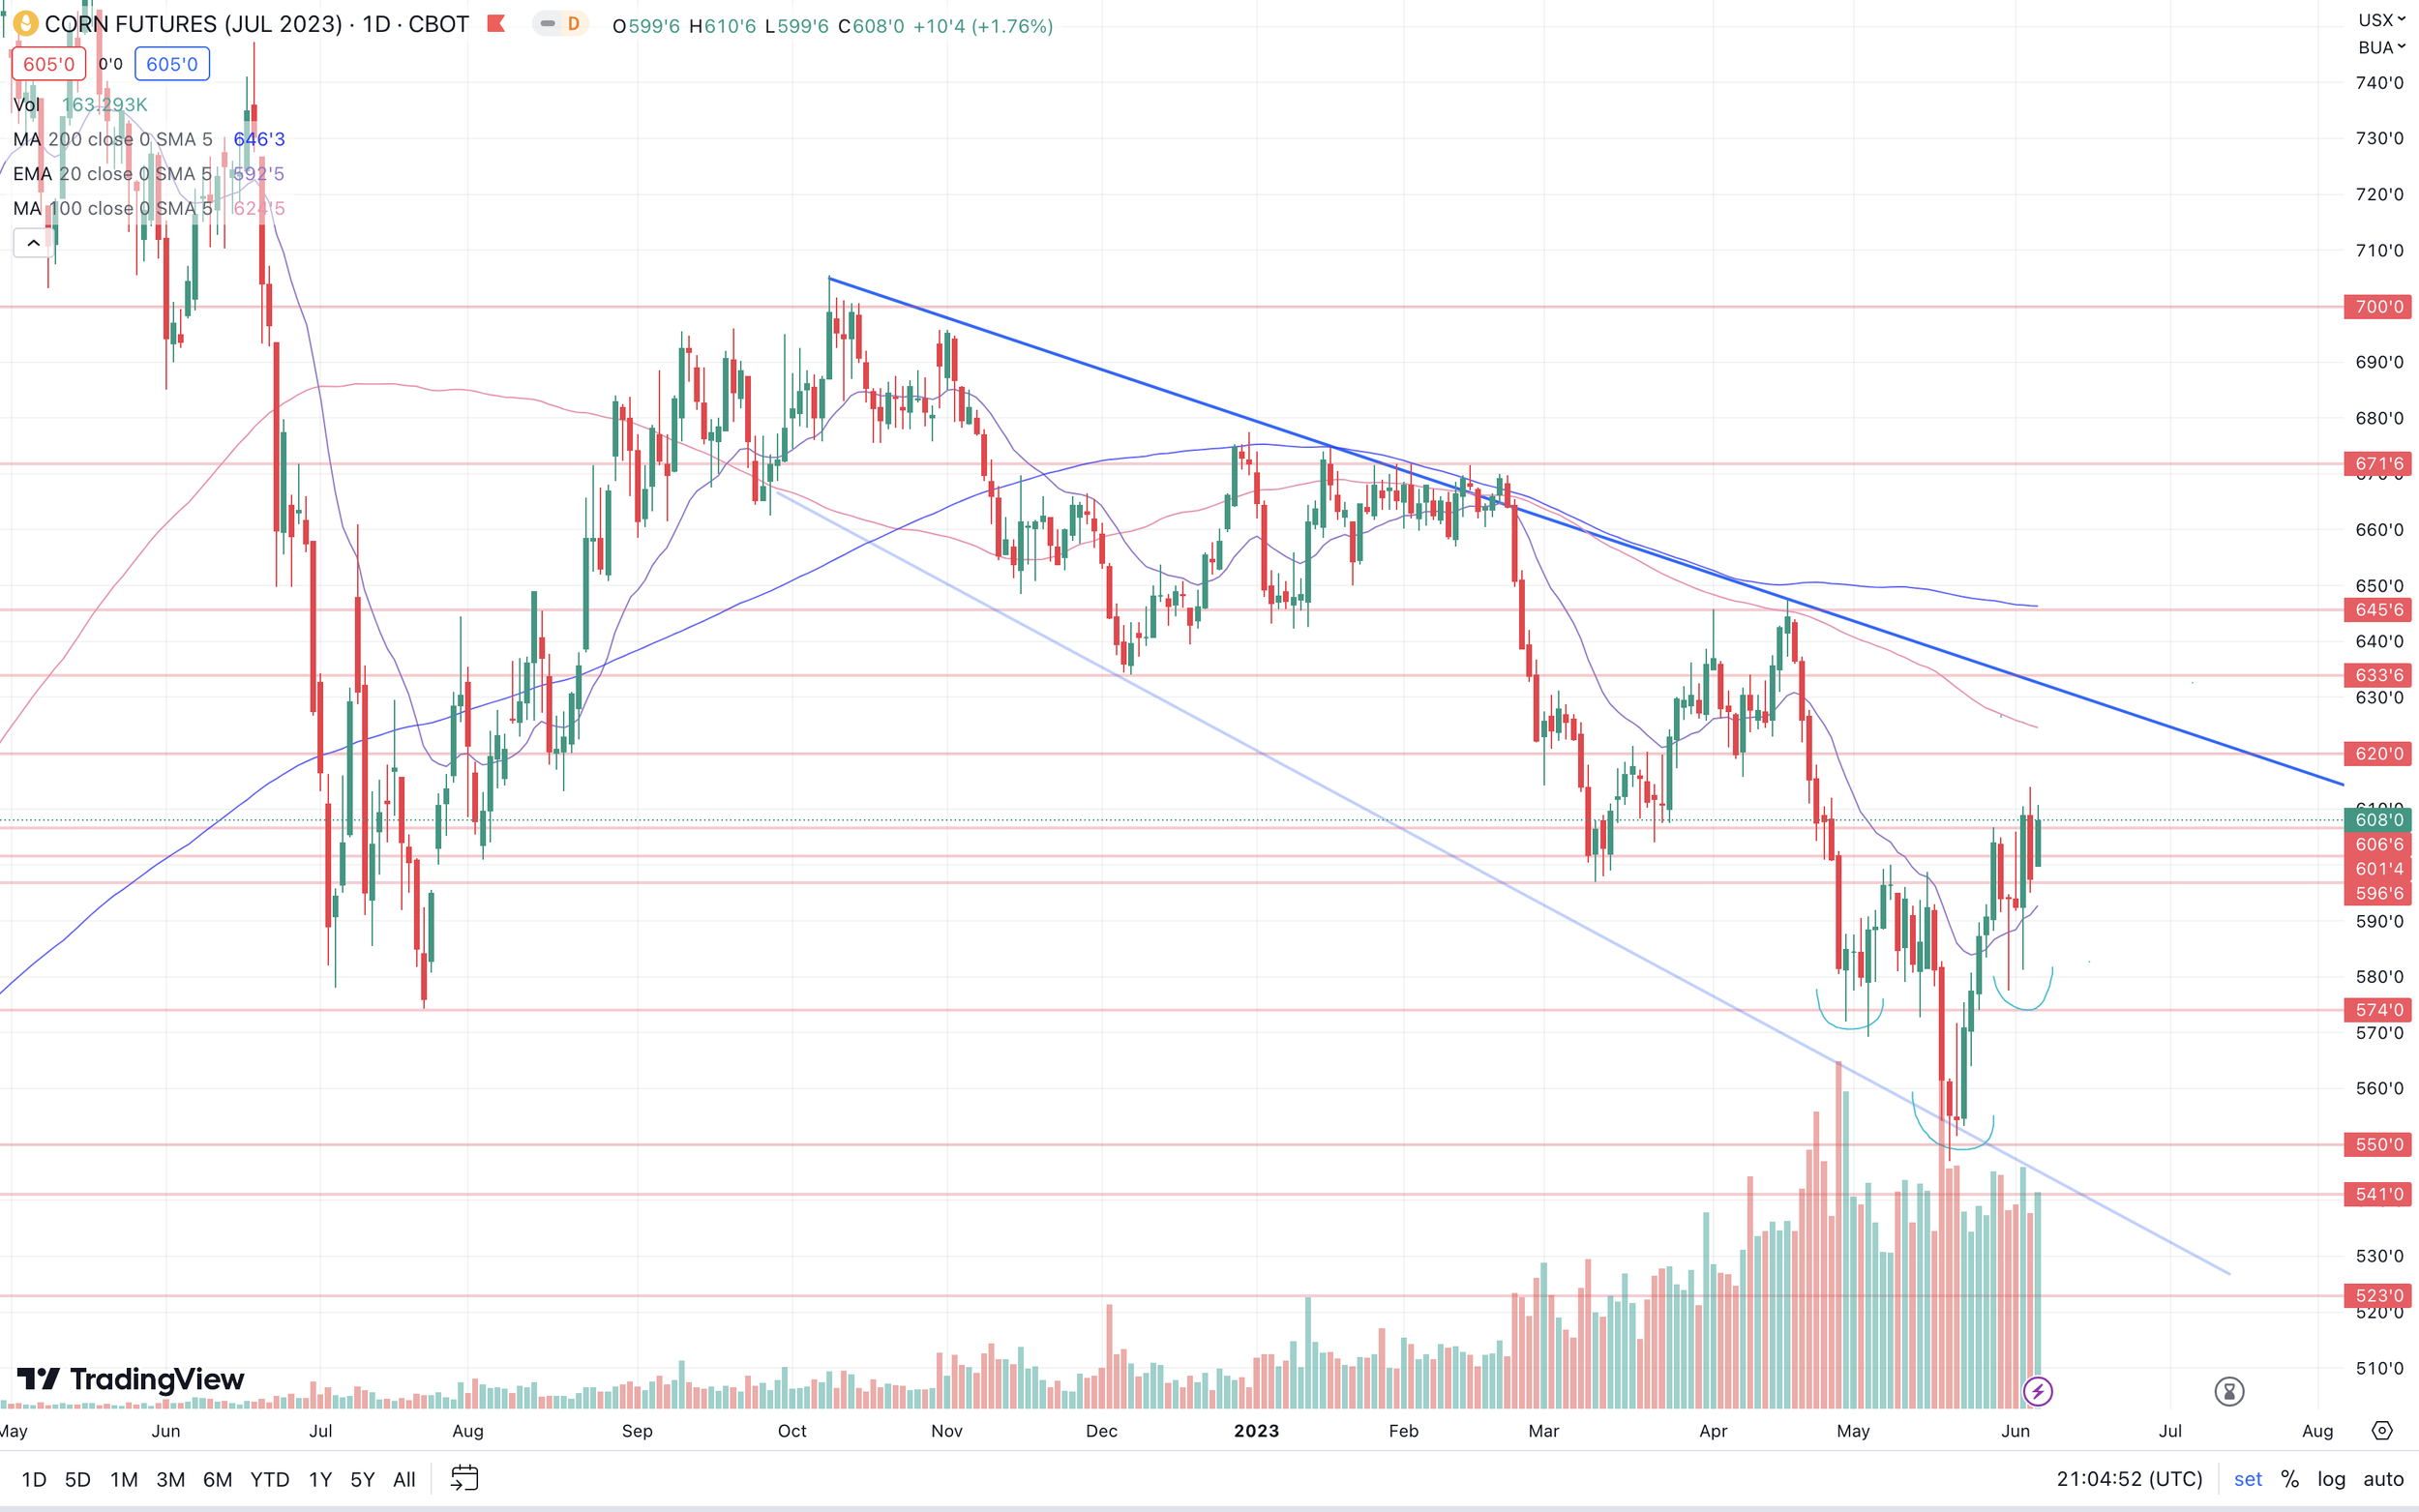
Corn 🌽
That inverse head and shoulders is still intact (bullish formation). I like our chances of going much higher. But weather will trump any technicals.
Corn July-23
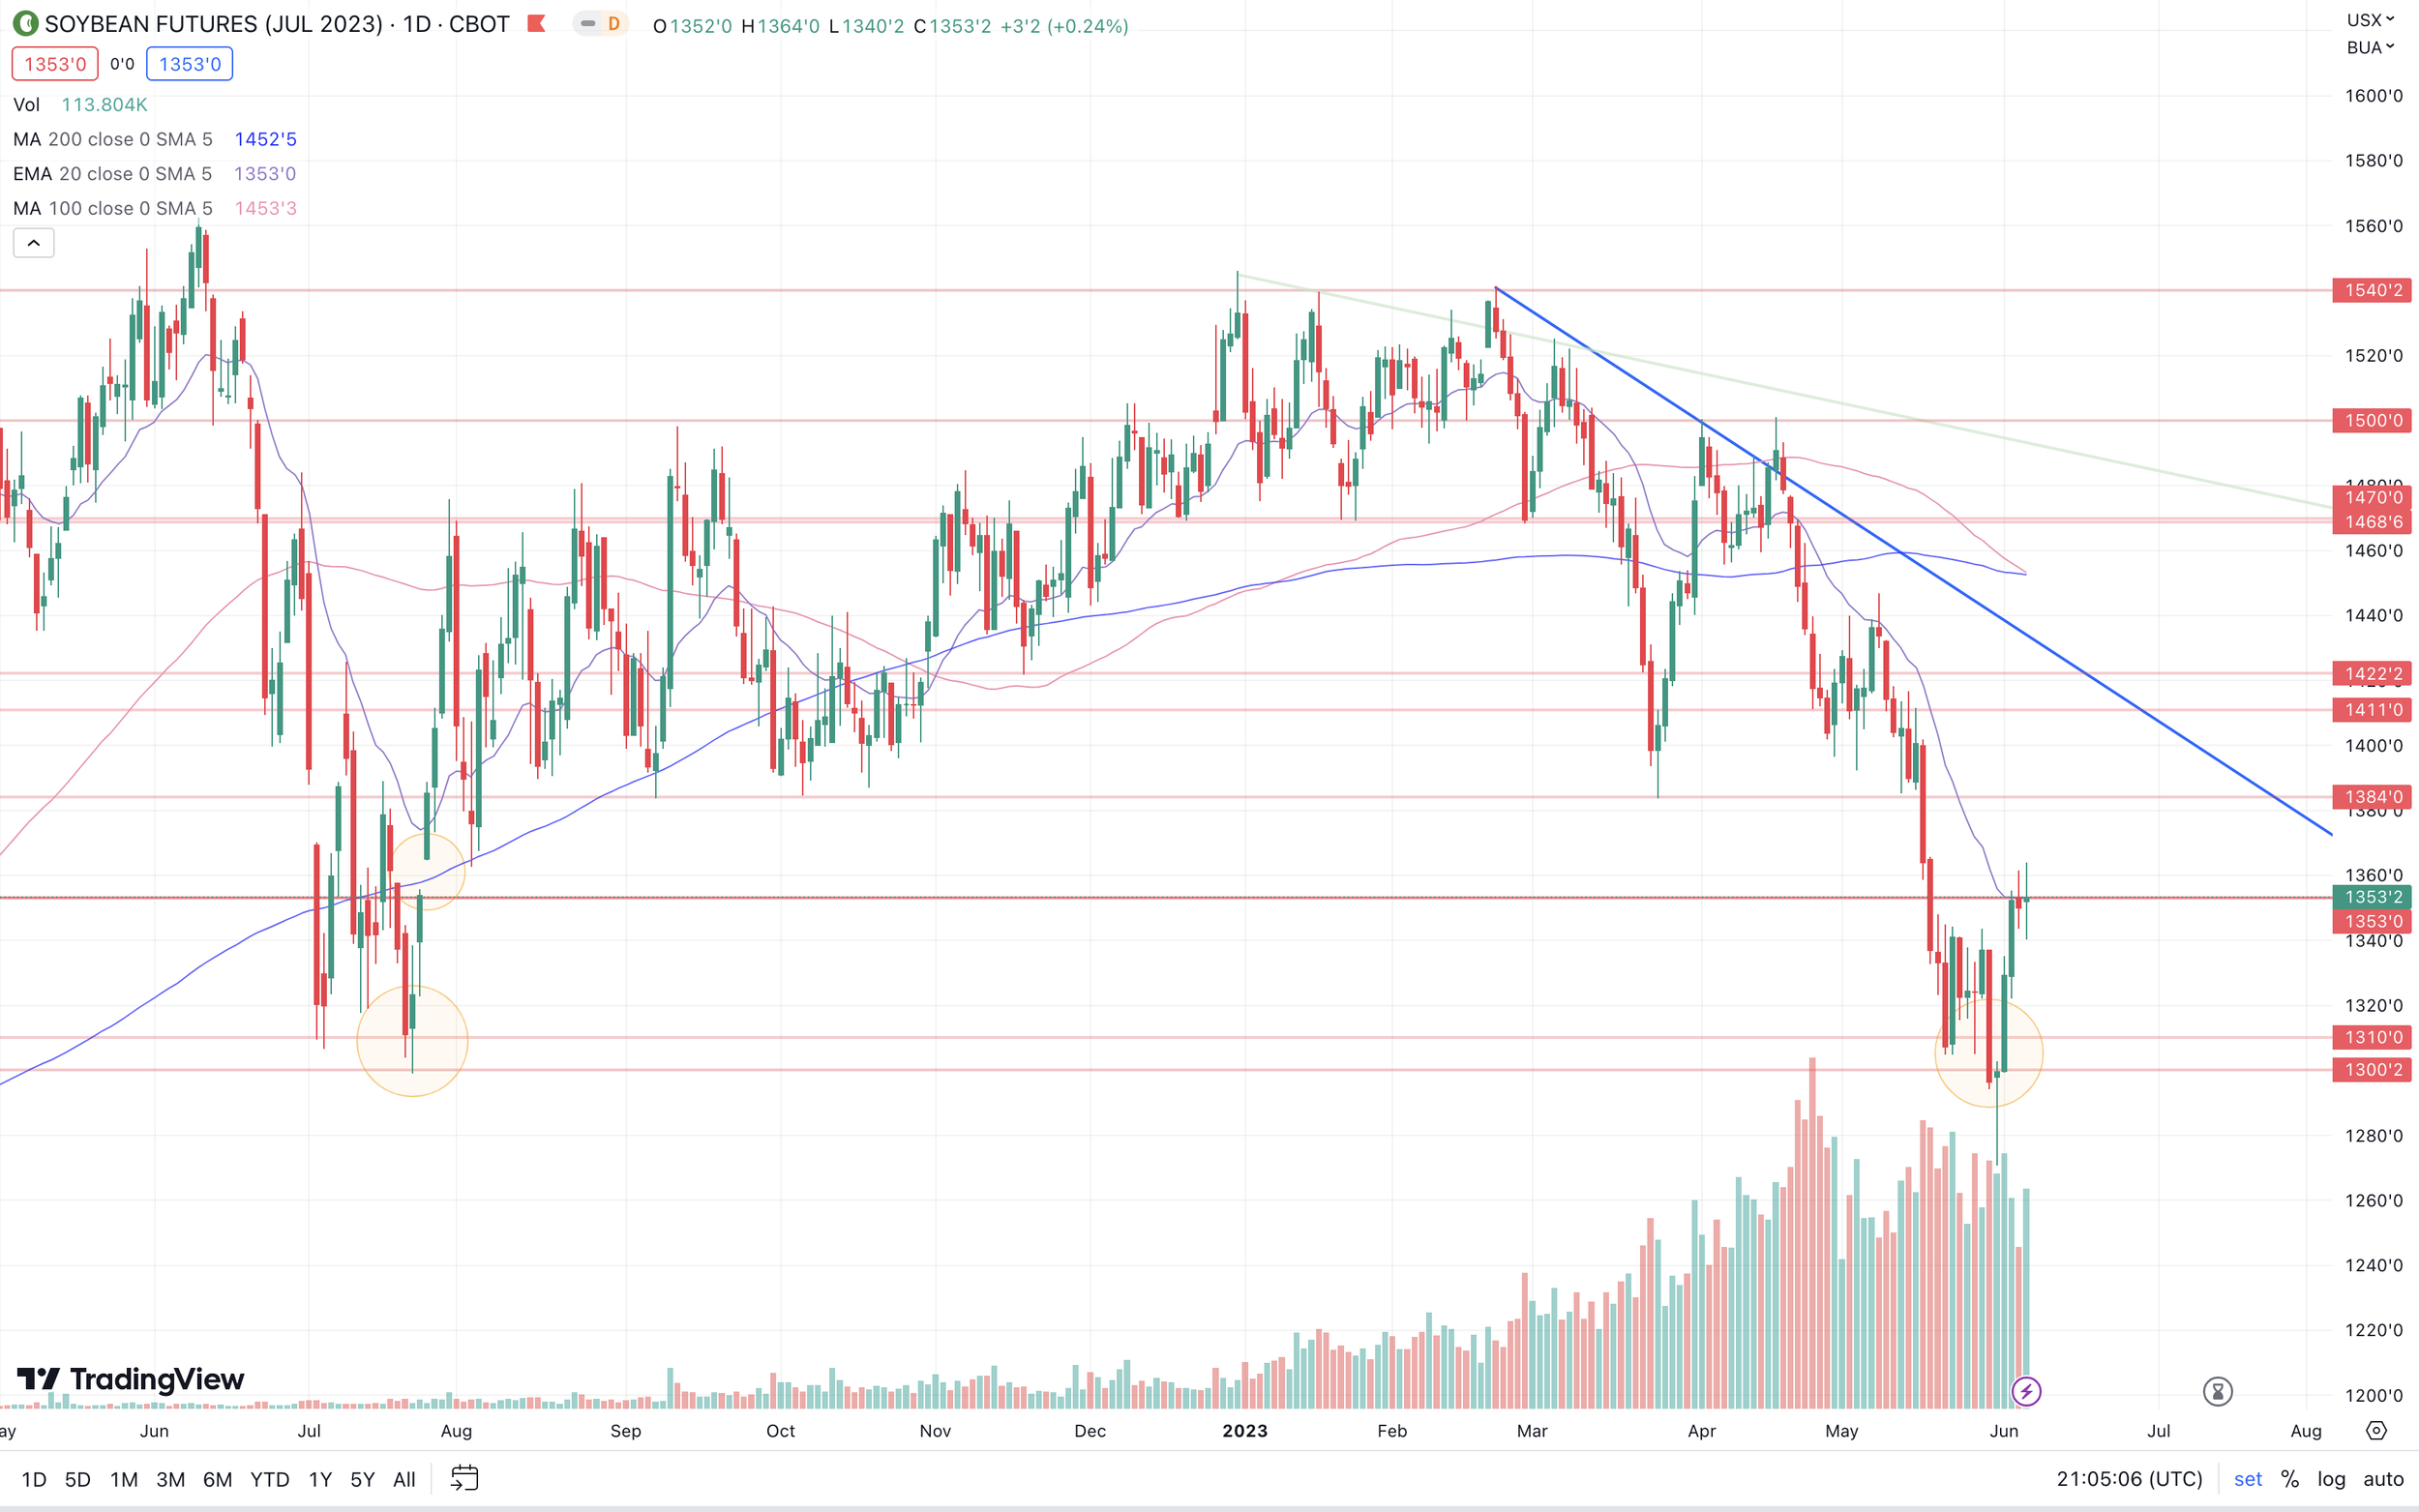
Soybeans 🌱
Similar to corn, our bullish double bottom formation is still intact. Again, I like our chances of going higher but it is all dependent on weather here for the most part.
Soybeans July-23
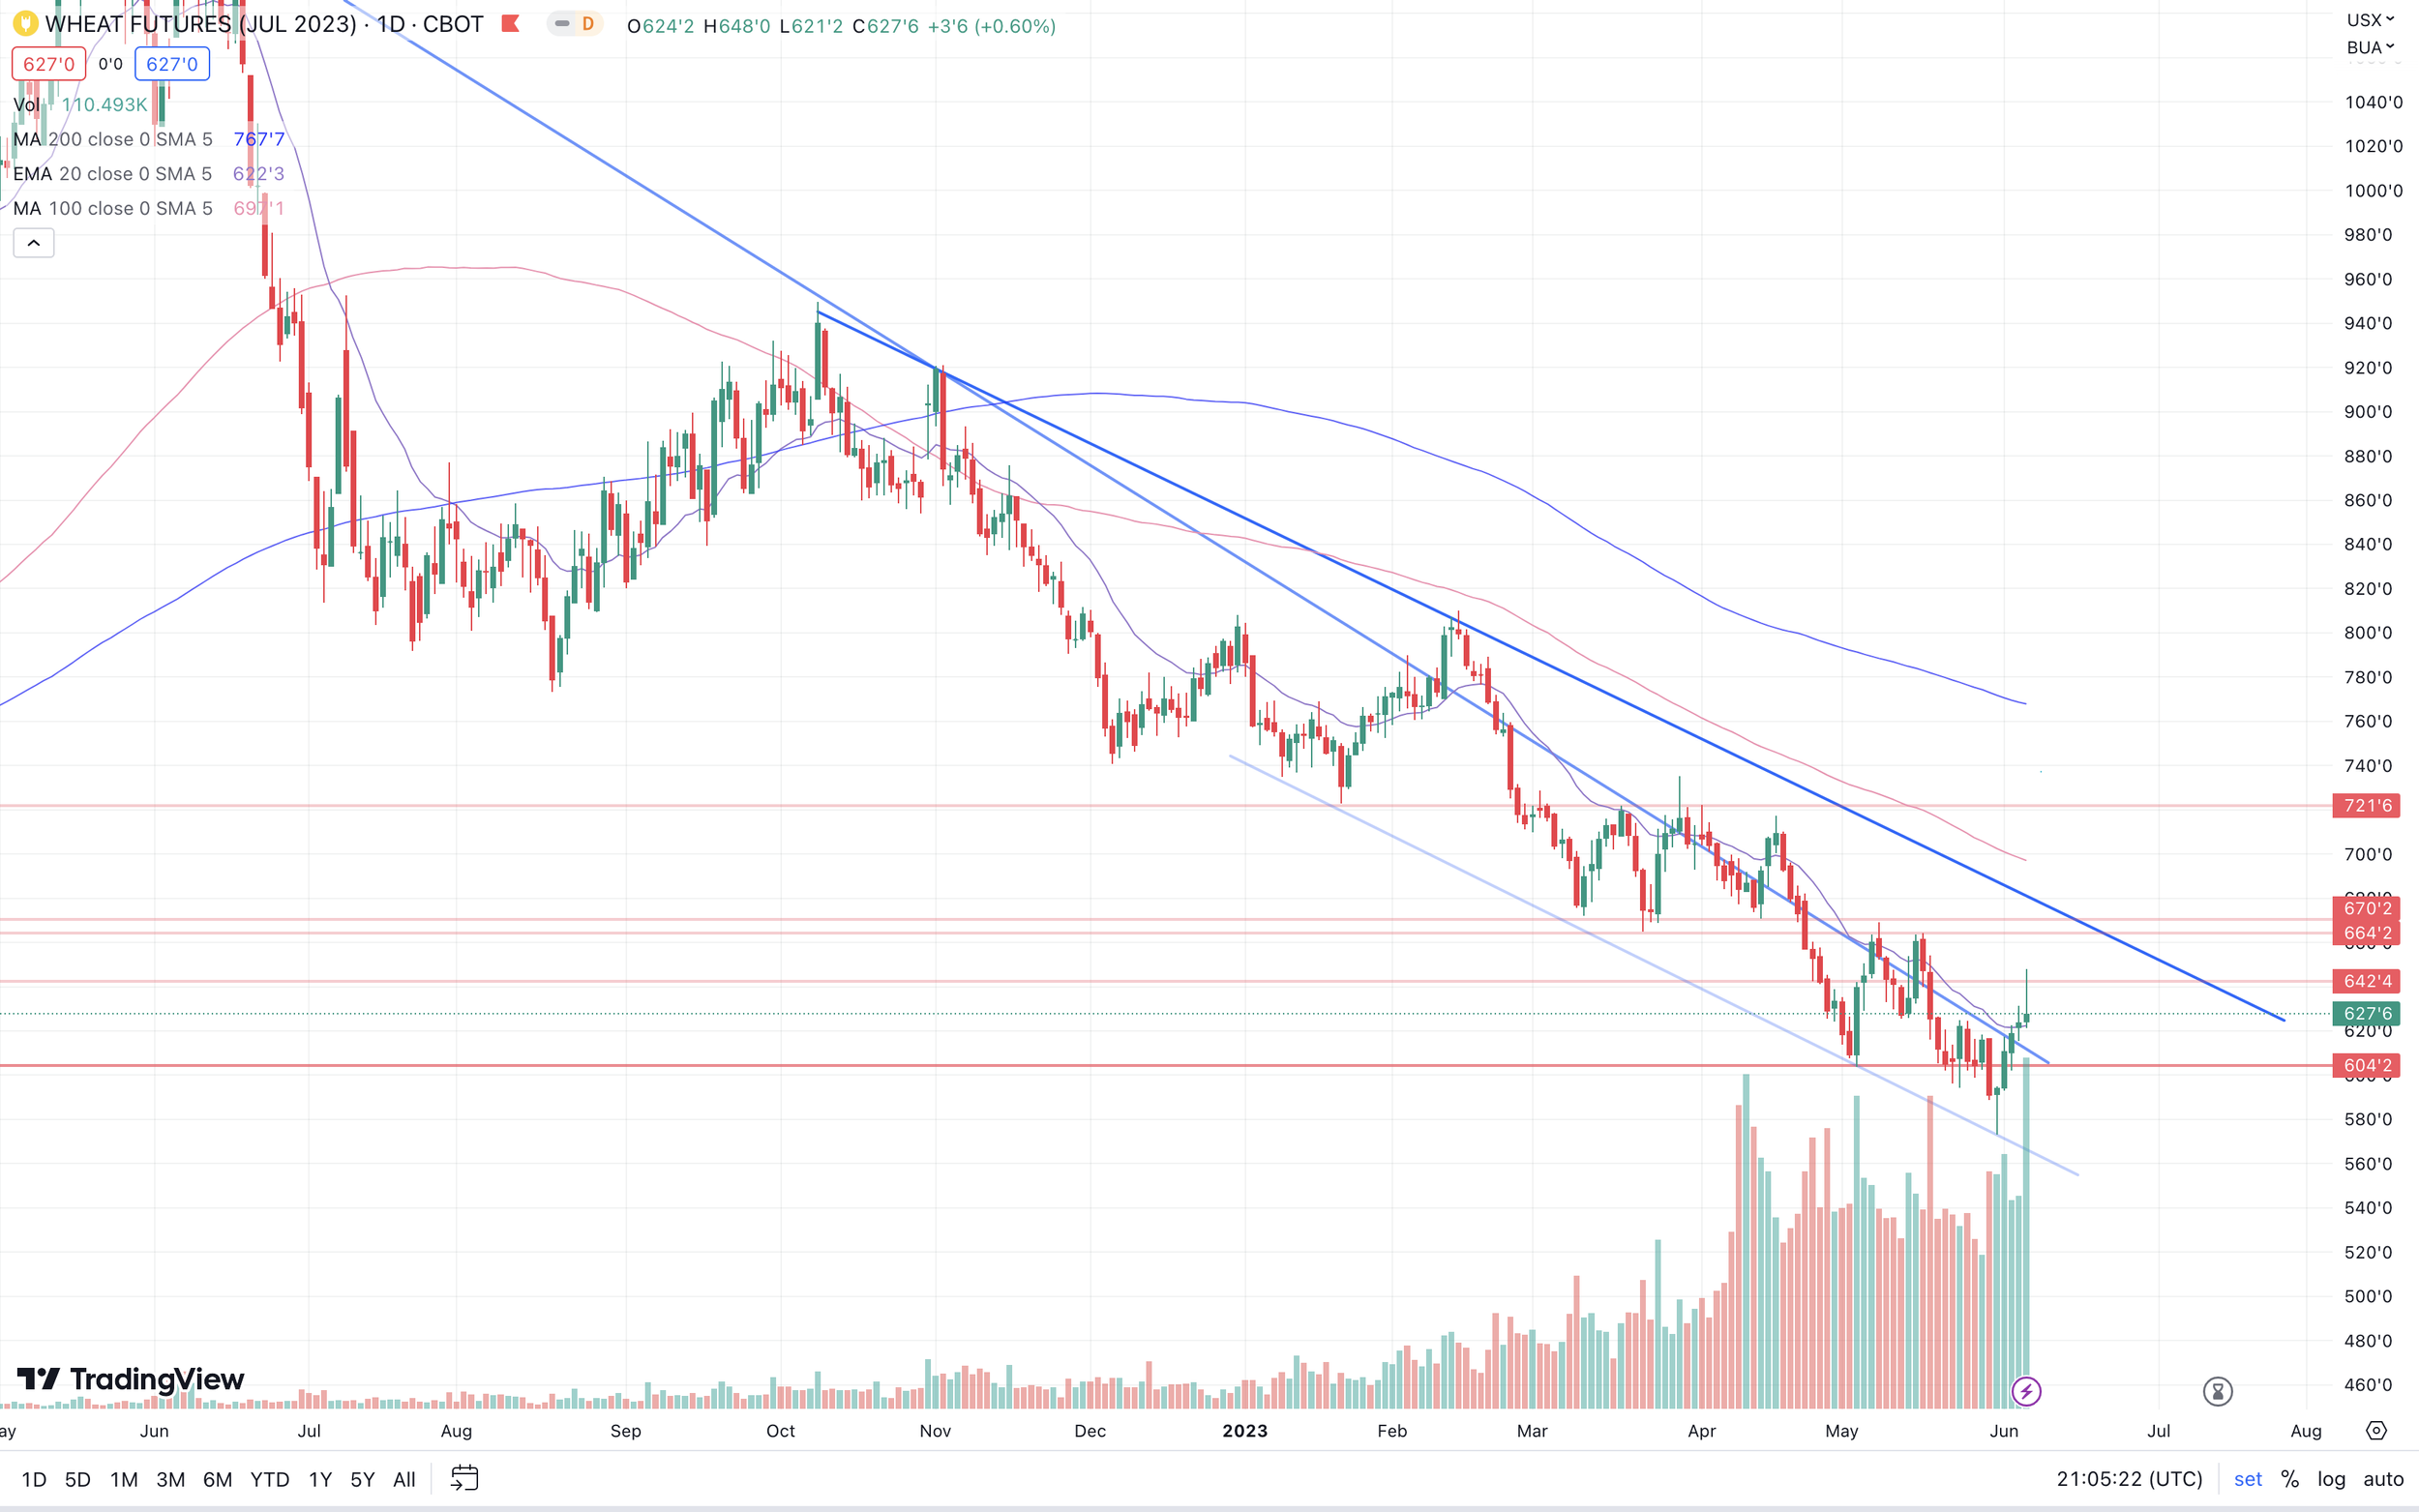
Wheat 🌾
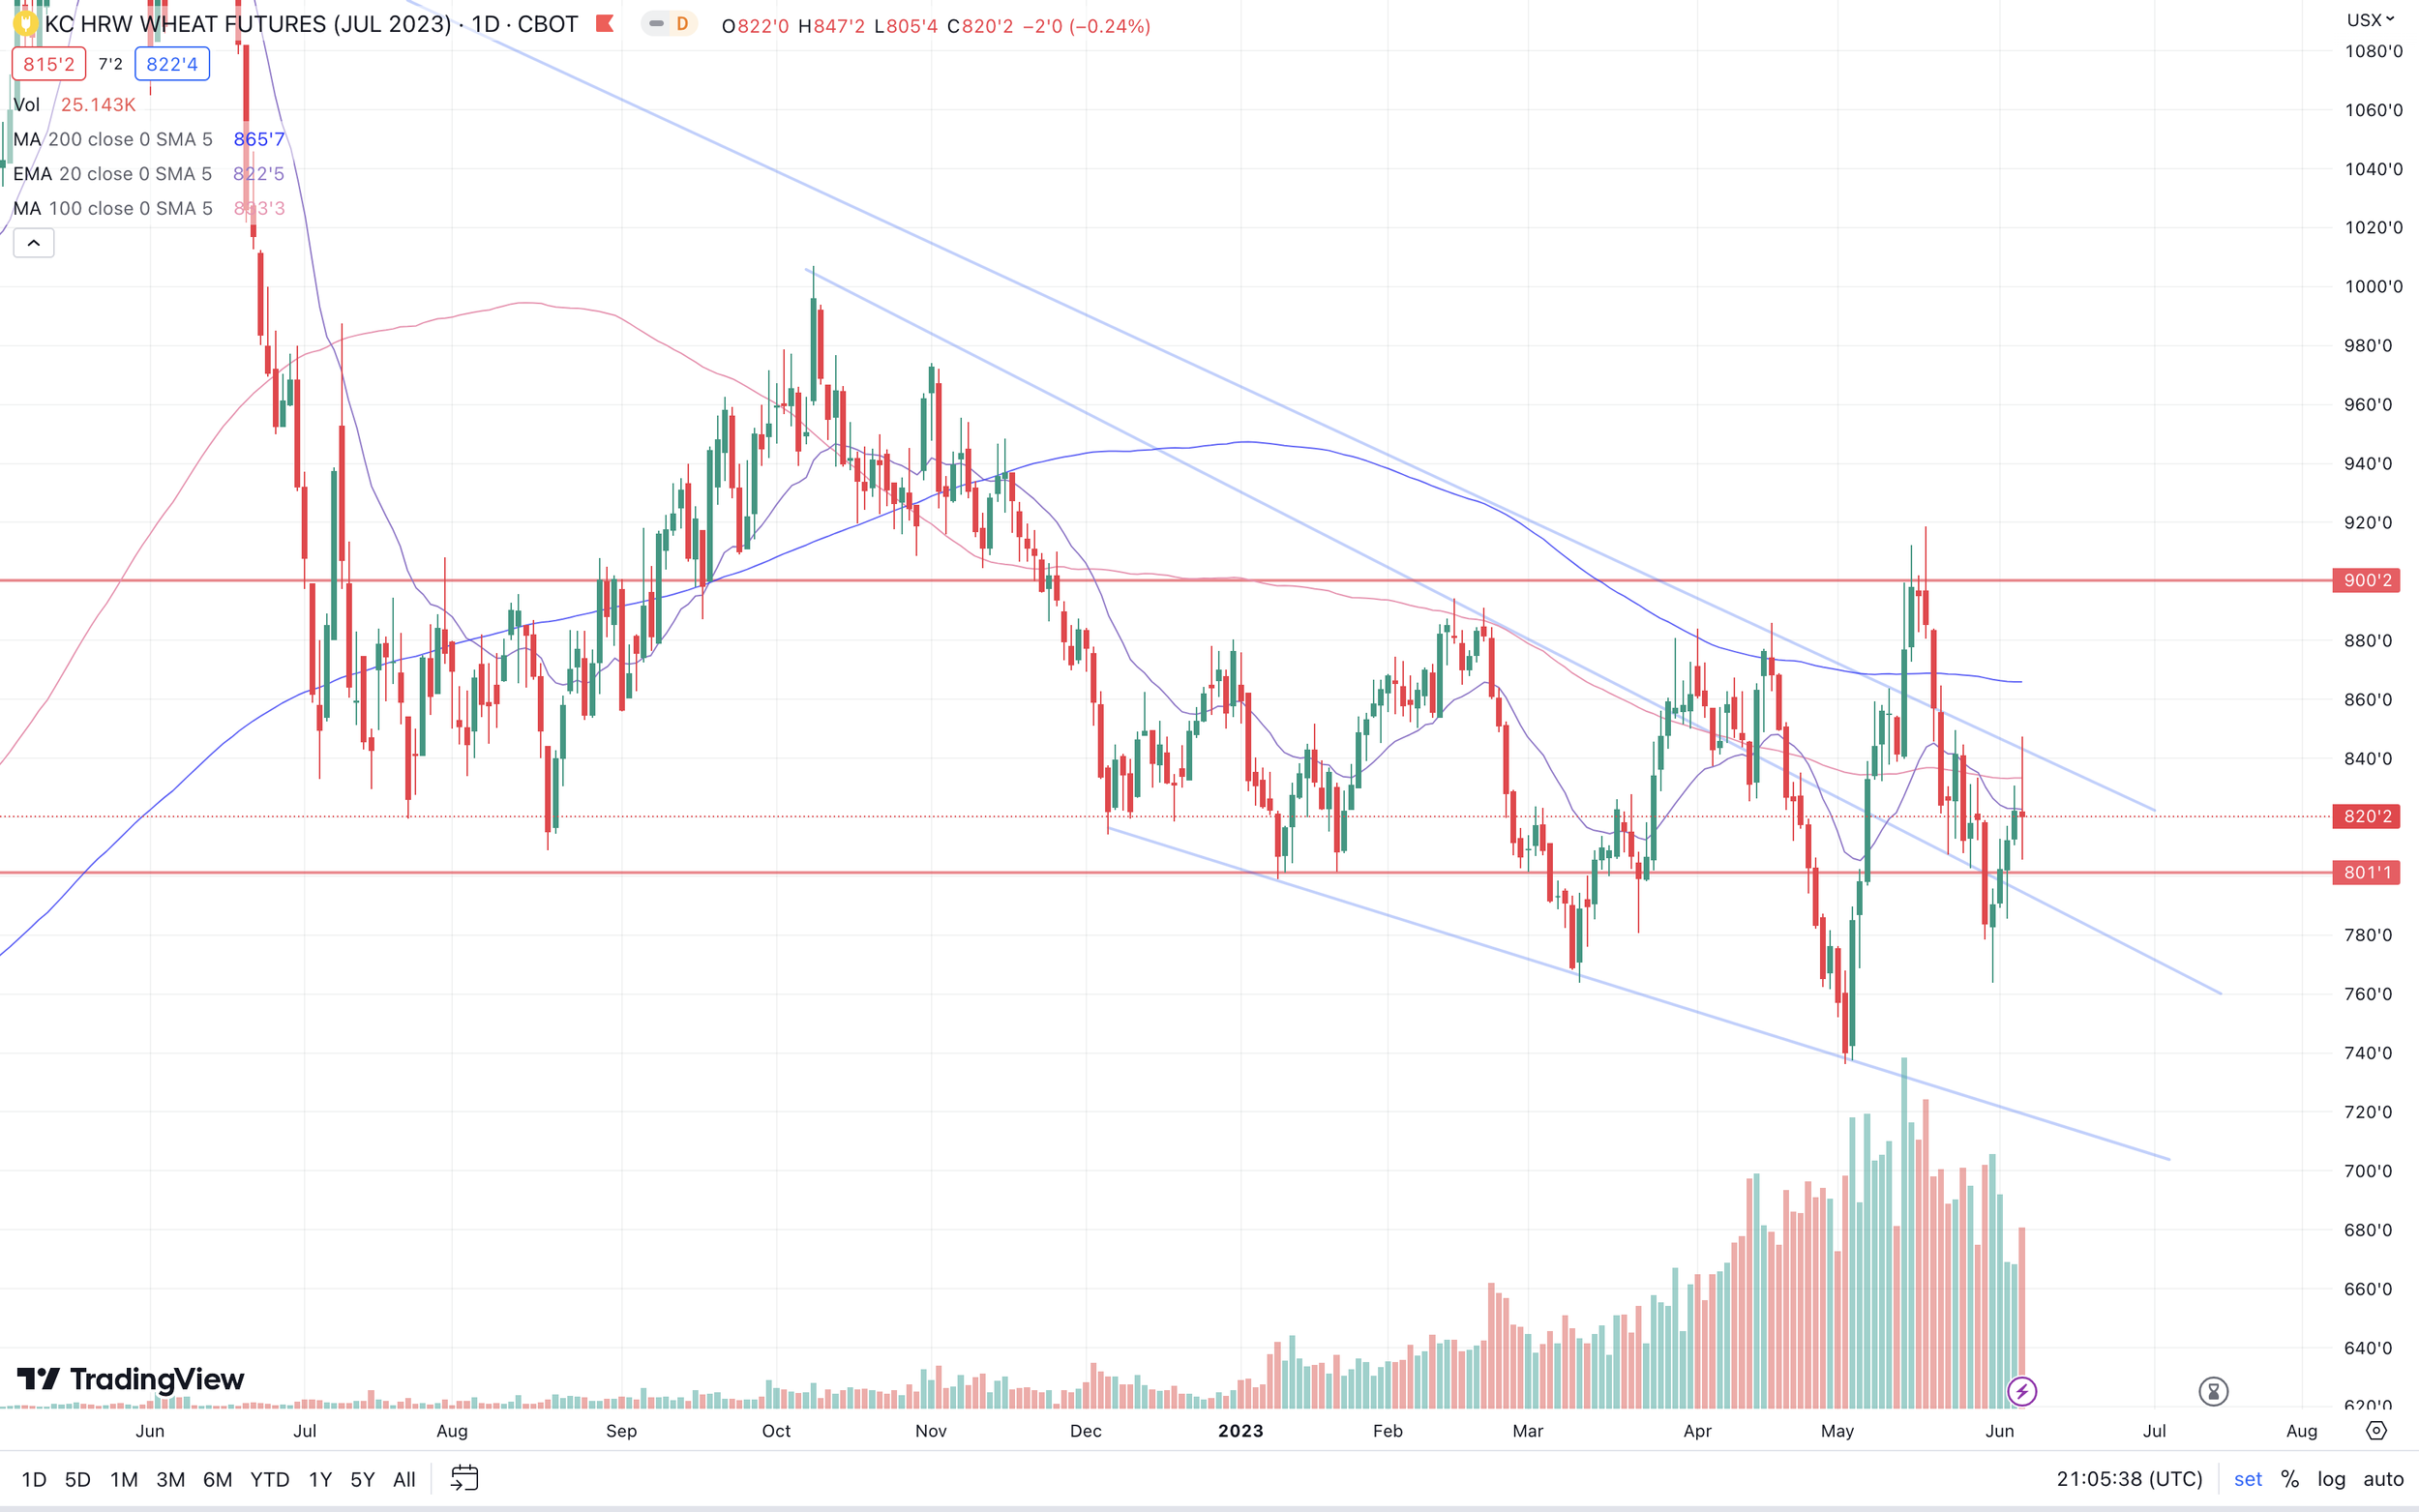
On July Chicago we are again testing the waters above that magic downward trendline. We need another solid day or two to confirm a break out, otherwise we could potential be looking at another bull trap.
Chicago July-23
KC July-23
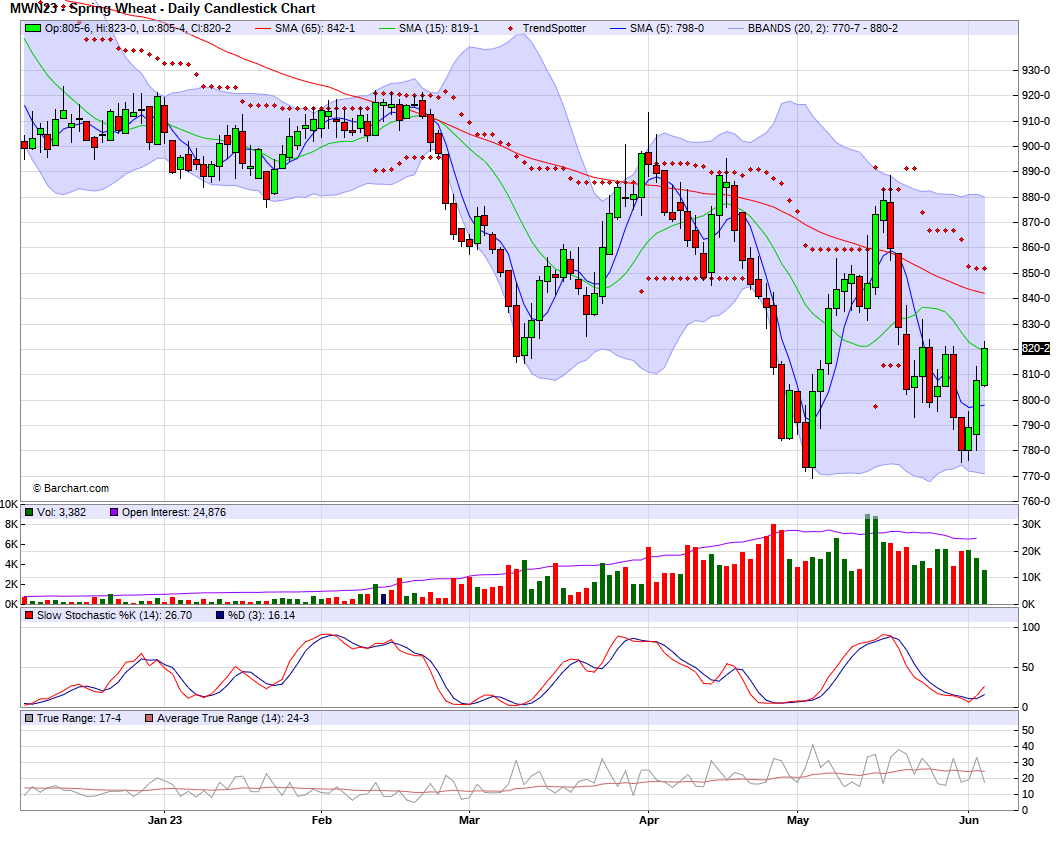
MPLS July-23
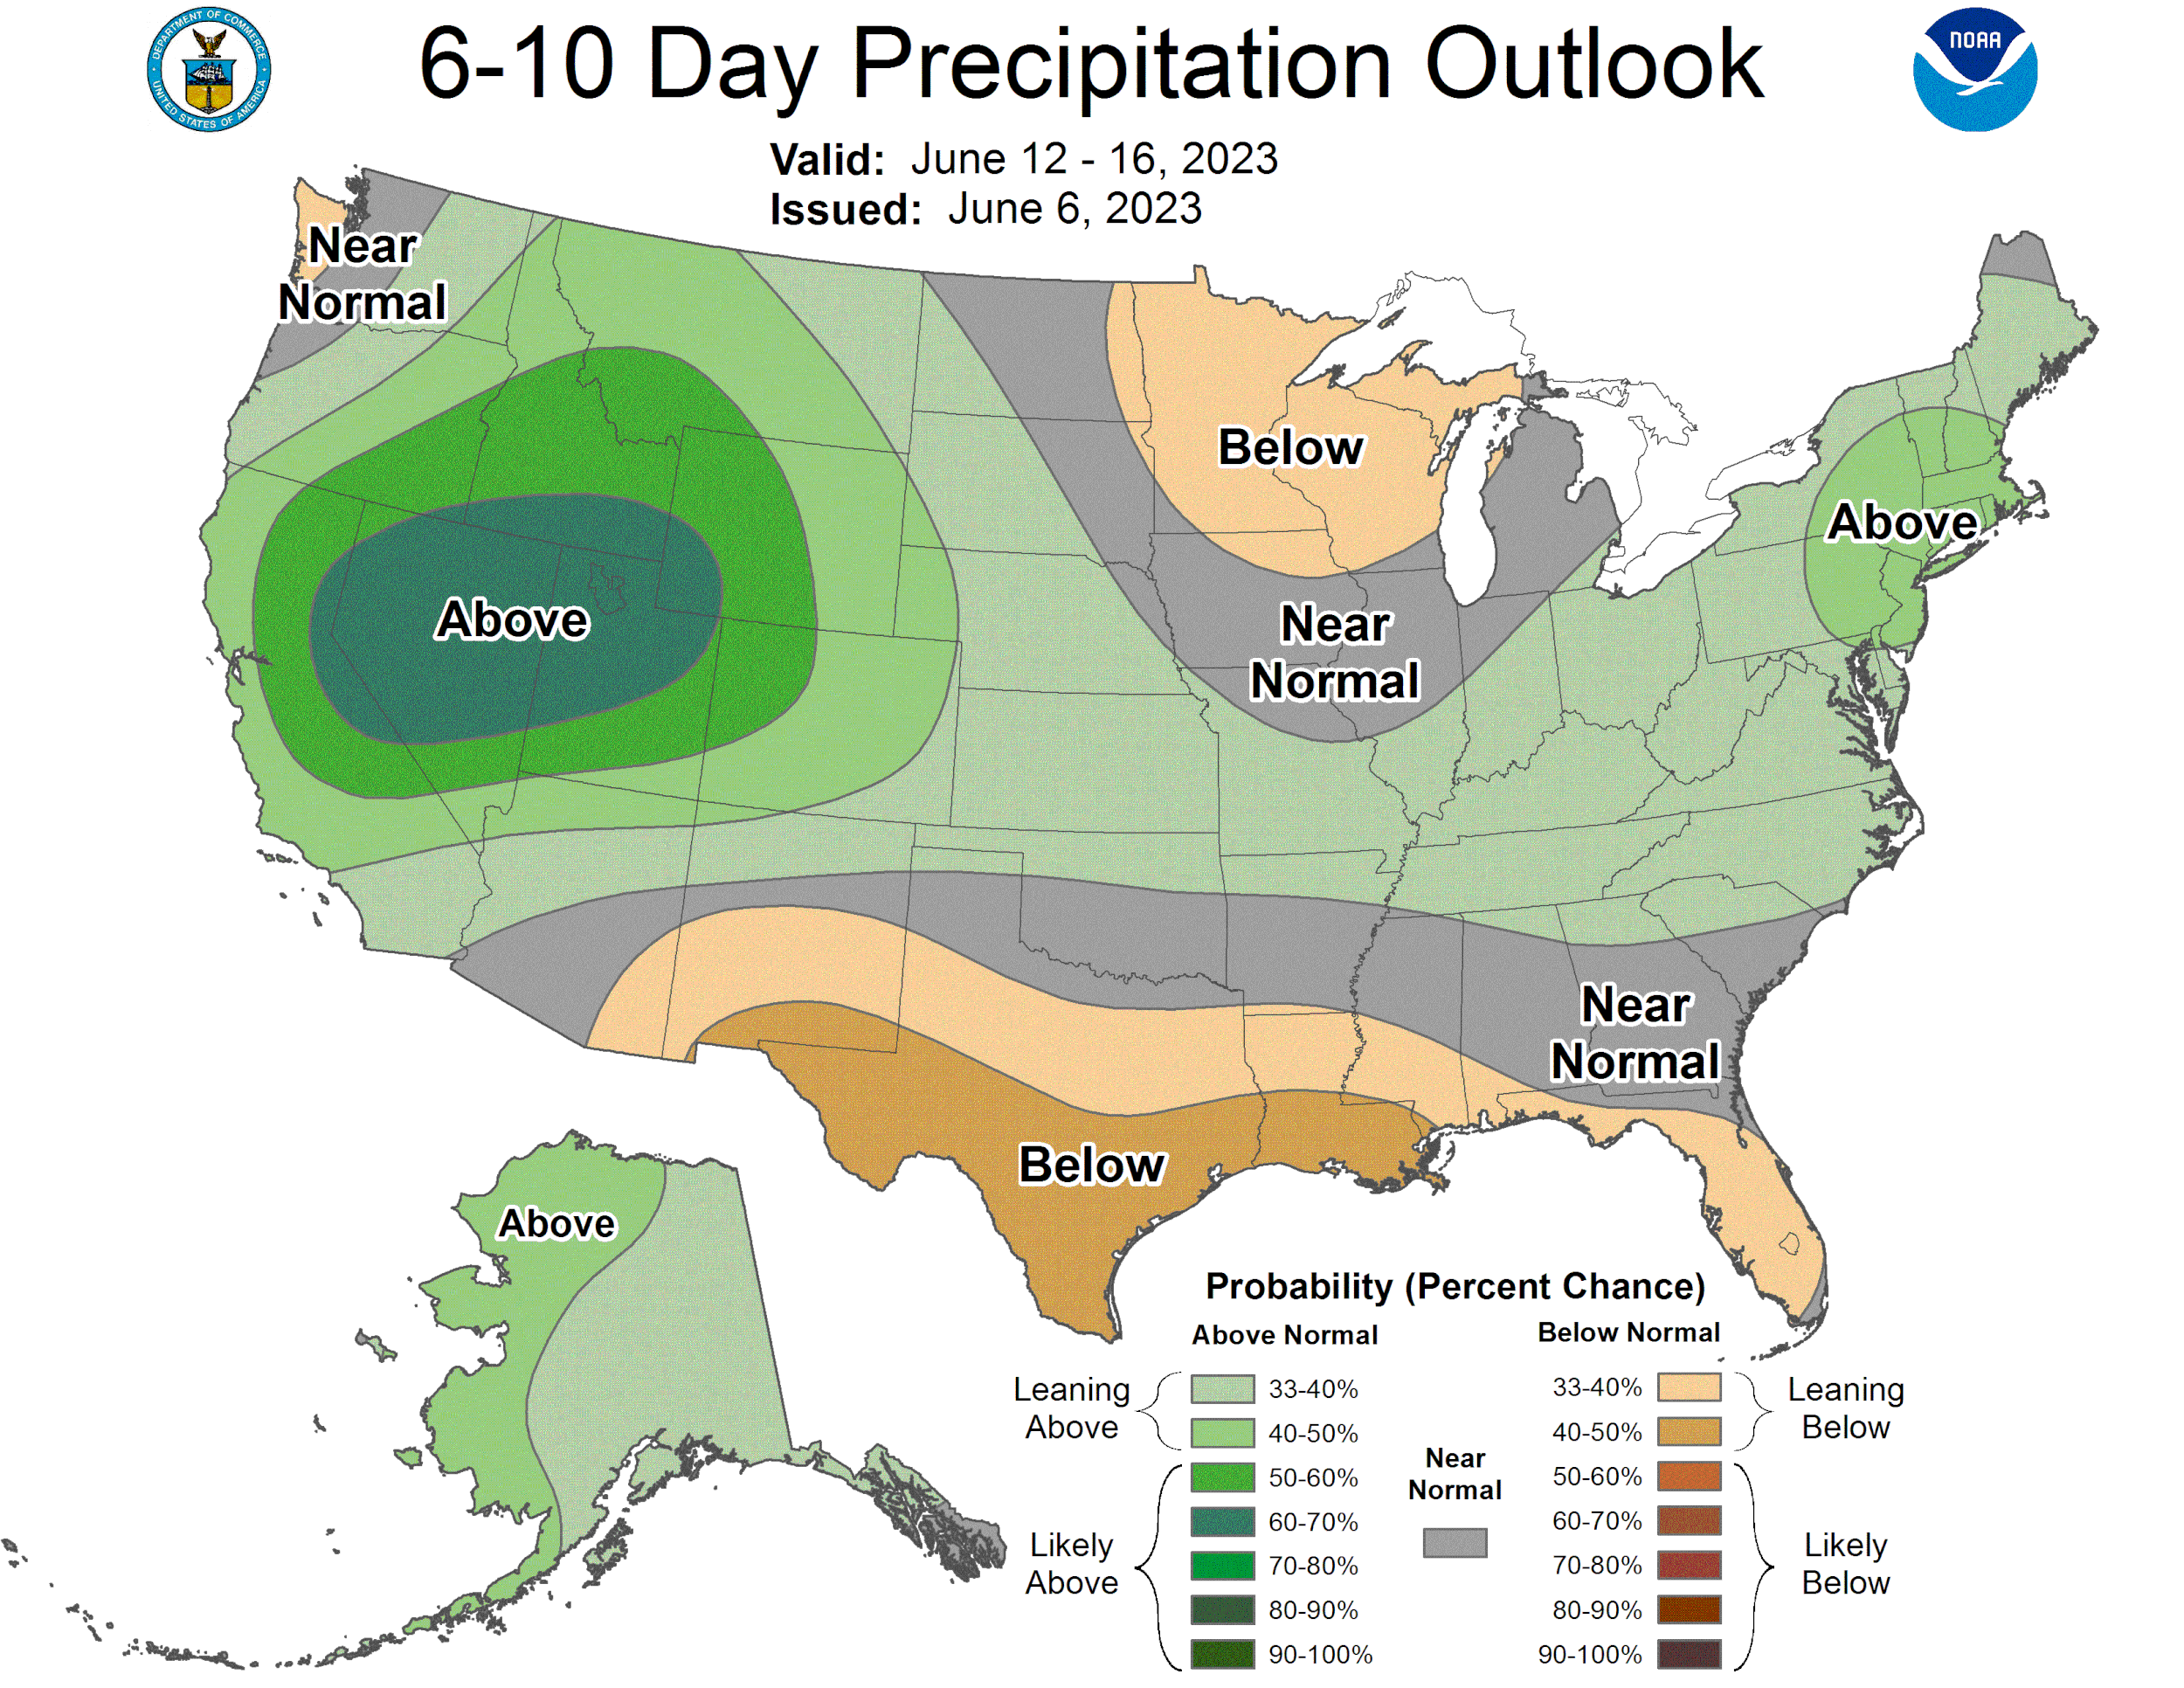
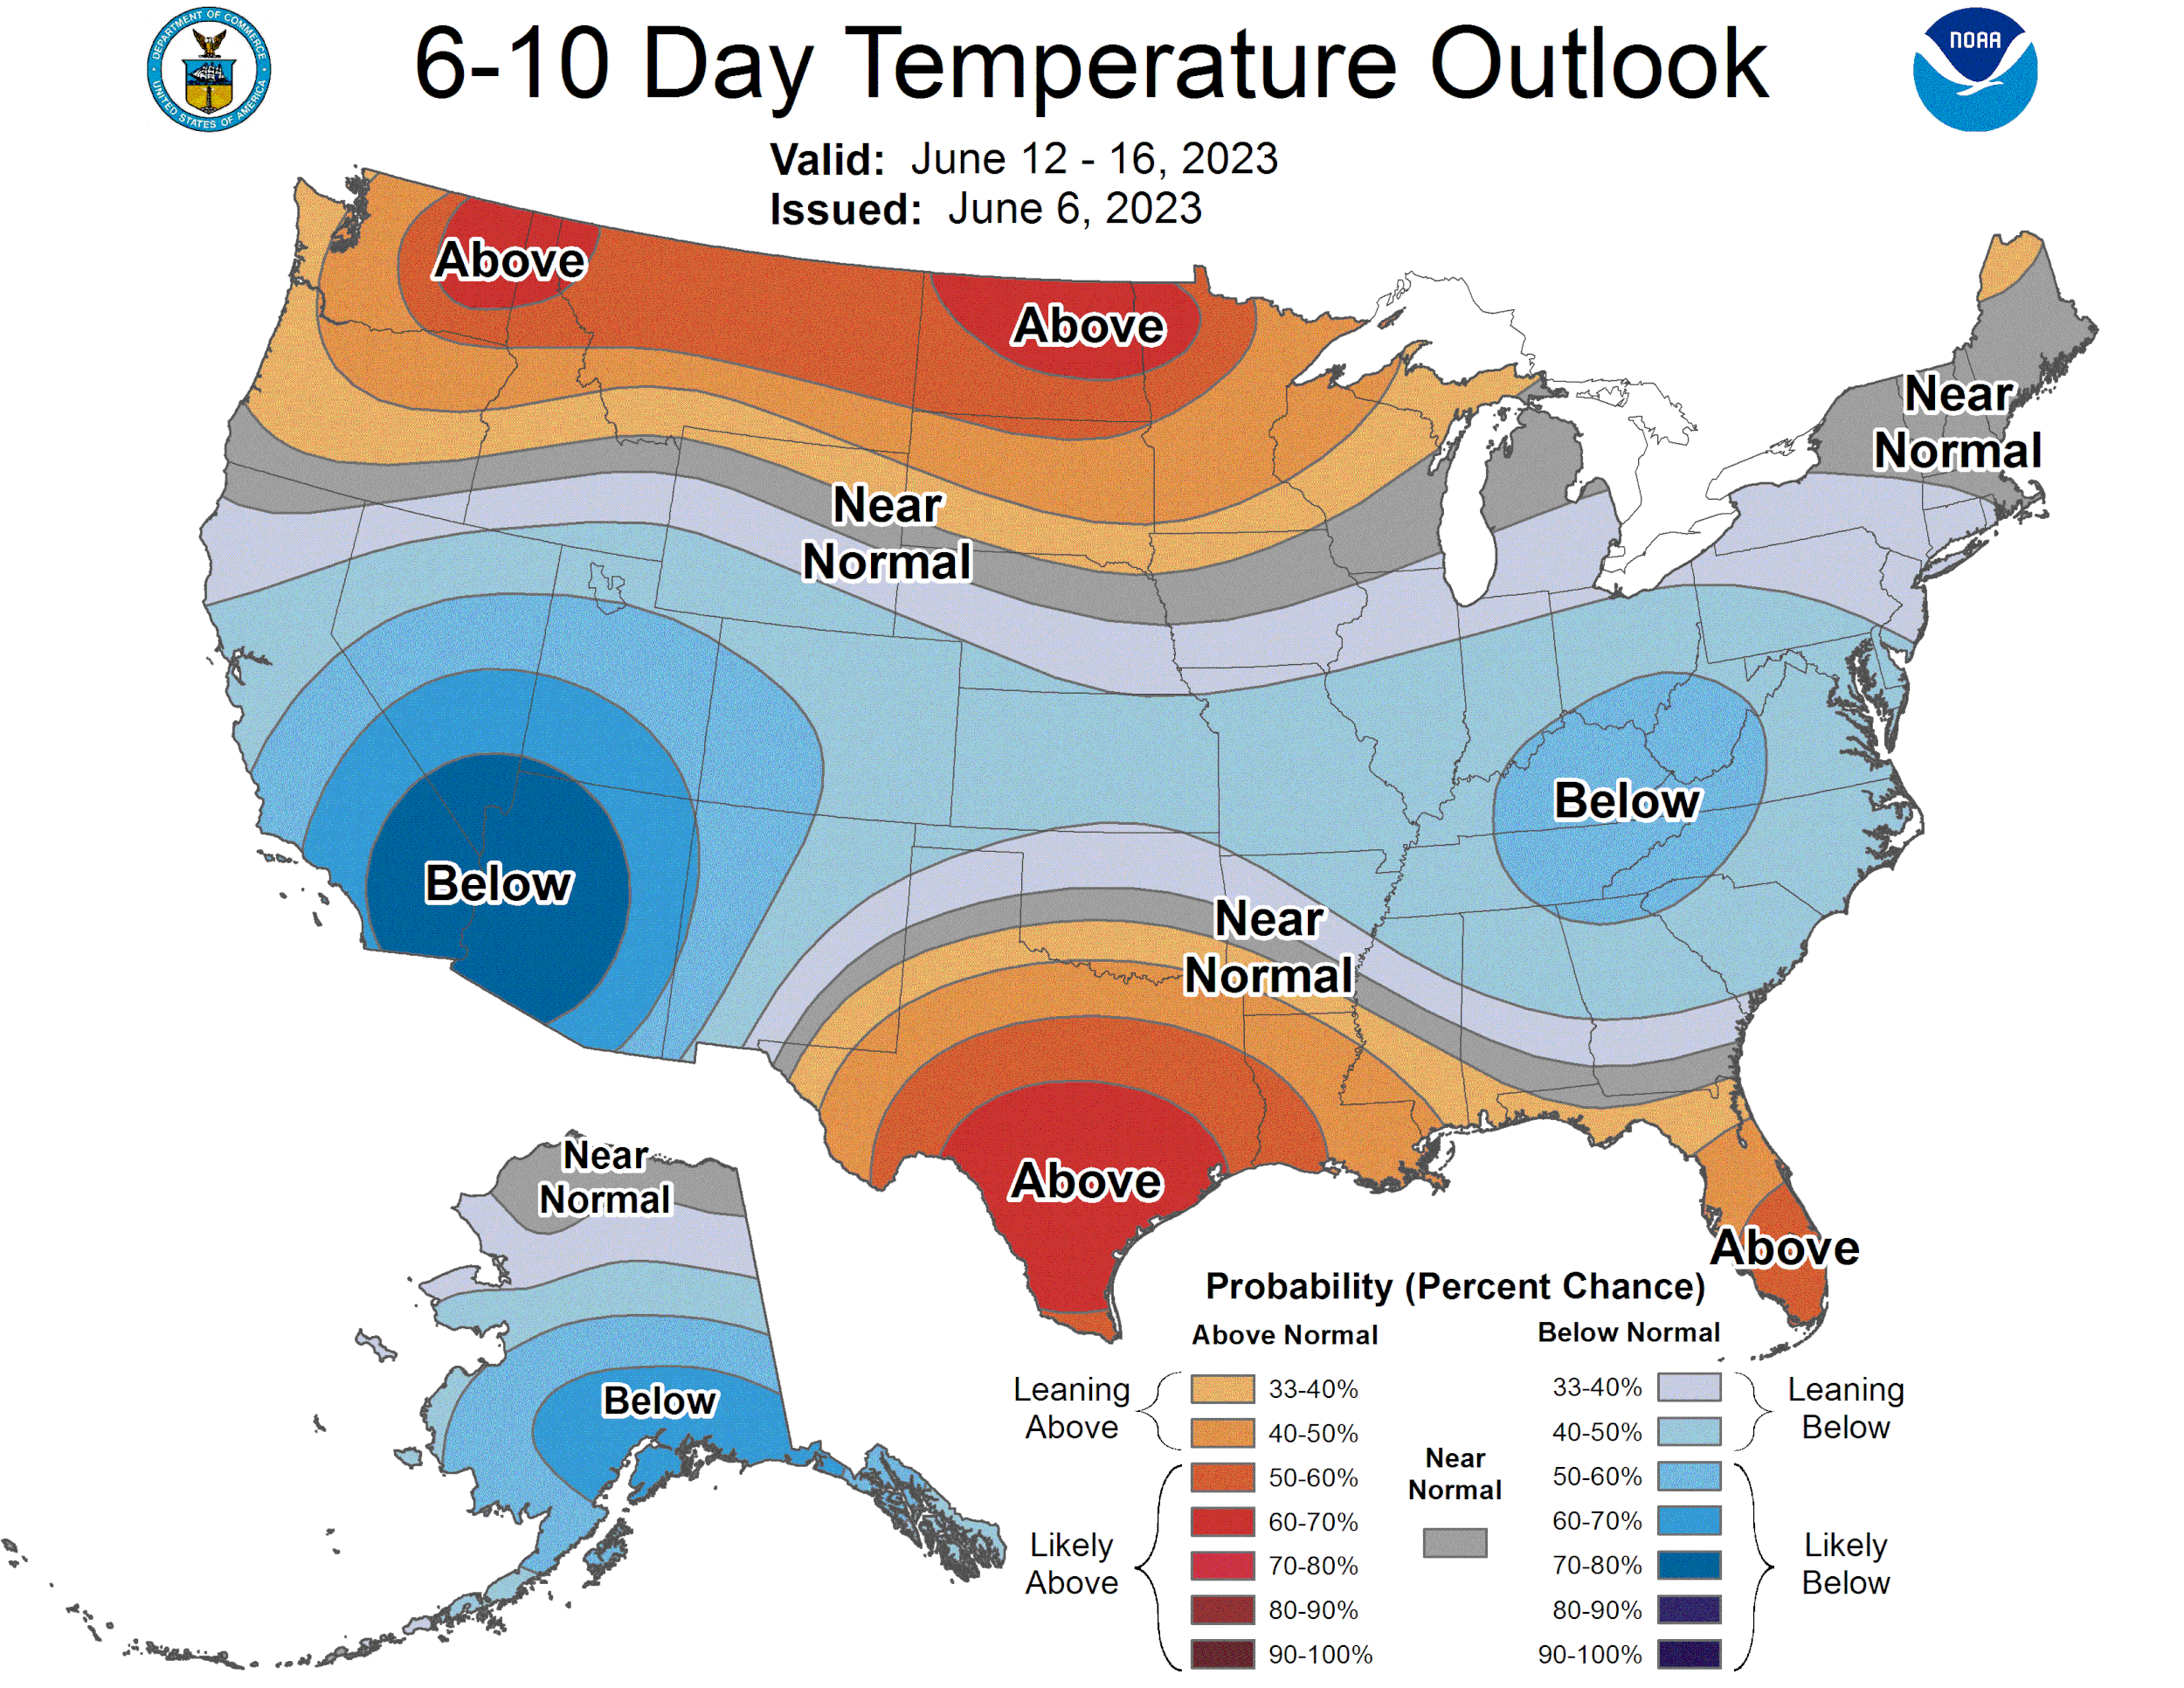
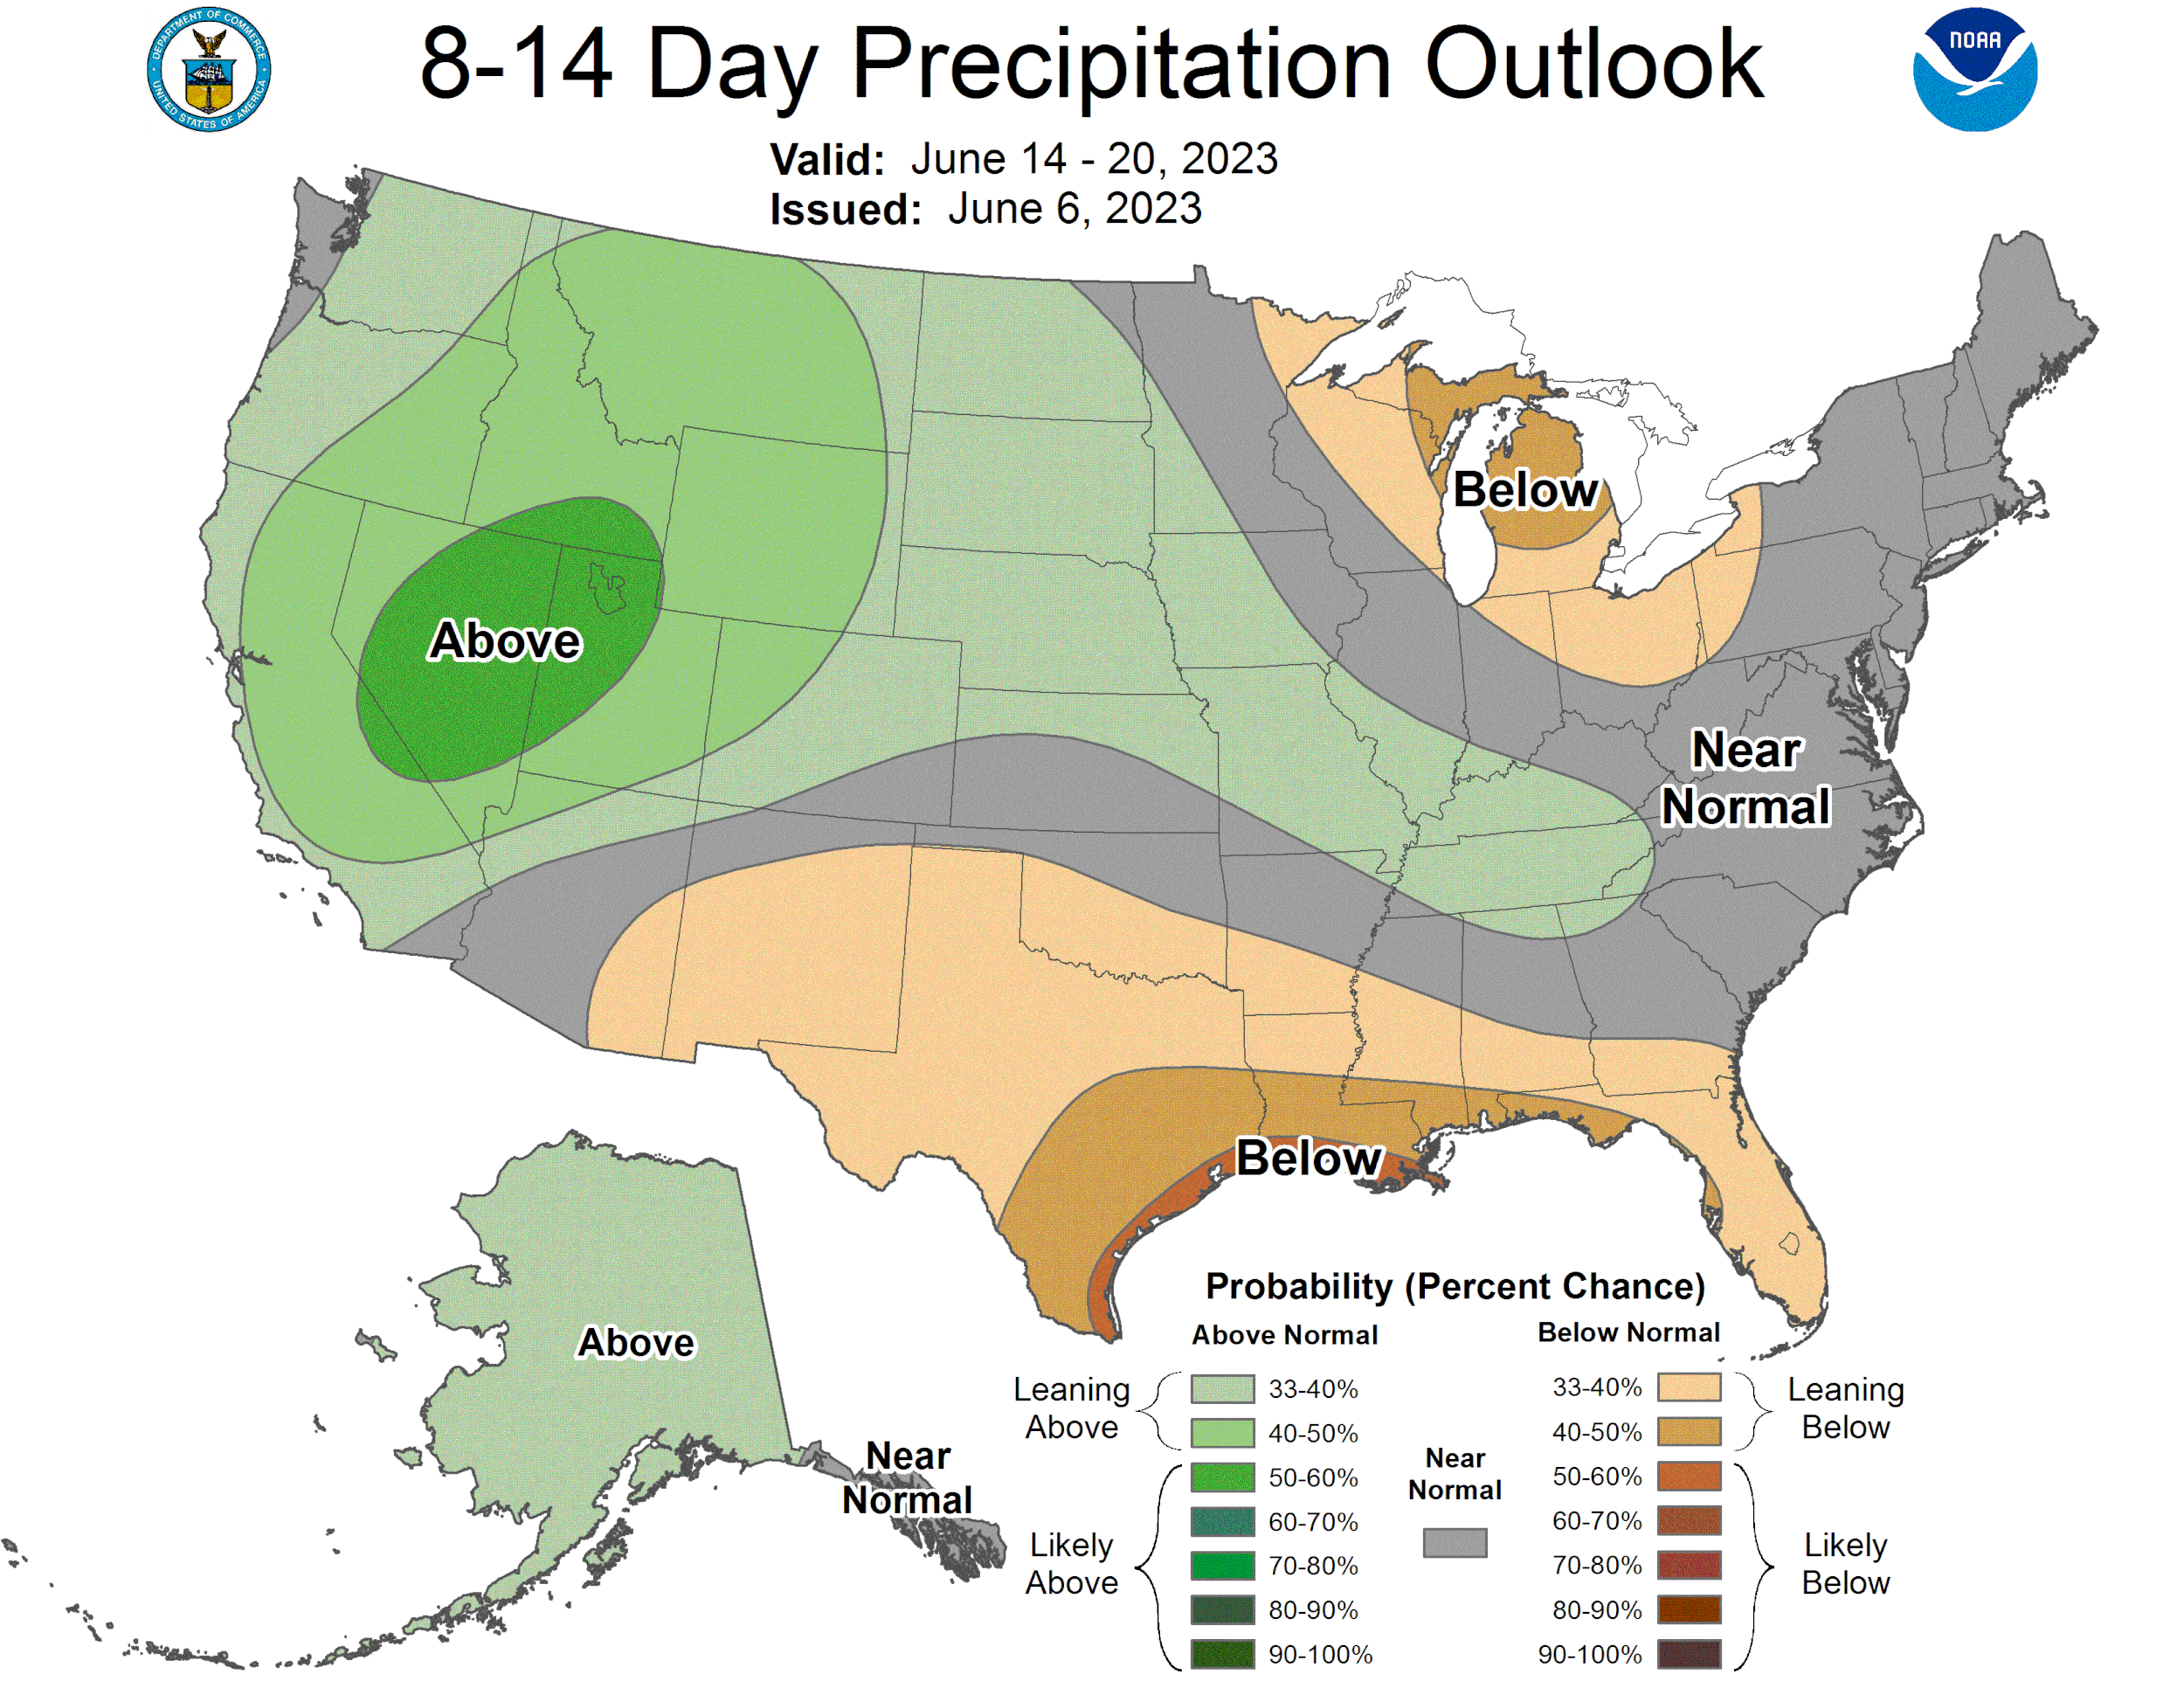
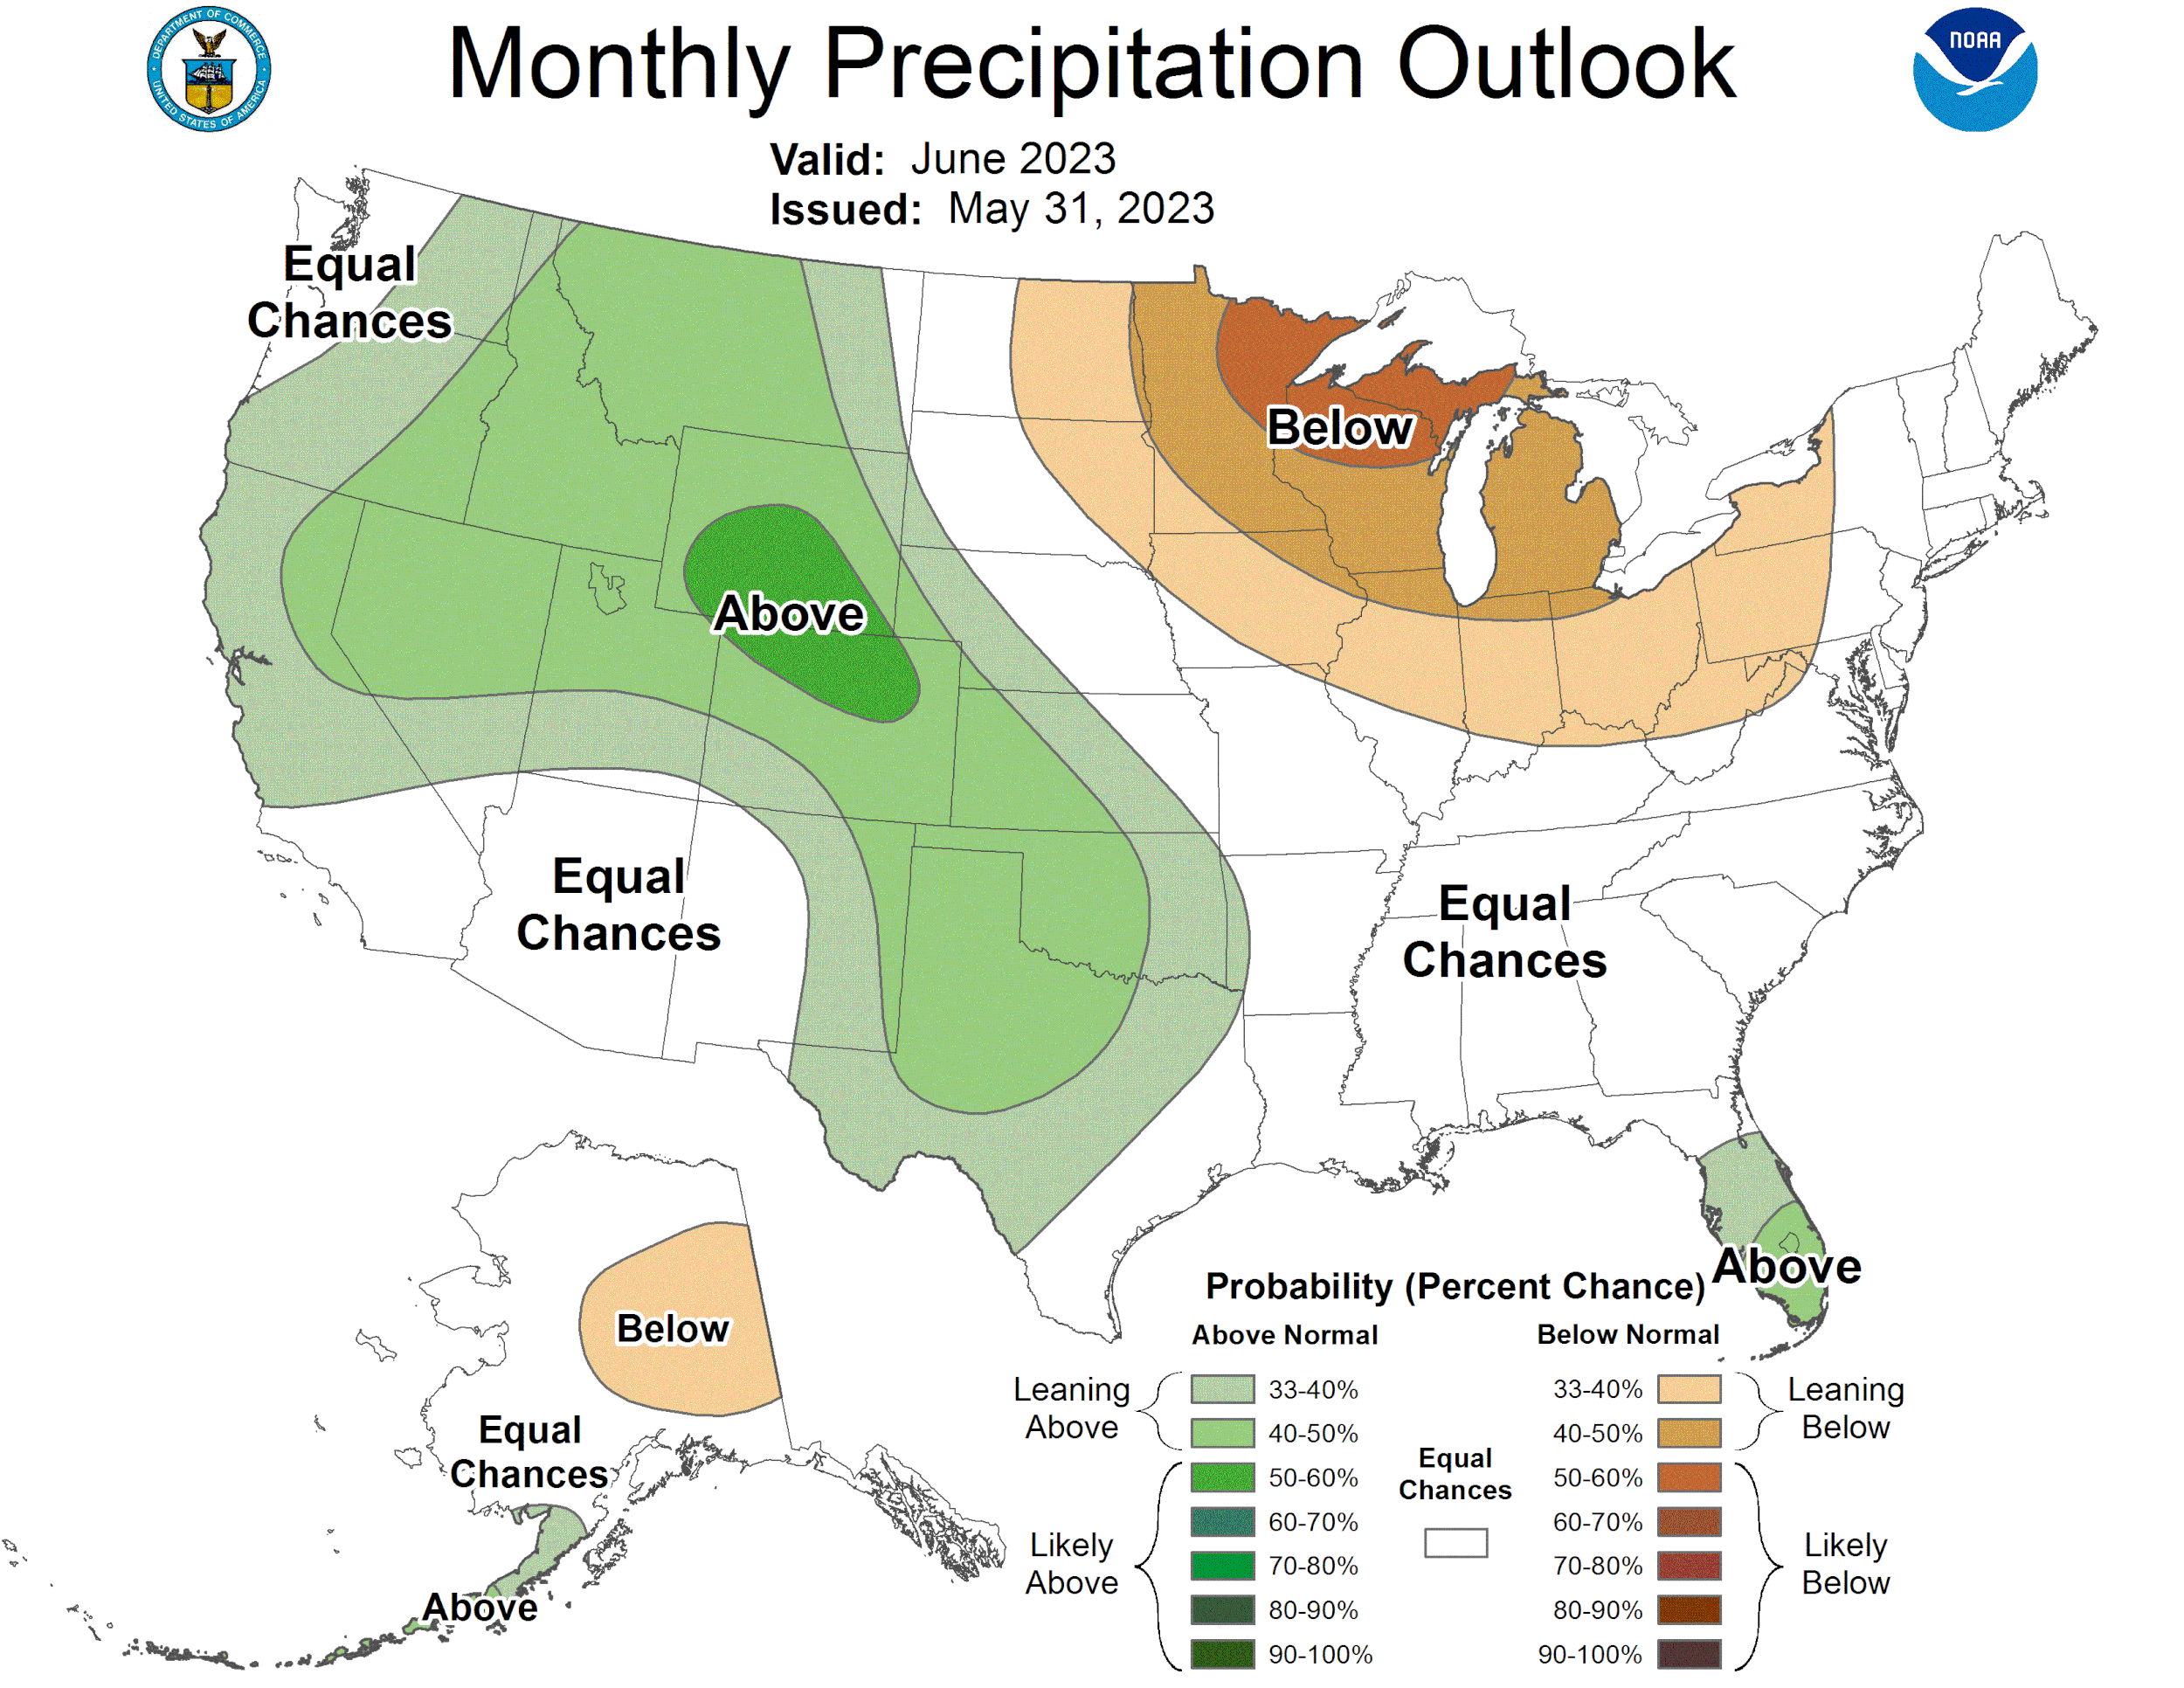
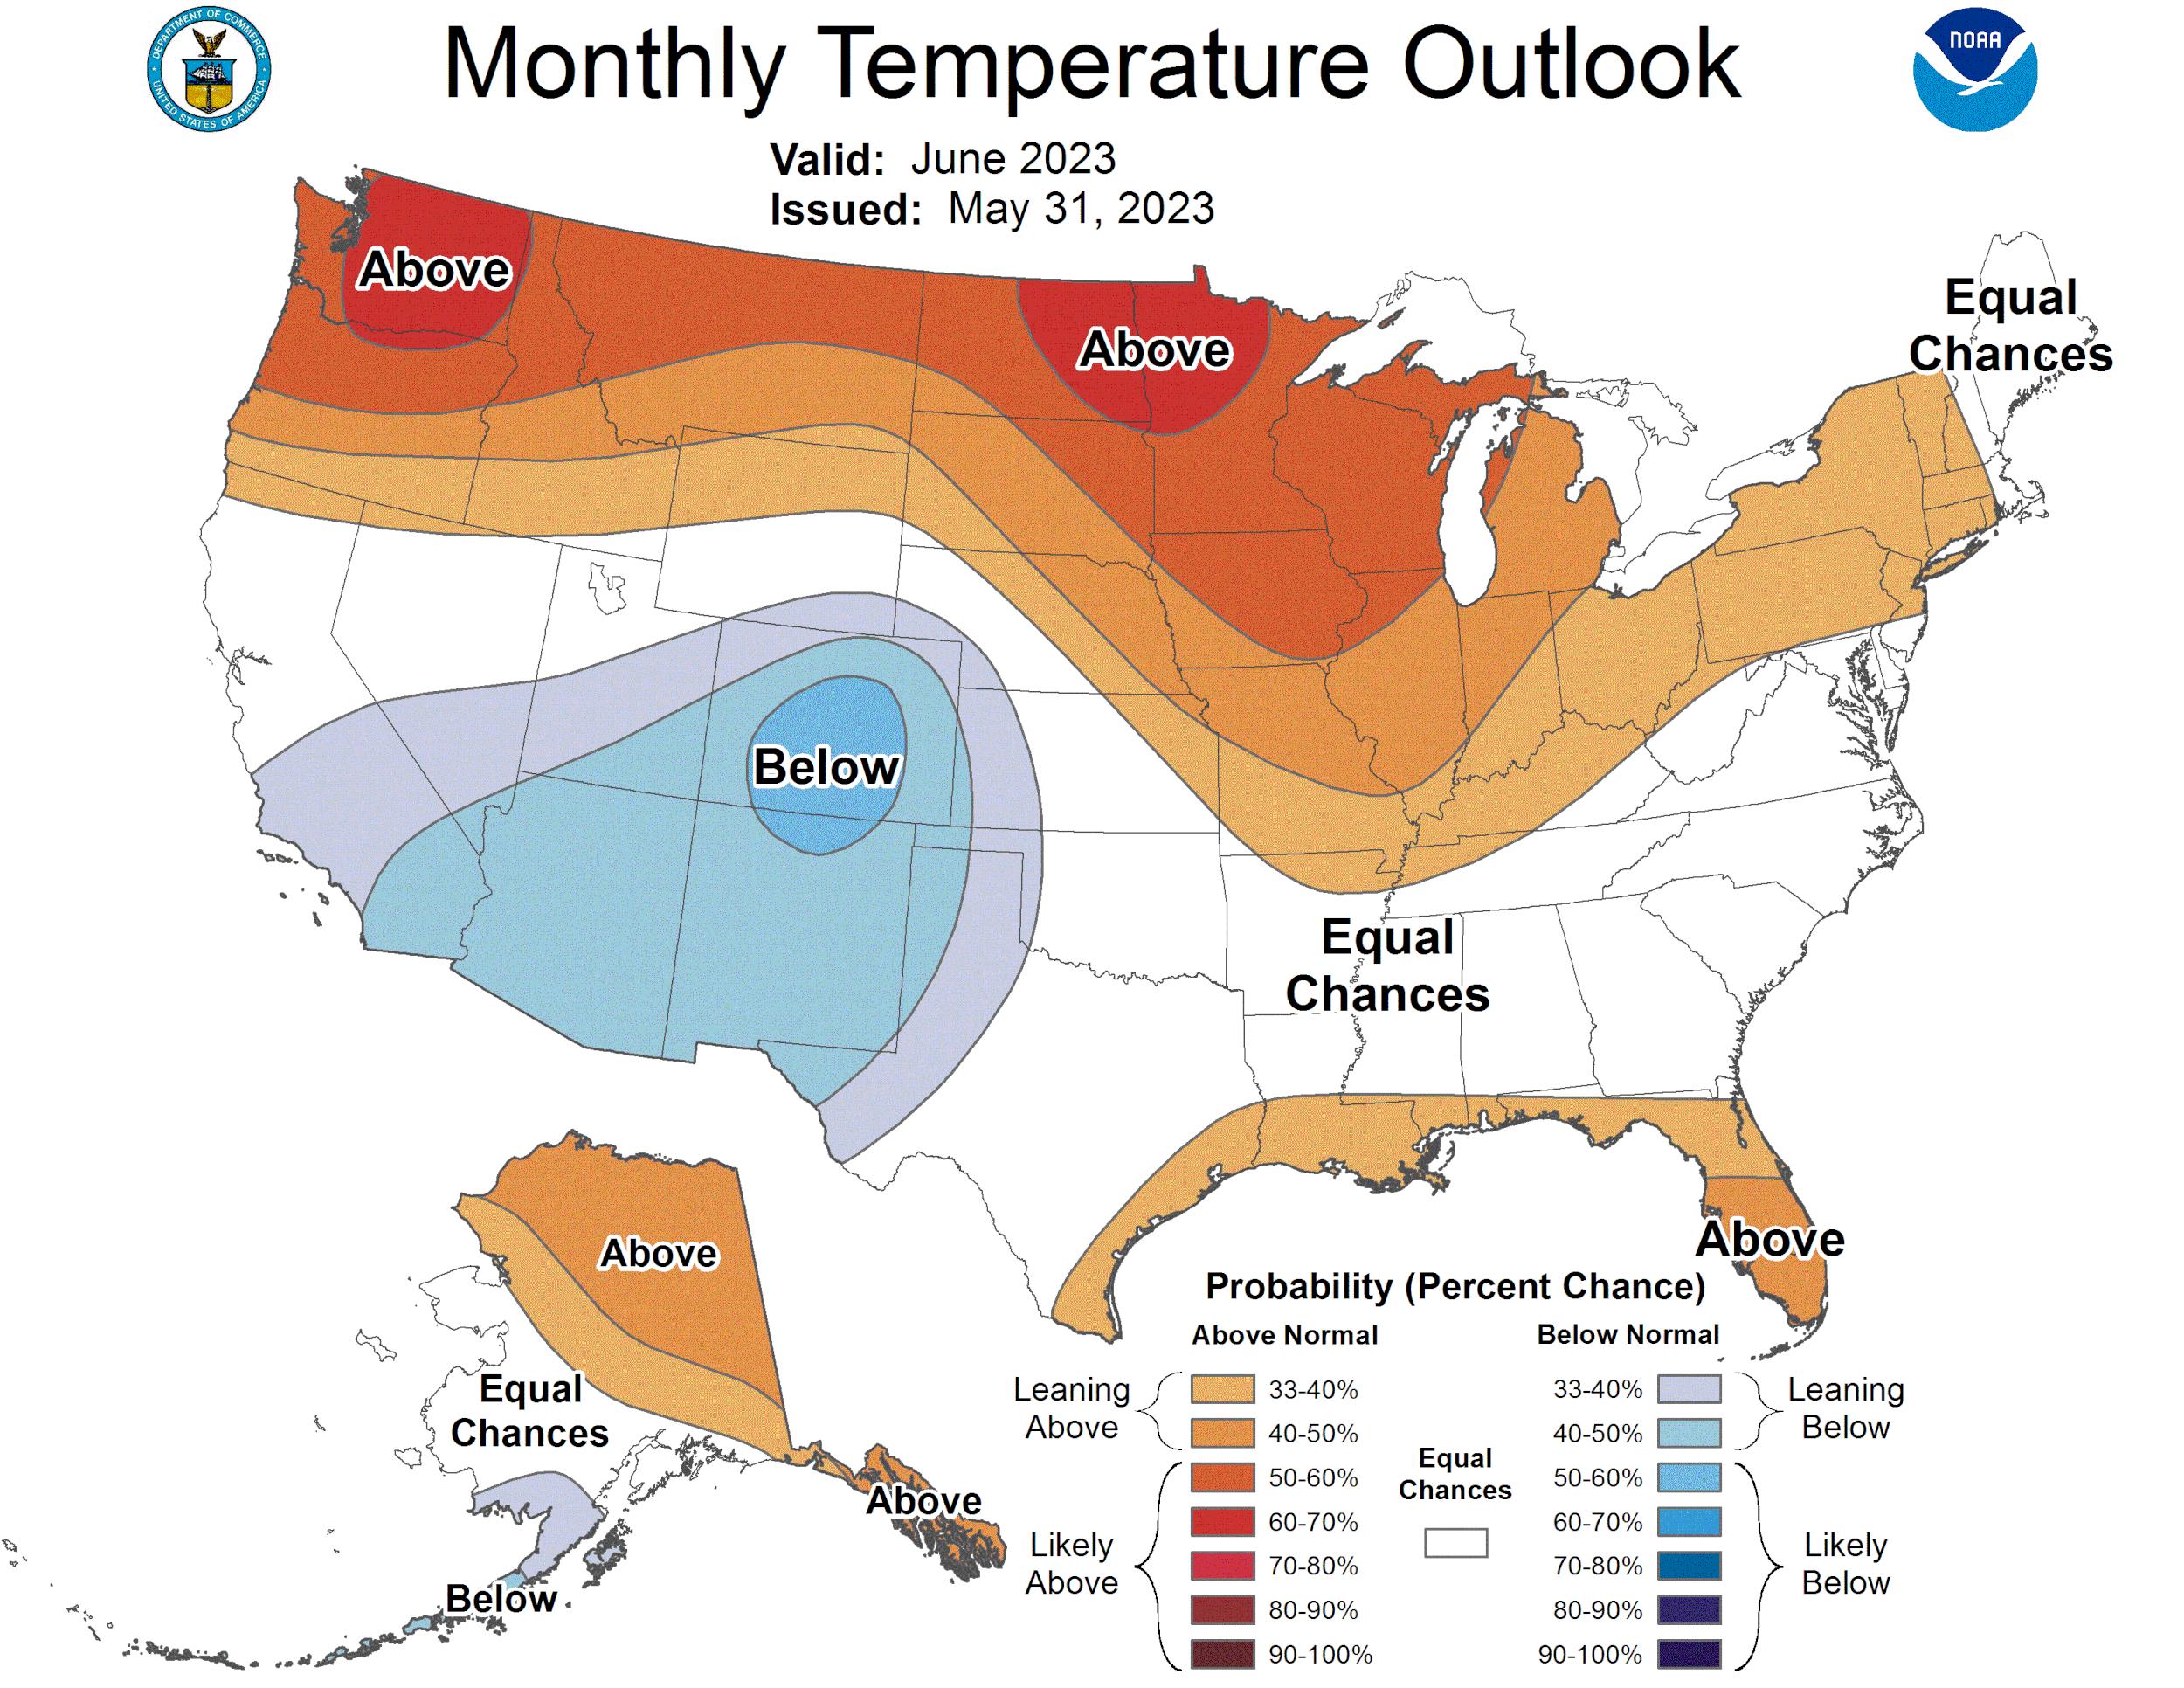
Weather Outlook
Hedging Account
No matter the situation you are in, our partners at Banghart Properties Grain Marketing can help you come up with a plan of attack to help you manage your risk. If you want help managing your risk you can give them a call anytime at (605) 295-3100 or set up a hedge account below.
Check Out Past Updates
6/6/23 - Audio
WEATHER & WAR
6/5/23 - Market Update
CORN PRESSURED BUT CONDITIONS FALL
6/5/23 - Audio
WEATHER VOLATILITY CONTINUES
6/4/23 - Weekly Grain Newsletter
AI DROUGHT & PRICE PREDICTIONS
6/2/23 - Market Update
WHEN WILL FIREWORKS START?
6/2/23 - Audio
COULD WE SEE 160 OR EVEN 140 YIELD?
6/1/23 - Market Update

