BIG BUYERS WANT CORN?
MARKET UPDATE
Usually we do NOT share full updates like this on social media..
Want future updates & signals?
TRY 30 DAYS FREE: CLICK HERE
You can still scroll to read the usual update as well. As the written version is the exact same as the video.
Futures Prices Close
Overview
Grains slightly higher but fell well off their early highs.
As soybeans ran as high as $10.12 (+15 cents) but ultimately crashed off the highs failing to close above $10.00. Closing -1 cent lower on the day to $9.96
Options expiration is tomorrow. Often times, the board tries to pin as many options worthless as possible.
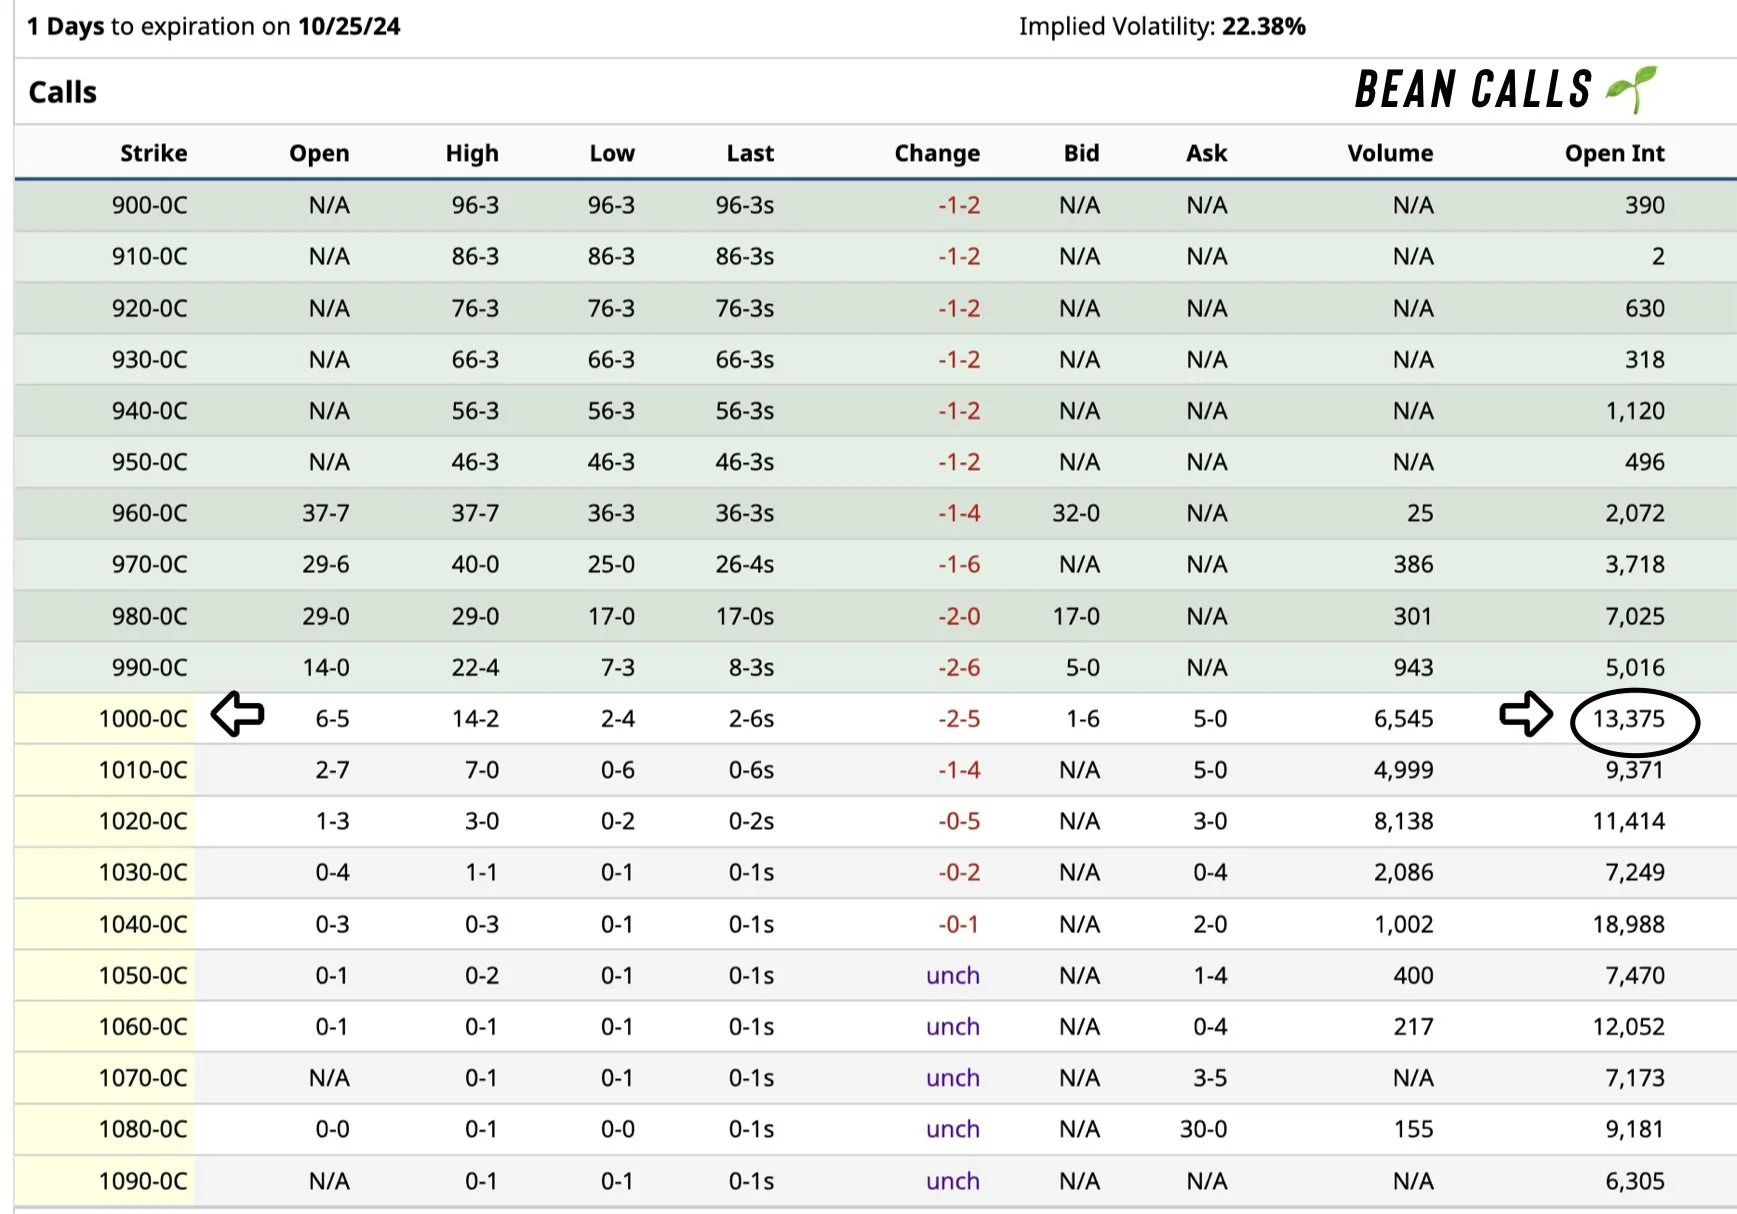
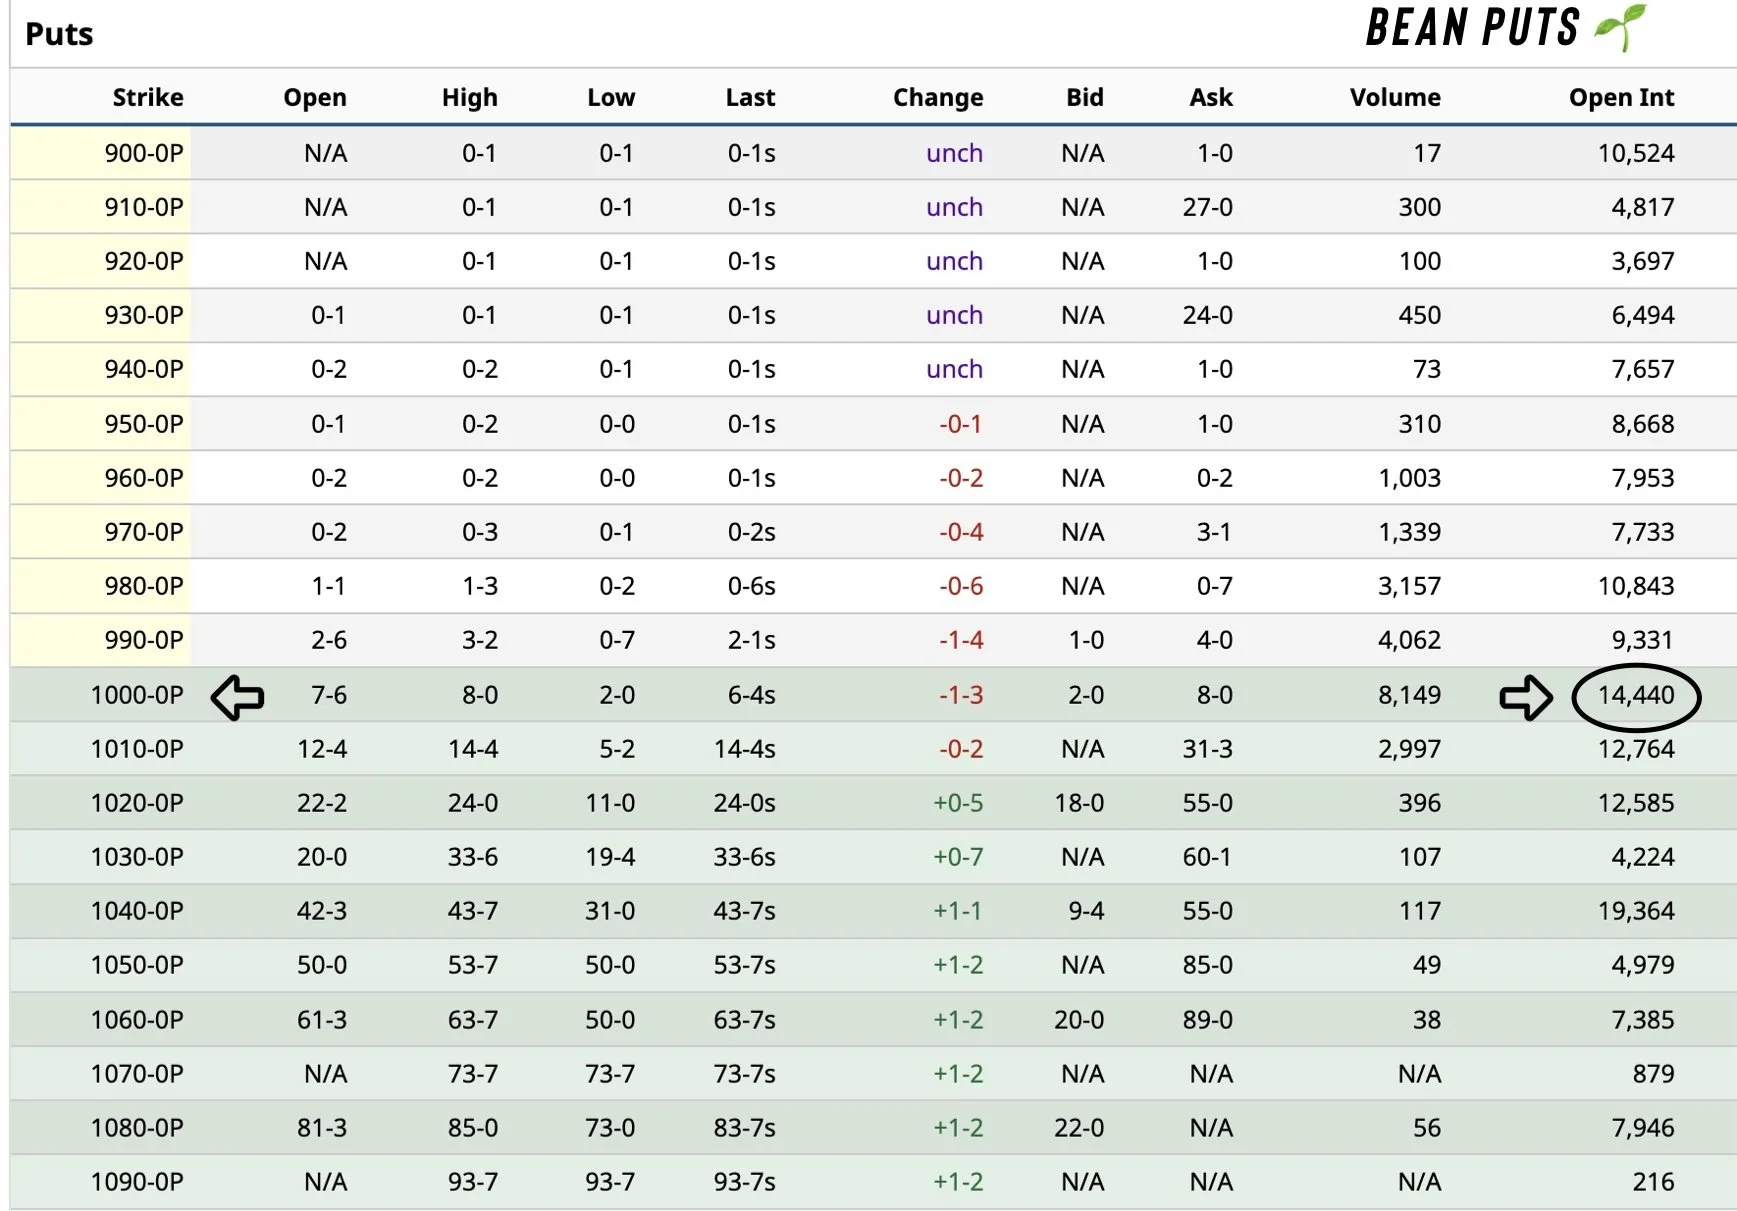
For soybeans, the $10.00 calls and $10.00 puts both have the most open interest.
$10 Calls: 13,375 contracts
$10 Puts: 14,440 contracts
So it looks like the board very well might try to pin beans right at $10 tomorrow. So the most amount of contracts expire worthless.
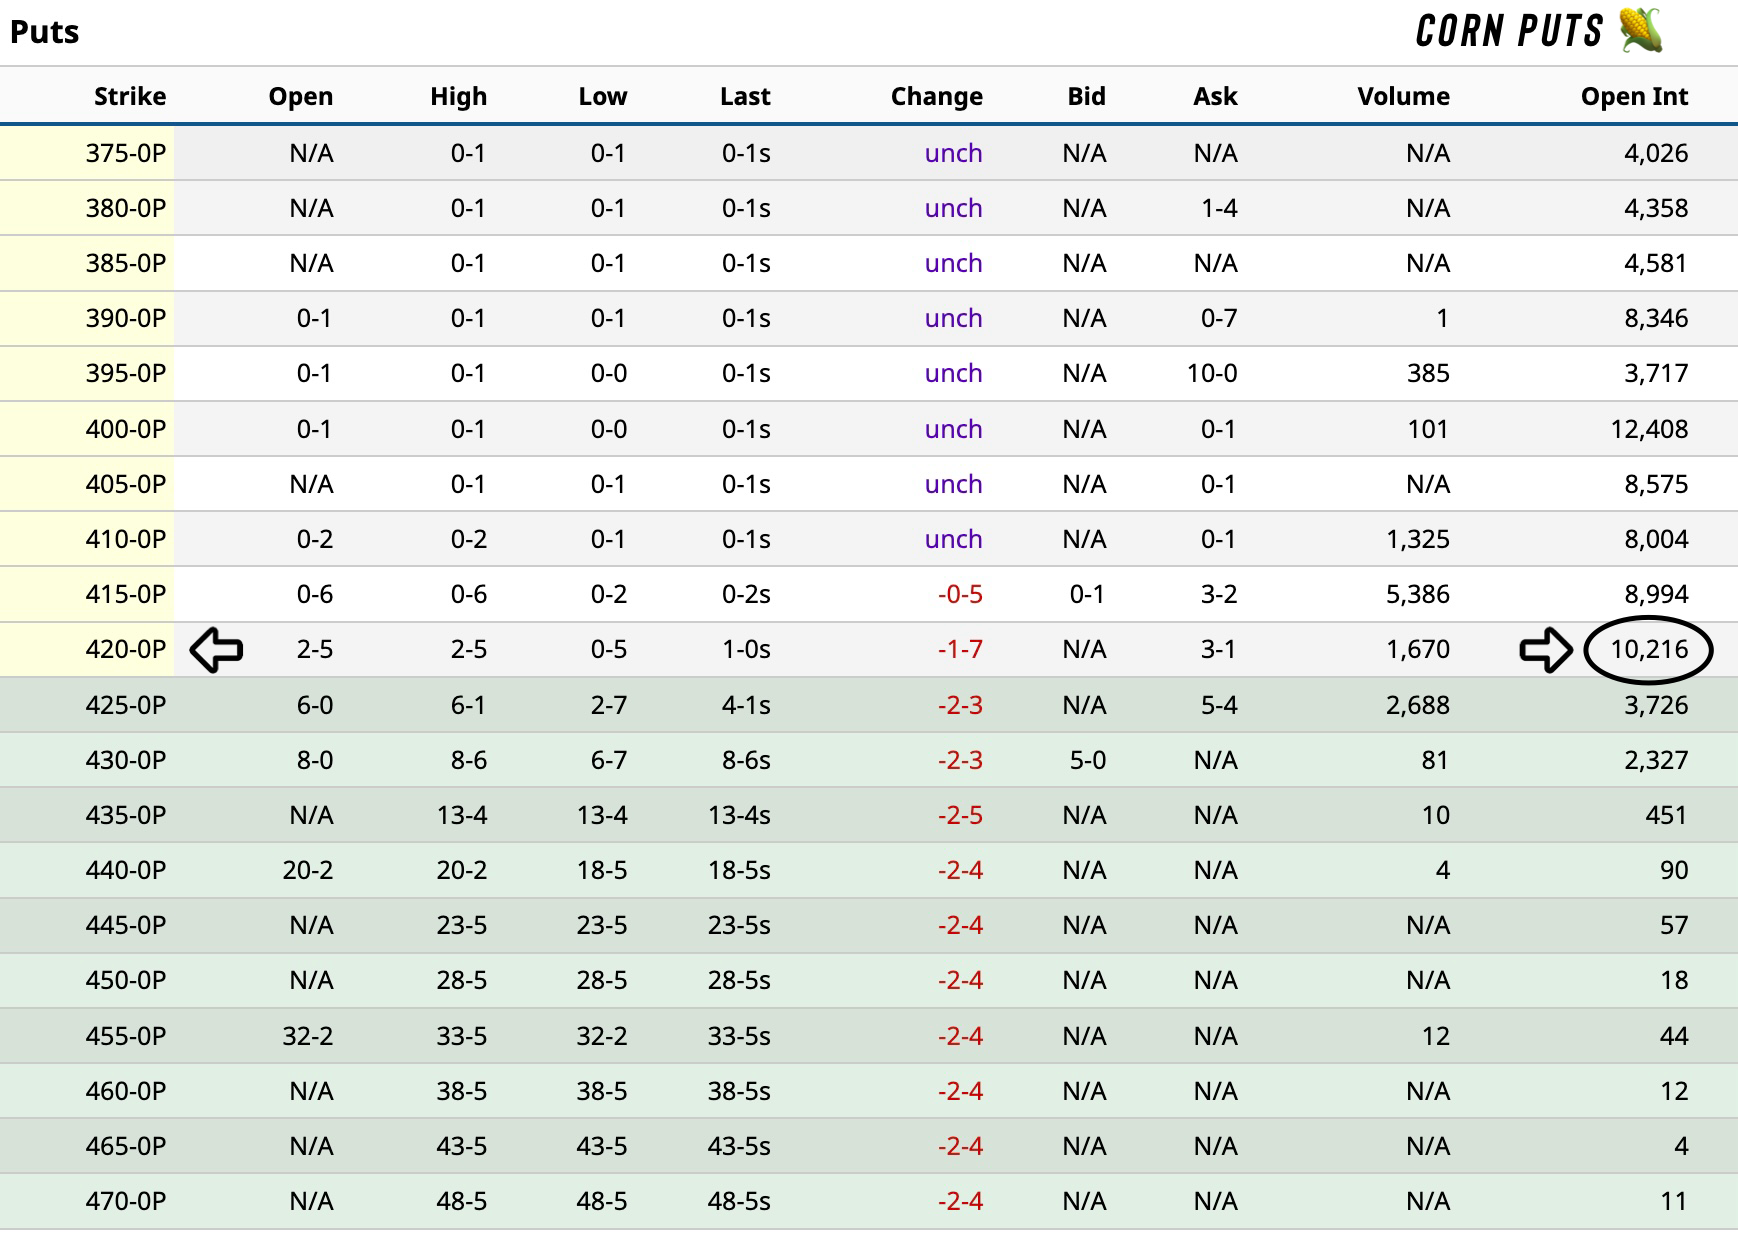
Now for corn the contracts with the most open interest are $4.20 calls & puts.
$4.20 Calls: 13,405
$4.20 Puts: 10,216
So perhaps the trade tries to pin right at or right below $4.20 tomorrow.
This does not have to happen, but often can.
Huge Exports
One very positive thing we have seen recently is export demand. Especially for corn.
Corn had it's 7th straight day of flash sales.
Today:
• 392.6k - Japan & Unknown
Yesterday:
• 100k - Unknown
Tuesday:
• 359k - Mexico
Monday:
• 500k - Mexico, South Korea, & Unknown
Last Friday:
• 125k - Unknown
Last Thursday:
• 298k - Mexico & Unknown
Last Wednesday:
• 1.95 million - Mexico & Unknown
Total:
• 3.72 million
What's even more impressive?
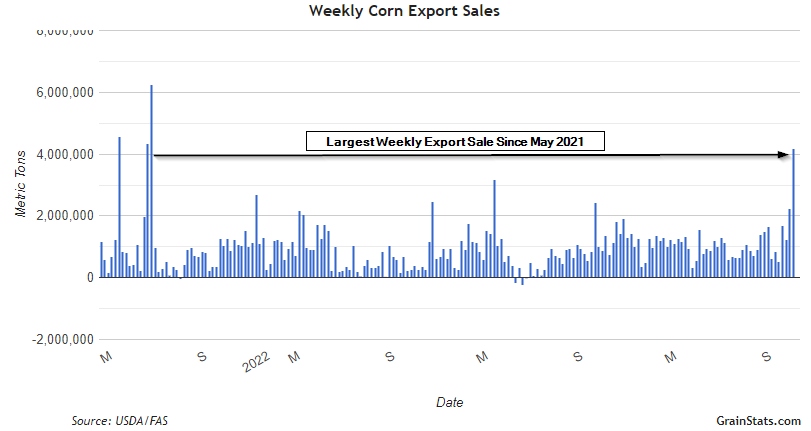
Last week's weekly export sales released this morning were the largest for a week since May 2021.
A big feat for corn.
(Will touch more on this in the corn section).
Chart from GrainStats
None of these unknown buyers are China for corn. But it shows big buyers are finding value at these levels.
Soybeans have seen quite a few sales as well, but they haven’t been massive amounts.
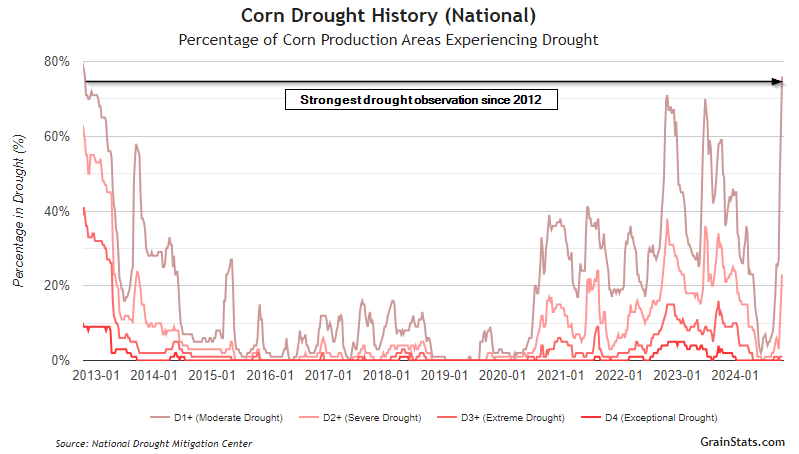
Most Drought Since 2012
Areas in Drought on August 1st:
Corn: 4%
Beans: 4%
Areas in Drought Today:
Corn: 76%
Beans: 68%
A massive change the past few months.
In fact, this is the most drought we have seen 2012.
Of course no this doesn’t matter a ton and far too early to suggest drought next summer. (Take a look at this spring for example).
However, one has to wonder what if it stays this way.
We could very well enter next year with sub par soil moisture.
Chart from GrainStats
Today's Main Takeaways
Corn
Corn higher for the 6th time in 7 days.
Corn has been led by outstanding demand and technical buying.
Although today's price action was slightly disappointing, today's weekly export sales were huge. As mentioned, the largest for a week since May 2021.
I don’t have much to update on corn. So I am just going to breakdown why I am bullish on corn demand looking longer term.
For starters, the recent exports have been massive. If we continue this, the USDA could very well be underestimating their numbers.
Secondly is ethanol production.
Ethanol production hit it's 2nd highest level on record for that specific week last week.
Currently, the USDA expects ethanol to be lower than year. But.. we are running +3% higher than last year.
IF this continued, it alone could anywhere from 100-200 million bushels of corn demand.
Both of these mean that we could very easily see corn carryout below 1.80 billion.
So you are telling me we are going to have a record yield, +7 bpa larger than the record. Yet.. our carryout could shrink compared to last year..?
That tells me corn has a demand story.
2023 Balance Sheet:
Yield: 177.3 bpa
Carryout: 1.80 billion
2024 Balance Sheet:
Yield: 183.8 bpa
Carryout: 1.99 billion
Now a 1.80 billion carryout is not wildly "bullish" but it wouldn’t suggest sub $4.00 corn.
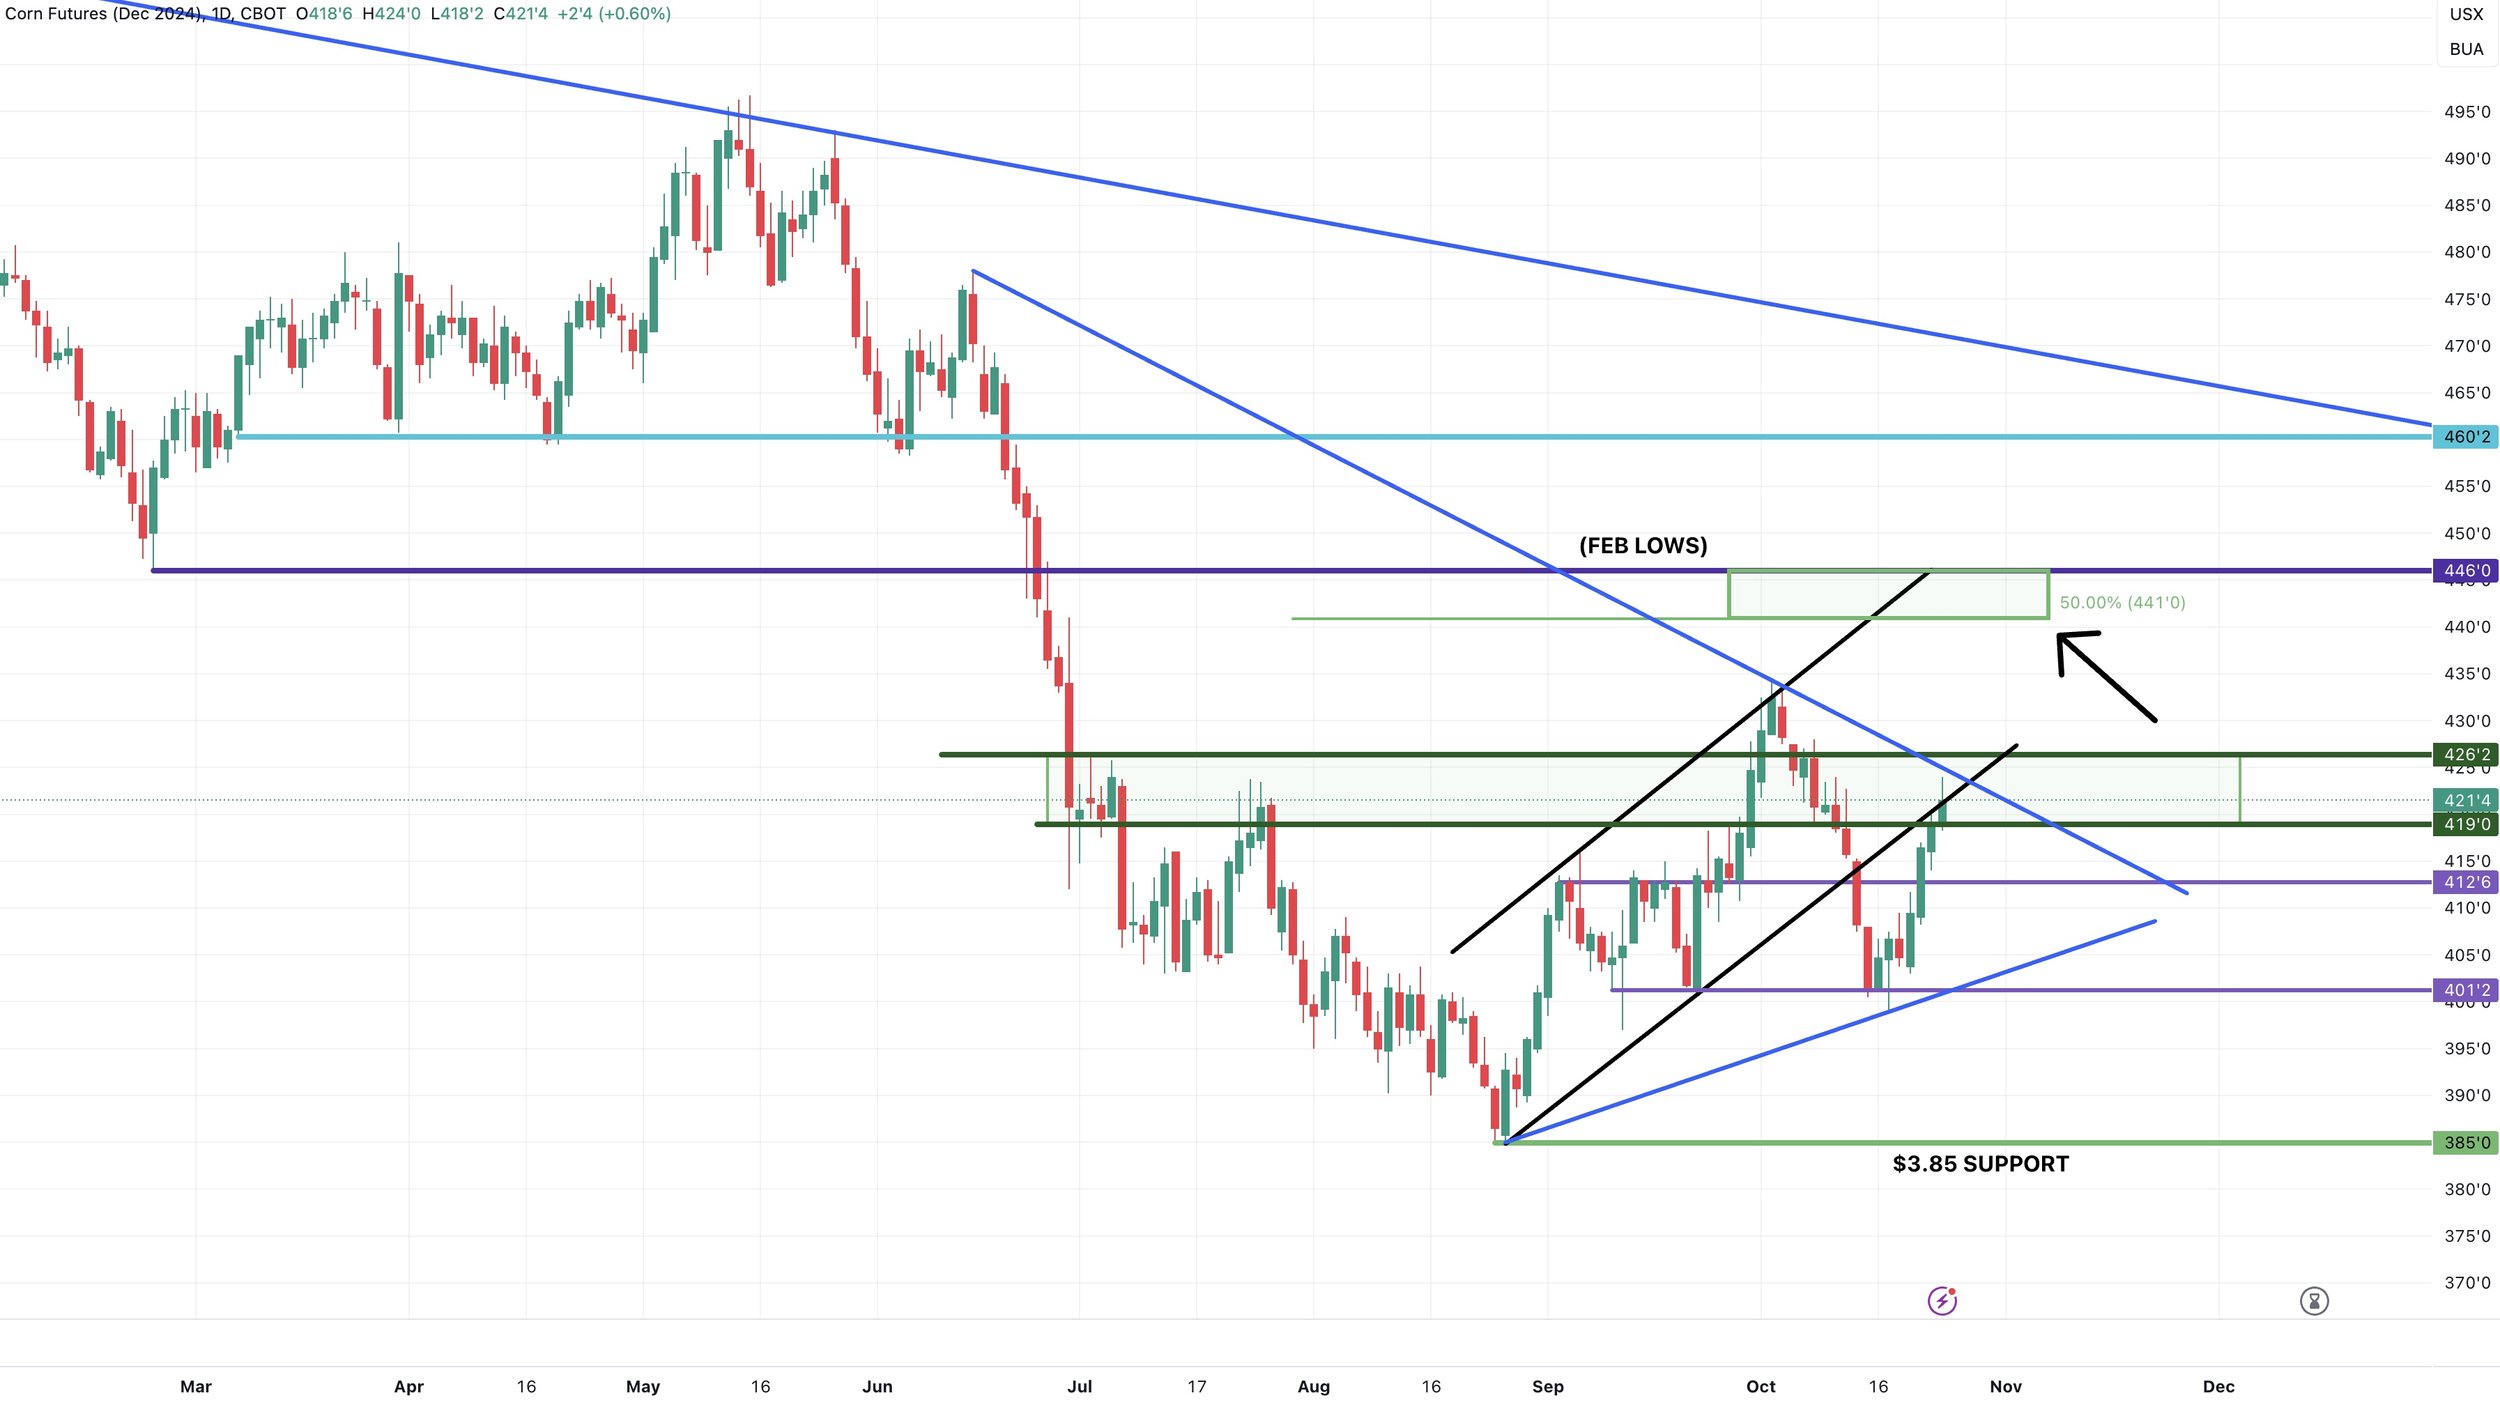
Looking at the chart, great action. We are finding resistance at this channel (black line)
Next resistance is $4.26 (top of the green box). If we break that, I do not see why we couldn’t challenge those recent highs.
Looking at a little longer term target.
If we were to bust those highs, the next spot I'd be looking at $4.41 to $4.46. That is our 50% retracment to the May highs & our February lows.
Another possible bigger target after that would be $4.60. Again, a much longer term target.
That is where we found support several times from March to July.
It also corresponds with this long term trendline.
Daily View
Big Picture Weekly View
Soybeans
Poor action in soybeans. Looks like they might just want to try to pin beans right at $10.00 tomorrow.
Next week is first notice day.
Which means anyone with basis contracts will have to price or roll them.
Now typically, first notice day brings a lot of selling pressure & lower futures. But this is typically only in a wide carry market. When basis sucks and nobody wants grain, first notice day often pressures the market more.
But now since the spreads have firmed and basis has seen a boost, I do not think first notice day will have a massive negative effect like it has in the past.
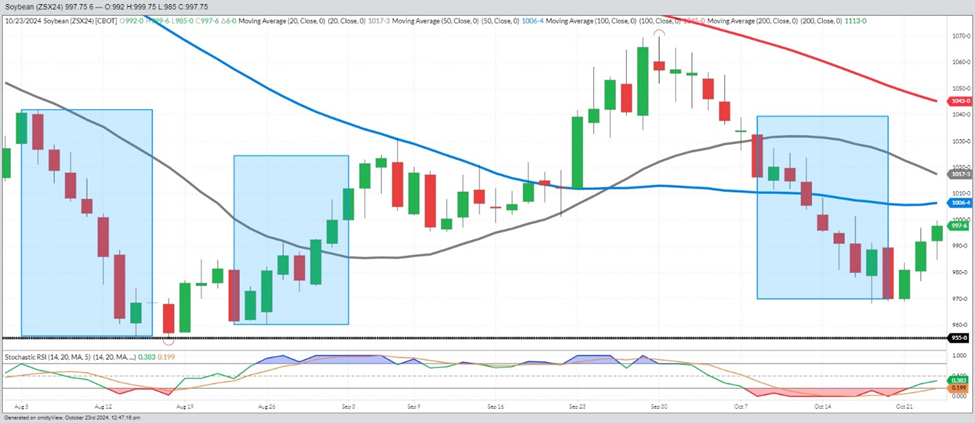
Here is an interesting chart from Jody Lawrence.
It just shows the pattern leading up to the last first notice day as well as this first notice. Very similar.
As you can see, we sold off hard in the weeks going into it. Then start moving higher after. Doesn’t mean it will happen again, but worth noting.
Basis Contracts
If you have a basis contract and you have delivered it already, but have not priced it. Currently you are essentially long in the elevators hedge account. So it makes sense to do it in your own account. They are using your money to pay for margin.
Another option would be to price the beans and buy a call. That way you do not have any further downside risk aside from the cost of your call and you save money from rolling them.
The 3rd option would be to simply roll the contract and wait for higher prices. Your basis will get wider, but won’t go as backwards as it did last year. Keep in mind, this is essentially the same as going long the board in the first option, but you are letting them do it instead of you. Pretty much giving big ag an advantage.
If you decide to roll, your basis will be whatever the basis is +/- the spread.
For example if your basis is 0, and we have a 9 cent carry in the market. You will then get a 9 cent under after you roll it. (Plus any fees they charge you).
Looking at fundamentals, I do not expect the trade to get long soybeans here going into an election that is going to bring uncertainty. (Doesn’t mean we can’t go higher, but means I don’t see the funds getting long. They are currently slightly short).
The fundamental story is the exact opposite of corn.
The global balance sheet for beans is very bearish.
We have a big crop here in the US. Brazil is expected to have a monster crop.
If Brazil does have a monster crop, soybean prices could fall a lot further. It is simply an unknown wild card.
We might get a few opportunities here and there, but without a real scare in Brazil it will be tough to get this massive major rally. Without a scare, our ceiling could very possibly be in the realm of $11.00.
Just too many unknowns in soybeans.
Will China buy a ton of beans? Will China pump more stimulus money into their economy? Will Brazil have a drought? If Trump wins will it cause a trade war?
You just have to get comfortable with all of the unknowns.
If you have questions on your specific operation, feel free to reach out anytime. (605)295-3100.
Looking at the chart, this green box is going to offer some resistance. ($10.00-$10.18).
If you are looking at a spot to take a little risk off the table, it would be $10.31. As that is our 61.8% retracement to those recent highs.
Wheat
3rd day higher for wheat.
Russia is going to be the #1 factor for wheat.
They account for nearly 25% of global wheat exports. Hence why they are a big deal.
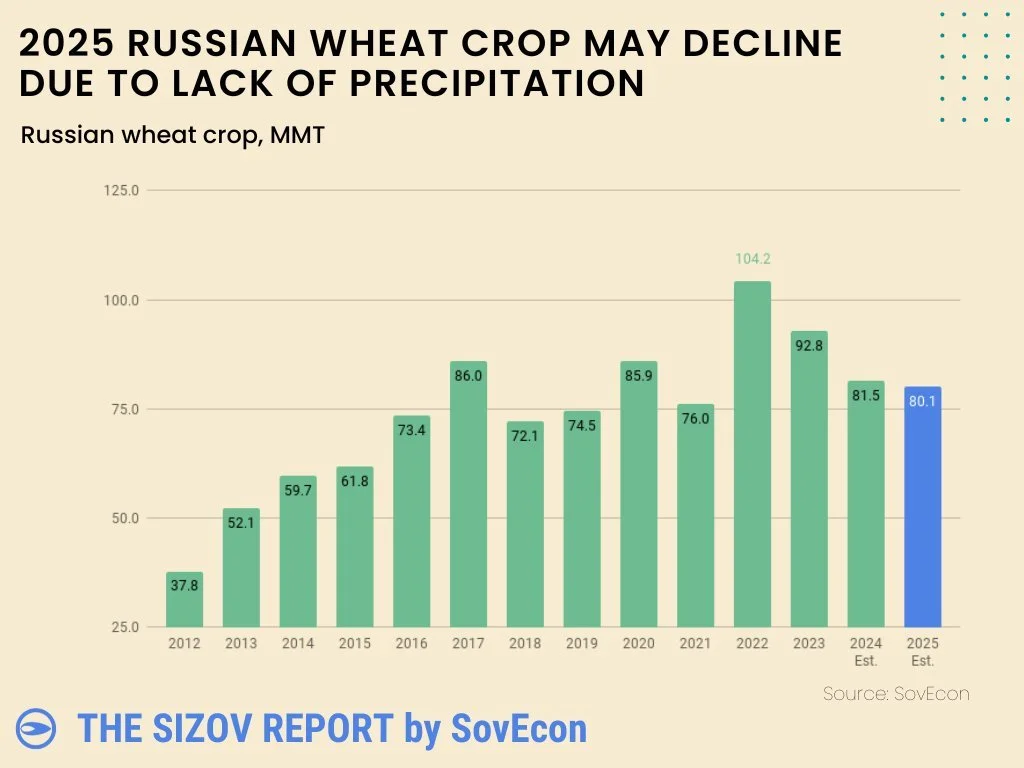
Russia's 2025 winter wheat crop is expected to decline once again for the 4th year in a row.
From Black Sea Guru Andrey Sizov:
"Wheat production in 2025 is expected to be 80.1 million tons. That would make it the smallest harvest since 2021-22, putting pressure on already tight global stockpiles."
Chart from SovEcon
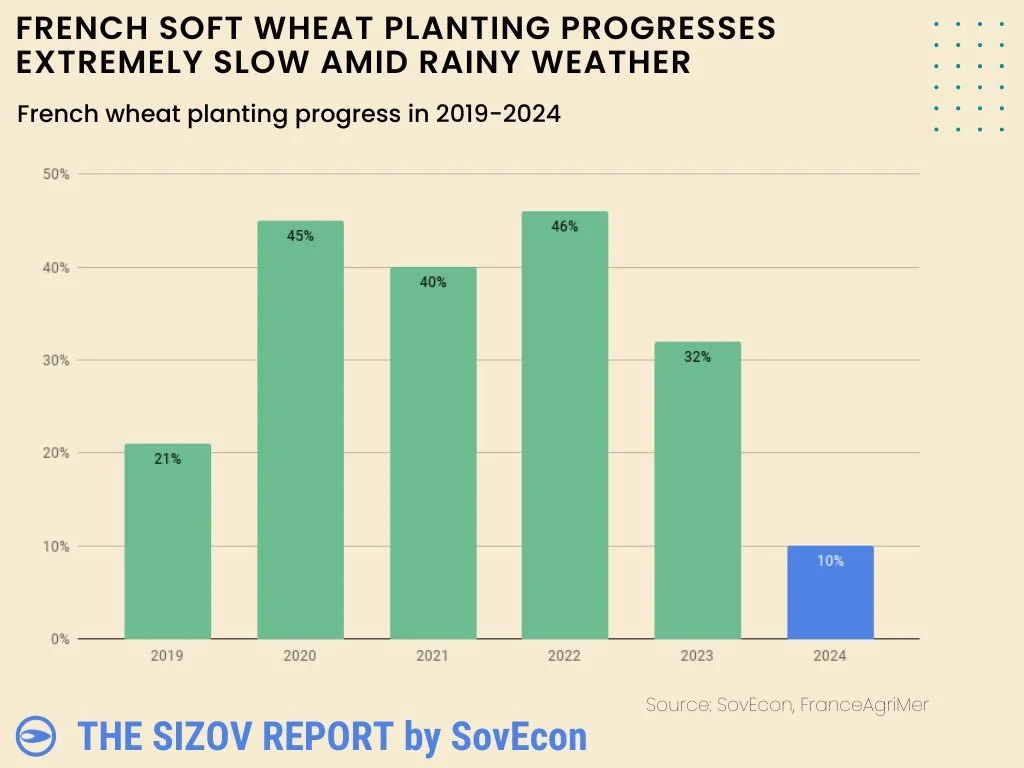
France has an awful crop. Off to the worst start to planting in years due to the extreme rain.
Chart from SovEcon
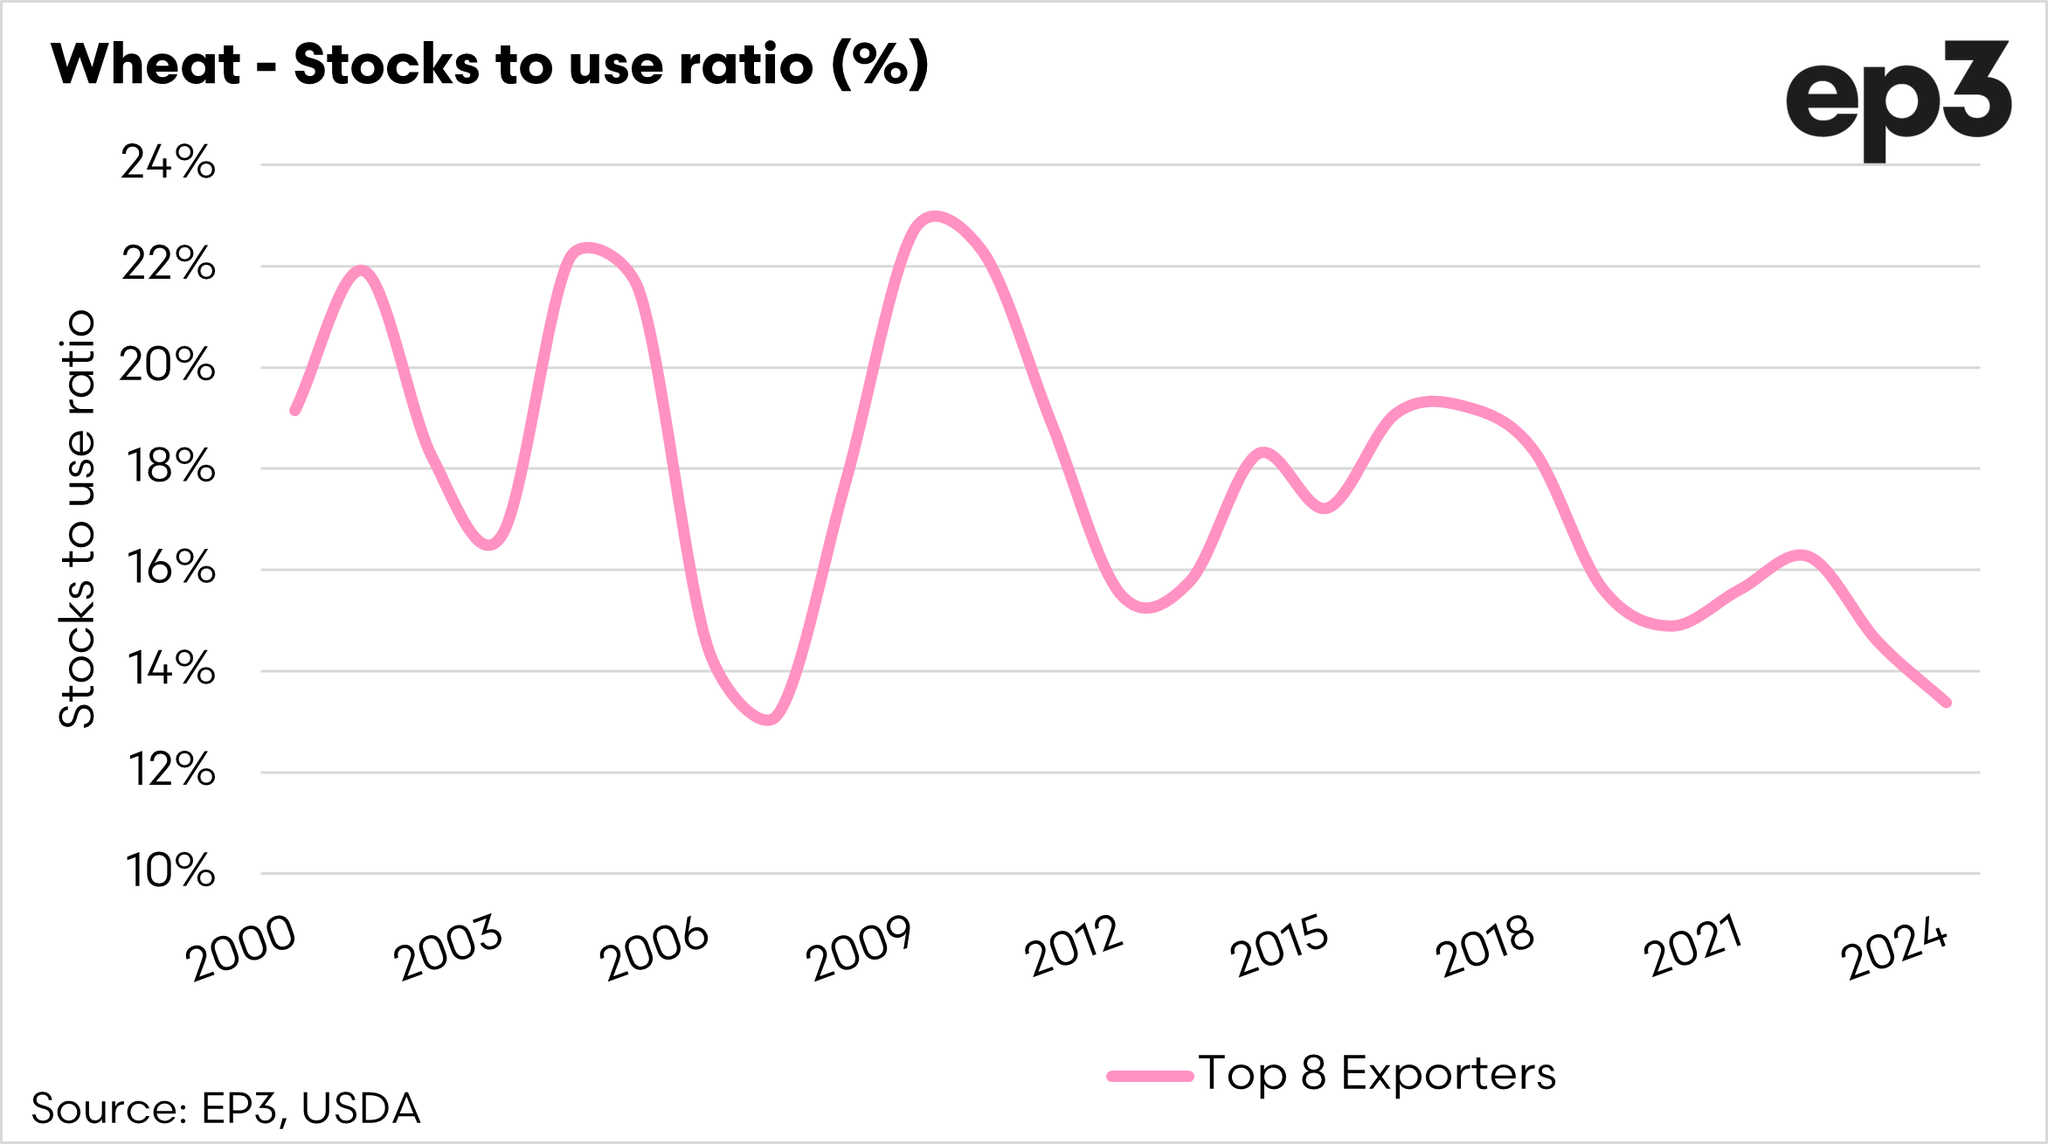
Global production issues are an even bigger deal when you look at how tight the global situation already is.
Global stocks to use ratio is the lowest all-time for wheat.
IF Russia runs into more problems, this could become an even bigger issue.
From Andrew Whitelaw of EP3:
"Stocks to use ratio of major exporters is the lowest since at leas the turn of a century. A lower stocks to use ratio typically indicates tighter supply relative to demand, which can lead to higher prices."
So just like corn, I think wheat also has a decent story going for it longer term.
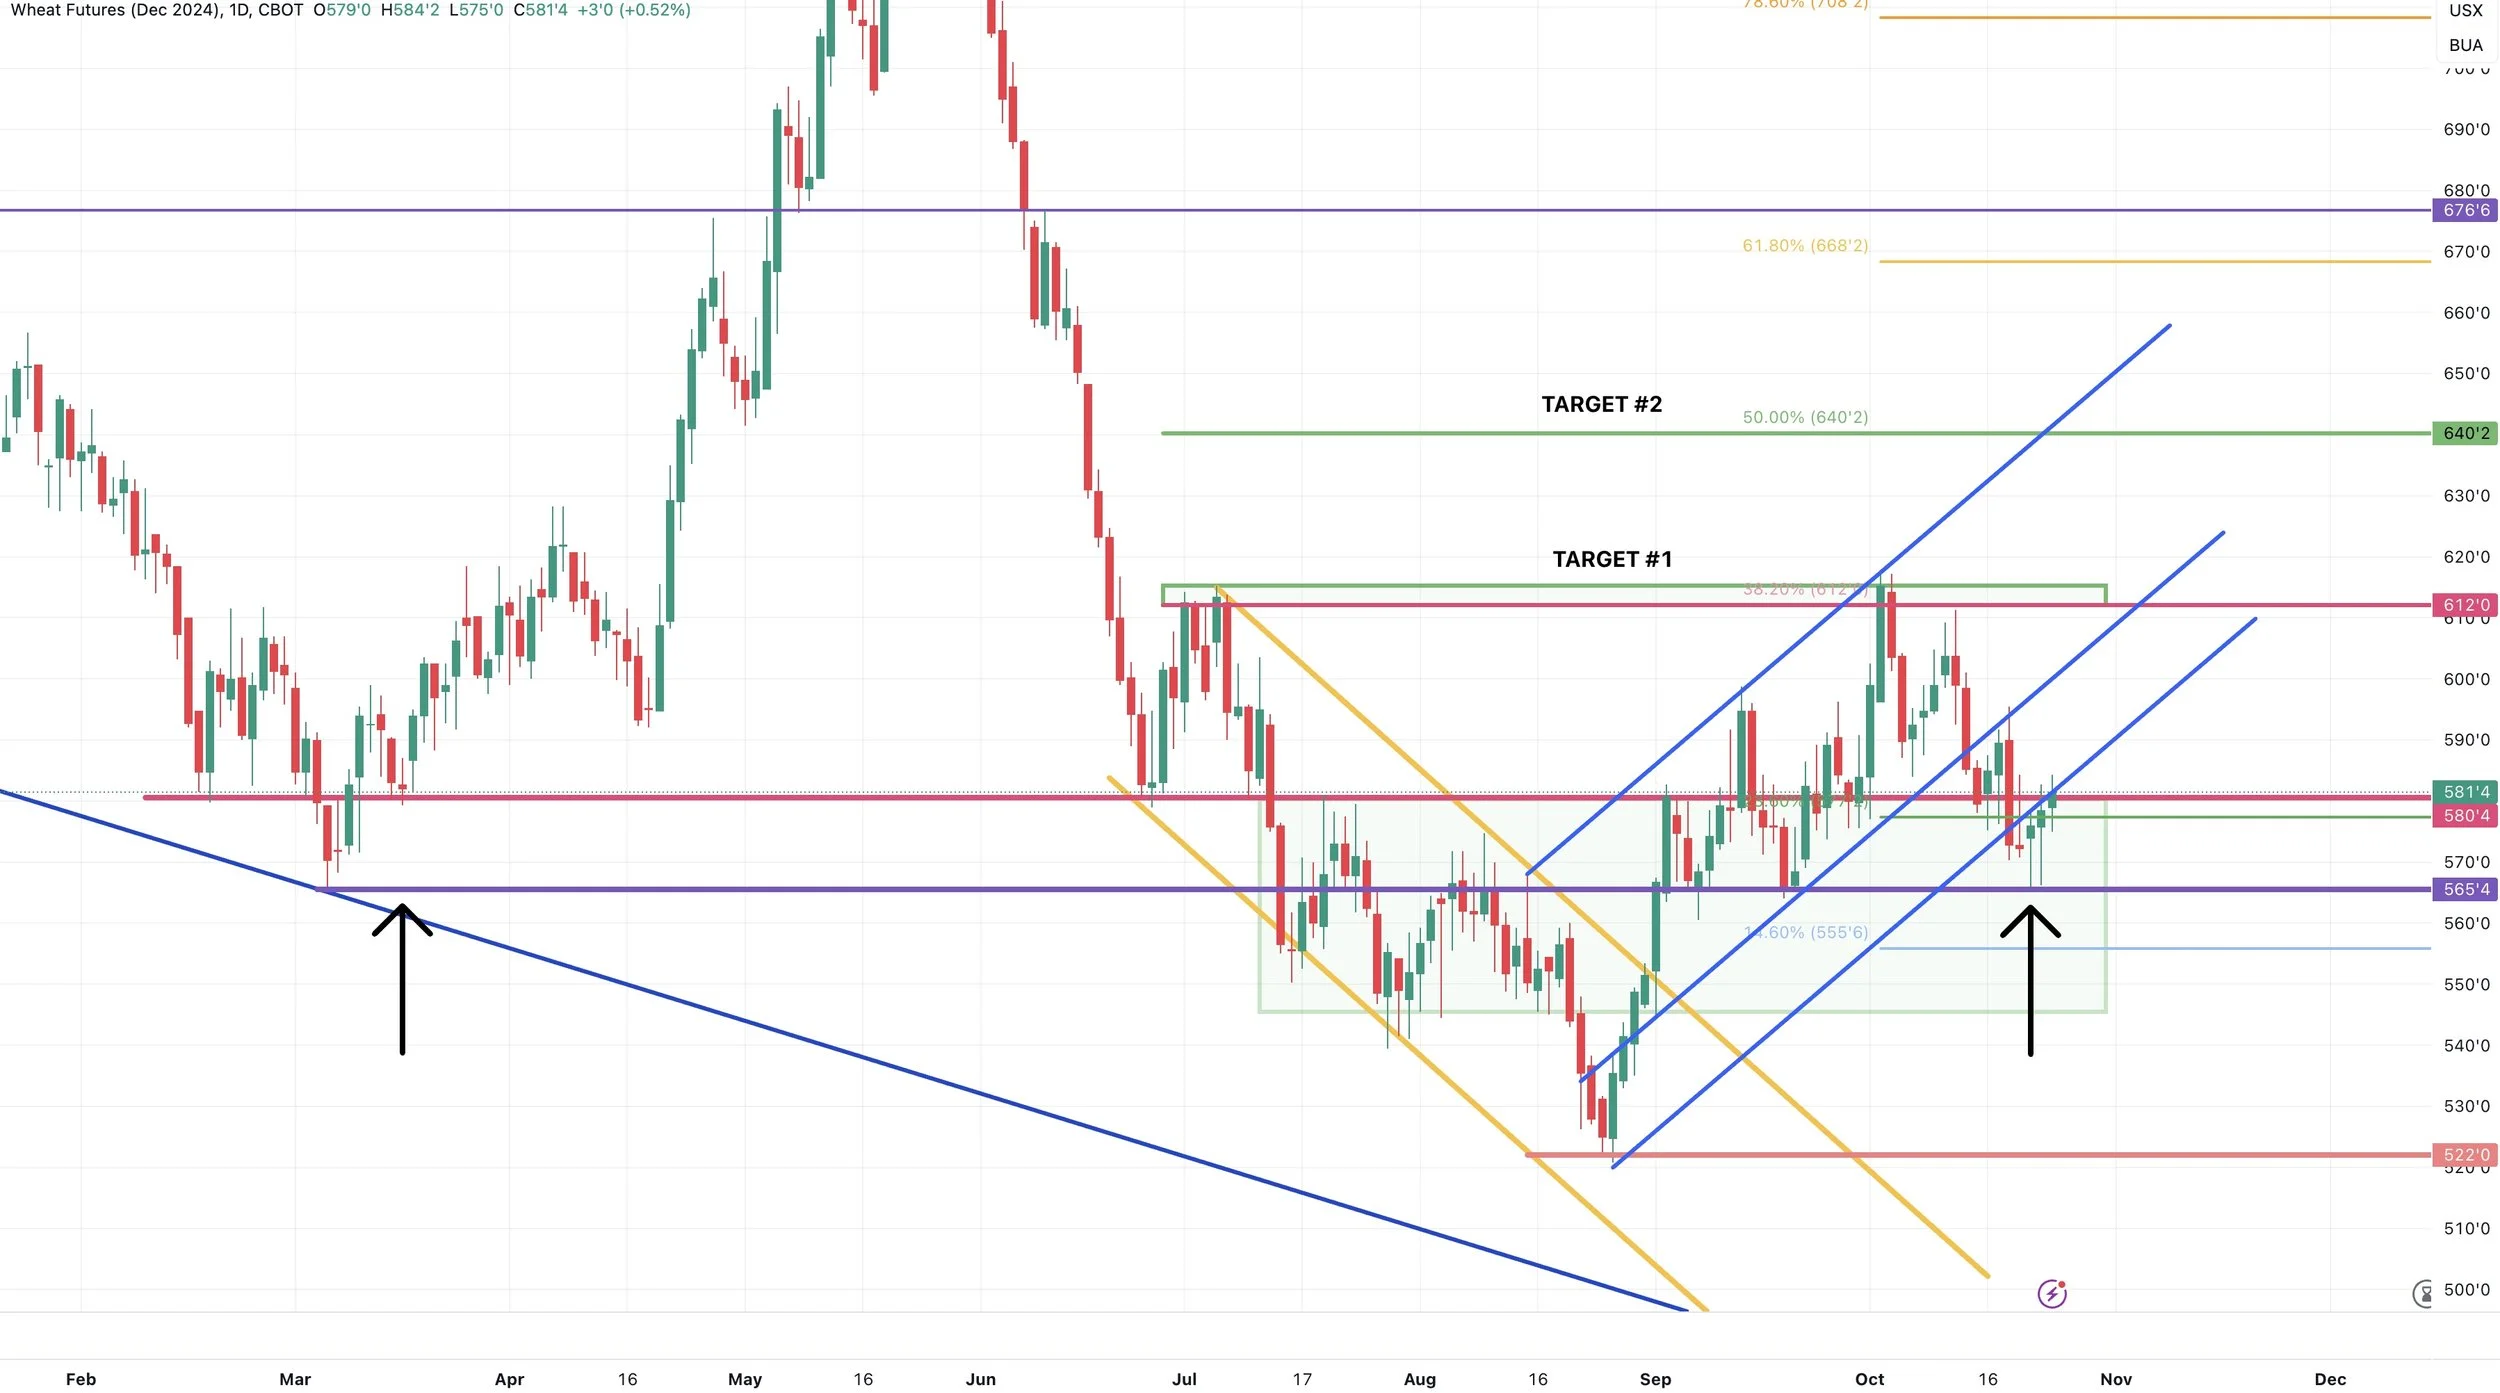
Looking at the chart, my bias remains higher unless we break below $5.65
That is a big key level I want to see us hold.
Past Sell or Protection Signals
We recently incorporated these. Here are our past signals.
Oct 2nd: 🌾
Wheat sell signal at $6.12 target
Sep 30th: 🌽
Corn protection signal at $4.23-26
Sep 27th: 🌱
Soybean sell & protection signal at $10.65
Sep 13th: 🌾
Wheat sell signal at $5.98
May 22nd: 🌾
Wheat sell signal when wheat traded +$7.00
Want to Talk?
Our phones are open 24/7 for you guys if you ever need anything or want to discuss your operation.
Hedge Account
Interested in a hedge account? Use the link below to set up an account or shoot Jeremey a call at (605)295-3100.
Check Out Past Updates
10/23/24
6TH STRAIGHT DAY OF CORN SALES
10/22/24
STRONG DEMAND & TECHNICAL BUYING FOR GRAINS
10/21/24
SPREADS, BASIS CONTRACTS, STRONG CORN, BIG SALES
10/18/24
BEANS & WHEAT HAMMERED
10/17/24
OPTIMISTIC PRICE ACTION IN GRAINS
10/16/24
BEANS CONTINUE DOWNFALL. CORN & WHEAT FIND SUPPORT
10/15/24
MORE PAIN FOR GRAINS
10/14/24
GRAINS SMACKED. BEANS BREAK $10.00
10/10/24
USDA TOMORROW
10/9/24
MARKETING STYLES, USDA RISK, & FEED NEEDS
10/8/24
BEANS FALL APART
10/7/24
FLOORS, RISKS, & POTENTIAL UPSIDE
10/4/24
HEDGE PRESSURE
10/3/24
GRAINS TAKE A STEP BACK
10/2/24
CORN & WHEAT CONTINUE RUN
10/1/24
CORN & WHEAT POST MULTI-MONTH HIGHS
9/30/24


