GRAINS SMACKED DESPITE AWFUL CROP CONDITIONS
Overview
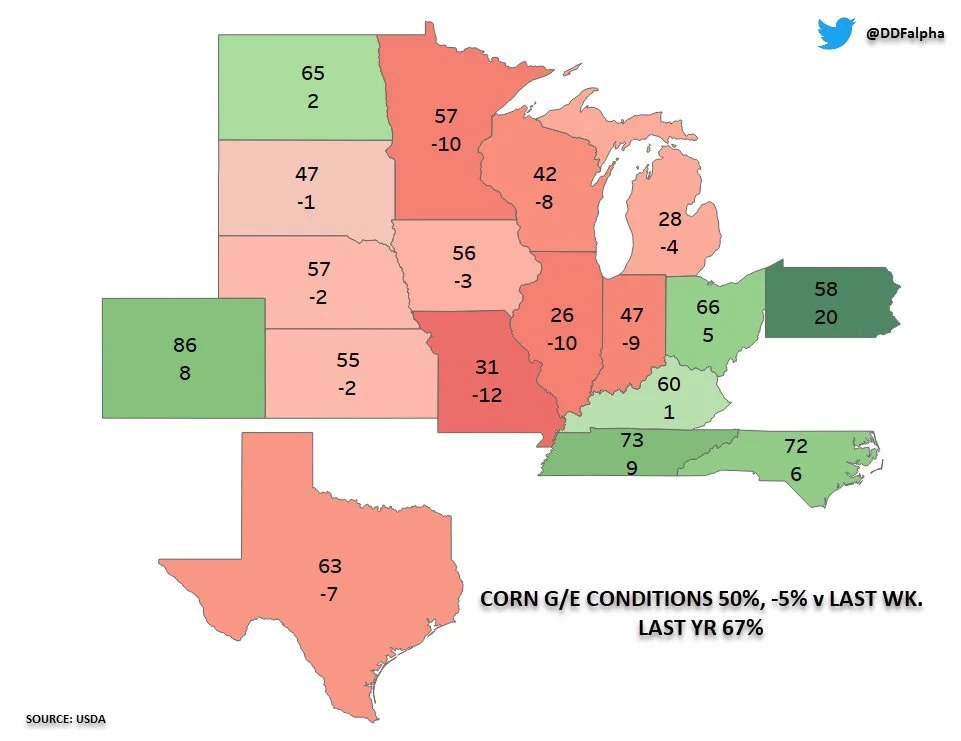
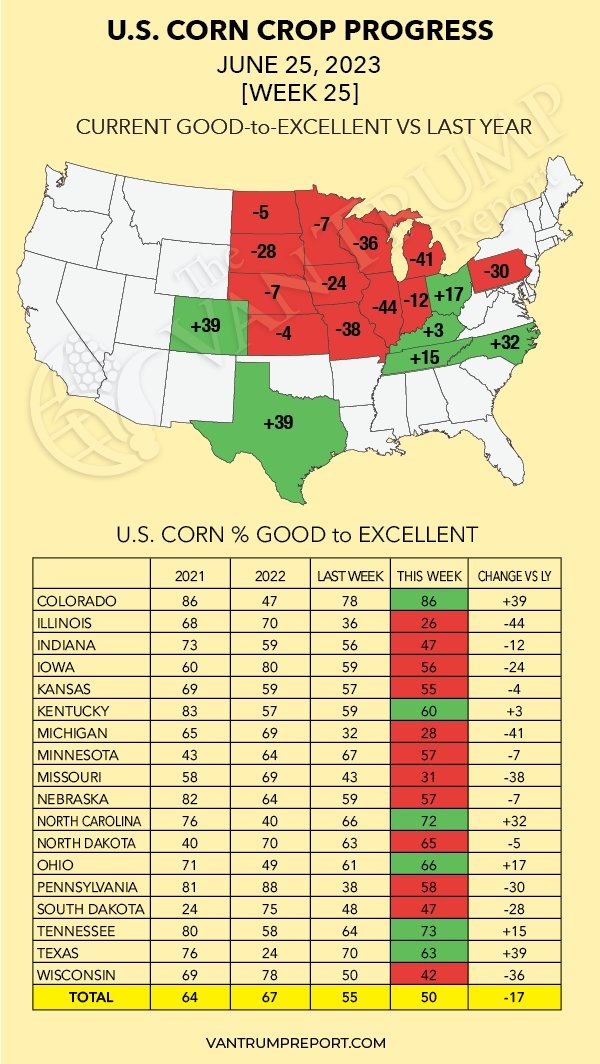
Grains hammered across the board today despite the crop conditions after close yesterday showing the crops deteriorating for the 3rd week in a row. Not only did they come in lower, but if we take a look at corn, it came in even lower than expected. Coming in at just 50% rated good to excellent vs expectations of 52% and last week's 55%. Keep in mind, yes these numbers did in fact take into account all of the rain over the weekend.
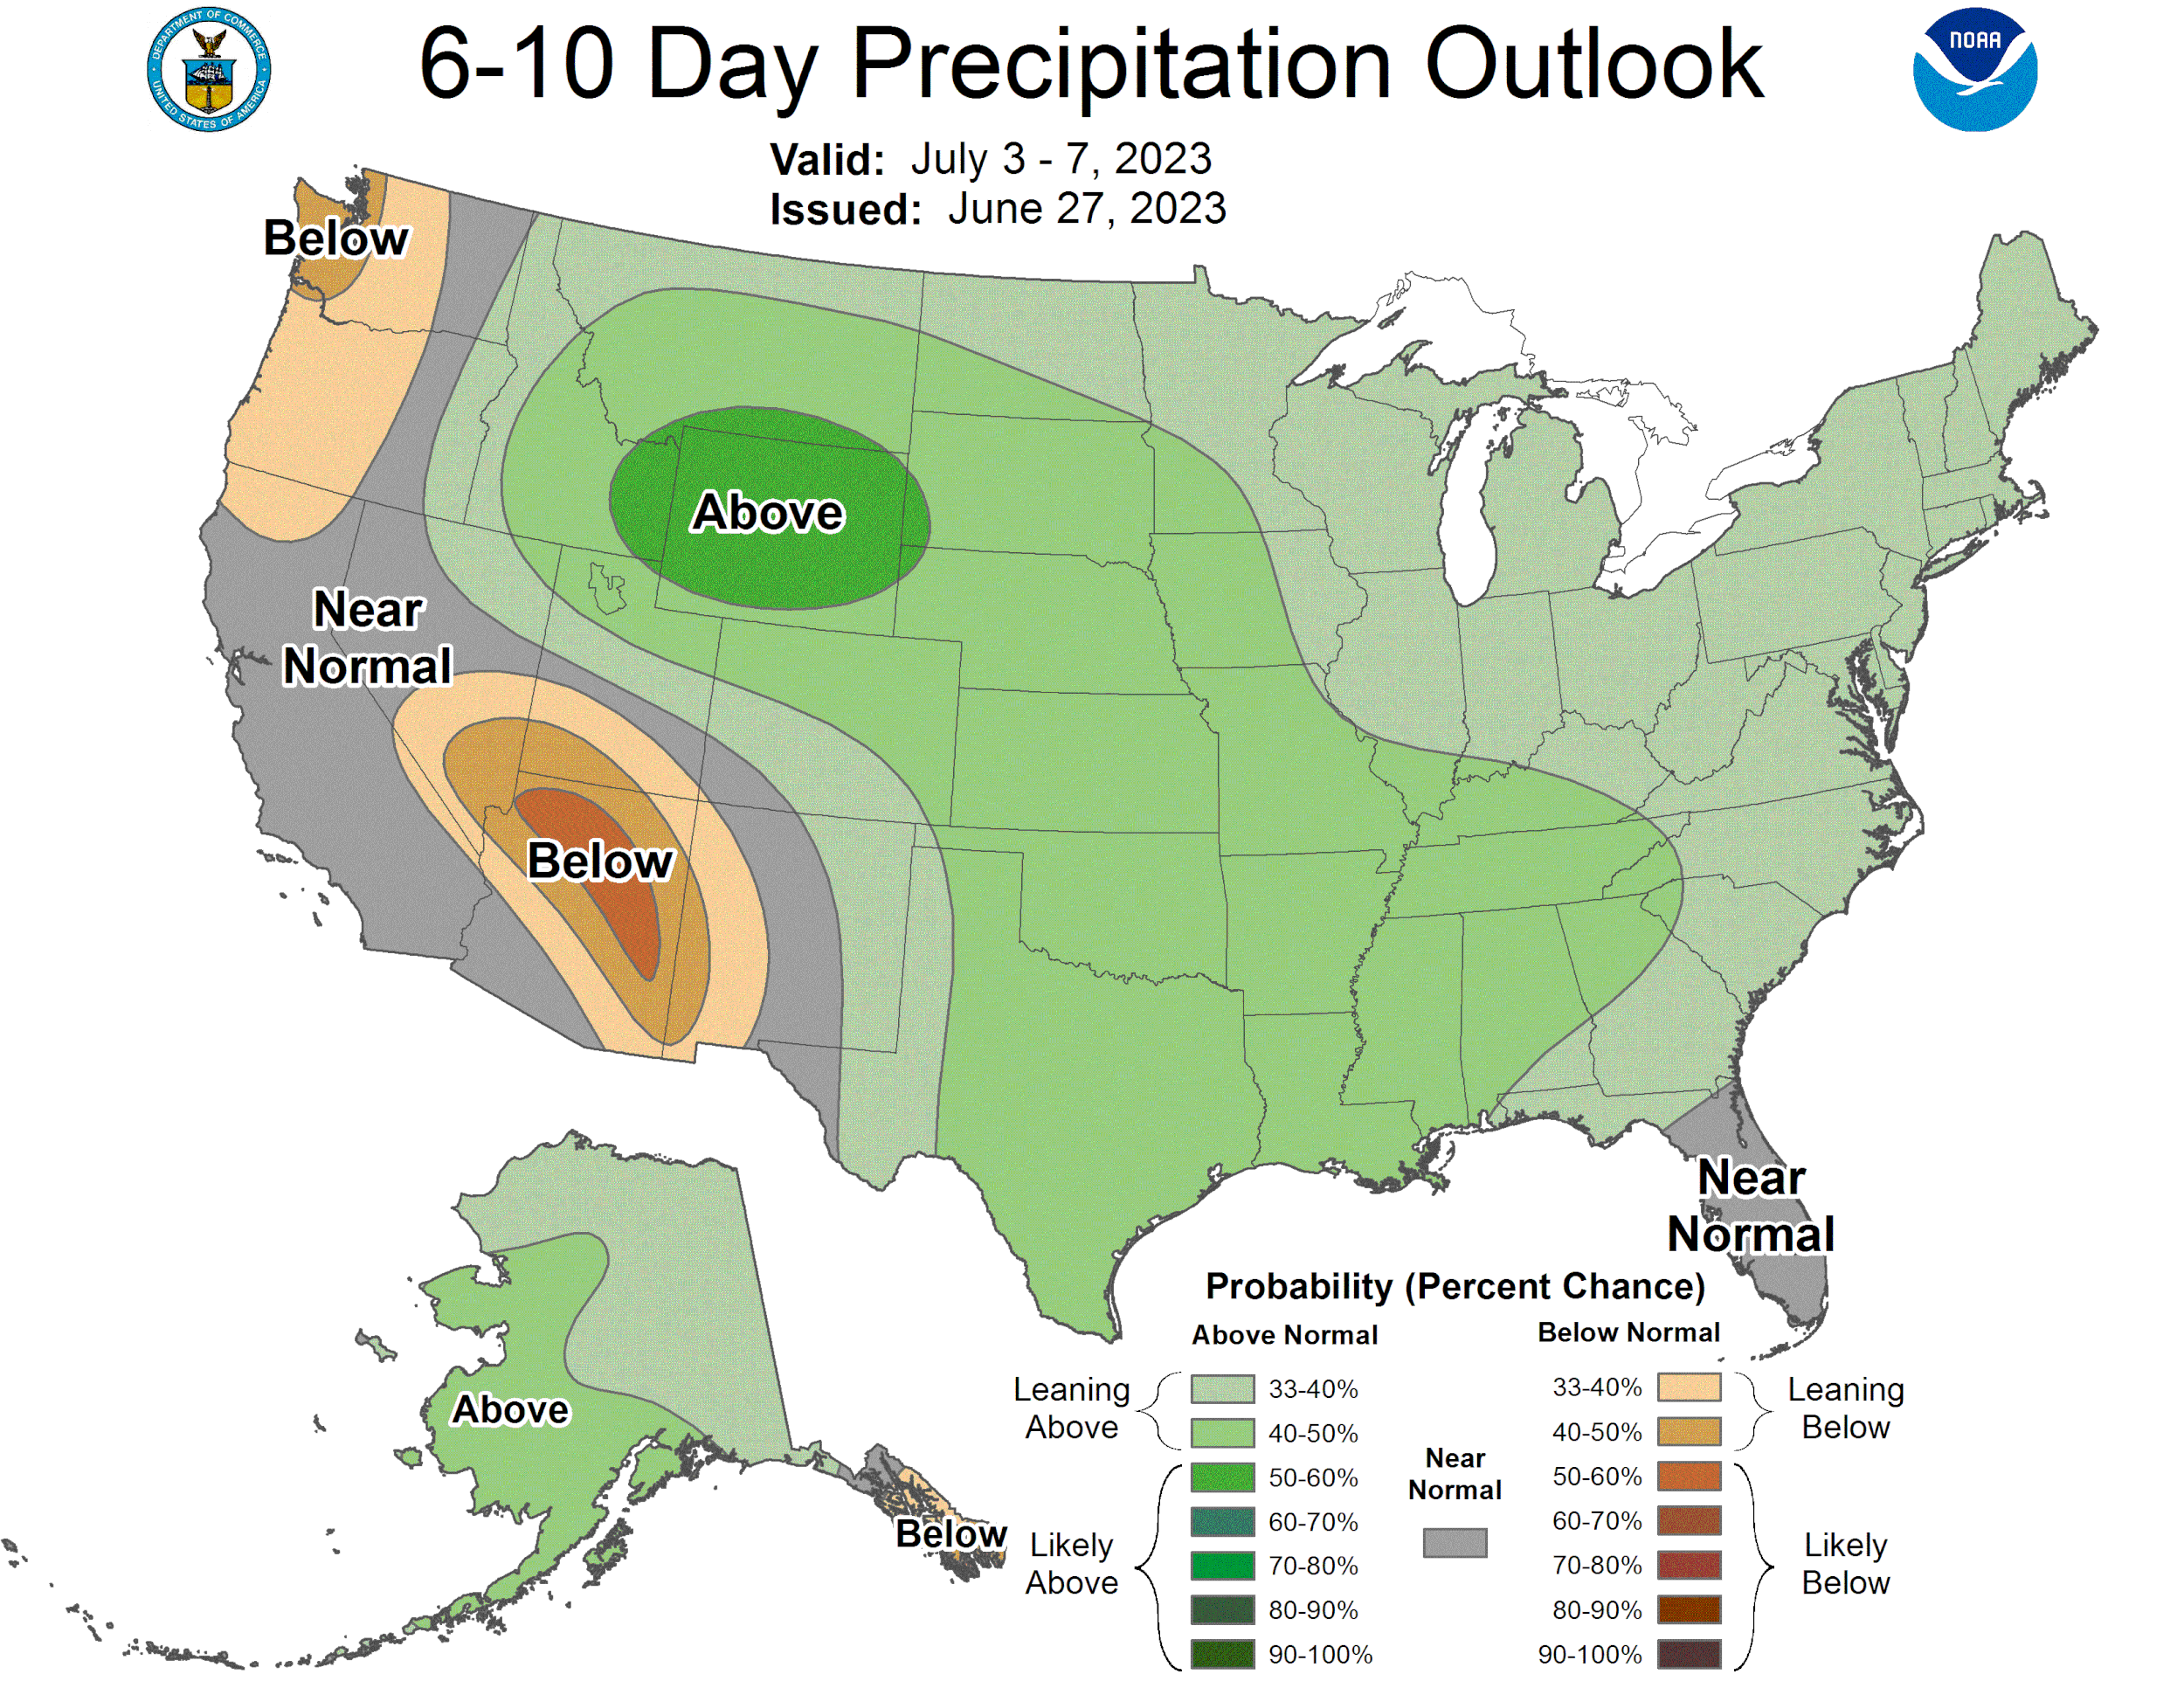
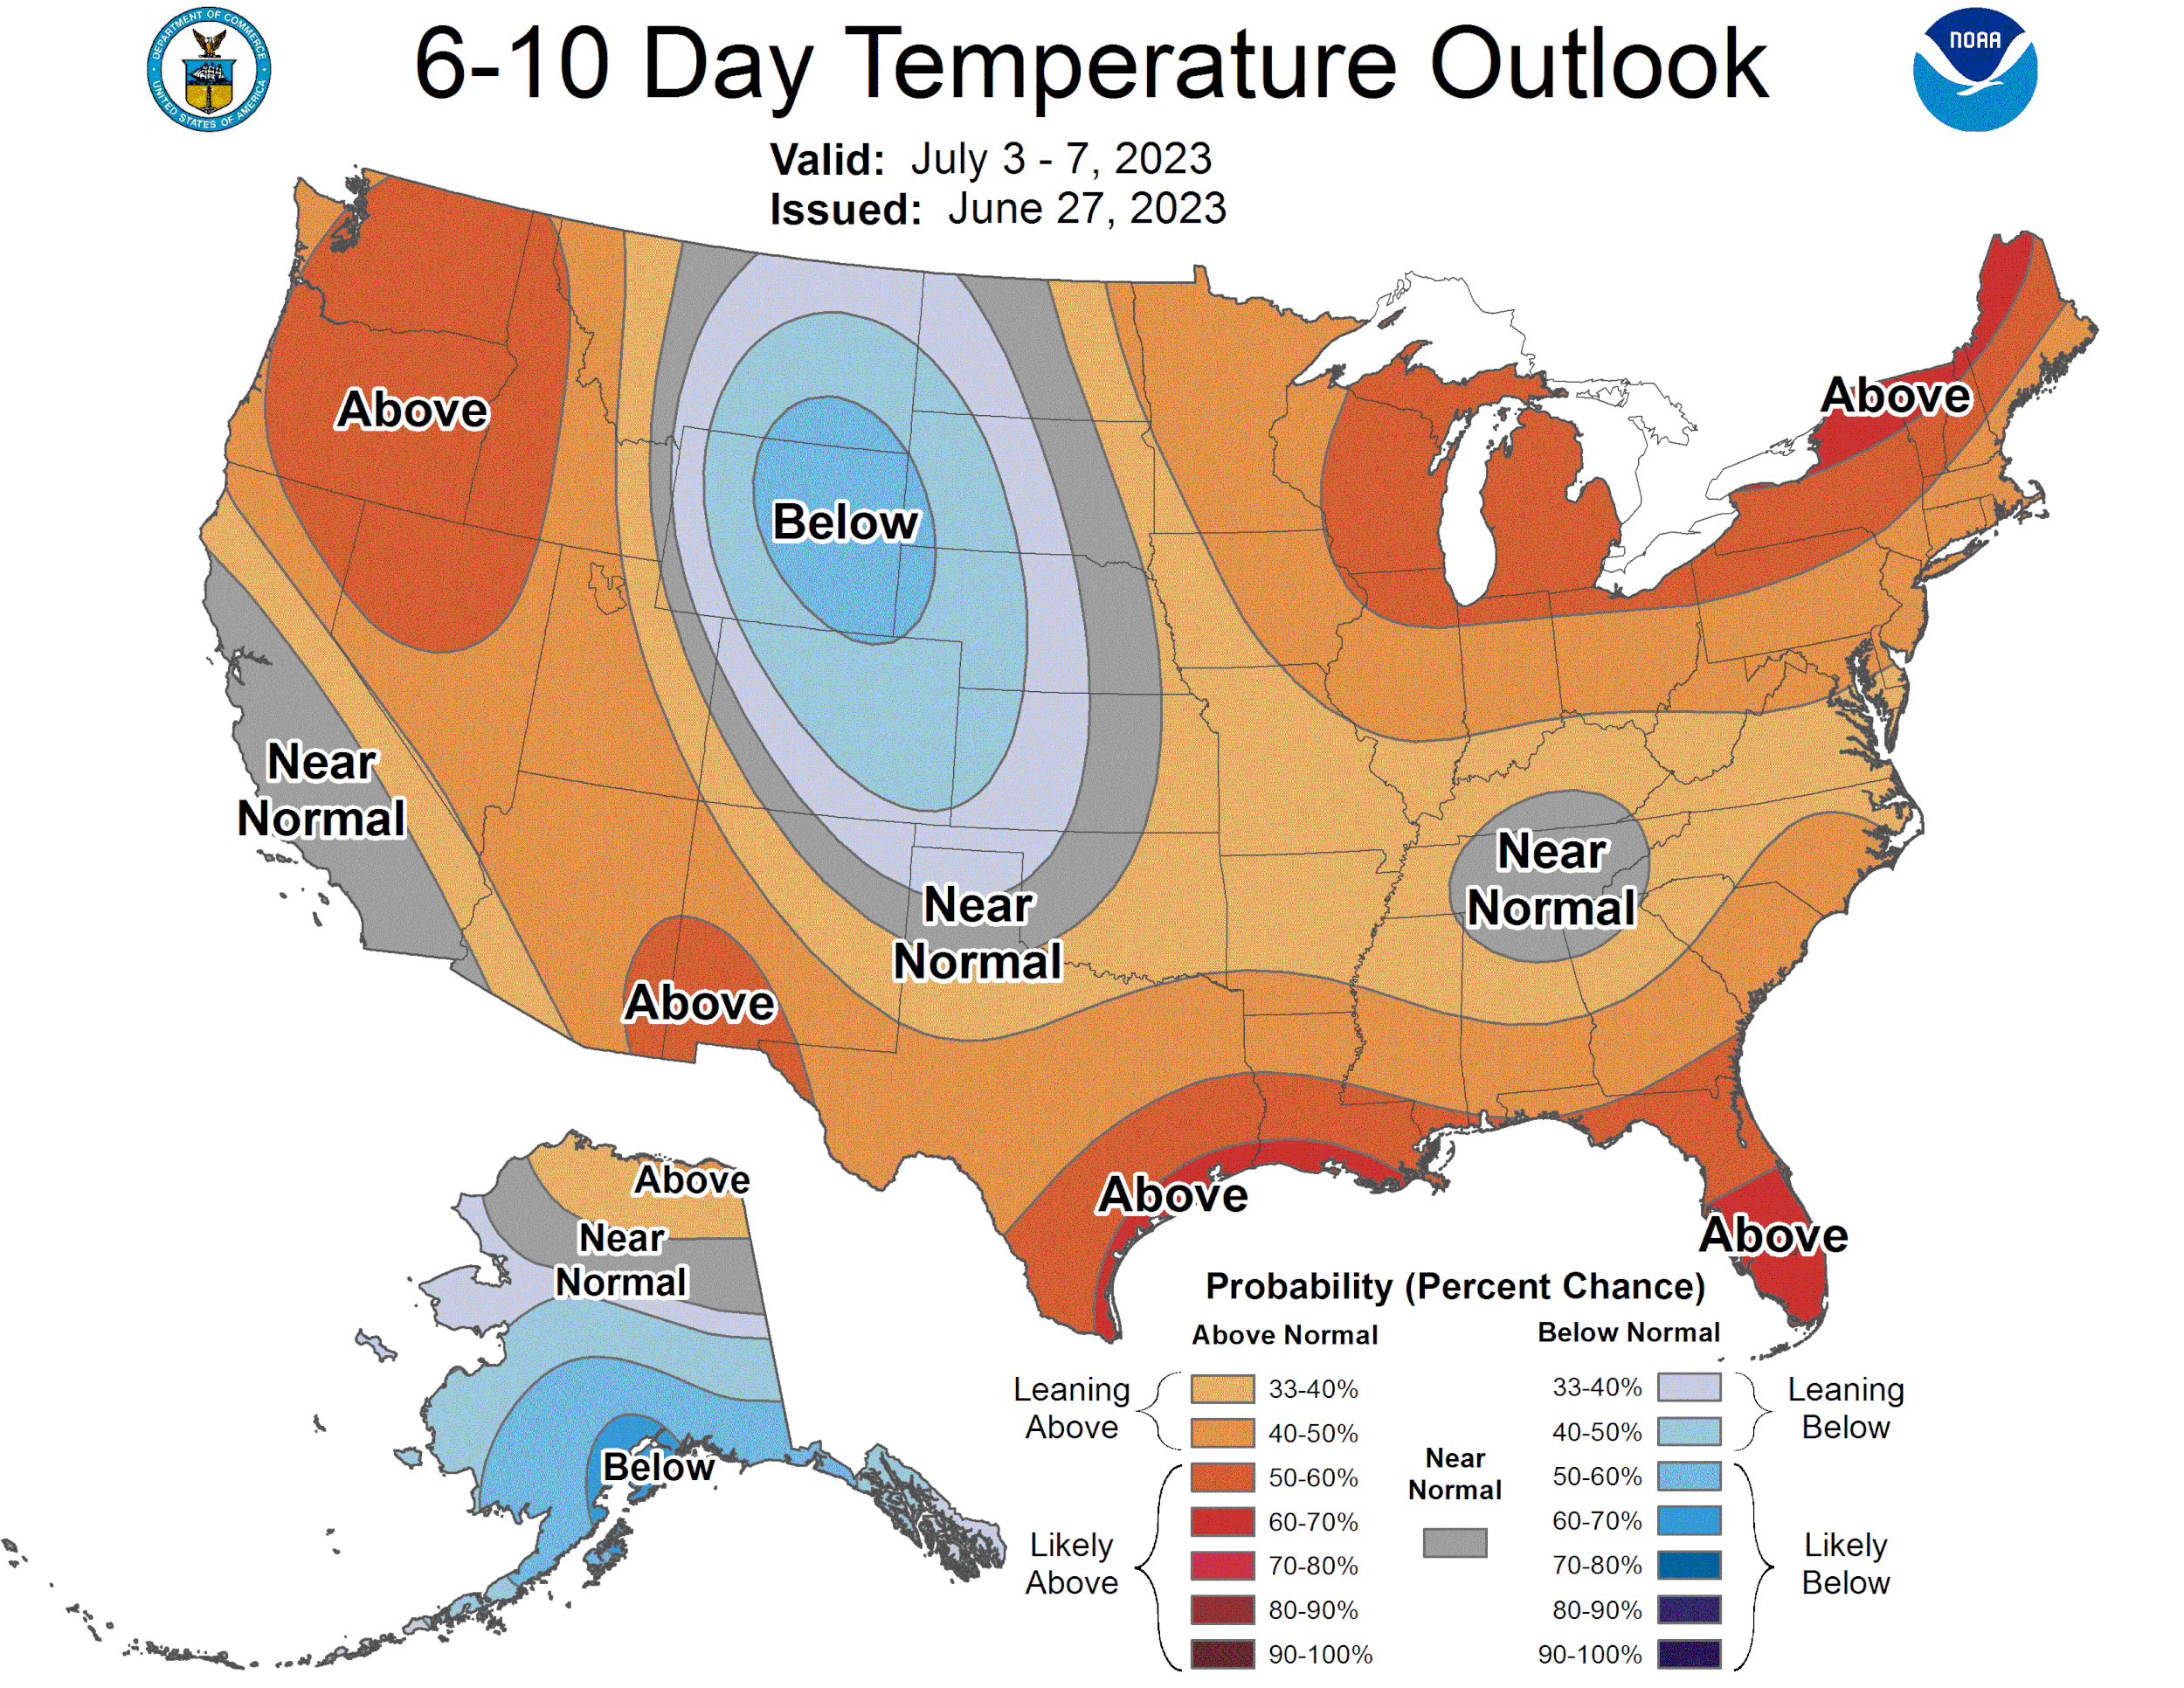
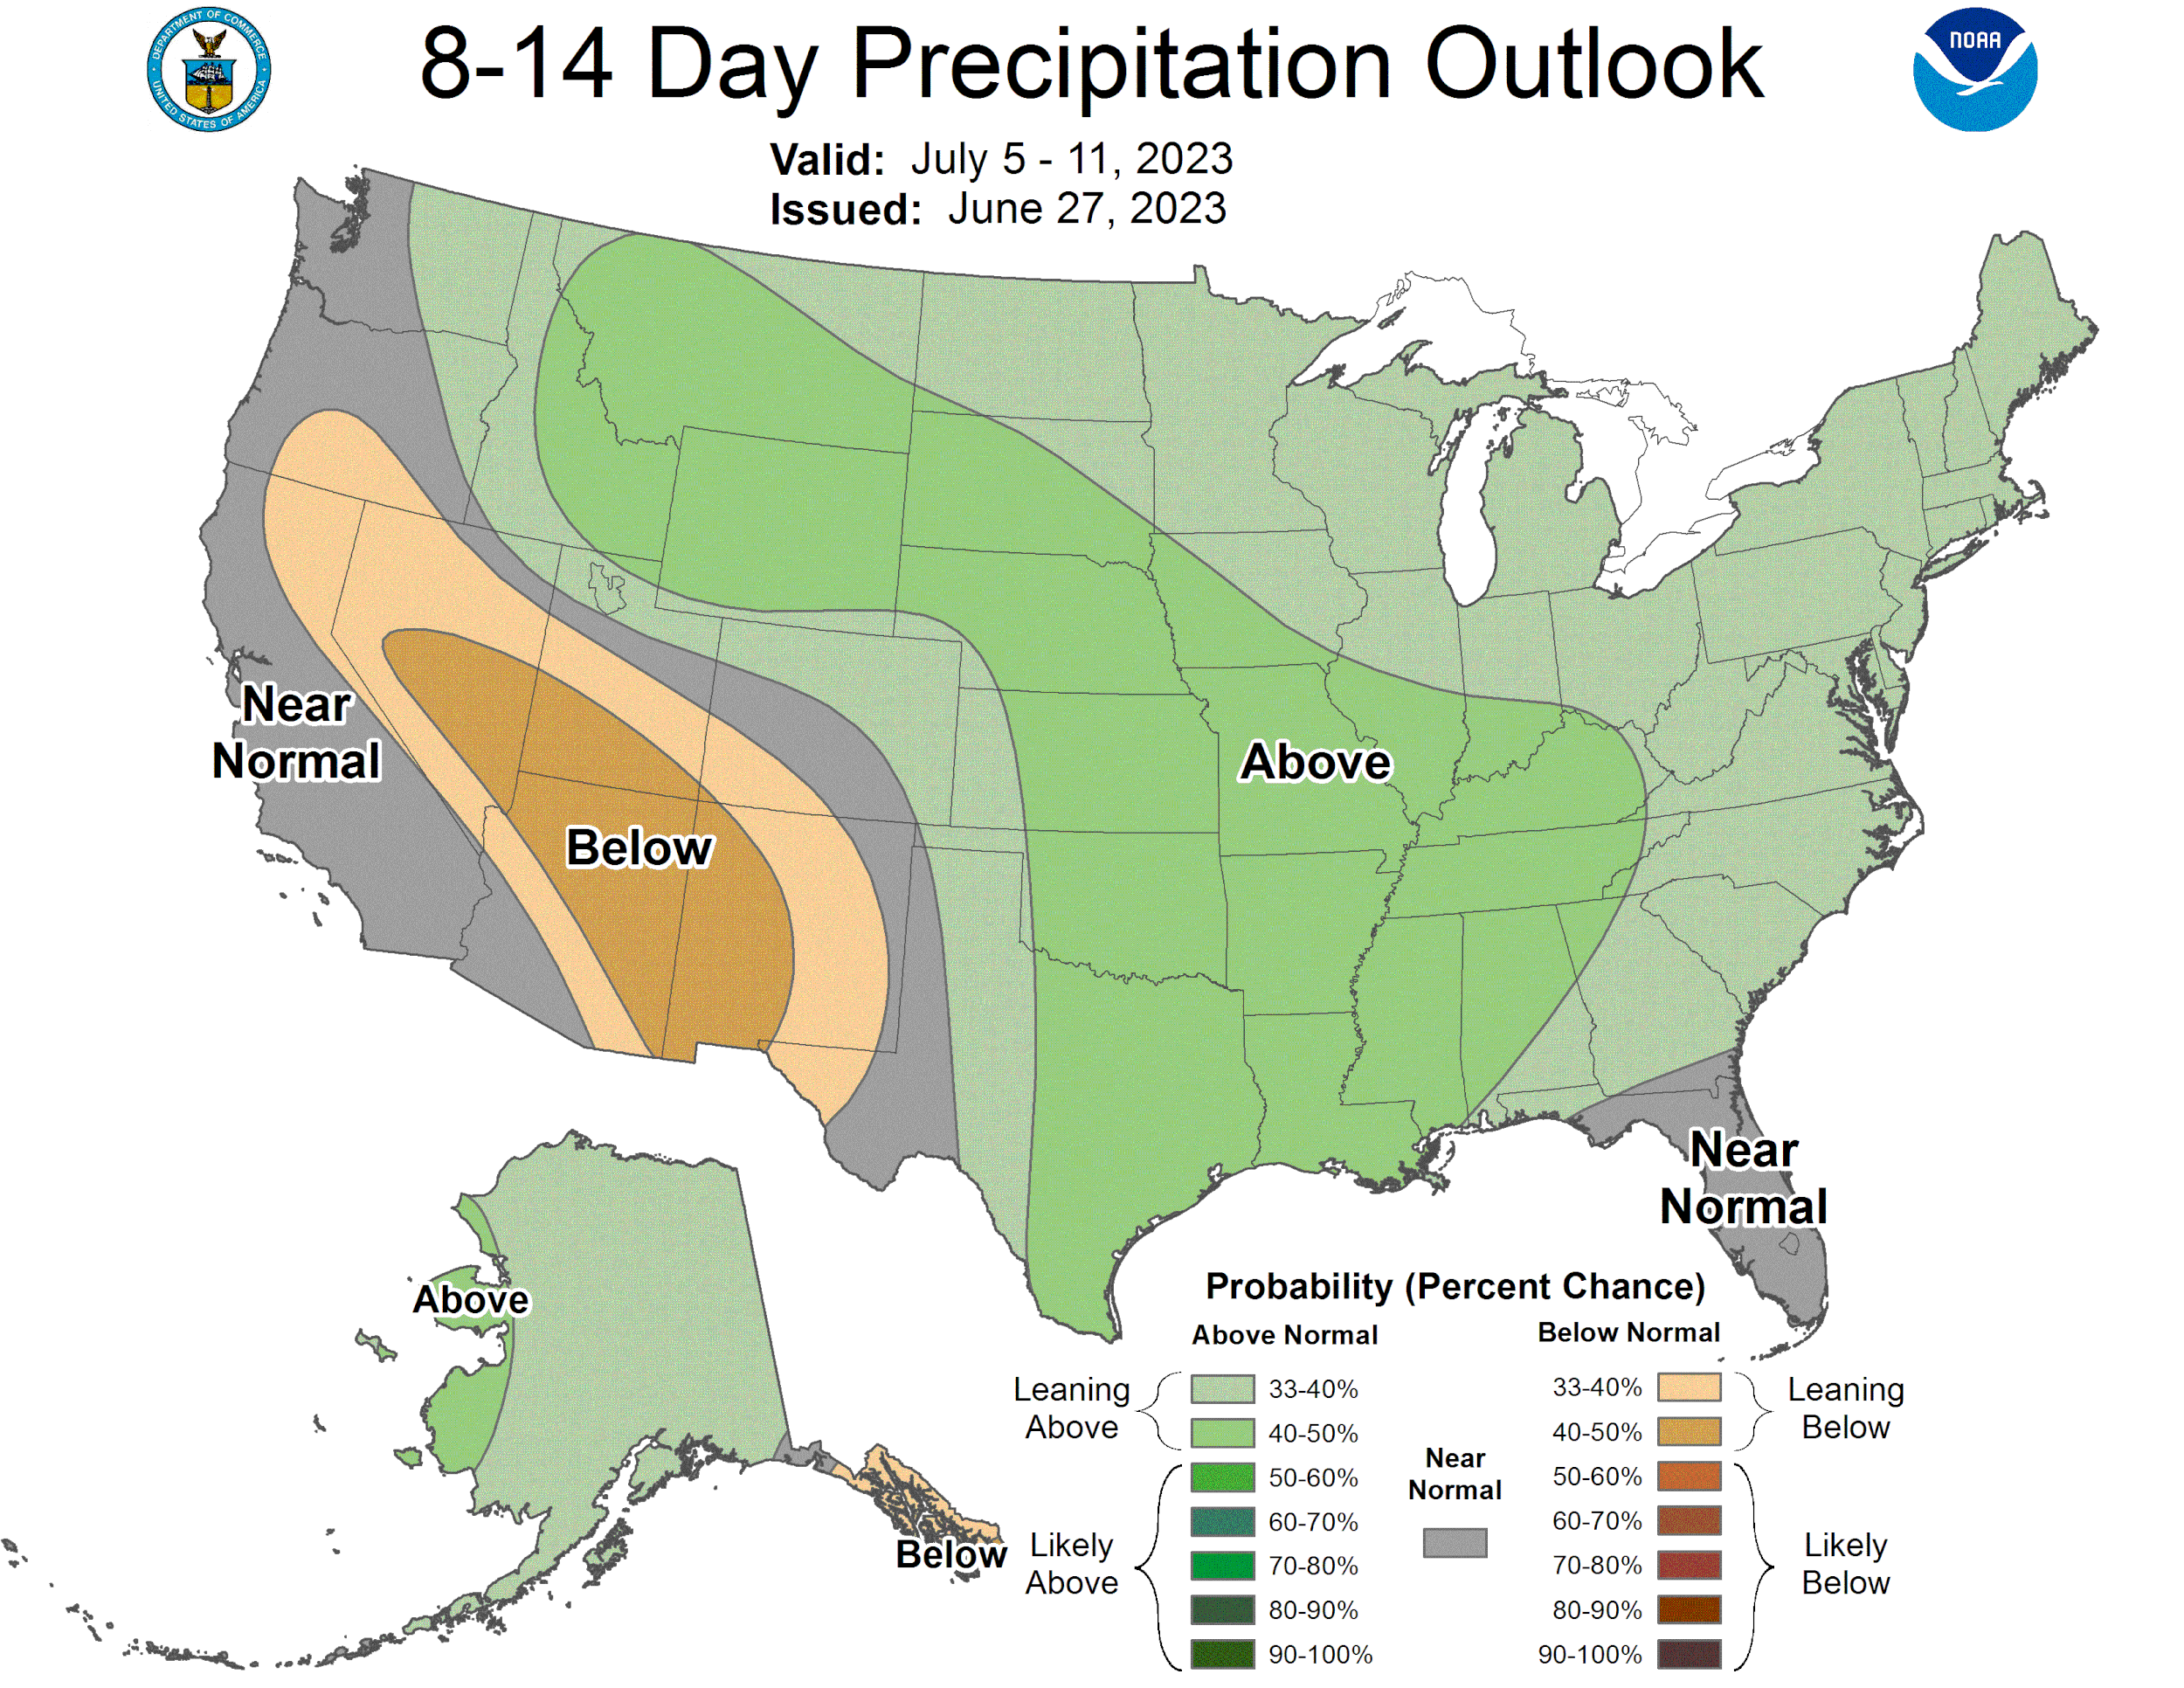
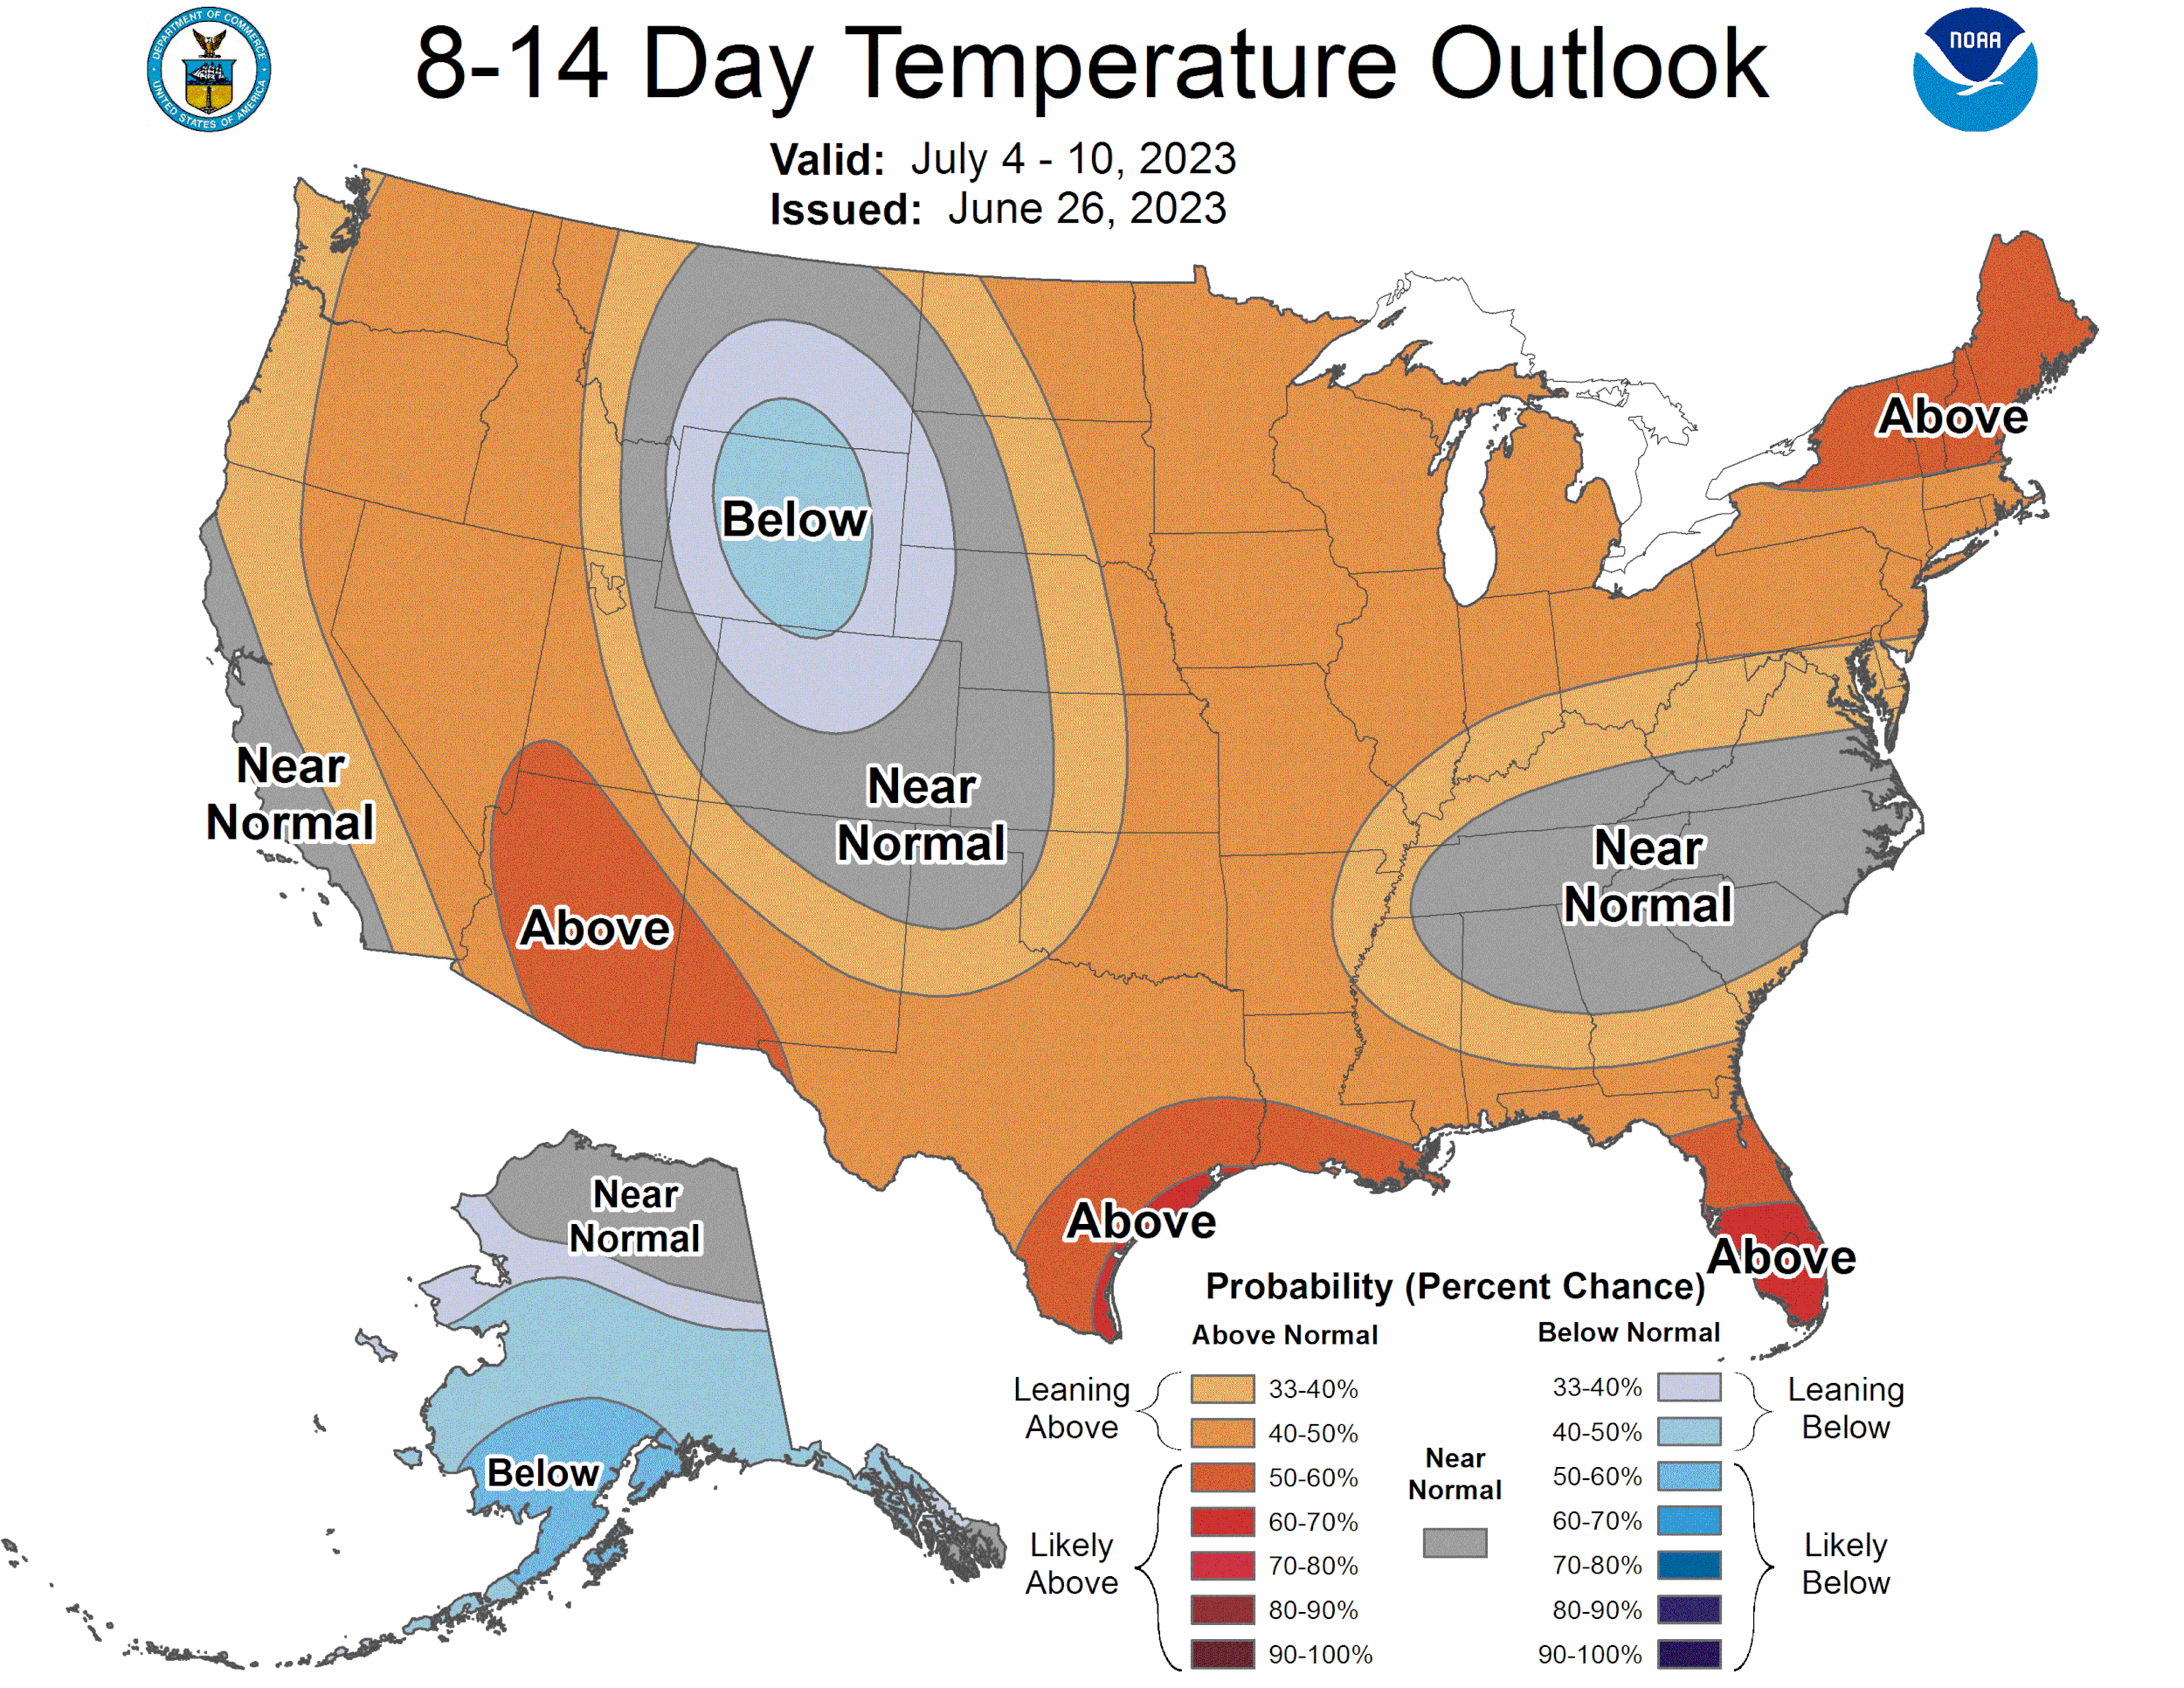
So why did the grains all take it on the chin if the conditions were so bullish yesterday? The only reason is the forecasts. Not rain that fallen. The forecasts. As they are showing the entire Midwest receiving 1/2 to 1 inch of rain next week. We also have the USDA report Friday that has some people nervous.
Here are the forecasts:
Crop Conditions
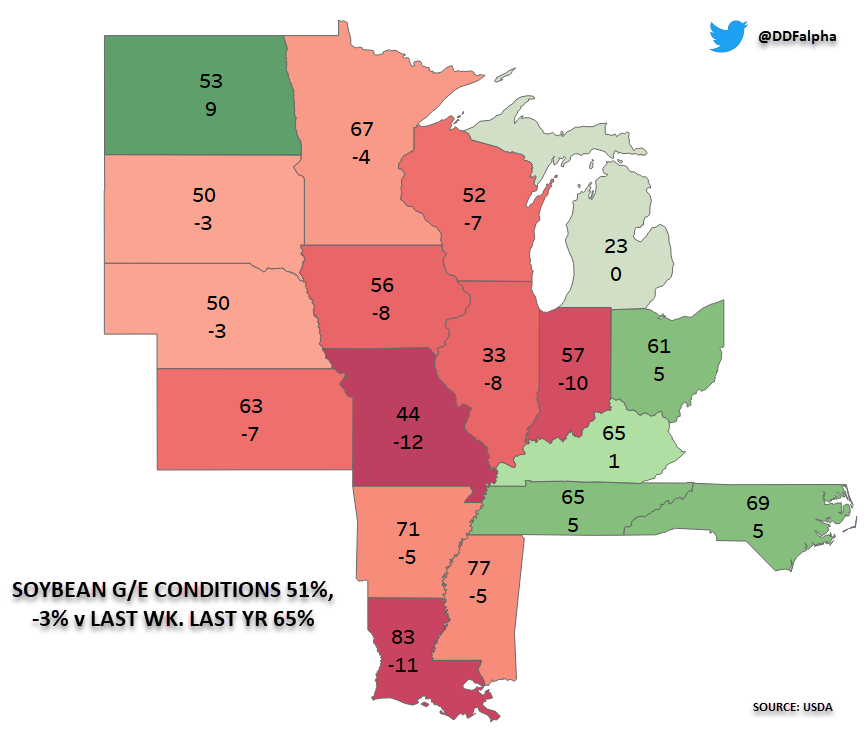
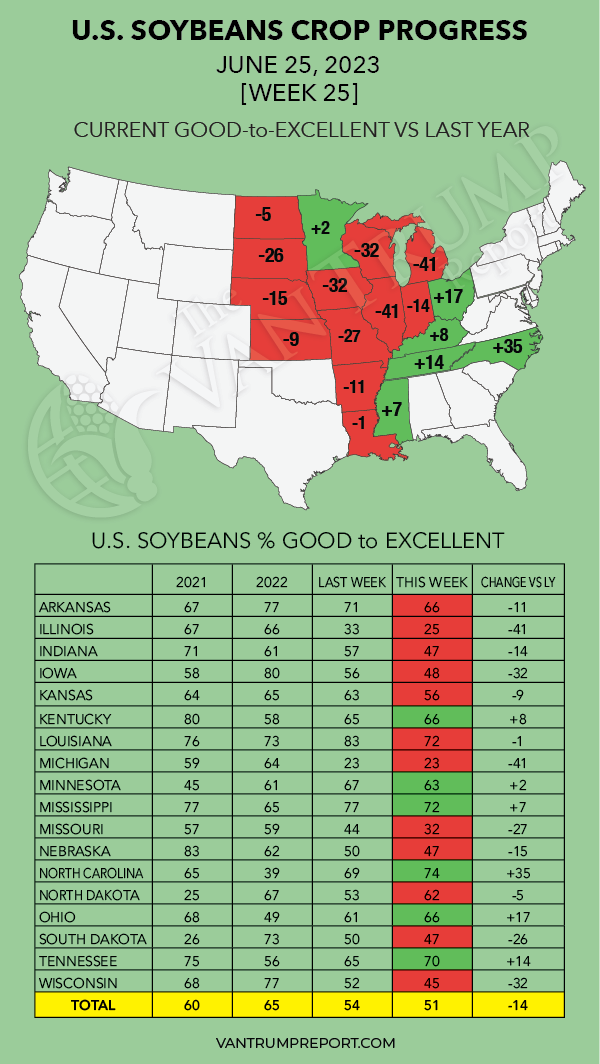
Here were the crop conditions released yesterday after close.
Corn 🌽
Beans 🌱
Today's Main Takeaways
Corn
Corn futures smacked around again today. Posting their 4th straight say of losses following our recent massive rally. We have now given up roughly half of our rally. As July loses another 27 cents today.
One might have thought that with the awful crop conditions yesterday, to go along with really just a lack of rain in the midwest in areas where we need it. That the markets would’ve been well supported today. But that wasn't the case. As the markets are solely focused on the upcoming forecasts and potential rains.
We did receive some rains over the weekend, but they were not a total game changer and certainly didn’t bust this whole drought. If those rains were drought busting showers, the crop conditions yesterday would have showed us that. But again, they came in lower. Further supporting the fact that the rains weren’t enough in a good portion of areas such as Illinois.
The markets deciding to trade the forecasts rather than the facts might be a mistake. As crop conditions haven’t been this bad since 1988, and it's not even close. With the next closet year being 2012 where they were 55% rated G/E. Our corn index score is the worst it has ever been for this week since 1988. Illinois's crop is the worst on record for this time, as they are also the shortest moisture they have ever been since they began tracking. I broke down these numbers in yesterday's write up which you can view HERE in case you missed it.
Corn has broken 70 cents off our recent highs from just last Wednesday. I think that move is far overdone to the downside, as it was just too fast of a move far too soon with an entire growing season ahead of us.
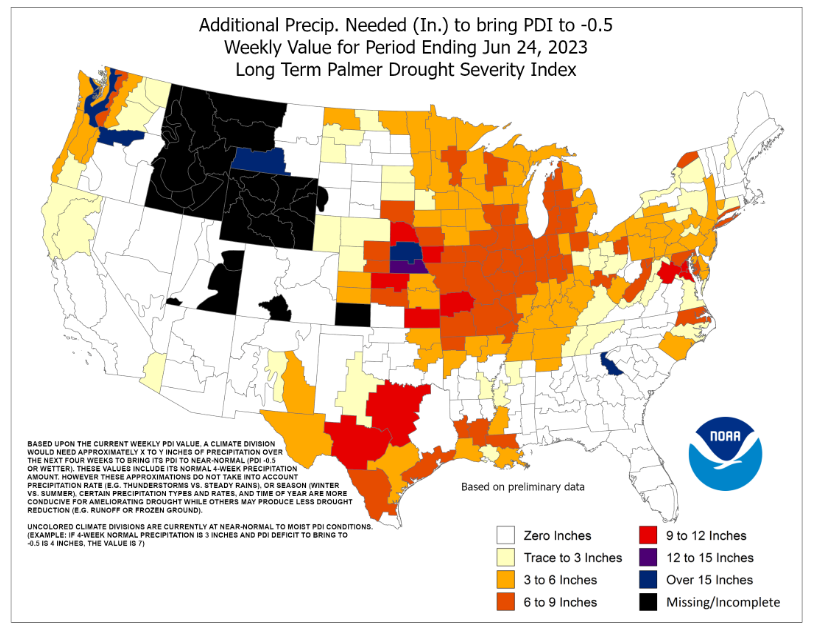
How much rain would every area need to break the drought?
Here is a map that shows how much rain each area needs to be back to normal.
As you can see, a large portion of the corn belt and I-states need a lot of rain. 3 to 9 inches.
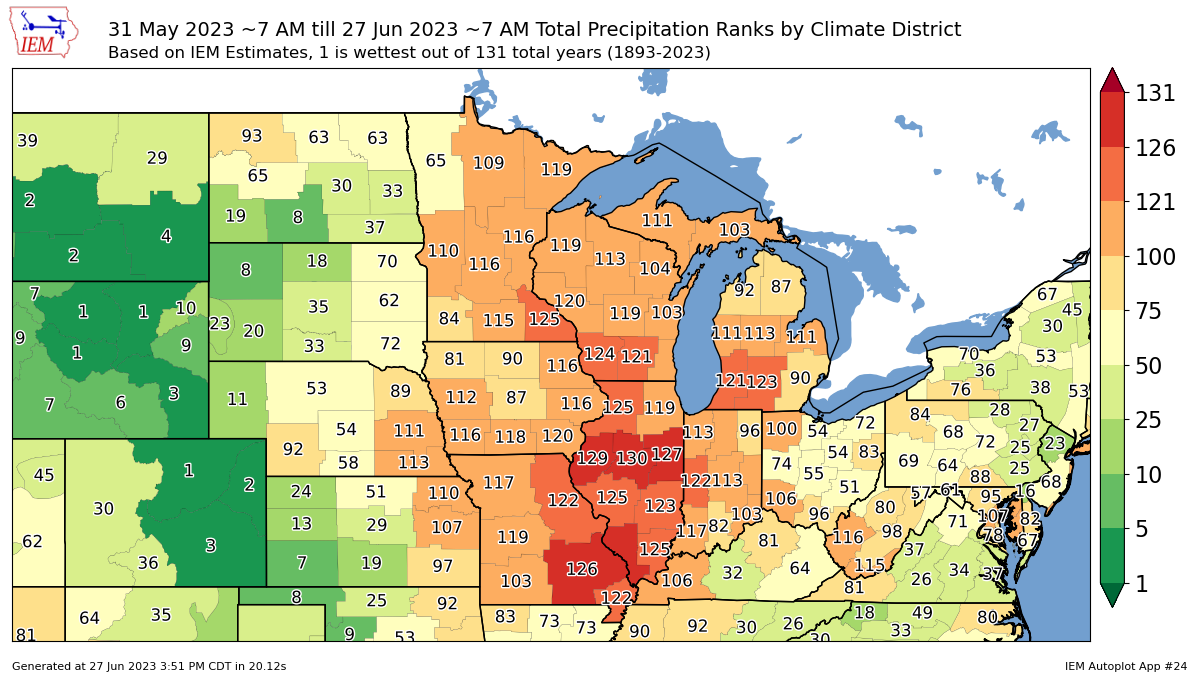
Here is a map that shows how this past 4 weeks have ranked up to the previous 131 years in terms of precipitation.
Taking a look at the USDA report Friday, this will be a big one. The USDA's got our yield still at 181.5 bushels per acre. There is no possibility that we get anywhere near that. How big of a cut will we see? Nobody really knows what the USDA will do. They tend to slow play these things and not flat out say how bad things really are. The trade is already pricing in something around the 175 or so range. We will have a more in depth USDA pre-review later this week.
Last year was 173.3 bushels an acre. Personally, still don’t think we have any chance to even hit that number. Sure we do indeed have a chance to see some rains, which could drastically improve the crop situation. But we can't ignore just how bad this year has already been. We are in so much worse of a place than we were last year and it's not even close.
This next map from the Van Trump report is a good indicator that we are far worse than last year. Somehow the USDA thinks we are 8 bushels an acre higher.
Illinois is 44% worse than last year. Iowa is 24% worse. Missouri is 38% worse. Indiana is 12% worse. Michigan is 41% worse.
Wright on the Market had a great write up this morning. Here is a snippet of it:
"If the rain comes next week, that rainfall is already priced into the market today.
What is far more important to you is how much rain falls the three weeks after next week.
We do not know. You do not know. The weather people do not know and they disagree.
Here is what we do know:
A market always provides a 2nd or 3rd opportunity to sell near the highs during the growing season.
There is a lot of really good corn and beans and there is a lot of very poor corn and beans. Illinois has more poor corn than good corn."
*Scroll to end of today’s write up where I include another great write up from them talking about risk management.
I completely agree. The market is already pricing in rain. Rain that hasn't happened yet. So if that rain does come, a good portion of that is already priced into the markets. So what happens if that rain doesn't fall? Well, that gives us a very good chance to see our markets pick back up steam and push higher.
It all comes down to weather. The corn crop will be be made or broken in the next 3 to 4 weeks. We will have to see what rain falls, and what doesn’t. I think there is more upside rather than downside here, but that doesn't mean that this is the bottom. Listen to this morning's audio in case you missed it. We go over puts, calls, and ways to make money no matter what direction this market goes. Listen Here
At the end of today's update I also include another good write up from Wright on the Market. He essentially says that it is not a bad thing to make sales when you aren’t comfortable. Because if the market crashes, you look like a genius. If the market rallies, you can grab some put options and make money on the way down that you didn't make on the way up.
Taking a look at our chart, we sitting right near support. So I wouldn’t be surprised to see some strength here. If not, we look to the next support around $5.50 range.
Corn Dec-23
OUR MASSIVE OFFER ENDS TONIGHT
The biggest sale we’ve offered ended yesterday. We extending it one final day in case you missed it. Receive every single one of our exclusive updates via text & email. (Scroll to the end of today’s write up to view past updates you would’ve received)
Unsure? Try a 30 Day Free Trial HERE
OFFER: $299/yr or $29/mo
NORMALLY: $800/$80
Become a Price Maker. Not a Price Taker.
Soybeans
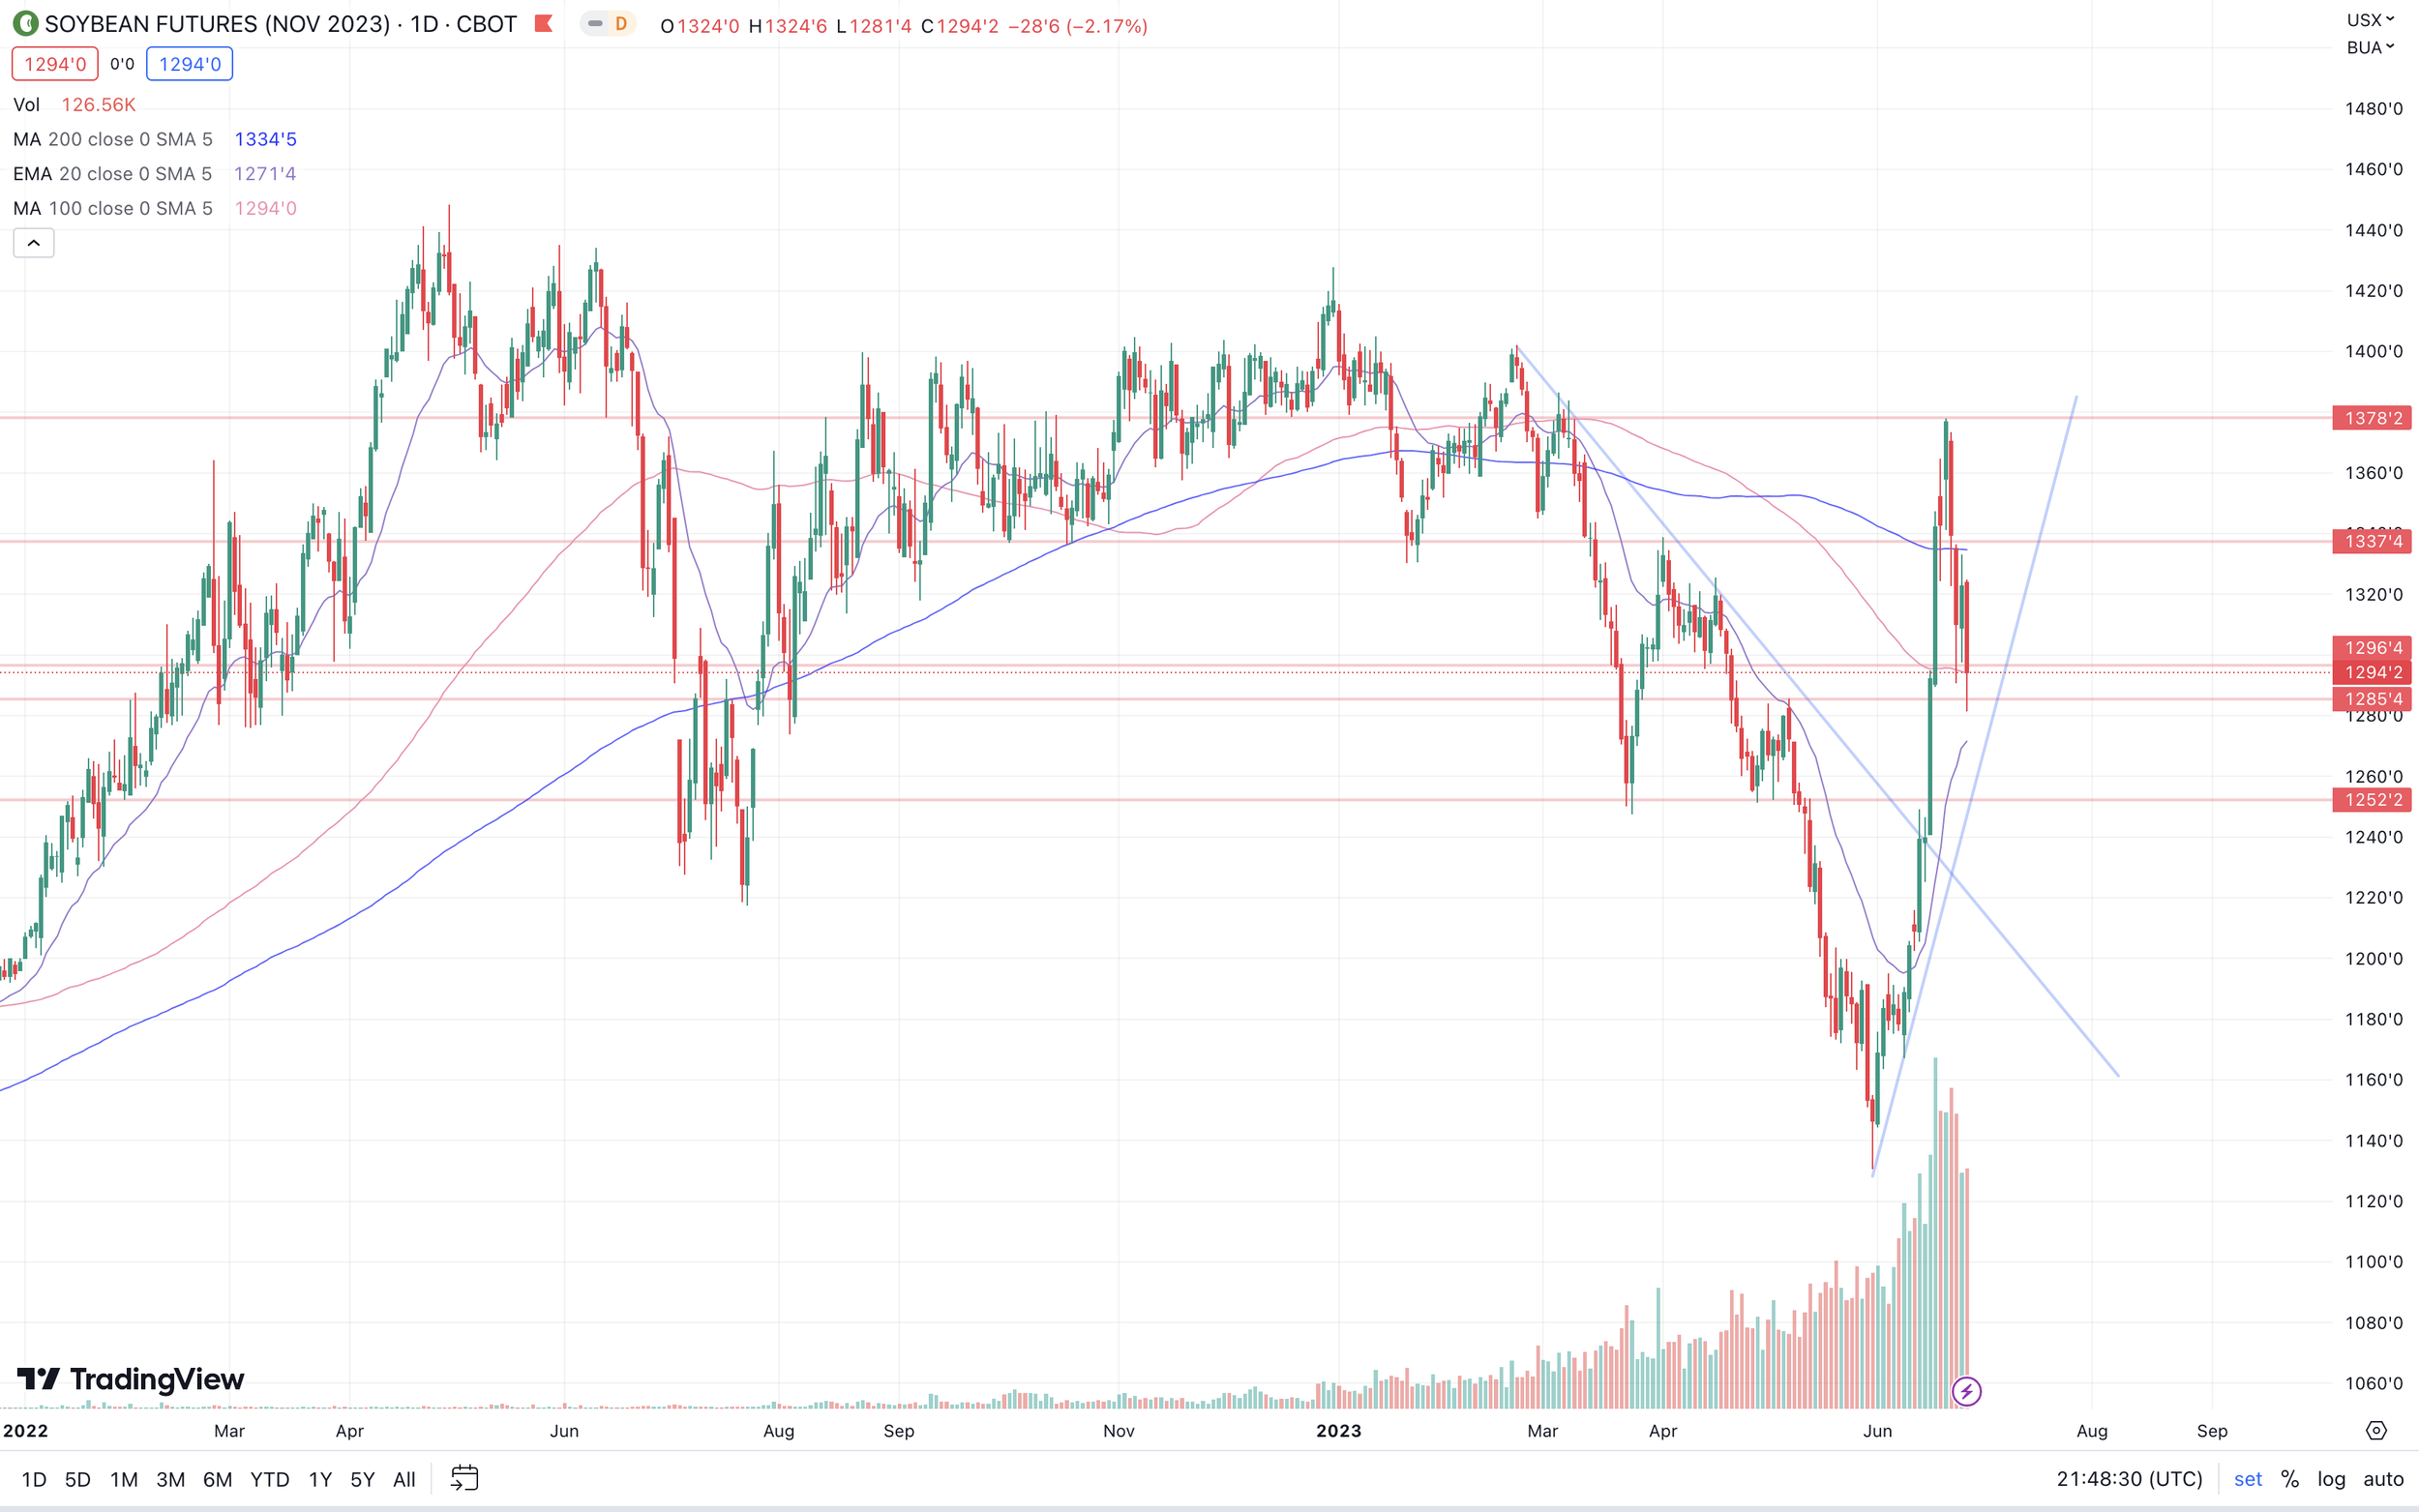
Soybeans get hit hard today following their strong day yesterday. Giving back the majority of yesterday's gains.
The weakness today doesn’t make a ton of sense. Some people like to blame China on days like today, but that wasn't the case. As corn and beans in China both traded higher today. Today’s price action was even more of a head scratcher given the fact that we had a strong day yesterday, then last night crop conditions come in at the worst they have been in 30 years yet we see weakness.
As mentioned yesterday, conditions came in at 51% rated good to excellent. Down from 54% last week but was on par with expectations so no real surprises, but nonetheless, awful ratings.
Illinois is that state that stands out. Sitting at just 25% rated good to excellent. A whopping -8% decrease from last week. Keep in mind, the top producing state started the year at 51%. Iowa is down to 48% from their initial 70% rated G/E. Ohio is the only state higher than initial numbers. Up 1% to 66%.
Just like I wrote about in the corn section. It all came down to the forecasts today. Some models show the Midwest getting quiet a bit of rain next week. How much of this rain will fall? Who knows. The forecasts have been anything but consistent especially when taking a look at the longer term ones.
Taking a look at the USDA report Friday, the USDA has yield at 52 bushels per acre. It is still al little early for both but I think that number is at least sub-50. Sure, we have an entire growing season and potential rain, so there is time for improvement. But we also have to account for the damage that has also been done. Especially to our top producing states such as Illinois and Iowa.
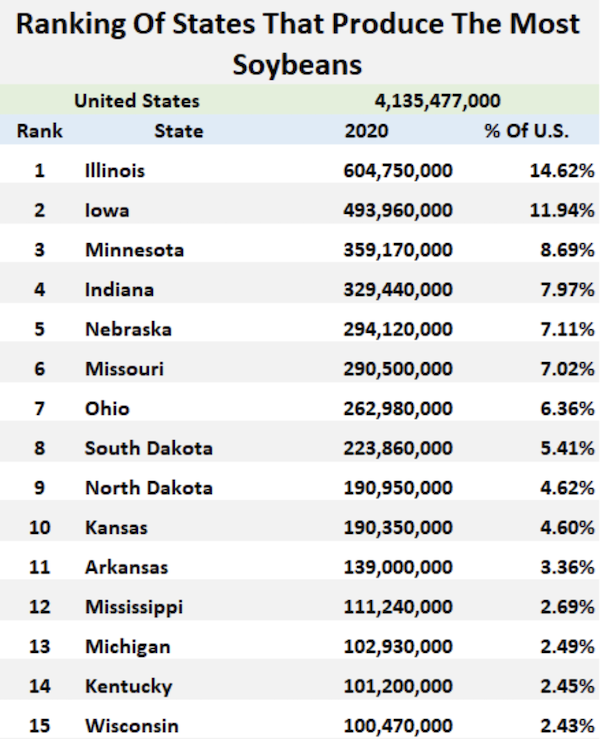
Below are two graphics from the Van Trump Report. The first shows the ranking of producing states. The next is simply this years crop conditions compared to last year.
Who are out two top producers? Illinois and Iowa. Making up roughly 17% of all production in the US.
Who has seen the most damage thus far? Illinois and Iowa.
Going forward, if these rains hit we could see some more downside. But a lot of that will already be priced in if they do. If they don't hit is where the story gets interesting. Still think we have more upside rather than downside, especially when taking a long term look at beans.
Soybeans Nov-23
Wheat
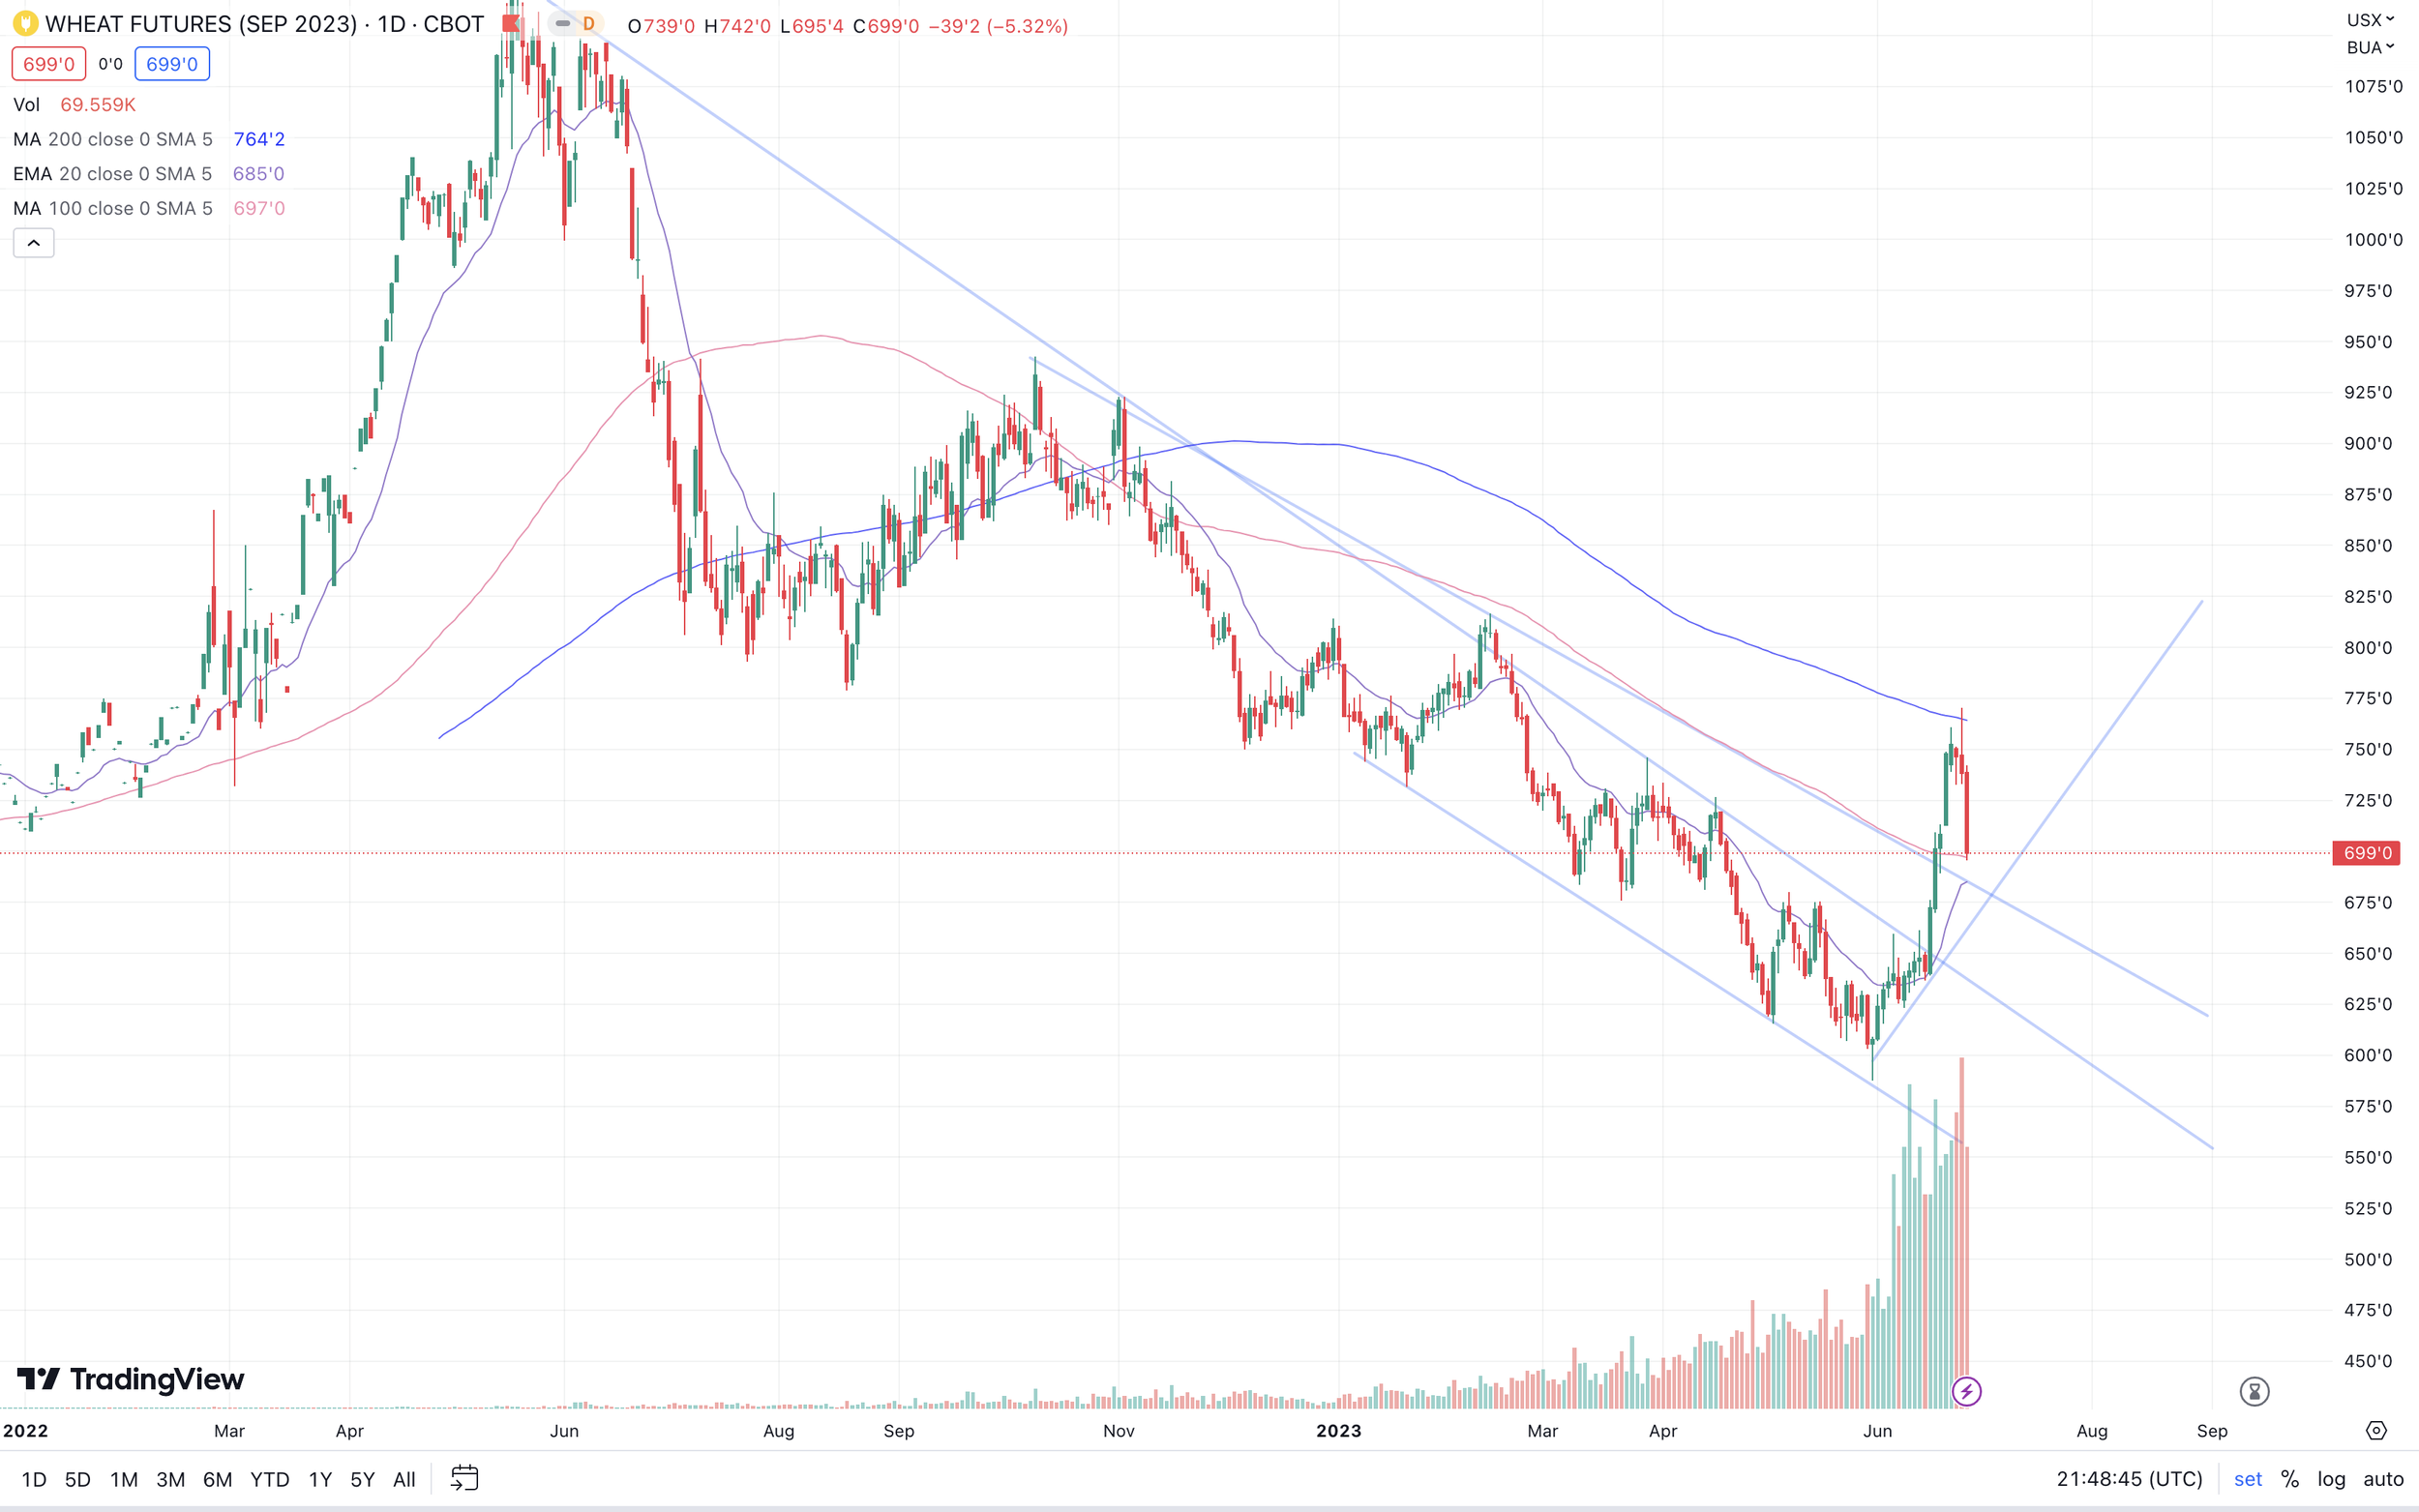
Wheat futures join the rest of the grains on today's heavy sell off. Chicago got hit the hardest out of all of the grains today, getting smacked 39 cents, as September broke below $7 and closed at $6.99.
Overall there isn’t a ton new going on in the wheat market and very little for bulls to chew on here, outside of the lower spring wheat ratings yesterday and the Russia headlines which the market has chosen to ignore.
Although the markets aren't concerned, the Russia situation is still very much an alive one. Some are talking that Putin is losing control and perhaps there is a potential civil war waiting to break out. This would limit exports and screw up logistics if it happened. Where will this situation go from here? Anyone's guess is as good as mine.
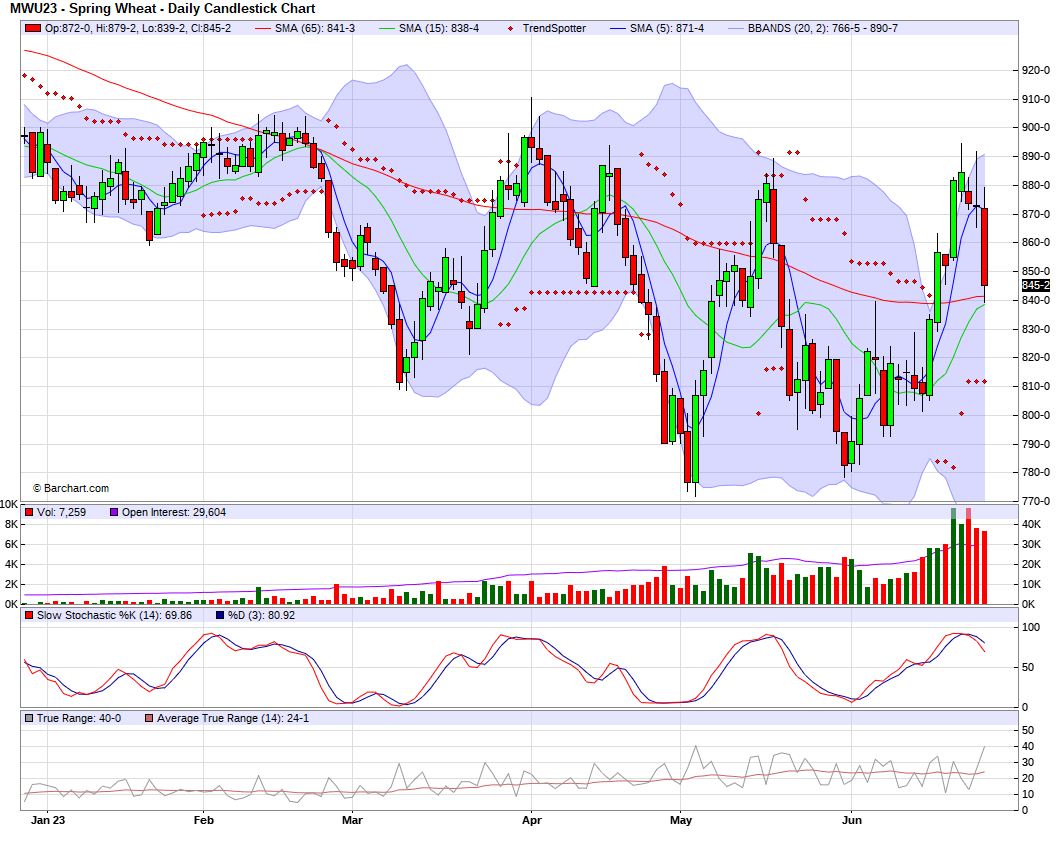
As mentioned yesterday, spring wheat ratings came in at 50% rated good to excellent which was 1% lower than last week. This was a surprise because most has anticipated this ratings to actually improve not decrease.
Winter wheat harvest is also running behind. As the numbers yesterday showed it sitting at 24% complete vs last week's 15% and our average pace of 33%.
The wheat market is a tough one to navigate. The funds are still very short. We have a war. We have global weather concerns everywhere. But global competition and cheap Russian exports has also been keeping a lid on rallies.
Taking a look at the charts, Chicago still sits in an uptrend, but wouldn’t be surprised to see some more downside before finding support. Overall, the wheat market could still be a sleeper with most of the focus on corn and beans and all of the global weather issues.
Chicago Sep-23
KC Sep-23
MPLS Sep-23
Risk Management
From Wright on the Market,
There is no reason that if you price your corn, beans or wheat any day, including today, that it needs to be the end of the opportunity to gain more income from that crop.
We have had clients since last fall who:
Sold on HTA and lifted the hedge.
Bought calls at the end of May and made 50¢ to $1.20 per bushel,
Bought puts last winter and sold them in April, May and June.
Wrote options that have expired worthless, making a nice profit.
Bull spread May/July corn.
Bull spread July/September corn.
Bear spread meal/oil.
Bull spread meal/oil.
Bull spread wheat/corn.
And more…
At least a hundred times last fall and winter, when clients asked Roger if they should sell, he told them:
I think prices will go higher, much higher. But I may be wrong. Why take the chance? Sell everything you got now. If prices go down and stay down, you will be a genius and much better off financially because you eliminated your market risk. But if prices do go much higher, you can and should buy put options and make the money on the way down you did not make on the way up. With put options your potential loss is very limited and the potential income is huge.
To improve your marketing, you must do some things you have never done before. One of them is using options to keep the profit window open after reducing or eliminating your market risk.
Now, read those last two paragraphs again. That is exactly what Roger’s advice is to all of you today.
Top States & Yields
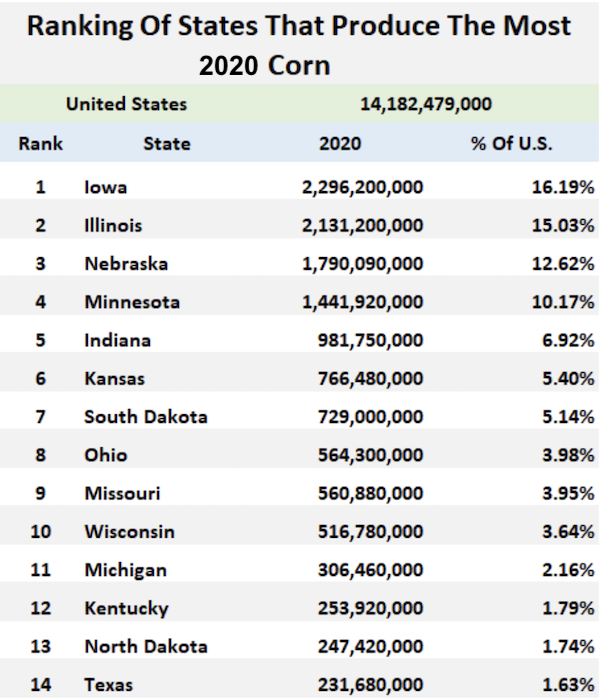
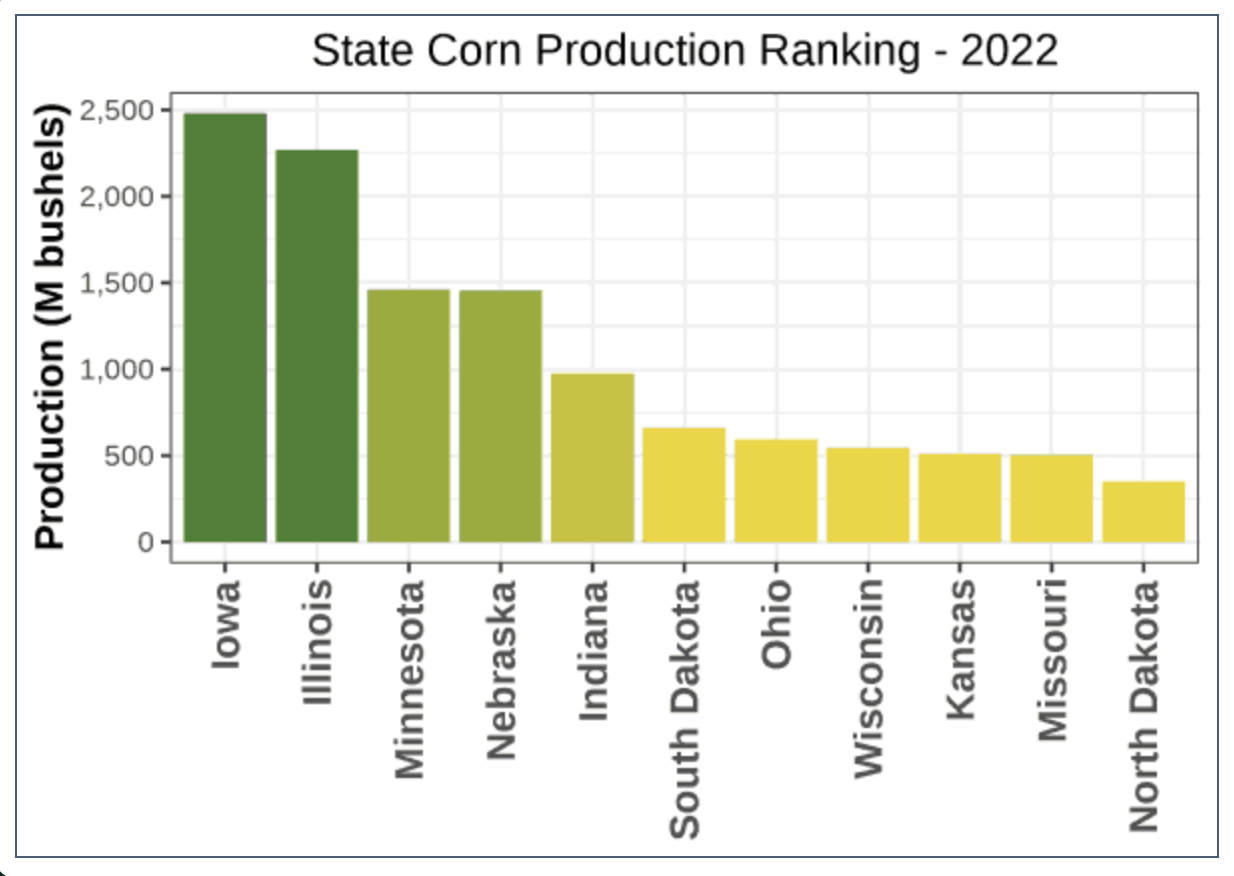
I included below a graphic from 2020 and 2022 that shows top state production. As you can see the top-5 corn-producing states rarely ever change their position, but depending on weather and variable circumstances the next several ranking states can often move around on the list from year-to-year.
I thought looking at two different years would give you some comparison.Pay close attention to the top-5 producing states which make up more than +55% of our total production.
Many inside the trade will argue, how those top-5 states tends to go the national average yield. If that is actually the case, I could see a more sizable yield reduction coming from the USDA vs. what the trade seems to be anticipating. I think an average yield number somewhere between 170 and 175 is now currently in play. As a producer, I am staying patient in regard to pricing more estimated new-crop production.
Hedging Account
No matter the situation you are in, our partners at Banghart Properties Grain Marketing can help you come up with a plan of attack to help you manage your risk. If you want help managing your risk you can give them a call anytime at (605) 295-3100 or set up a hedge account below.
Check Out Past Updates
6/27/23 - Audio
DID WEATHER TREND CHANGE?
6/26/23 - Market Update
WERE THE RAINS ENOUGH?
6/23/23 - Market Update
HEALTHY CORRECTION OR END OF RALLY?
Read More
6/23/23 - Audio
EXTREME VOLATILITY & WEATHER MARKETS
6/22/23 - Market Update
BEANS PULLBACK & DROUGHT CONTINUES
6/22/23 - Audio
DON’T FEAR THIS VOLATILITY
6/20/23 - Audio
VOLATILE MARKETS
6/19/23 - Audio
CORN SUPPLY RALLY
6/16/23 - Audio

