
FAILED REVERSALS & ELECTION YEAR RALLIES?

Overview
Grains finally get some follow through strength to start the day. As today was essentially the first day of the year where we managed to take out the previous days highs.
This came after all the markets posting fresh lows yesterday before rallying to end the day.
However, the soybean sellers win once again today. As both corn and soybeans closed well off their highs and soybeans closed the day fractionally lower.
Overall some "signs" of reversals, but nothing quiet yet for bulls to write home about, as we failed to confirm any reversals with the funds selling the rally.
Wheat on the other hand strings together 3 green days in a row in hopes of a reversal with short covering and strong weekly export sales.
Fresh news in the markets is lacking.
The key for prices will be the funds. Do they want to continue selling? Or is enough enough?
If the funds do decide to cover, it would result in a nice rally given they are sitting on some very heavy shorts across the grains. Yet to be determined..
Weekly Price Changes
Mar-24 Corn: -1 1/2 cents
Dec-24 Corn: -5 3/4 cents
(March corn gaining on the December corn is a slightly positive sign)
Mar-24 Beans: -11 cents
Mar-24 Chicago: -2 3/4 cents
Mar-24 KC: -7 1/4 cents
Mar-24 MPLS: -4 3/4 cents
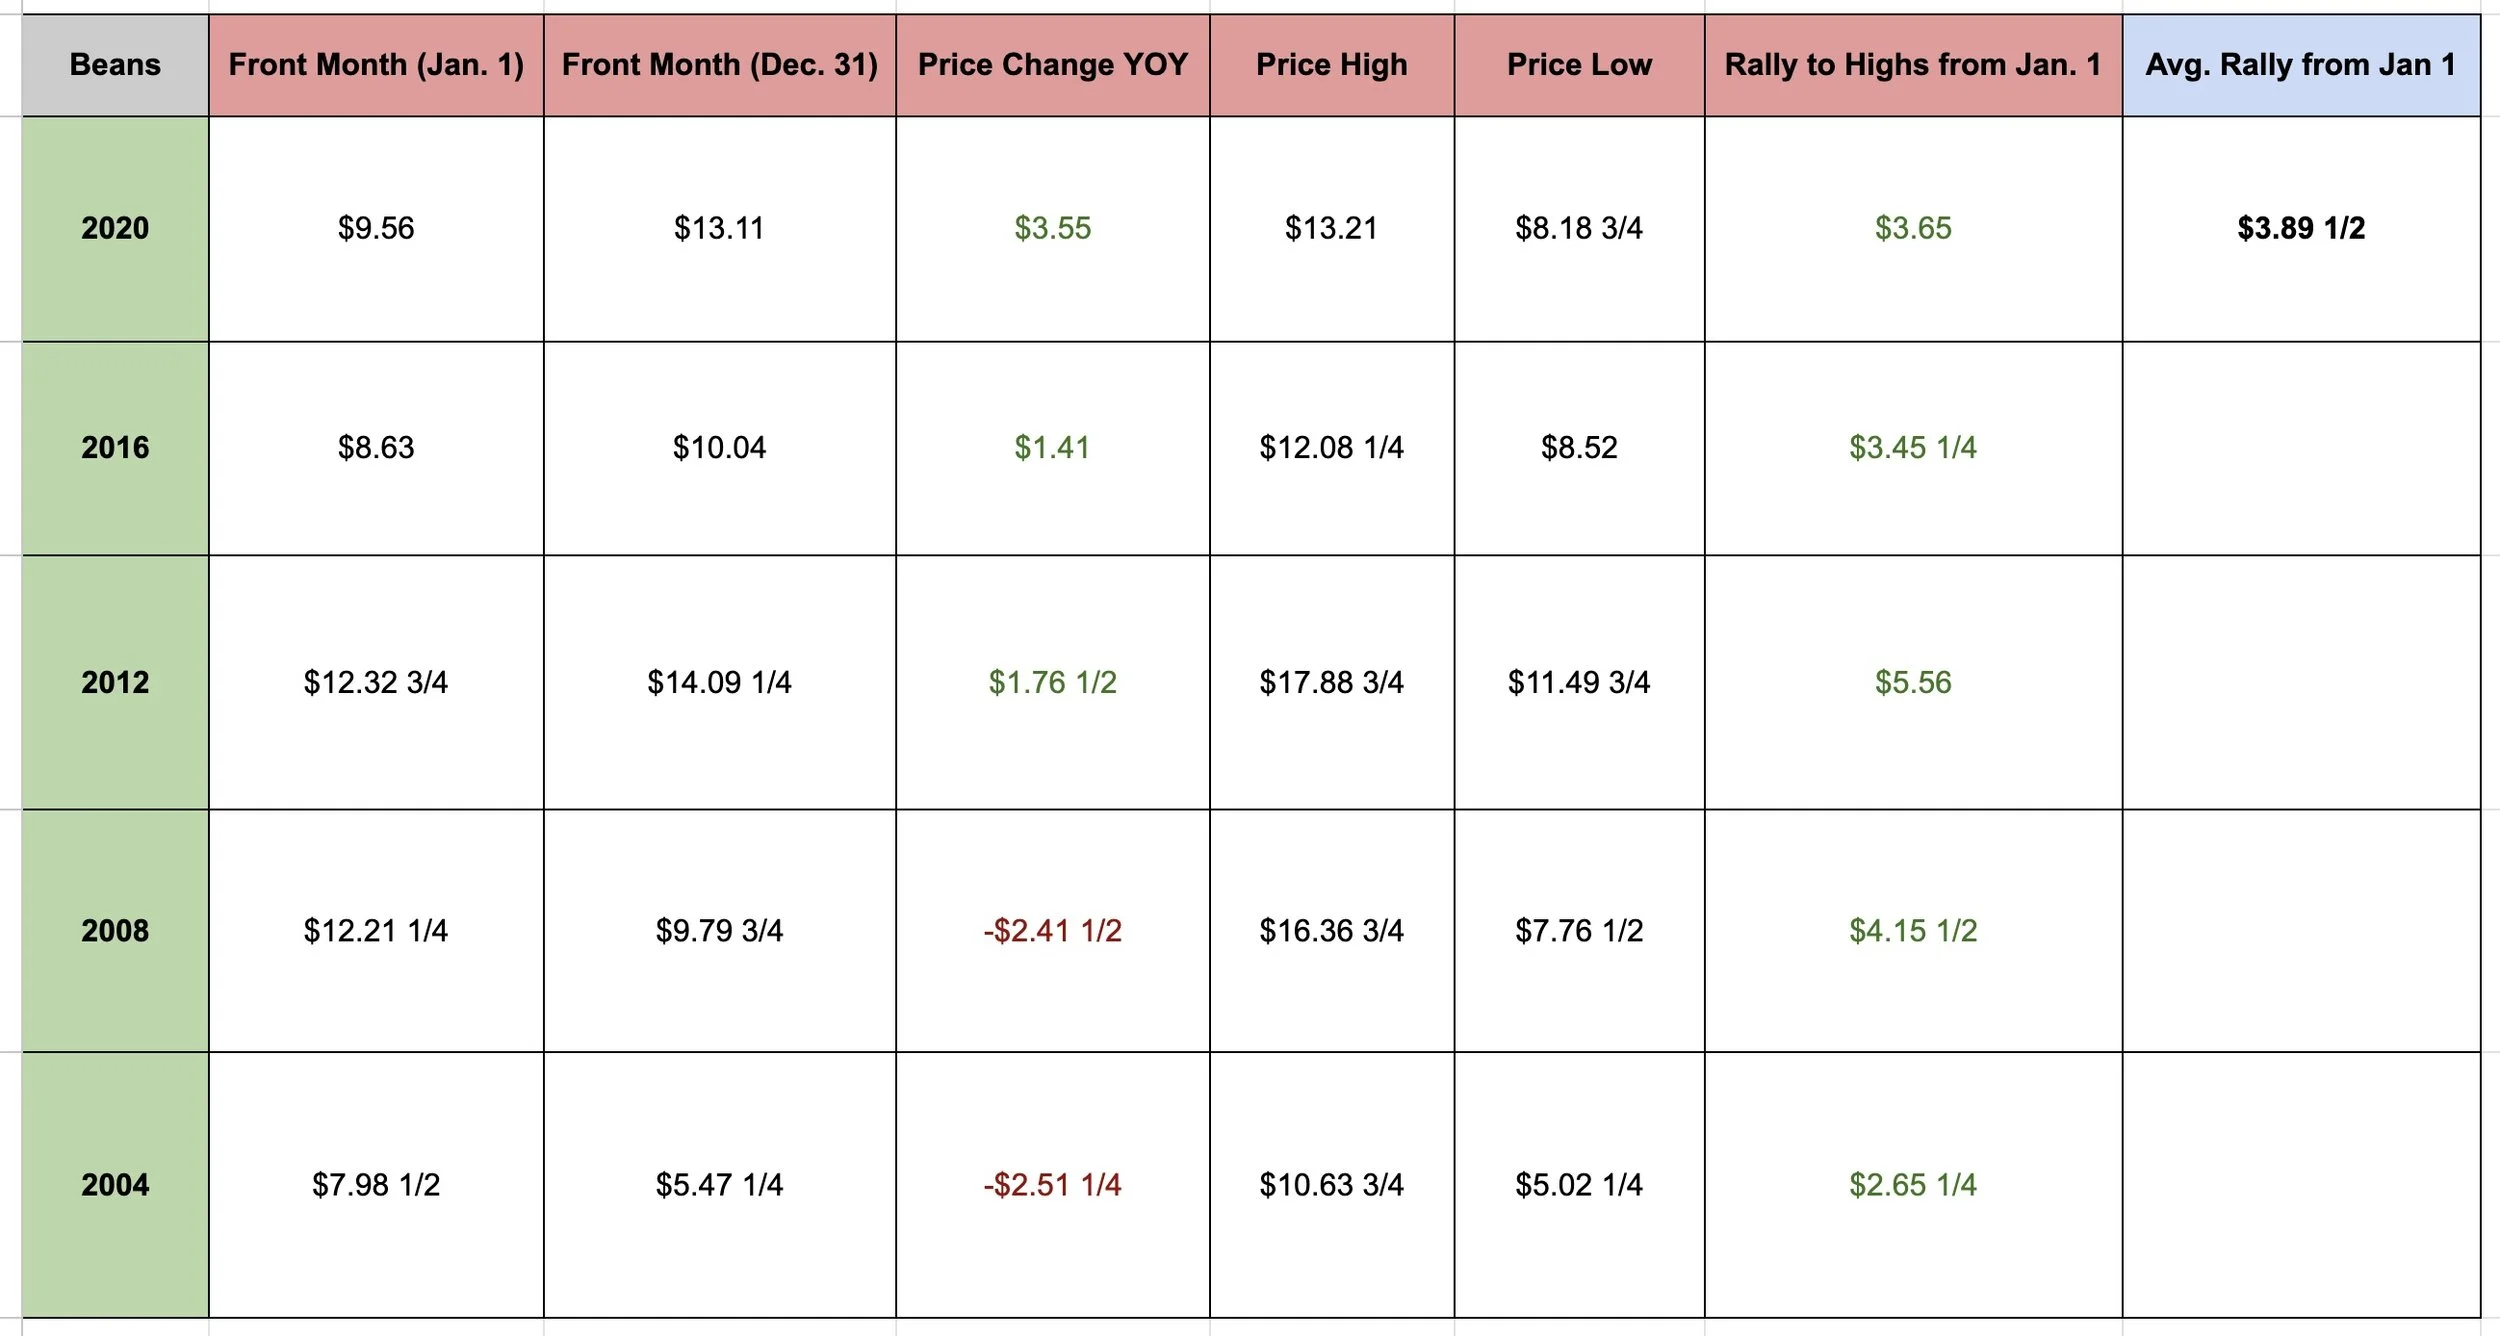
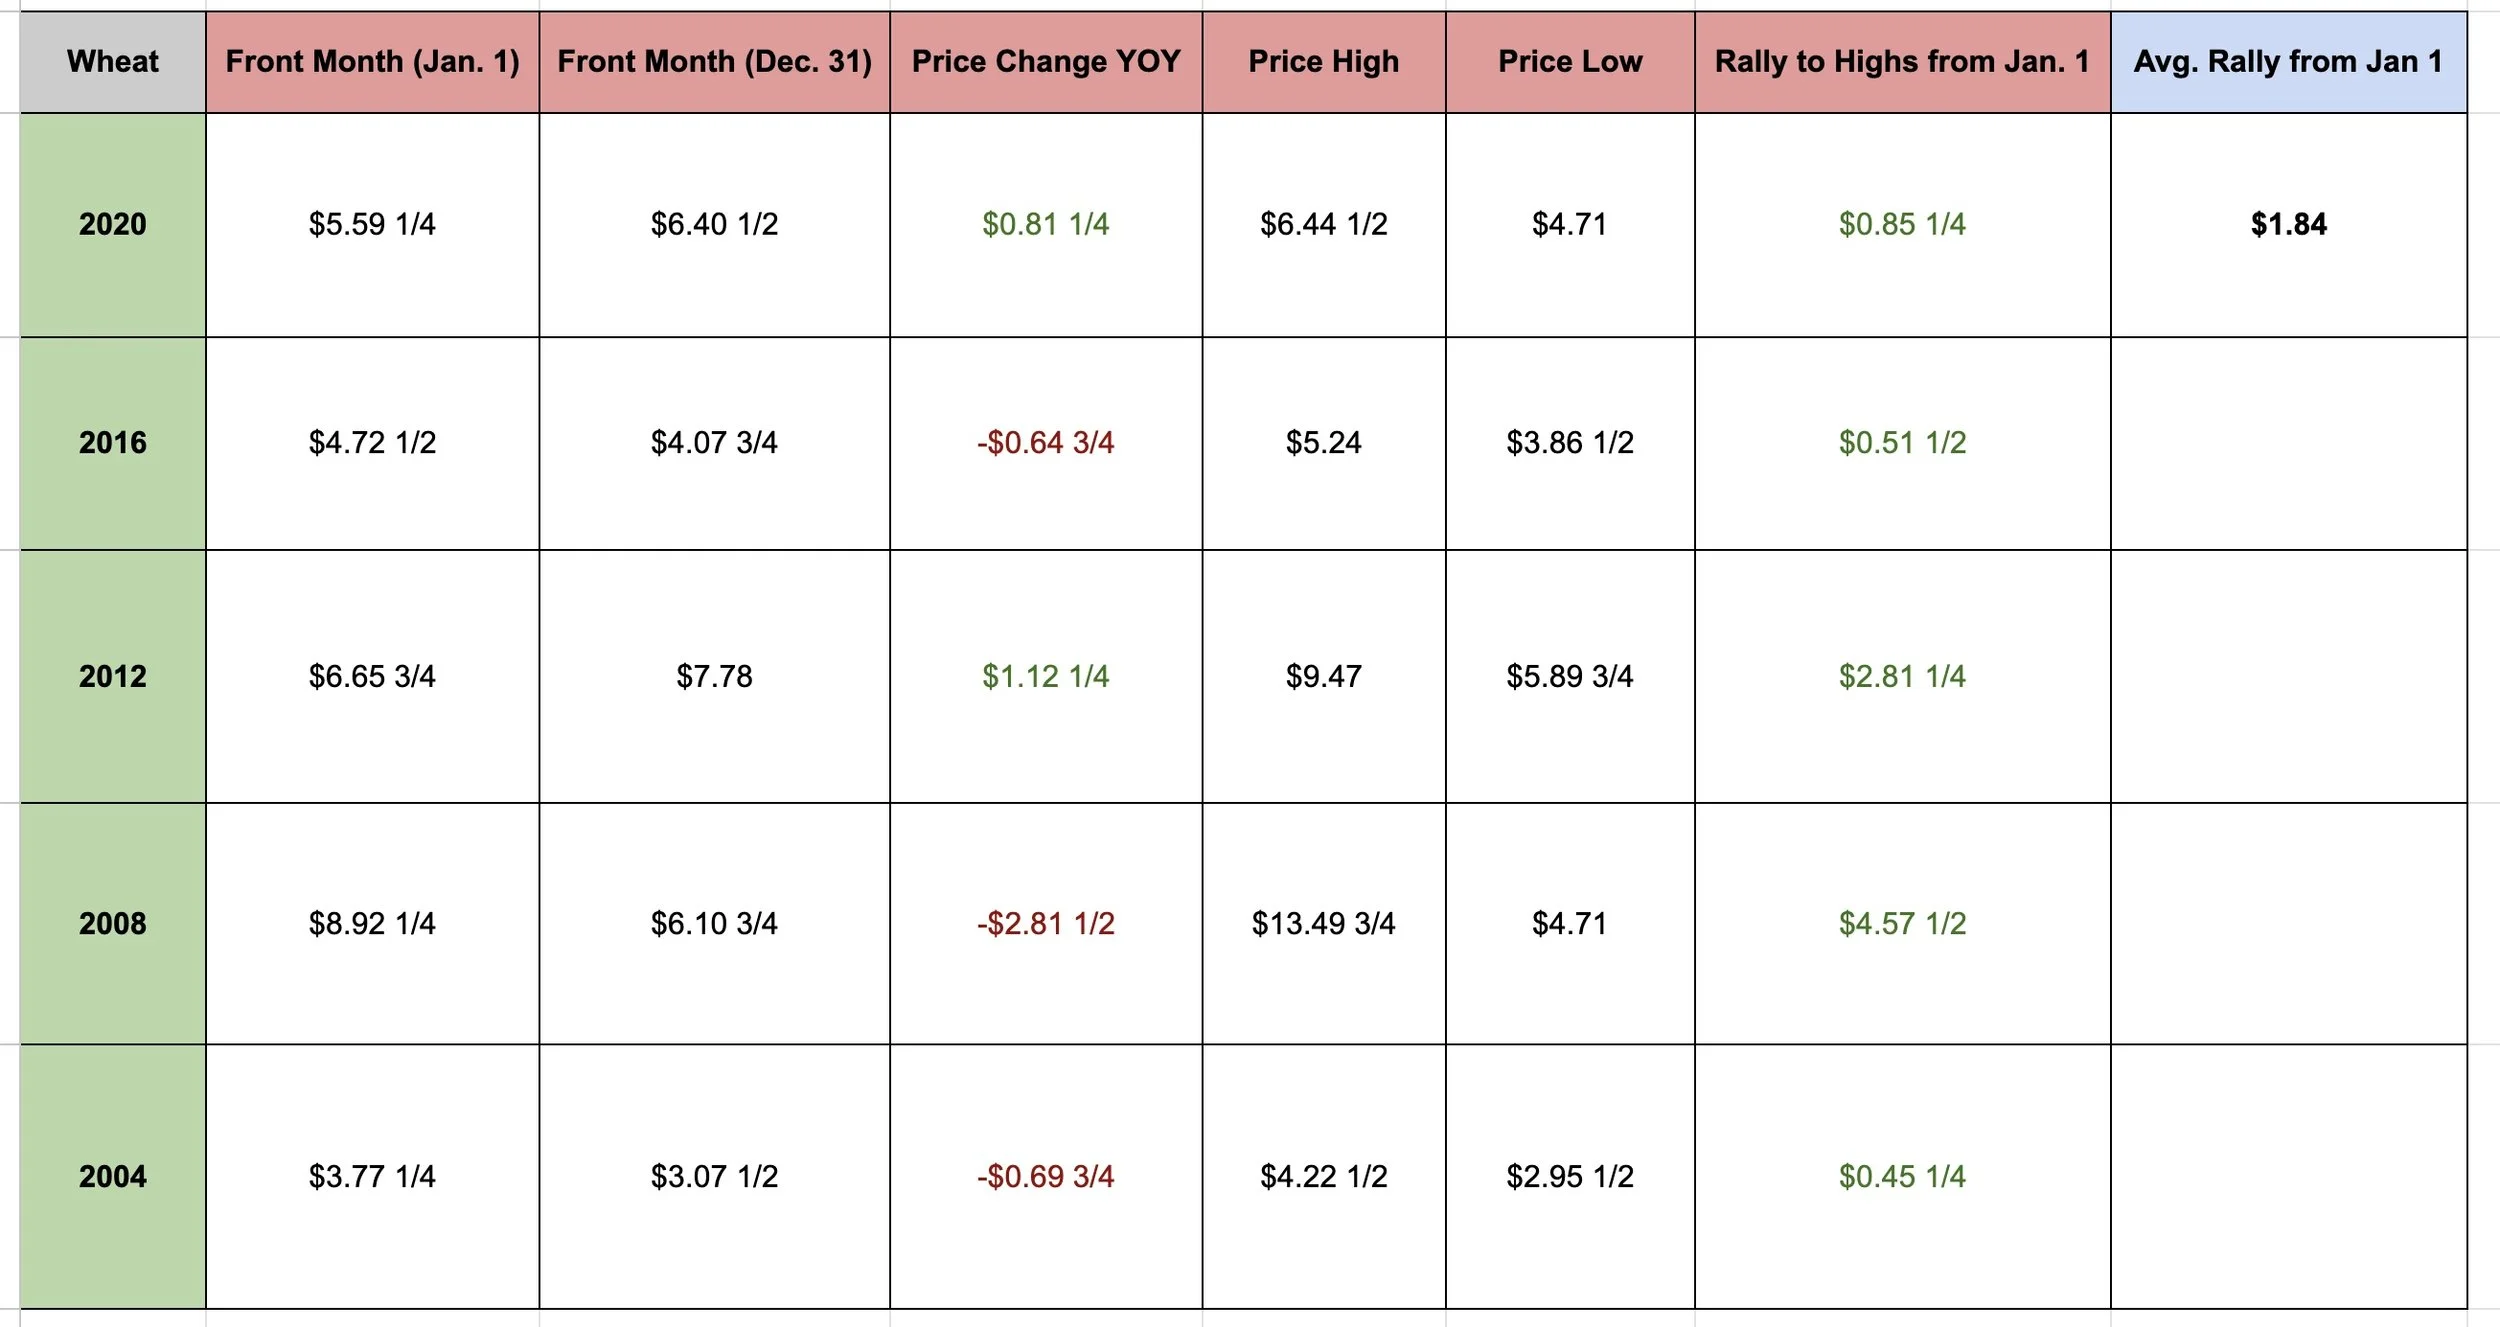
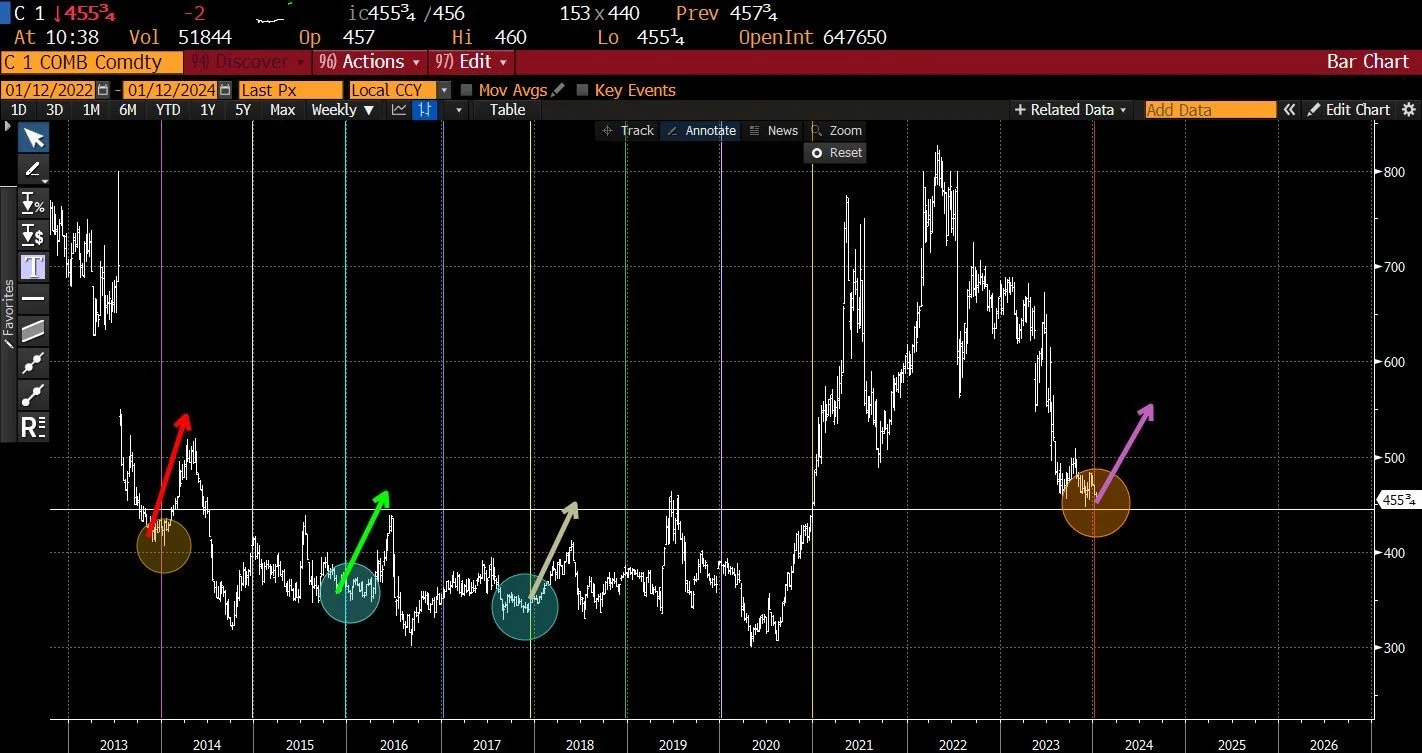
Election Year History for Grains
We mentioned yesterday that election years tend to be big ones for the grain market. But just how big are they typically?
Below are charts with our prices changes over the year as well as our average rally from January 1st to our highs for the year.
As you can see it's usually a coin toss as to whether we will be higher by the end of the year or not. But one thing we can’t ignore is that every election year for the past 2 decades we have rallied well off of where we opened up at on January 1st.
For this example we used the front months for each contract as some of the big moves for example happened after the contract went off the board for corn in 2020.
What was our average rallies?
Corn's average rally is +$1.52 3/4

Bean's is a whopping +$3.89 1/2
Lastly wheat's is +$1.84
Here was the dates of those highs:
Corn:
2020: Dec 31st
2016: June 8th
2012: August 10th
2008: June 30th
2004: April 5th
Beans:
2020: Dec 31st
2016: June 10th
2012: September 4th
2008: July 3rd
2004: March 24th
Wheat:
2020: Oct 20th
2016: June 8th
2012: July 23rd
2008: Feb 27th
2004: March 22nd
Here were the dates of the lows we made before the rally:
Corn:
2020: April 29th
2016: April 1st
2012: June 1st
2008: March 8th
2004: Jan 12th
Beans:
2020: April 21st
2016: Jan 6th
2012: Jan 12th
2008: April 1st
2004: Feb 2nd
Wheat:
2020: June 20th
2016: April 16th
2012: Jan 18th
2008: Jan 10th
2004: March 12th
Now does this mean this year will follow this same trend? No, but I just wanted to point out that historically, yes election years tend to see rallies across the board.
Timing of when they happen is another question, some years the rally happened in the summer, some happened in the fall and winter.
We don’t know for sure how big the rally will be, or if we will get a major one at all. I think we will, but there are a lot of factors at play such as how this upcoming growing season for corn will be.
But what we do know is this is an election year, so something big will likely happen in the world as usual.
One thing to keep in mind if Trump is elected is the potential implications or possible trade war with China.
This next data is from futures trader Darrin Fessler. He pointed out some interesting facts.
First for corn. Since 1963, January 1st to first notice date of the December contract, there habse only been 4 years that December corn failed to close higher than the highest January closing price.
Those years were 1985, 1986, 1989, and 2001.
January closing high price for December 2024 contract? $4.98 3/4
It's about the same story for soybeans. This has only happened 7 times since 1963. Those years were 1975, 1981, 1985, 1986, 1999, 2006, and 2019.
Harvest Trader on Twitter:
"By no means a bull, trust me. But eventually we will run out of sellers for now... shorts will feed on themselves..."
Options Trader Brian Wilson:
"The catalyst that starts a rally in the grains may not be a number crunching reason of weather. It may just be, enough is enough."
Farm Futures asked:
"Anything on the horizon that could inspire a price rally for corn?"
Highly respected Naomi Blohm replied with:
"Weather for safrinha corn has to be perfect. Demand for Brazil corn equals 131.5 million metric tons. Currently the USDA has Brazil corn pegged at 127 million vs 137 last year. Approximately 32 million is growing right now, with 95 million pegged for the 2nd crop, which hasn’t been planted yet."
From Kevin Duling:
"I have to think South America will bring some fireworks as we get further into the Safrinha crop. It's just being planted now, so we're a ways off yet, but more rain now means more delays. More delays mean more corn trying to pollinate in the hot, dry season as opposed to their ideal season."
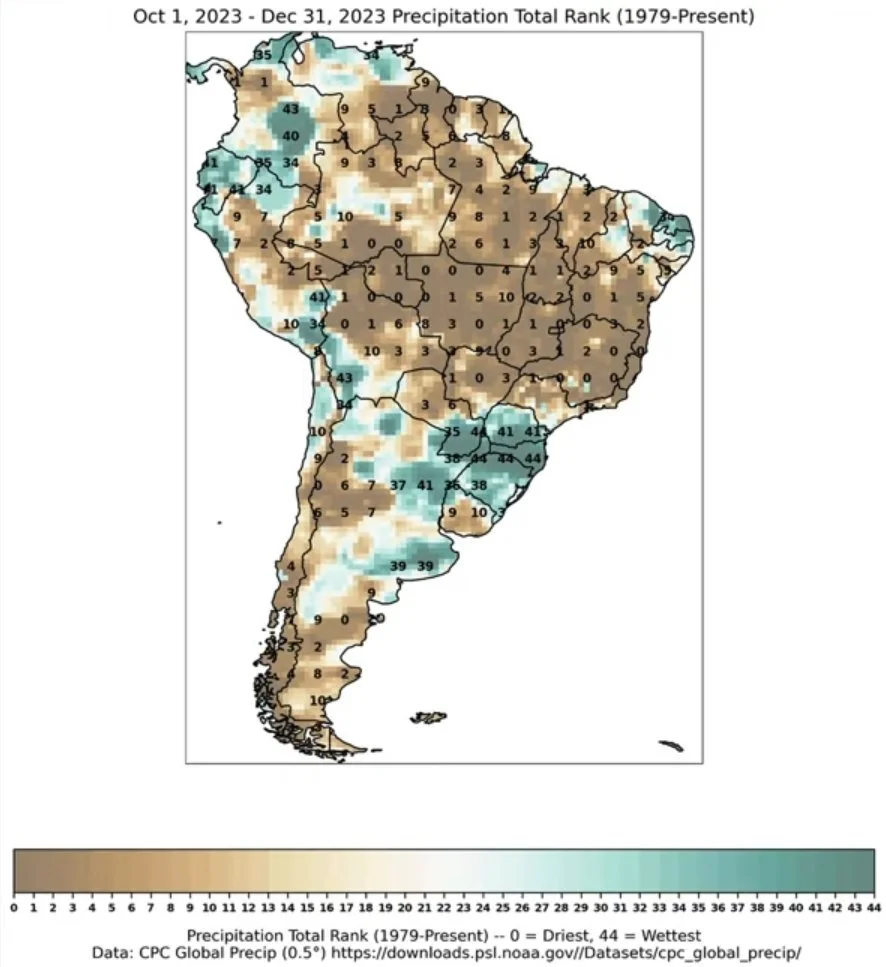
Following a historic 3-month long drought in Brazil where nearly every area ranked dead last in precipitation on record.. January saw some rains.
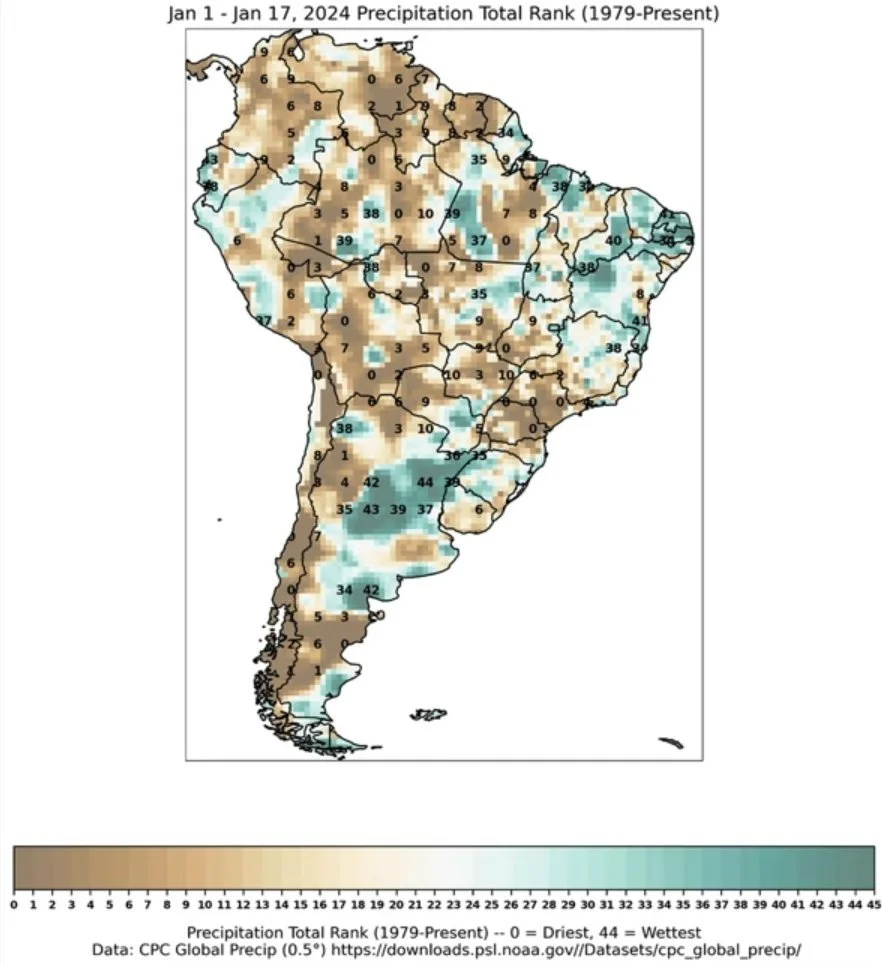
But how much? Some areas got great rain, others continue to struggle.
Rains now will not make much of a difference to the soybean yields. However, too much rain could create more problems as harvest gets underway and lead to delays for the second corn crop.
So yes, rain now would actually be beneficial to prices.
October to December Precip Rank
January Precipitation Rank (So Far)
Now let's dive into today's update..
Today's Main Takeaways
Corn
Corn had an okay day, slightly disappointing to see us close off our highs. But we were strong the entire day. After making new lows yesterday, we rallied and then we followed that rally up with a little bit of strength.
It is still early, but there are some clear signs of a possible reversal taking place.
Right now, there isn’t really a major factor to help us bounce of out here right now. The reasoning for the strength more than anything is that the sellers seem to be running out of steam.
The funds are short somewhere around -240k contracts of corn. That is a huge amount. What happens when they are forced to cover? They will be forced to buy a massive amount of corn.
So that is actually one of the best things corn has going for it right now, the fact that the funds are holding massive shorts. Timing of when they will decide to cover is the bigger question.
From Dormant Genius on Twitter:
Corn is 3 for 3 the last 10 yeas when the funds are short 150k or more contracts to start the year. Is this the 4th?
The friendliest thing we saw in corn today was……….
The rest of this is subscriber only. Subscribe to continue reading & receive every exclusive update.
KEEP READING FOR FREE
Try our stuff for 30 days. We will help you become a price maker and teach you all the ways to beat big ag at their own game.
If you have questions feel free to give us a call: (605)295-3100
Want to Talk?
Our phones are open 24/7 for you guys if you ever need anything or want to discuss your operation.
Hedge Account
Interested in a hedge account? Use the link below to set up an account or shoot Jeremey a call at (605)295-3100 or Wade at (605)870-0091
Check Out Past Updates
1/18/24
UTILIZING TRENDS & TECHNICALS IN YOUR GRAIN MARKETING PLANS
Read More
1/17/24
FUNDS & CHINA
1/16/24
BEANS TRY TO BOUNCE FOLLOWING BEARISH USDA
1/12/24
FULL USDA REPORT BREAKDOWN
1/11/24
USDA REPORT TOMORROW. ARE YOU PREPARED?
1/10/24
PREPARING FOR THE USDA
1/9/24
TURNAROUND TUESDAY & USDA PREVIEW
1/8/24
HOW TO GET COMFORTABLE AHEAD OF USDA REPORT
1/5/24
FIRST WEEK OF NEW YEAR FLOPS
1/4/24
REALIZING POTENTIAL UPSIDE BUT BEING AWARE OF RISKS
1/3/24
RAINS & BRAZIL ESTIMATES
1/2/24
UGLY DAY: BRAZIL, RISKS, & MARKETING STRATEGIES
Read More
12/29/23
SHORT TERM RISK & LONG TERM UPSIDE
12/28/23
BRAZIL RAINS?
12/27/23
EFFECTS OF US DOLLAR COLLAPSE ON GRAINS & STRATEGIES TO CONSIDER
12/26/23
GETTING COMFORTABLE WITH ALL POSSIBILITIES
12/22/23
BEAN BASIS RECOMMENDATION TO TAKE BACK CONTROL FROM BIG AG
12/21/23
COMMODITIES ARE DIRT CHEAP VS STOCKS
12/20/23
ARE YOU COMFORTABLE WITH $3 CORN OR $6 CORN?
12/19/23
CORN FIGHTING NEW LOWS & BRAZIL RAINS
12/18/23