WHAT THIS USDA REPORT MEANS MOVING FORWARD
AUDIO COMMENTARY
Friendly for corn. Neutral for beans & wheat (numbers below)
Corn opens the door to more short covering (chart below)
Why these numbers are “useless”
USDA took away half a billion bushels of supply the market was expecting
The cards are still in the hands of Mother Nature
Still not making sales here. If you are undersold there is nothing wrong with rewarding a rally
This report gives a lot of room to the upside
Options will start to get more expensive
Do on farm soybean numbers add up?
What to watch moving forward. Be prepared
Could this year mark multi year lows in corn?
Listen to today’s audio below
This is not the full version of today’s audio. Please subscribe to listen to the full thing. You will also get 1 on 1 marketing planning.
TRY 30 DAYS FOR FREE
Become a price maker. Try our daily updates completely free.
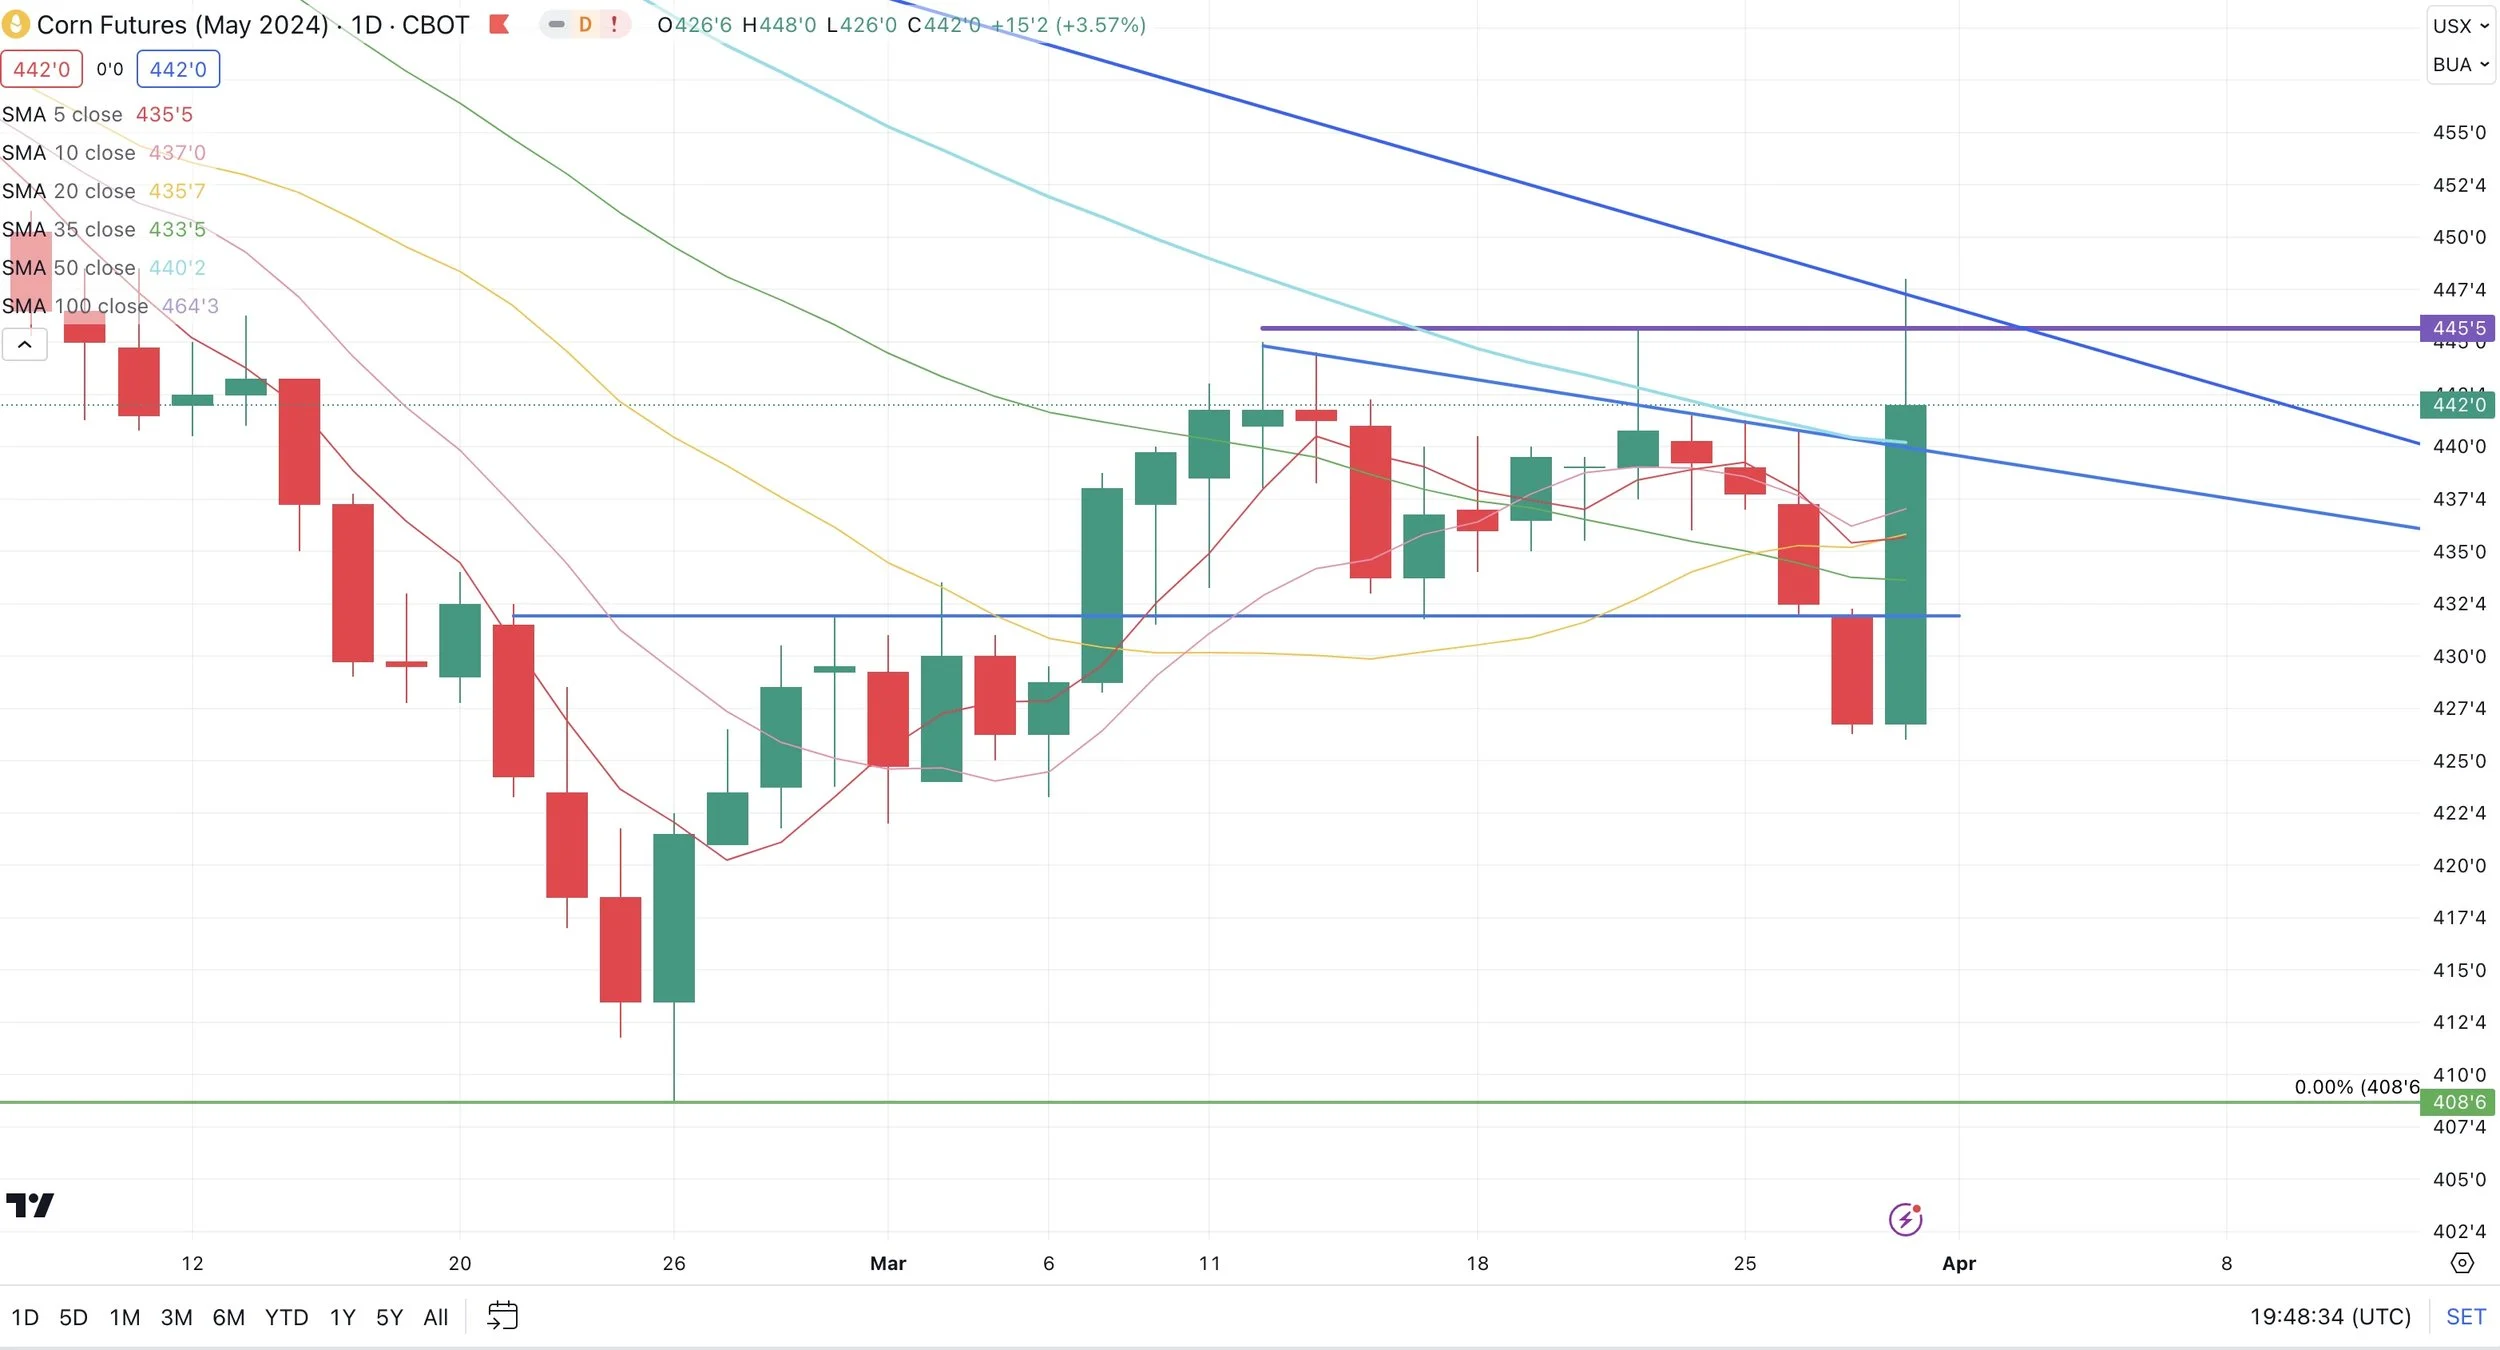
CORN CHART
We missed the key weekly reversal of $4.46 by 4 cents. Broke the short term downtrend.
This was the biggest daily gain since June. The highest daily close since February 13th.
First time closing above the 50-day MA since October.
A break above $4.46 could lead to more upside from a technical perspective.
USDA NUMBERS
Want to Talk?
Our phones are open 24/7 for you guys if you ever need anything or want to discuss your operation.
Hedge Account
Interested in a hedge account? Use the link below to set up an account or shoot Jeremey a call at (605)295-3100 or Wade at (605)870-0091
Check Out Past Updates
3/27/24
ARE YOU READY FOR USDA CRAP SHOW?
3/26/24
WHAT TO DO AHEAD OF THIS POSSIBLE TREND CHANGING USDA REPORT
3/25/24
USDA ACRES & STOCKS REPORT IN 3 DAYS
3/22/24
PRE-USDA REPORT POSITIONING
3/21/24
GRAINS FAIL TO HOLD OVERNIGHT RALLY
3/20/24
MORE SHORT COVERING LEADS TO MORE SHORT COVERING
3/19/24
WHEAT LEADS WITH RUSSIA TARIFF RUMORS
3/18/24
ARE YOU PREPARED FOR 160 OR 190 BU CORN?
3/15/24
BULLISH & BEARISH FACTORS DRIVING GRAINS
3/14/24
ARE YOU COMFORTABLE WITH THIS VOLATILITY?
3/13/24


