UP-TOBER? SELL SIGNAL, TARGETS, & FACTORS
MARKET UPDATE
This is our first attempt on a video version update so bare with me.
For those that prefer to read, you can still scroll to read the entire market update like usual or listen to the audio version.
Would love some feedback if you guys like the video version or not and if we should continue them.
(Chart Breakdown & Targets Start at 5:38min)
Enjoy our stuff?
We typically do NOT share full updates like this on social.
Try our daily updates, signals & 1 on 1 market plans completely free for 30 days.
Prefer to Listen? Audio Version
Futures Prices Close
Overview
Corn & soybeans both rally while beans post a reversal, taking out yesterdays lows and closing above yesterdays highs. Beans also posted a 2-month high.
Huge day on the charts. I will go over exactly how big of day it was later in today's update so stay tuned.
So what is driving the markets?
There are 4 main factors.
China
Brazil
Harvest
Funds
China
In my opinion this is the biggest reason for the recent bean rally.
China launched a bazooka to boost their economy.
Orginally, there was a lot of concern about China and their deflation. Meaning consumers were buying less because they thought they would be able to get it cheaper later on.
But China cut their resevers requirement ratio by 50 basis points. Basically this is artificially boosting their economy.
Why is this important?
China will cut the amount of cash banks need to have on hand, known of reserve requirement ratio.
Thus allowing banks much more freedom to move cash around and lend: aka stimulating the economy.
This leads to more consumer spending. Which means China will need a greater supply of grains.
If China overstimulates, it could lead to a boost across all commodities.
Brazil
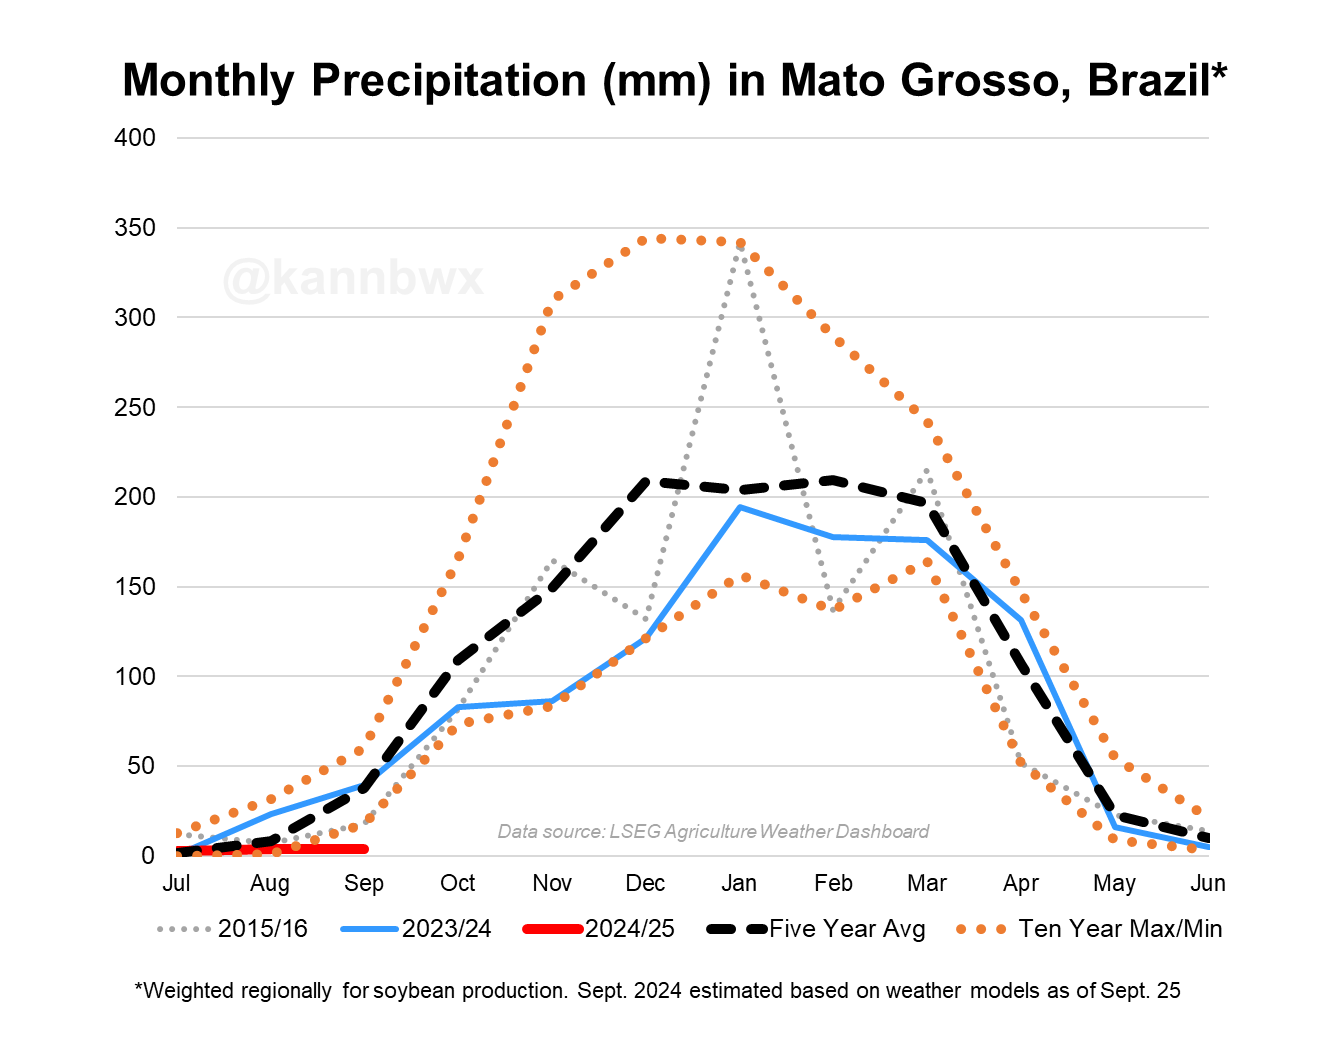
Brazil had it driest dry season on record. The weather models still show rain coming later next week, but this September will go down in history.
They had virtually ZERO rain.
Not an ideal start to bean planting.
Chart from Karen Braun
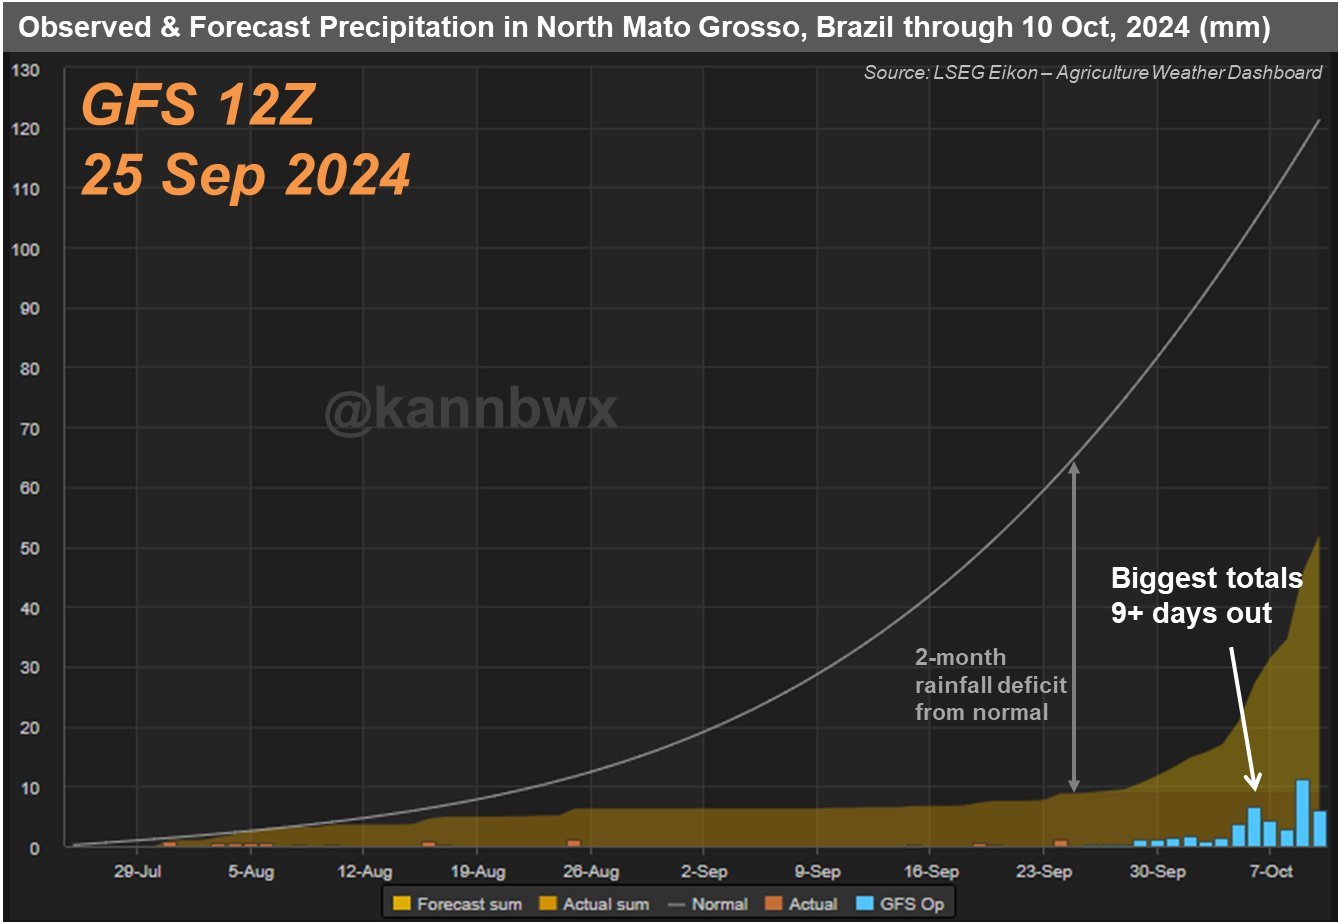
According to Karen Braun, the big rains are expected to be +9 days out.
"Ideally you want to see those larger amounts starting to move into the 5-10 day range, but trend is still promising" "The ample rains are still 10 days out, but this looks much more promising than it did a week ago." she said.
So these real rains are expected the first week or two of October.
If they fall, soybeans likely take it on the chin.
If it continues to stay dry, then we will have a serious weather rally.
Guess we will know in a week or two. The forecasts call for rain, but they have also been calling for rain for months.
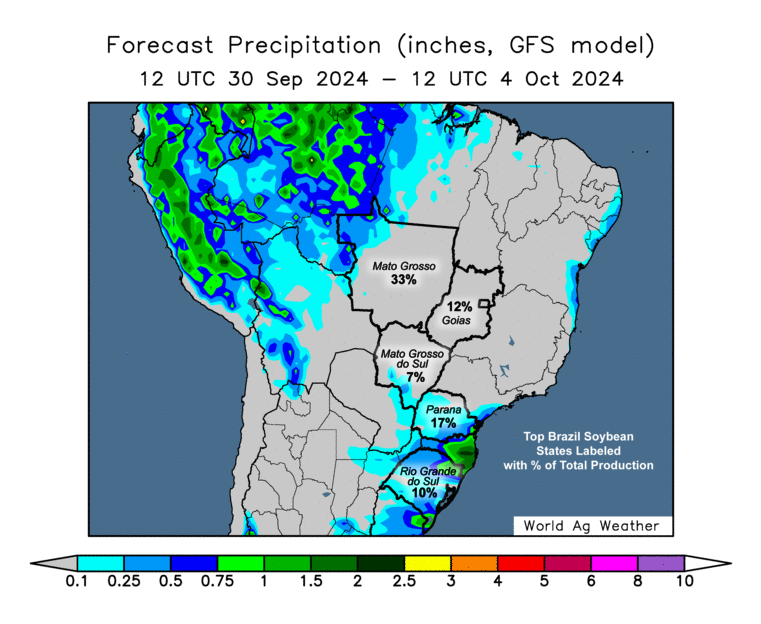
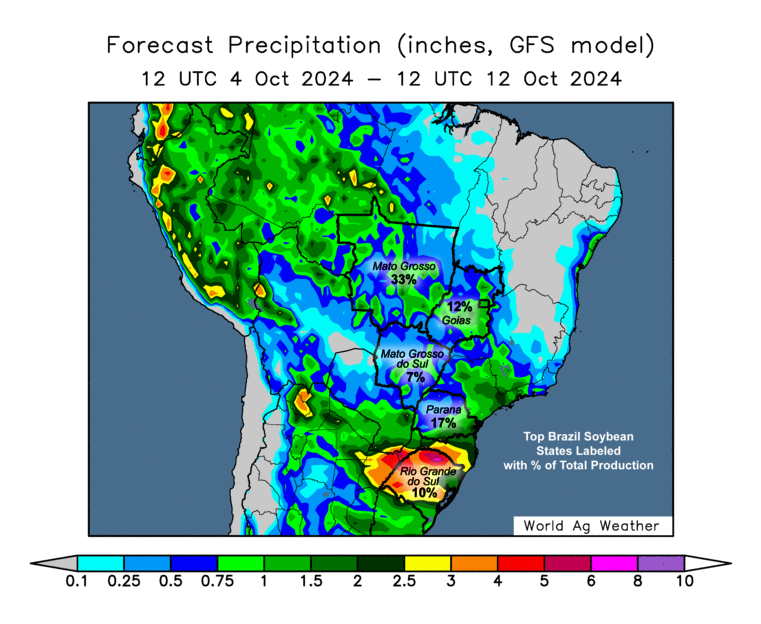
Chart from Karen Braun
GFS 4-7 Day
GFS 8-15 Day
Harvest
Early results are typically amongst the best.
So the further we get into harvest, the more variety of disappointing crops they might find.
Some areas will have a bumper crop. But not all.
I think it's pretty easy to say the USDA will only lower this crop from here.
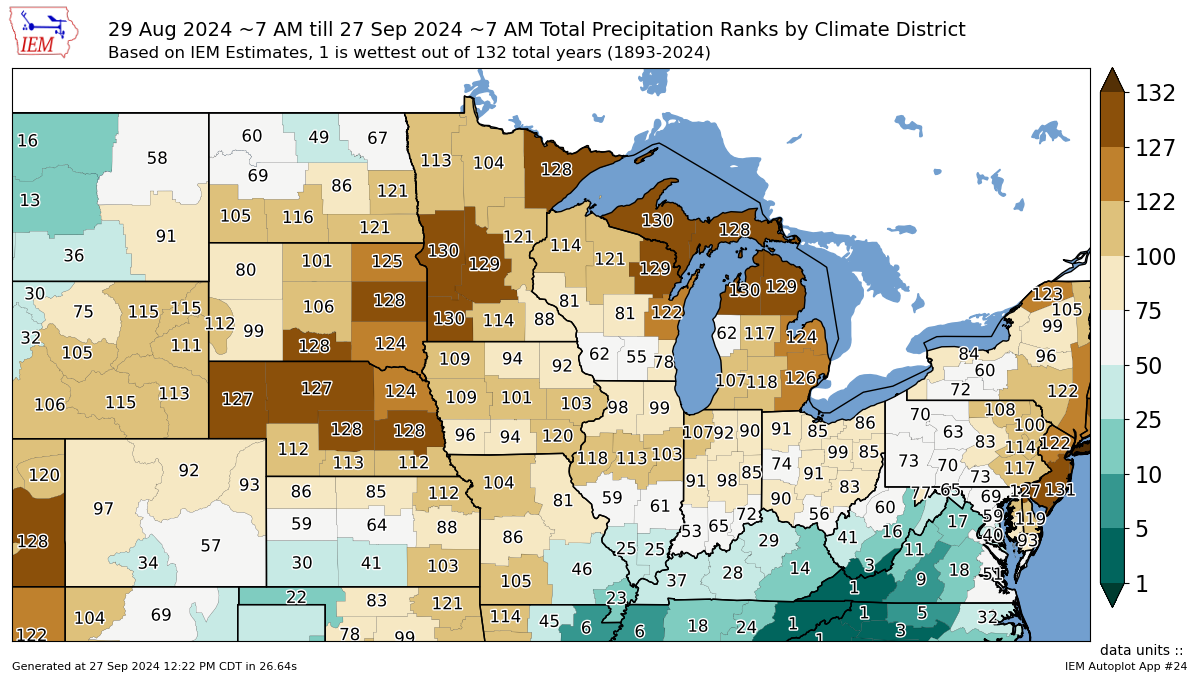
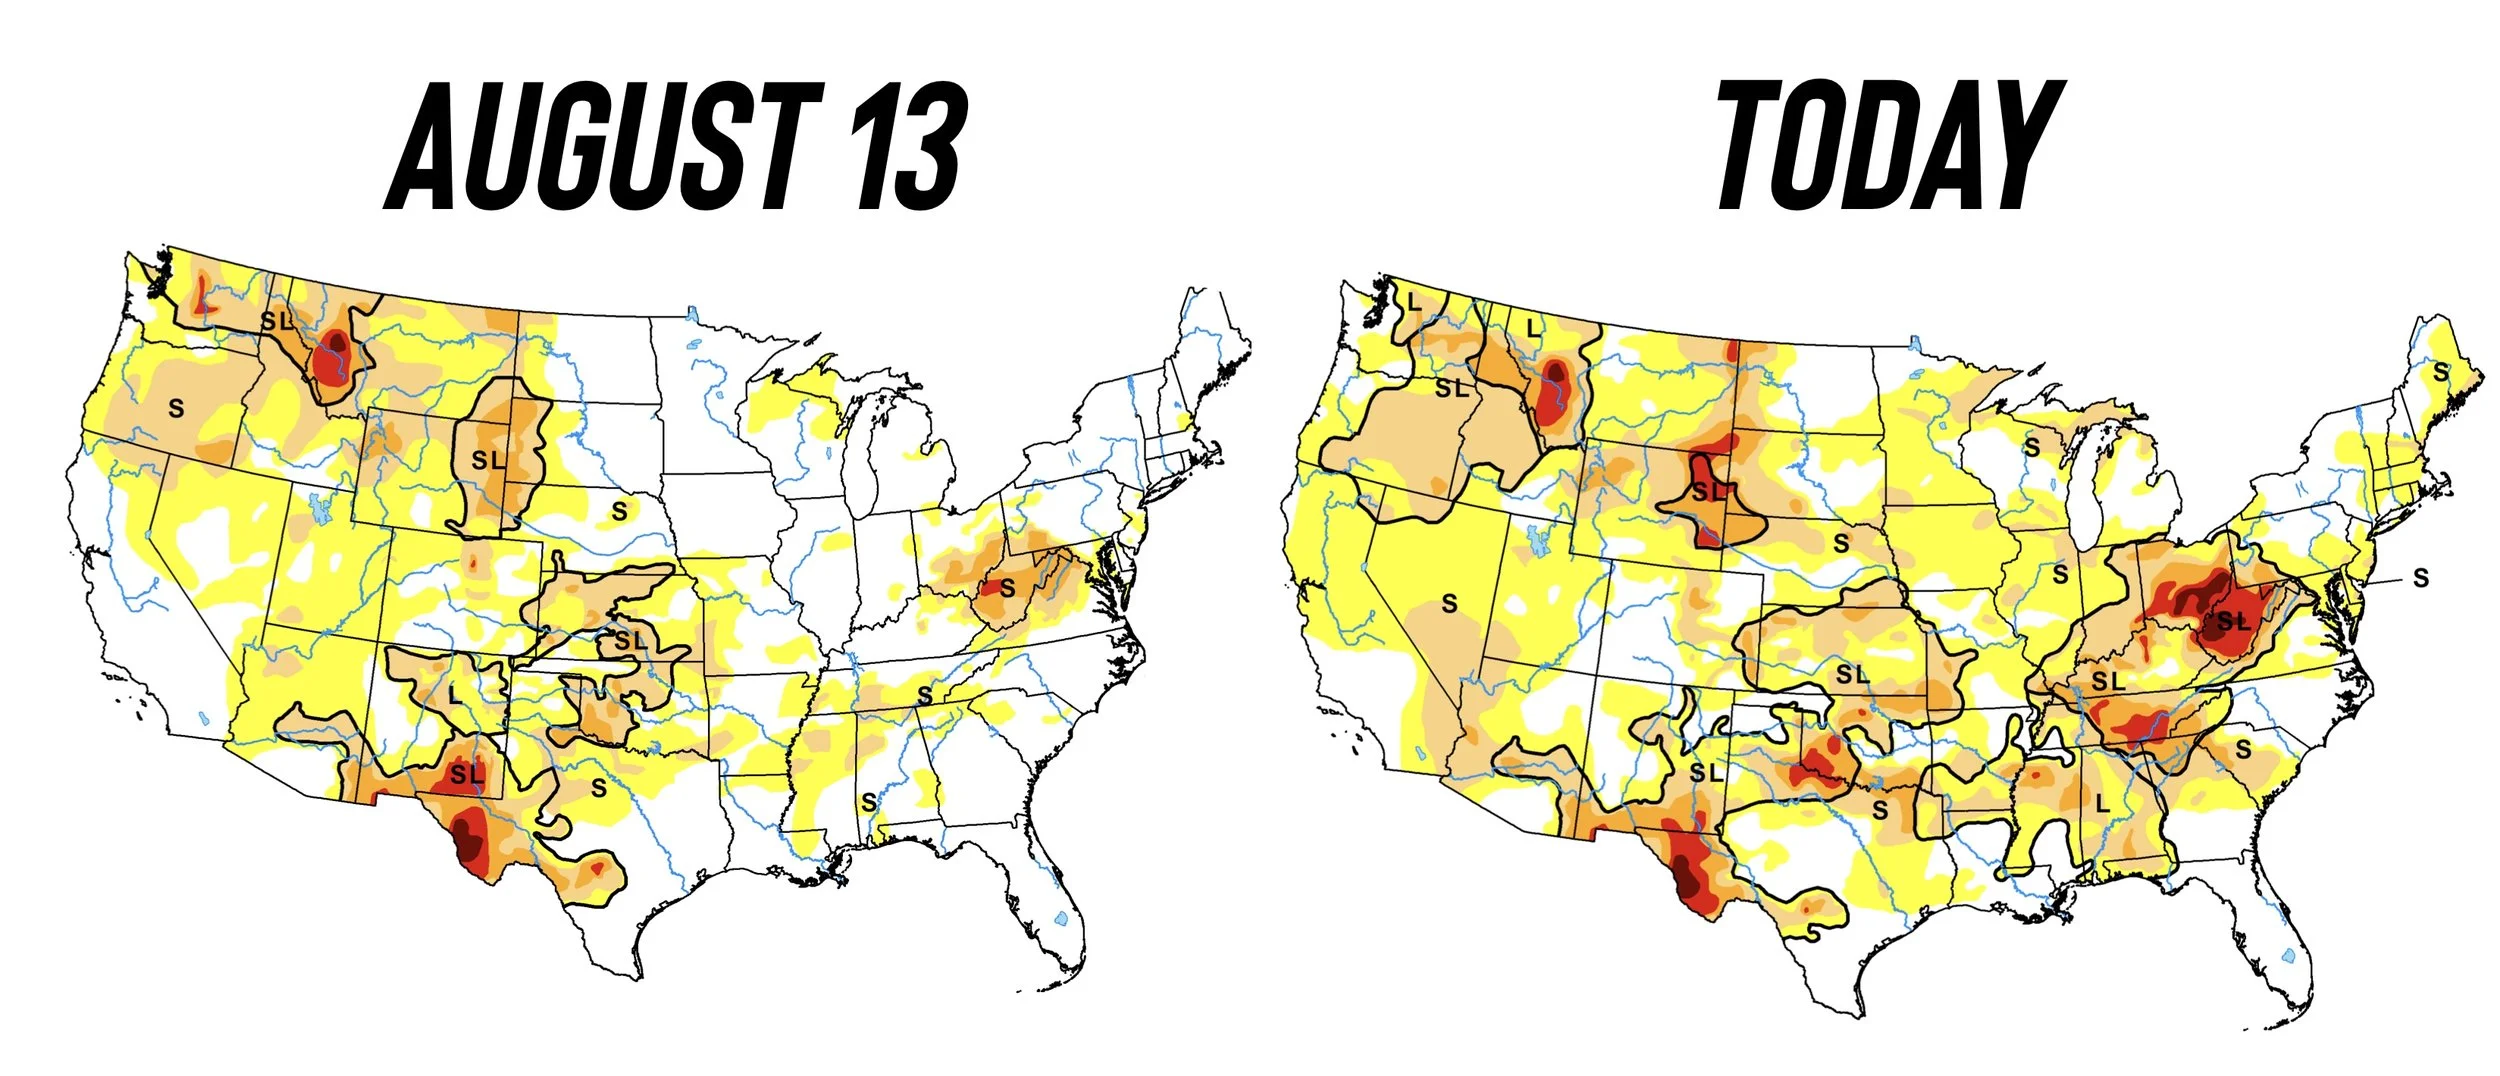
August & September were some of the driest on record. That doesn’t usually scream record yields despite the nearly perfect summer.
The Funds
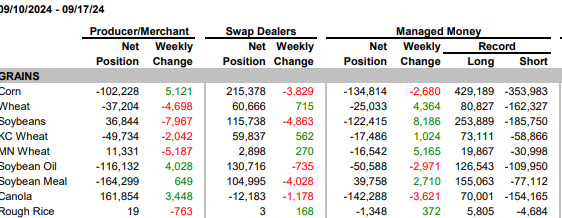
The funds have been short the ENTIRE year.
At one point they held record shorts.
They have been buying, but are still short.
What makes the funds want to continue to buy?
Typically it is either technically driven or fundamentally driven.
Right now we have both working in our favor.
We have breakouts on the charts.
We have potential factors such as China and Brazil that are making them reconsider holding the massive shorts.
Last week managed money was short everything except meal.
Up-tober?
Seasonally October is a very strong month for the grains. But just how friendly?
Here is a breakdown of the numbers.
Corn Price Change in Oct: Past 10 Years 🌽
2023: 🟢
• Open: $4.77
• Close: $4.78 3/4 (+2)
• High: $5.09 1/2 (+32 1/2)
2022: 🟢
• Open: $6.80
• Close: $6.91 1/2 (+14)
• High: $7.06 1/2 (+26 1/2)
2021: 🟢
• Open: $5.36 3/4
• Close: $5.68 1/4 (+31 1/2)
• High: $5.69 1/4 (+32 1/2)
2020: 🟢
• Open: $3.79
• Close: $3.98 1/2 (+19 1/2)
• High: $4.22 1/4 (+43 1/2)
2019: 🟢
• Open: $3.86 3/4
• Close: $3.90 (+2)
• High: $4.02 1/2 (+14)
2018: 🟢
• Open: $3.56 3/4
• Close: $3.63 1/4 (+7)
• High: $3.78 1/2 (+21 3/4)
2017: 🔴
• Open: $3.54 3/4
• Close: $3.45 3/4 (-9 1/2)
• High: $3.56 1/4 (+1 1/2)
2016: 🟢
• Open: $3.36 1/4
• Close: $3.54 3/4 (+18)
• High: $3.59 1/4 (+23)
2015: 🔴
• Open: $3.87 3/4
• Close: $3.82 1/4 (-5 1/2)
• High: $3.99 3/4 (+12)
2014: 🟢
• Open: $3.20 1/4
• Close: $3.76 3/4 (+56)
• High: $3.81 (+60 3/4)
Average Monthly Change: +13 1/2
Average Rally to Months Highs: +26 3/4
🟢 Positive Years: 8 (80%)
🔴 Negative Years: 2 (20%)
Bean Price Change in Oct: Past 10 Years 🌱
2023: 🟢
Open: $12.72 1/2
Close: $13.10 1/2 (+35 1/2)
High: $13.34 (+61 1/2)
2022: 🟢
Open: $13.64
Close: $14.19 1/2 (+54 3/4)
High: $14.24 (+60)
2021: 🔴
Open: $12.55
Close: $12.49 1/2 (-6 1/2)
High: $12.66 1/4 (+11 1/4)
2020: 🟢
Open: $10.23 1/4
Close: $10.56 1/4 (+32 3/4)
High: $10.88 1/2 (+65 1/4)
2019: 🟢
Open: $9.04
Close: $9.32 1/4 (+26 1/4)
High: $9.59 (+54)
2018: 🟢
Open: $8.45 1/2
Close: $8.51 3/4 (+6 1/4)
High: $8.97 3/4 (+52 1/4)
2017: 🟢
Open: $9.67 1/2
Close: $9.84 3/4 (+16 1/2)
High: $10.04 3/4 (+37 1/4)
2016: 🟢
Open: $9.52 1/2
Close: $10.11 3/4 (+57 3/4)
High: $10.31 (+78 1/2)
2015: 🔴
Open: $8.91 1/2
Close: $8.85 3/4 (-6 1/4)
High: $9.19 3/4 (+28 1/4)
2014: 🟢
Open: $9.12
Close: $10.49 1/4 (+$1.36)
High: $10.59 1/4 (+$1.47 1/4)
Average Monthly Change: +35 1/2
Average Rally to Months Highs: +59 1/2
🟢 Postitive Years: 8 (80%)
🔴 Negative Years: 2 (20%)
USDA Monday
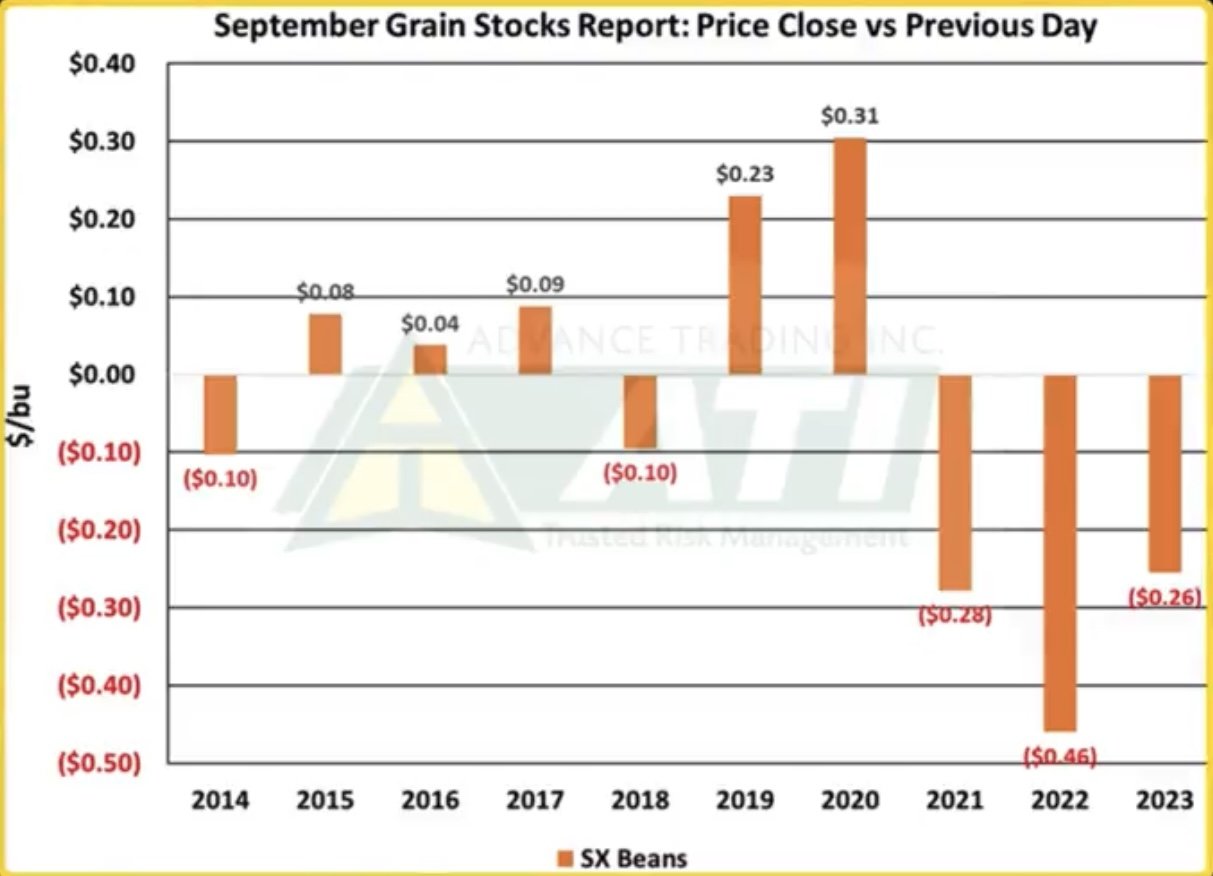
Historically this report can throw some curveballs.
The past 3 of 5 years it has been friendly for corn & wheat while being negative for beans the past 3 of 5 years.
Here is the past performance of this report from Advanced Trading Inc.
The main to watch in this report is going to be the stocks number and how the market reacts.
If the stocks are in the hands of the farmer or the elevator.
Keep in mind, this is stocks as of September 1st. But there are some areas that are harvesting so the numbers may be skewed.
How the USDA adjusts these numbers in the Oct report is more important than Monday's.
Today's Main Takeaways
Corn
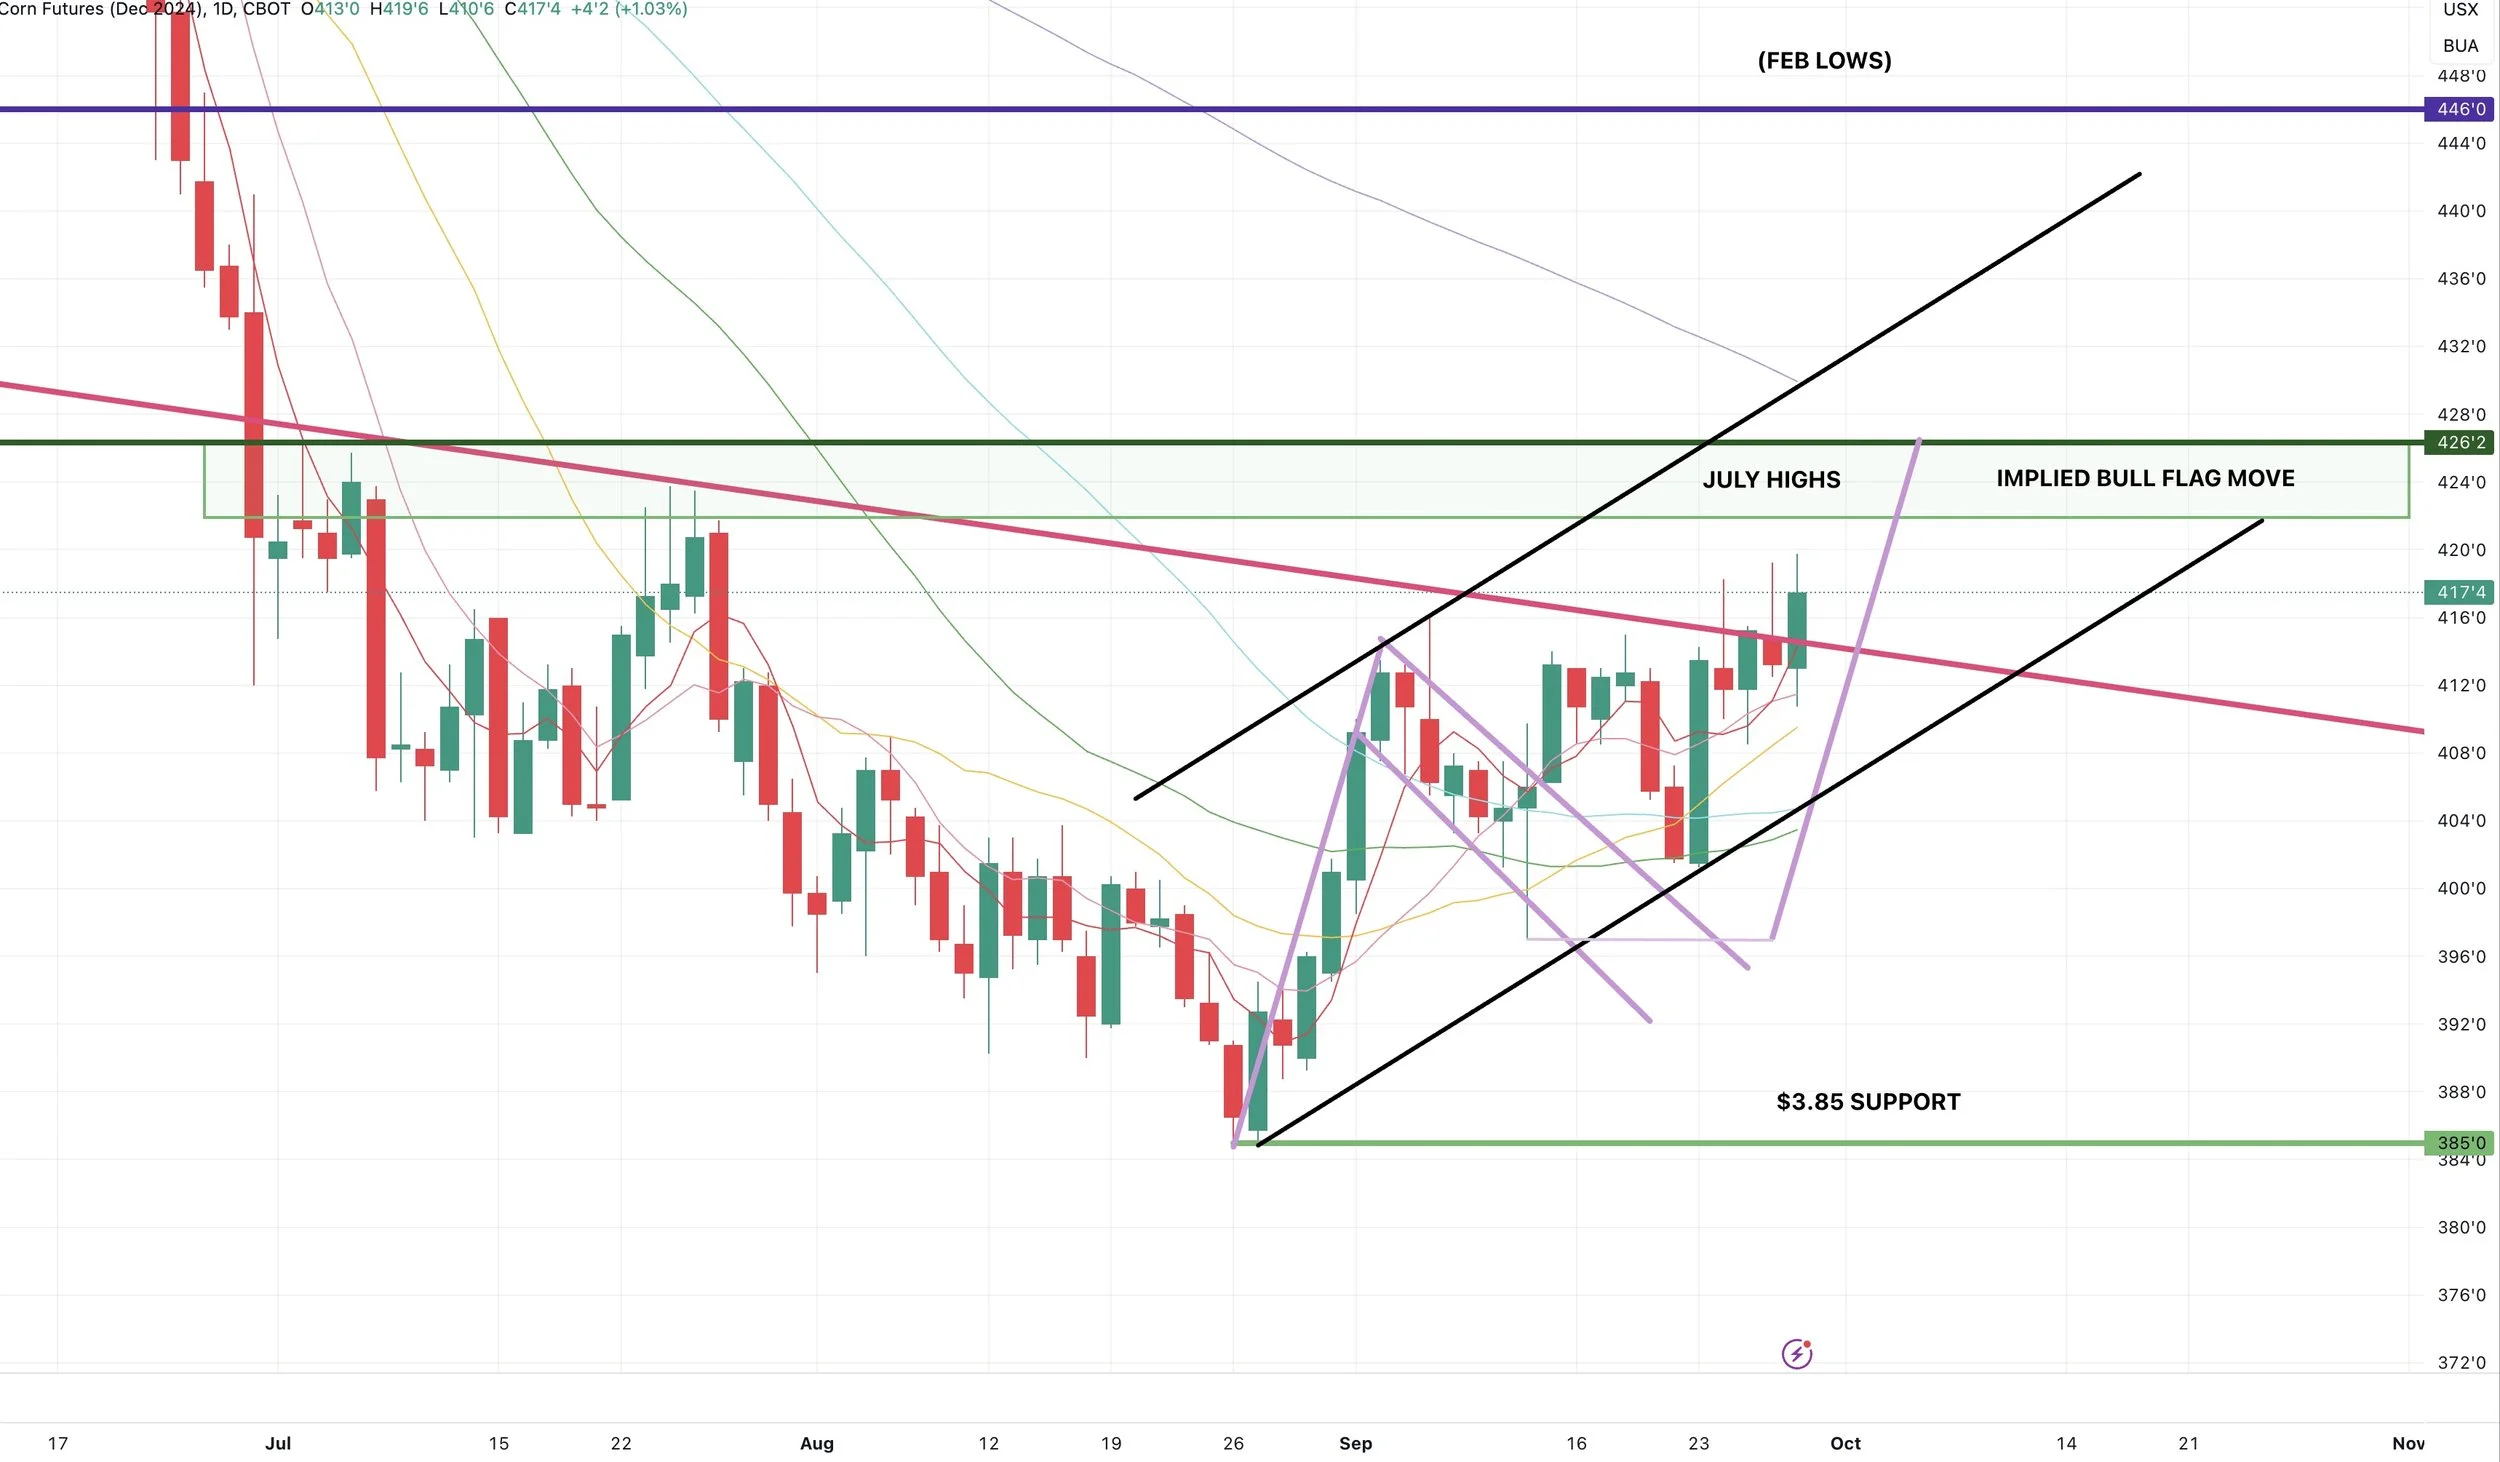
Huge day on the charts.
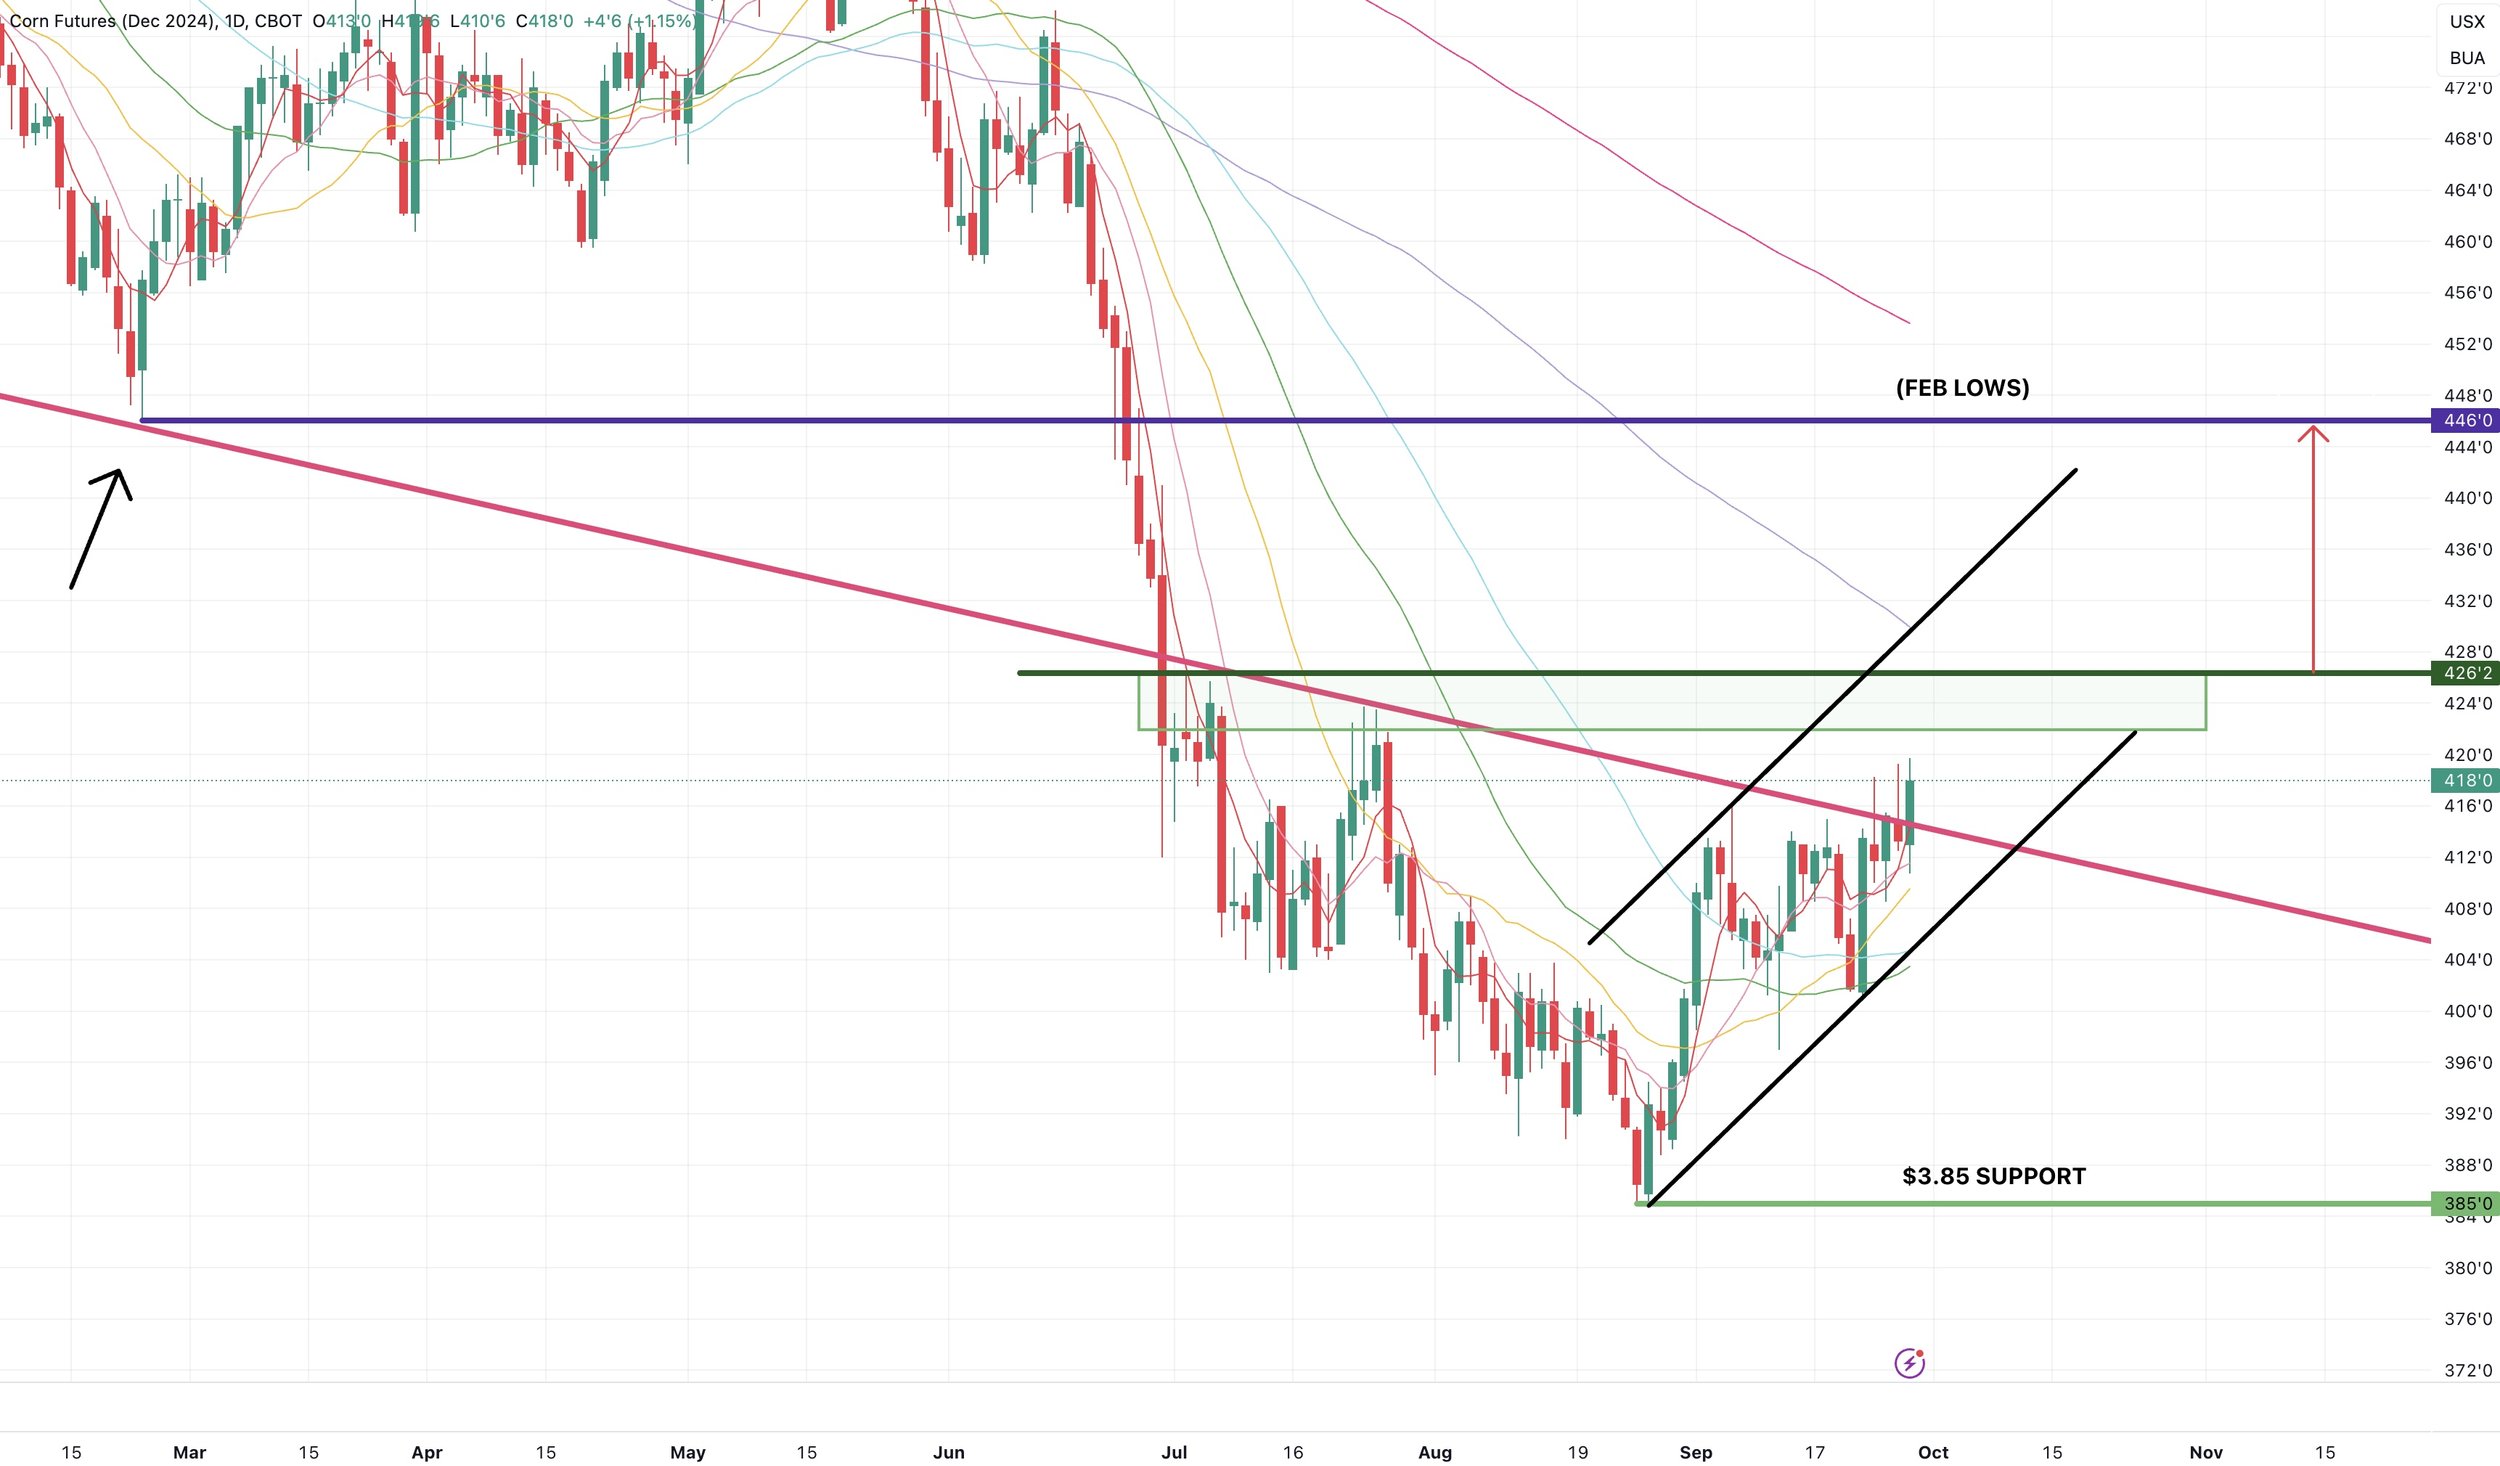
We finally got our first close above that major resistance point I had been talking about for months.
This pink line.
It was our old support, it turned to new resistance.
However, I would like another strong move out of here to make sure it is not just a bull trap. But looks good as of today.
Monday's report will be the key if this is finally the moment we break through, or if we fail once again.
The first spot I am looking to take a small amount of risk off the table is when Dec corn crawls into that $4.23-26 area.
That was our July highs & is still the implied move from our bull flag breakout.
Once we clear that area (green box)
Our next target and major point of resistance is $4.46 (purple line)
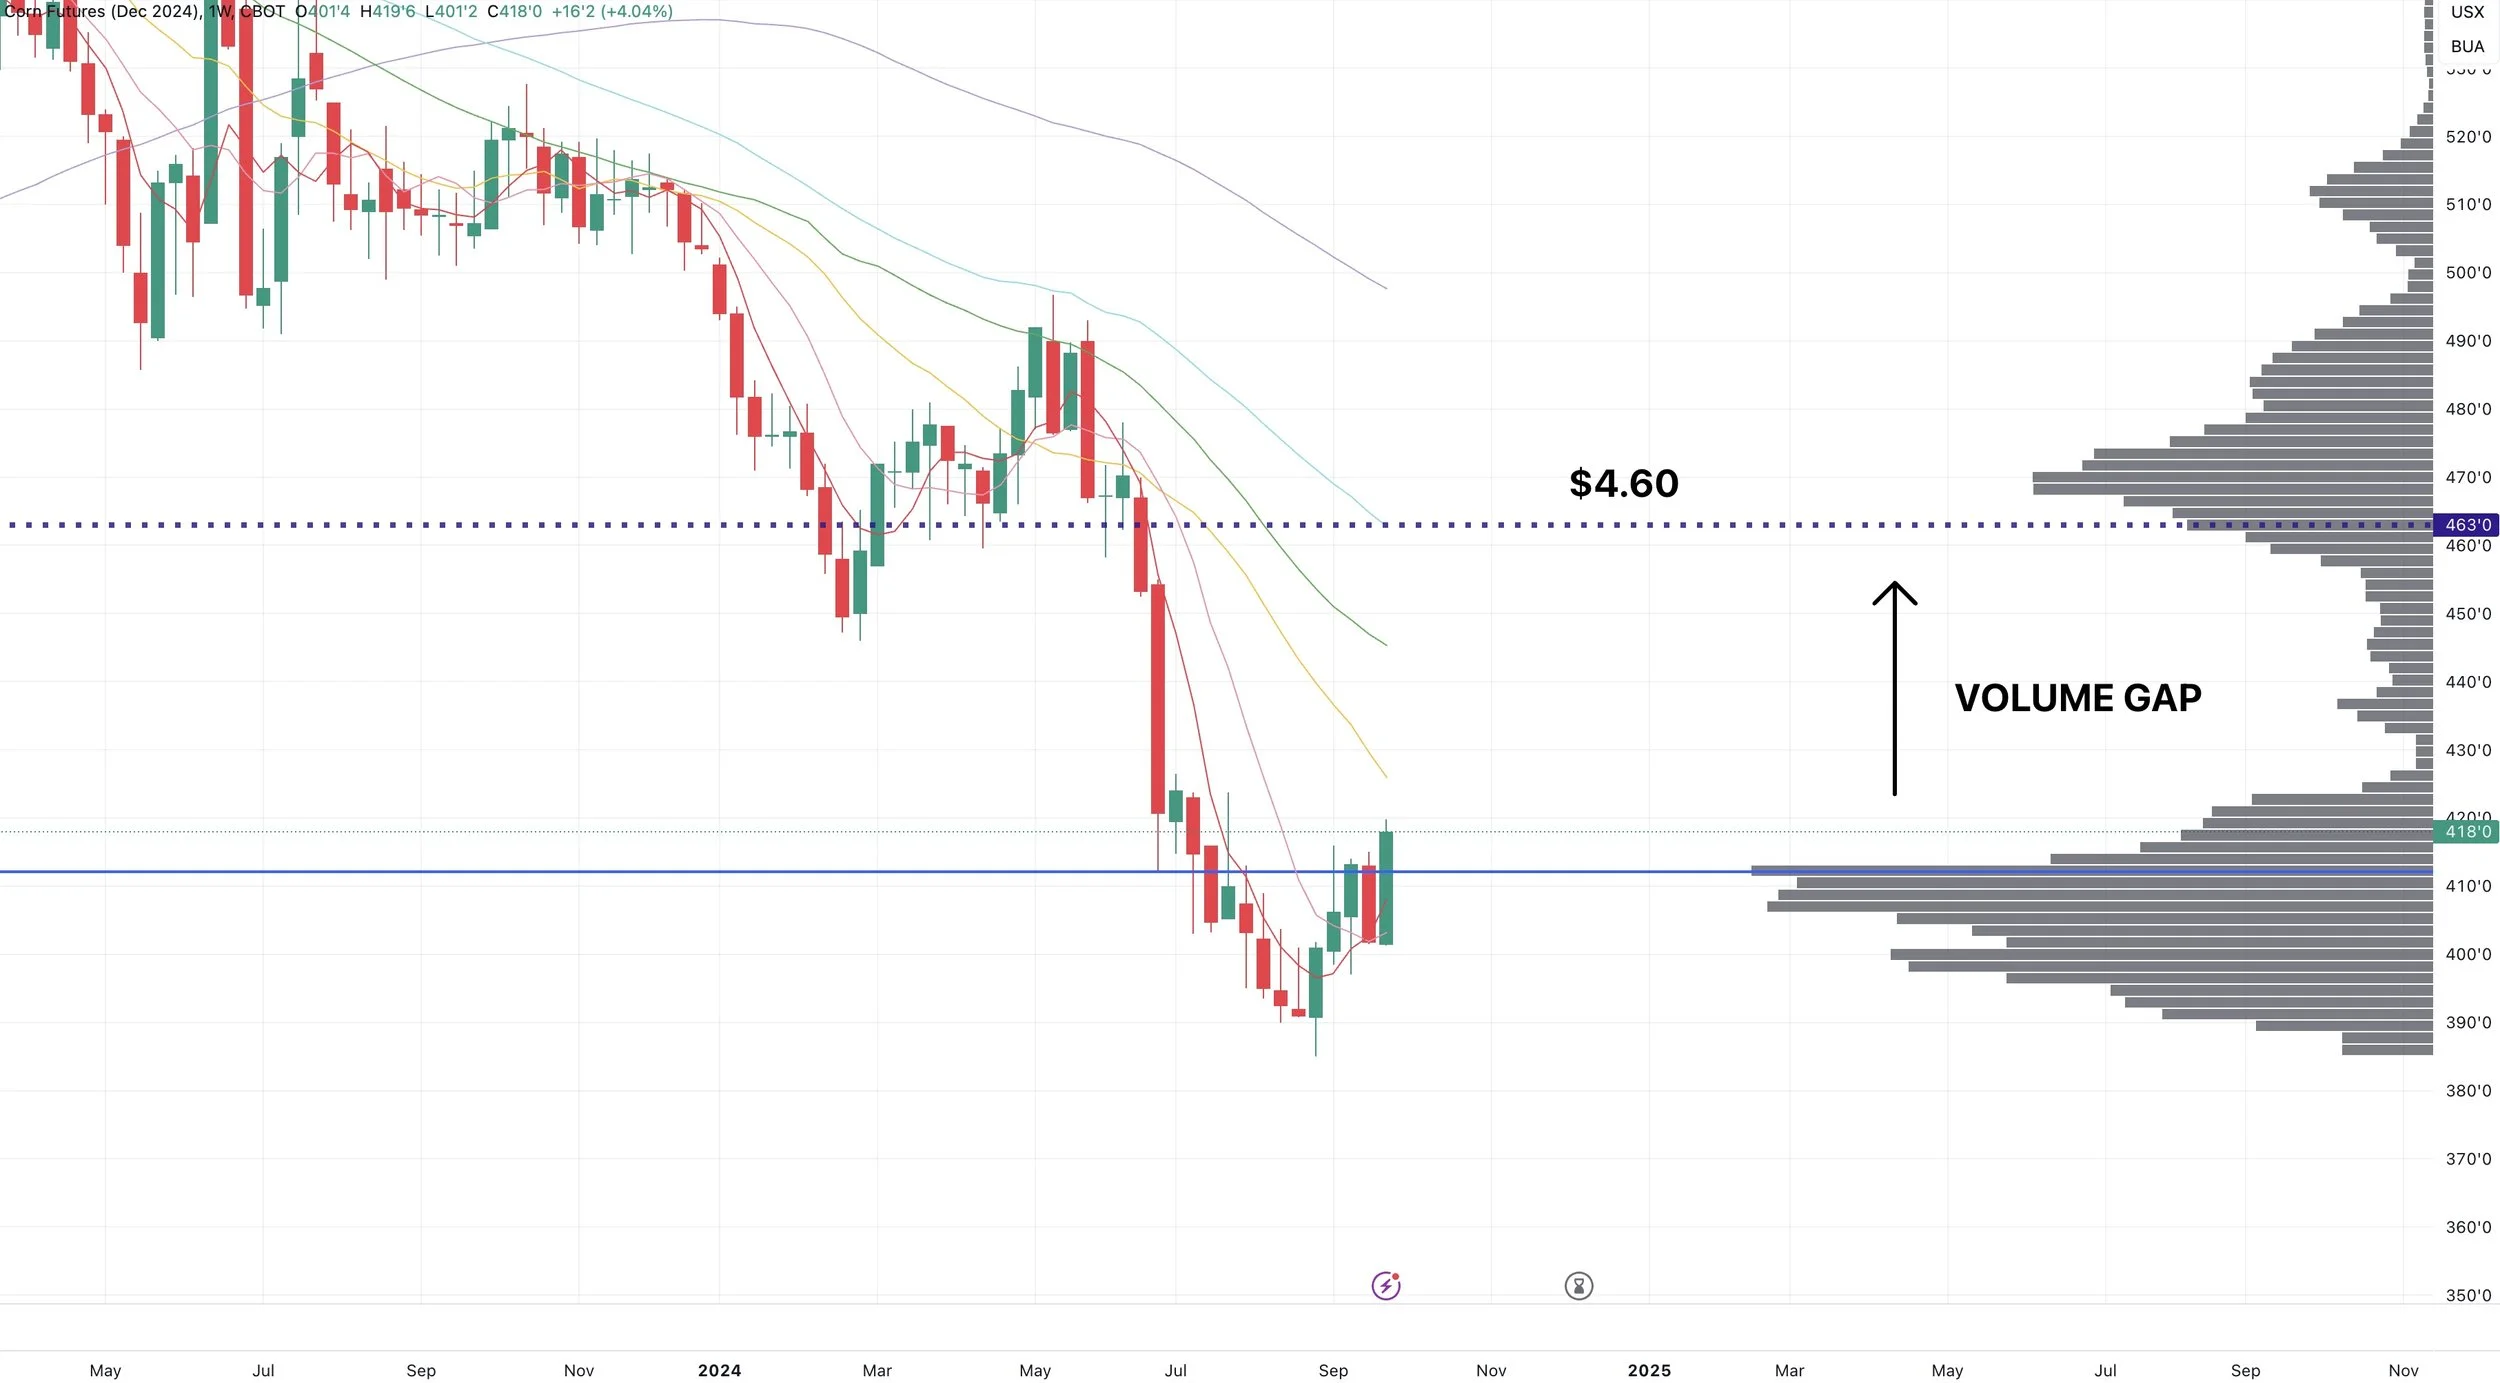
The next target after $4.46 is $4.60
We have a volume gap up to $4.60 from our July sell off.
Dec Weekly Corn
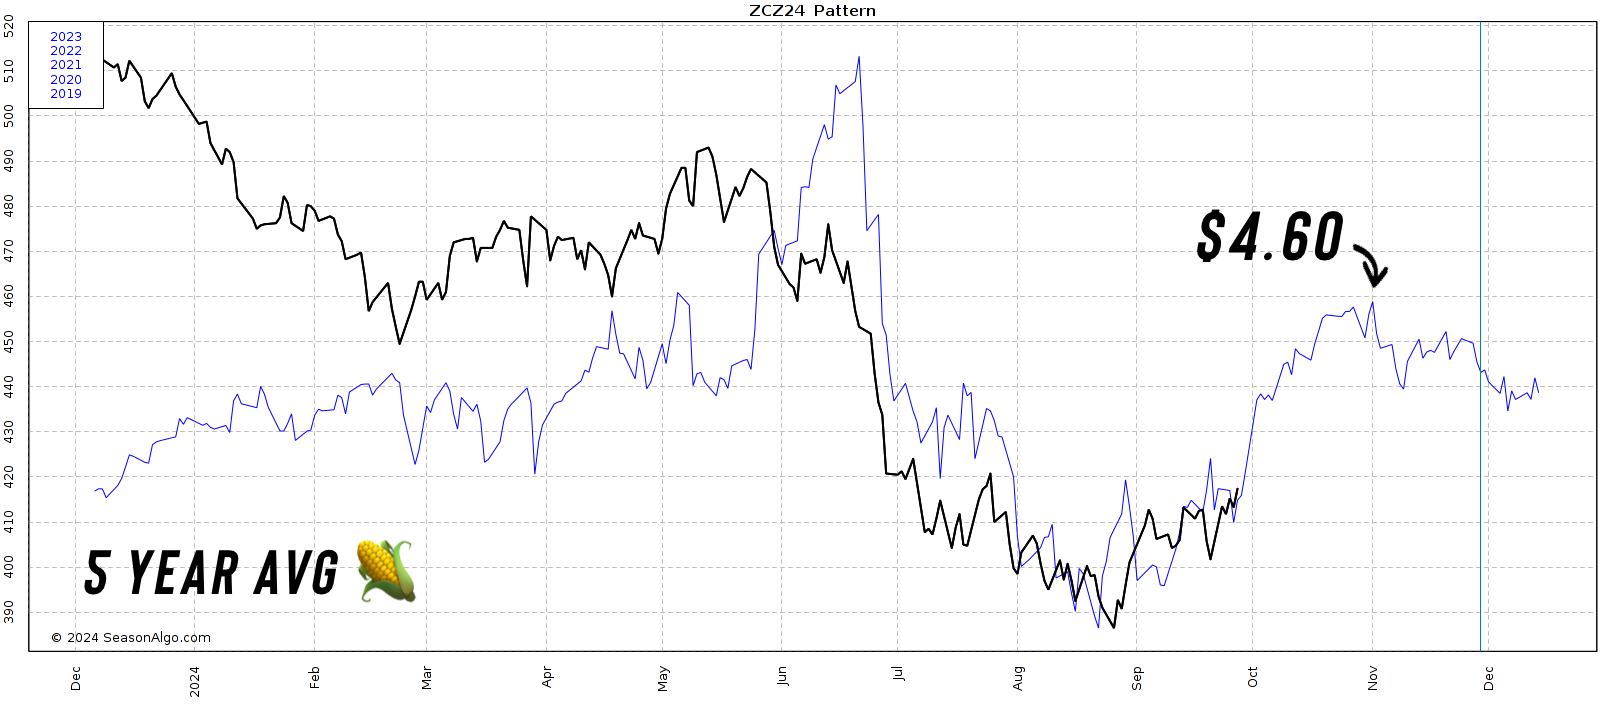
$4.60 is also where our 5 year average seasonal has up topping out on November 1st.
So basically how I would play it is make small incremental sales or add protection at each target on the way up.
$4.23 add some.
$4.46 add some.
$4.60 add some.
Ideally, I like keeping a floor while keeping your upside open.
Because if this Brazil situation does escalate or if the crop here in the US winds up closer to 180, there is plenty of potential upside. But as a producer your risk is lower.
This recent rally has made puts all that more cheap and easier to utilize.
Give us a call if you want to go through your specific operation. As some of you should be aggressive, while some of you might not want to do anything here. But majority should be at the very least adding a floor.
(605)295-3100
Soybeans
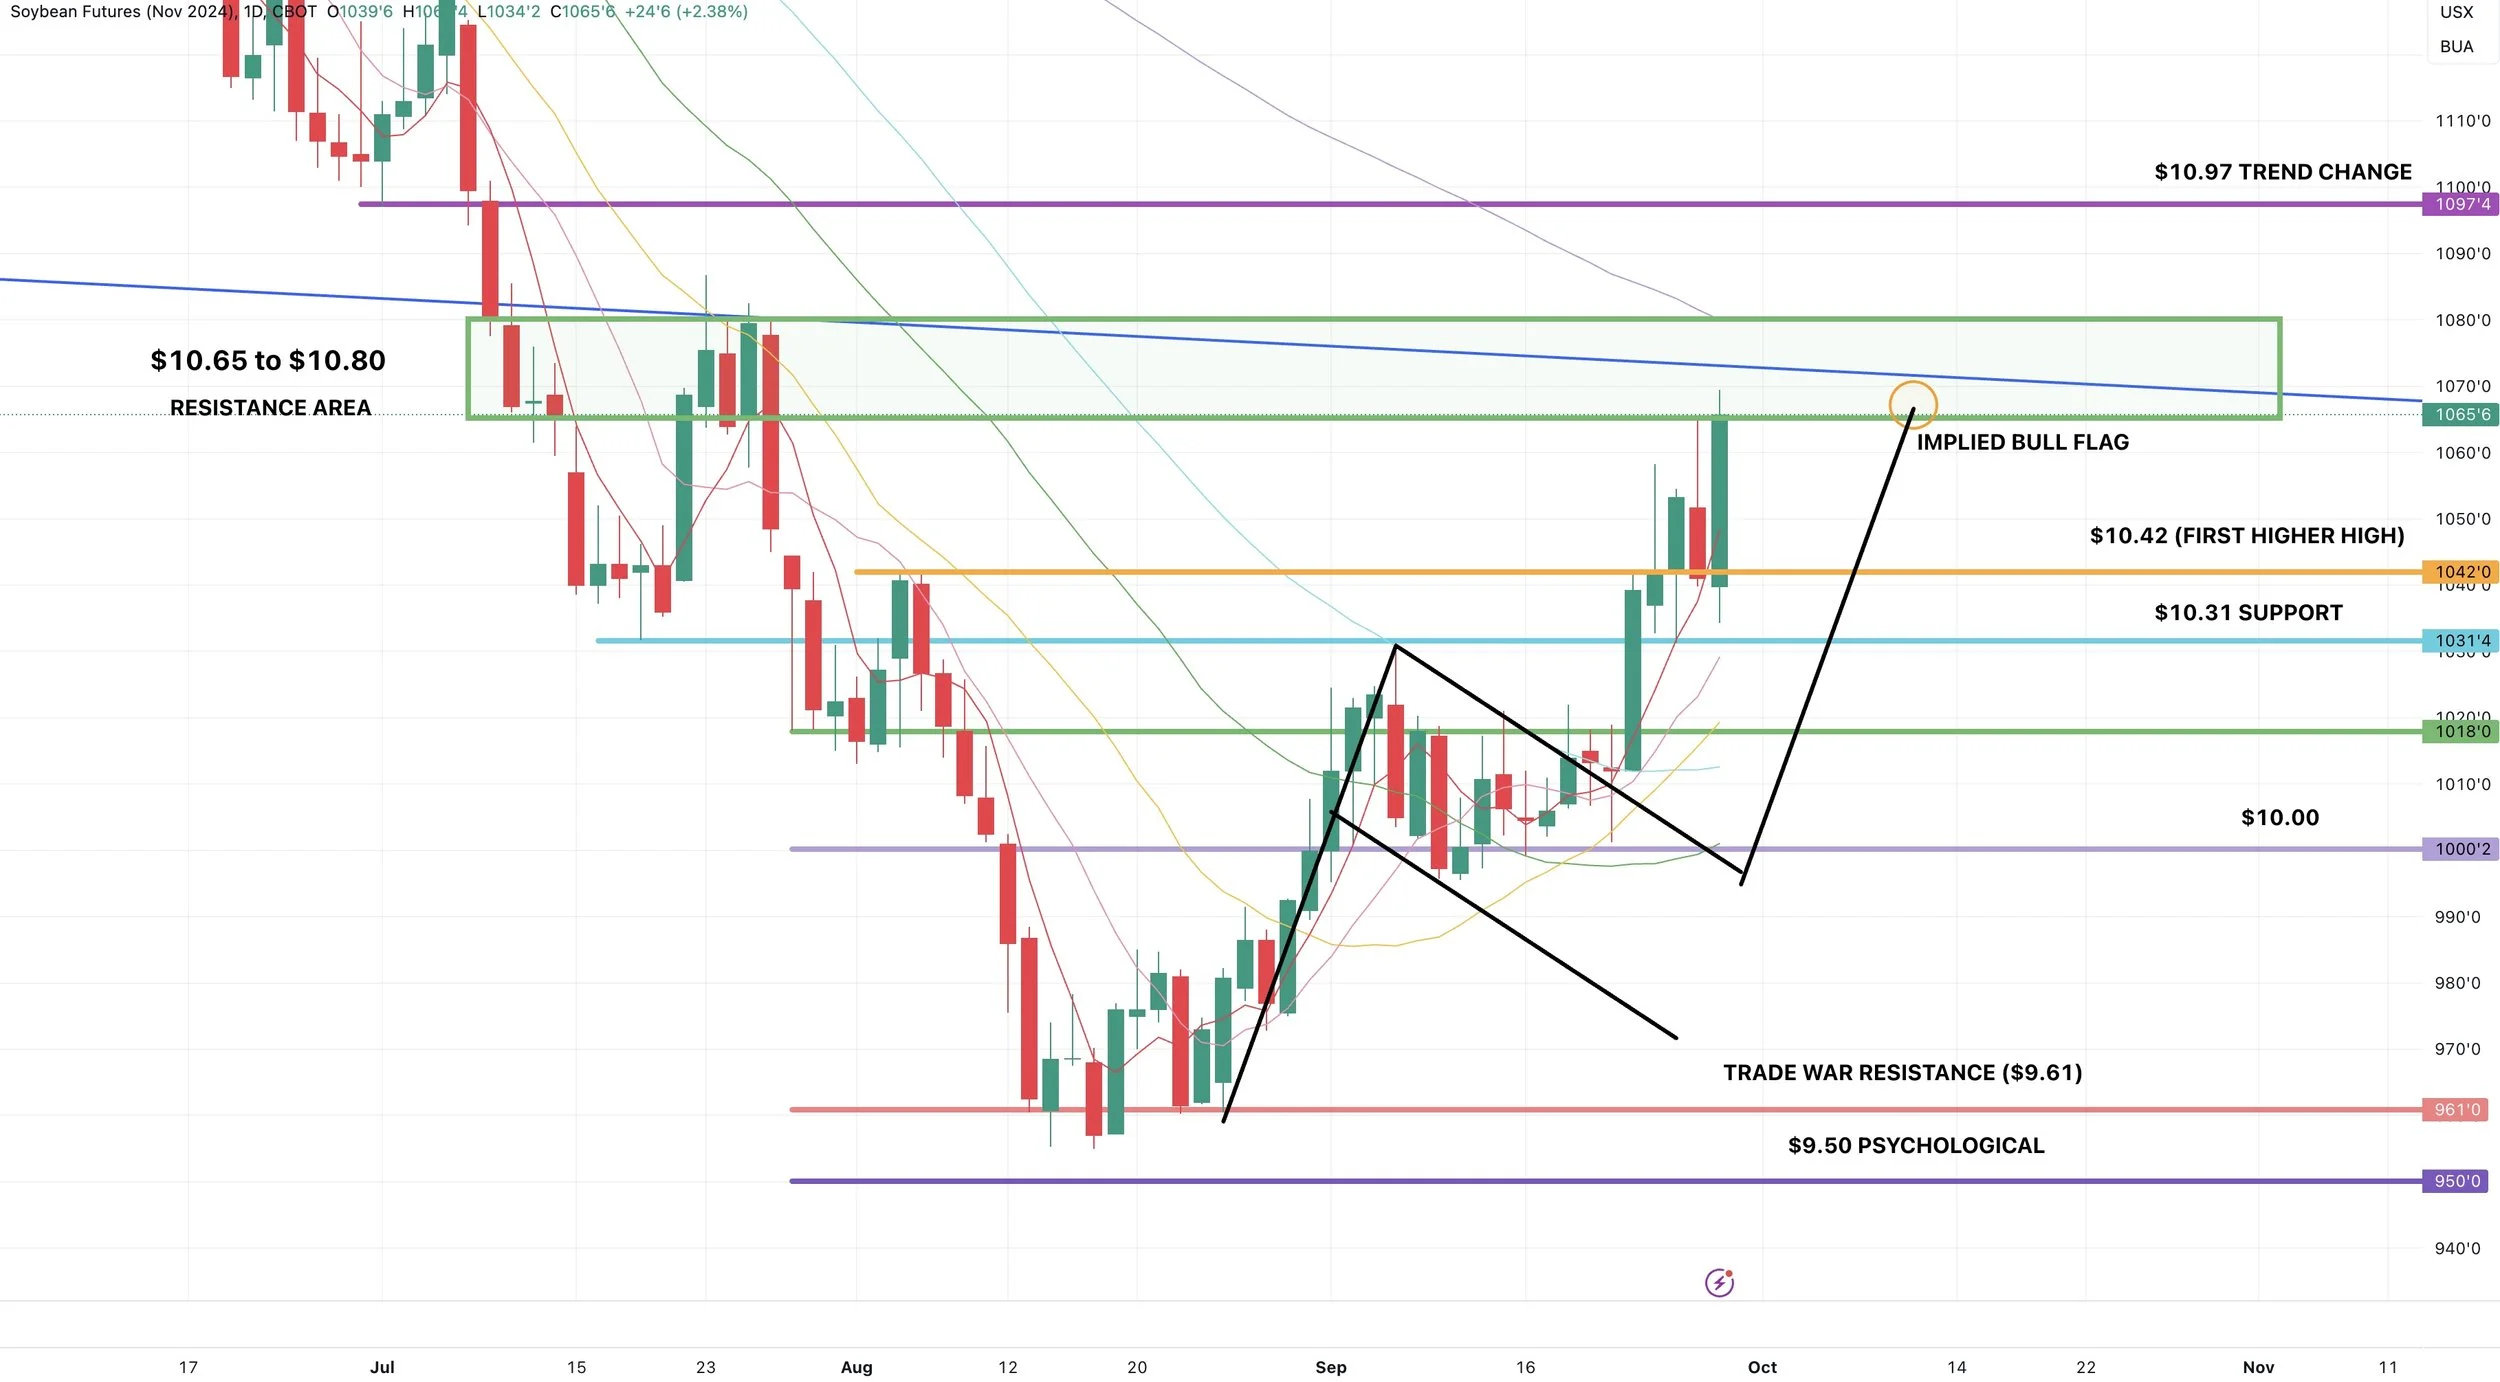
Today we alerted a sell signal for soybeans.
***
SELL SIGNAL:
For most it might make sense to make small sales or add puts for protection between $10.65 to $10.80
Will be making another round of small sales or protection if we crawl to $10.97
Take advantage of the carry.
So $10.65-$10.80 Nov basis or $11.15-$11.30 basis July futures.
We prefer buying puts to establish a floor, while selling an above the market call
Example: Sell $13 May call while buying the $10.60 Nov put
Call us to talk 1 on 1 (605)295-3100. Every operation is different.
I think we can go higher, but a lot of unknowns. We are approaching resistance on the charts. Brazil may or may not rain. We have a report Monday that is often a big one that has been negative for beans the past 3/5 years. Makes sense to take a little risk off here.
***
Realistically soybeans could very easily be $1.00 higher in a few months. But they could also be $1.00 lower. Both are very very possible.
That is how important factors such as if Brazil gets rain or not are. So it makes sense for many to take some risk off despite there being potential for more plenty of more upside.
If you look at the chart, this $10.65 to $10.80 area has been my target to take a little bit of risk off (green box). As this could be a spot of good resistance.
$10.65 was also the implied move for the bull flag breakout.
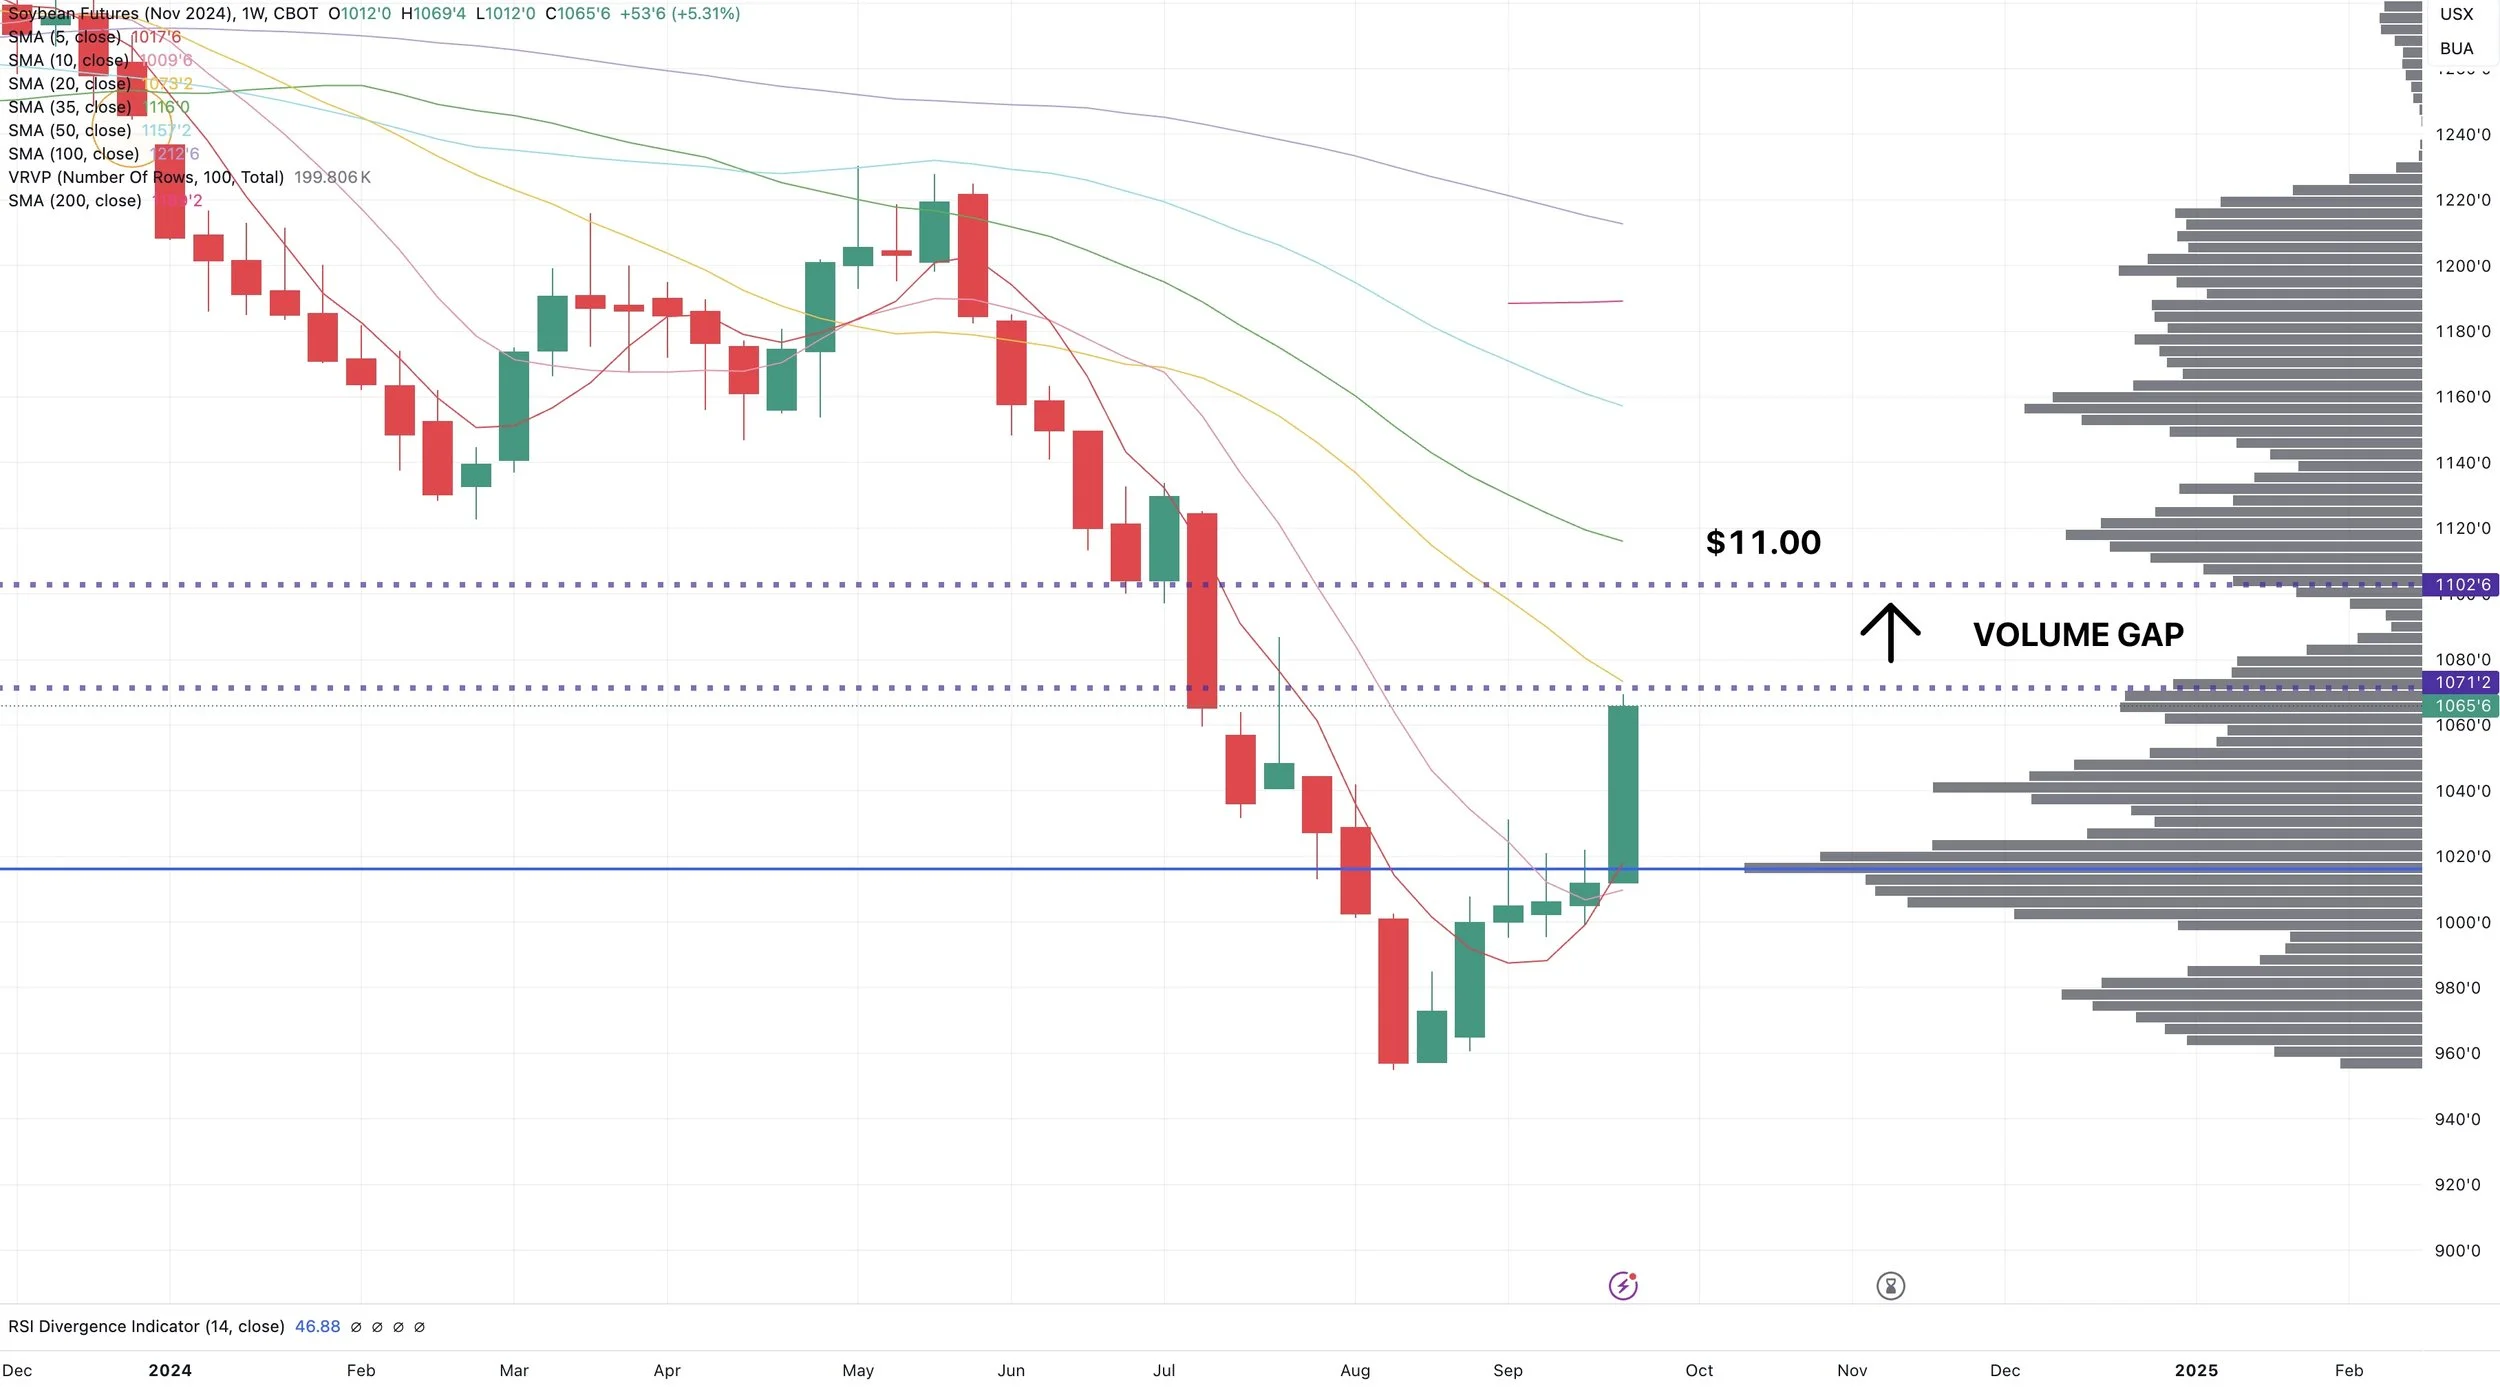
If we can clear this area, $10.97 is the next logical target and spot to take more risk off.
If we clear this level, we also have a volume gap up to $11.00
Weekly Nov Beans
So bottom line, I do think we have room to run higher.
But it makes sense to reward a $1.00 rally for the majority of you.
Our next spot to take risk off is $10.97 to $11.00
There are factors that could send us much much higher from here. But there are factors that could also send us a lot lower.
Historically, this USDA report Monday tends to be bearish for beans.
If Brazil gets rain we will take it on the chin. If it stays dry beans could go $1.00 higher.
Just have to play the cards we are dealt and manage our risk as best as we can with the unknowns.
Wheat
Not a ton on wheat today.
Our last two sell signals were:
May 22nd when wheat traded over $7.00
September 13th which was our recent high where we closed at $5.98
My next targets are still $6.12 and then $6.40
Looking at the chart, we continue to reject off this new downtrend. A break above should bring +$6.00
Plenty of factors globally that could lead to higher wheat down the road.
Want to Talk?
Our phones are open 24/7 for you guys if you ever need anything or want to discuss your operation.
Hedge Account
Interested in a hedge account? Use the link below to set up an account or shoot Jeremey a call at (605)295-3100.
Check Out Past Updates
9/26/24
NEW HIGHS BUT CONCERNING CLOSE
9/25/24
HIGHEST CLOSES SINCE JULY. UPSIDE & SALES CONSIDERATION
9/24/24
GREAT START TO THE DAY, AWFUL FINISH
9/23/24
MASSIVE DAY FOR THE GRAINS
9/22/24
EARLY YIELD TALK, DROUGHT, BRAZIL, SEASONAL LOWS & MORE
9/19/24
GRAINS SEE TECHNICAL SELLING
9/18/24
FED DROPS RATES, BRAZIL STORY, 2025 SALES?
9/17/24
TARGETS & WHAT TO DO IF YOU BOUGHT PROTECTION
9/16/24
WAS TODAY HEALTHY CORRECTION BEFORE GRAIN RALLY RESUMES?
9/13/24
CORN & WHEAT BREAK OUT: EVERYTHING YOU NEED TO KNOW
9/12/24
USDA RAISES YIELD BUT REPORT WASN’T ALL THAT BEARISH
9/11/24
USDA TOMORROW. MAKE OR BREAK SPOT ON CHARTS
9/10/24
USDA THURSDAY
9/9/24
LOWS ARE IN UNLESS SOMETHING FUNDAMENTALLY CHANGES?
9/6/24
GRAINS WEAK. OUTSIDE DOWN DAY ON CHARTS
9/5/24
GRAINS GET HEALTHY CORRECTION. GETTING READY TO PROTECT DOWNSIDE
9/4/24
GRAINS CONTINUE RUN. WAYS TO PLAY THE MARKET. WHAT’S YOUR SITUATION?
9/3/24
GRAINS CONTINUE BREAK OUT FROM LOWS
8/30/24
ANOTHER STRONG DAY. GETTING MORE CONFIDENT BUT NO CONFIRMATION
8/29/24
CHANCE FOR A BOTTOM, BUT STILL CAUTIOUS. DIFFERENT MARKETING APPROACHES
8/28/24
WHEAT FOLLOW THROUGH WHILE CORN & BEANS GIVE BACK
8/27/24

