USDA PREVIEW & COUNTER SEASONAL RALLIES?
Overview
Fresh lows in the grains after opening the day higher across the board.
July corn closed -11 cents off it's highs, July beans -17 off their highs, and July wheat -15 off their highs.
Overall awful performance, closing well off the highs which leads to the charts looking even more vulnerable to further downside from a technical standpoint.
We have a few main reasons for the lower prices.
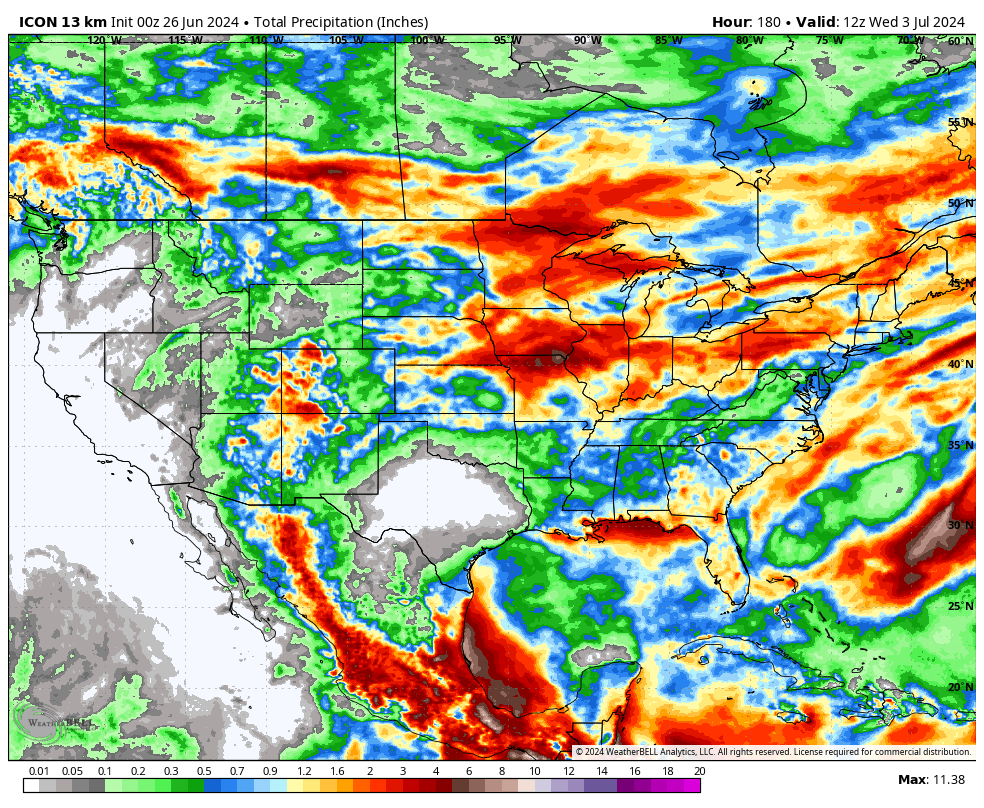
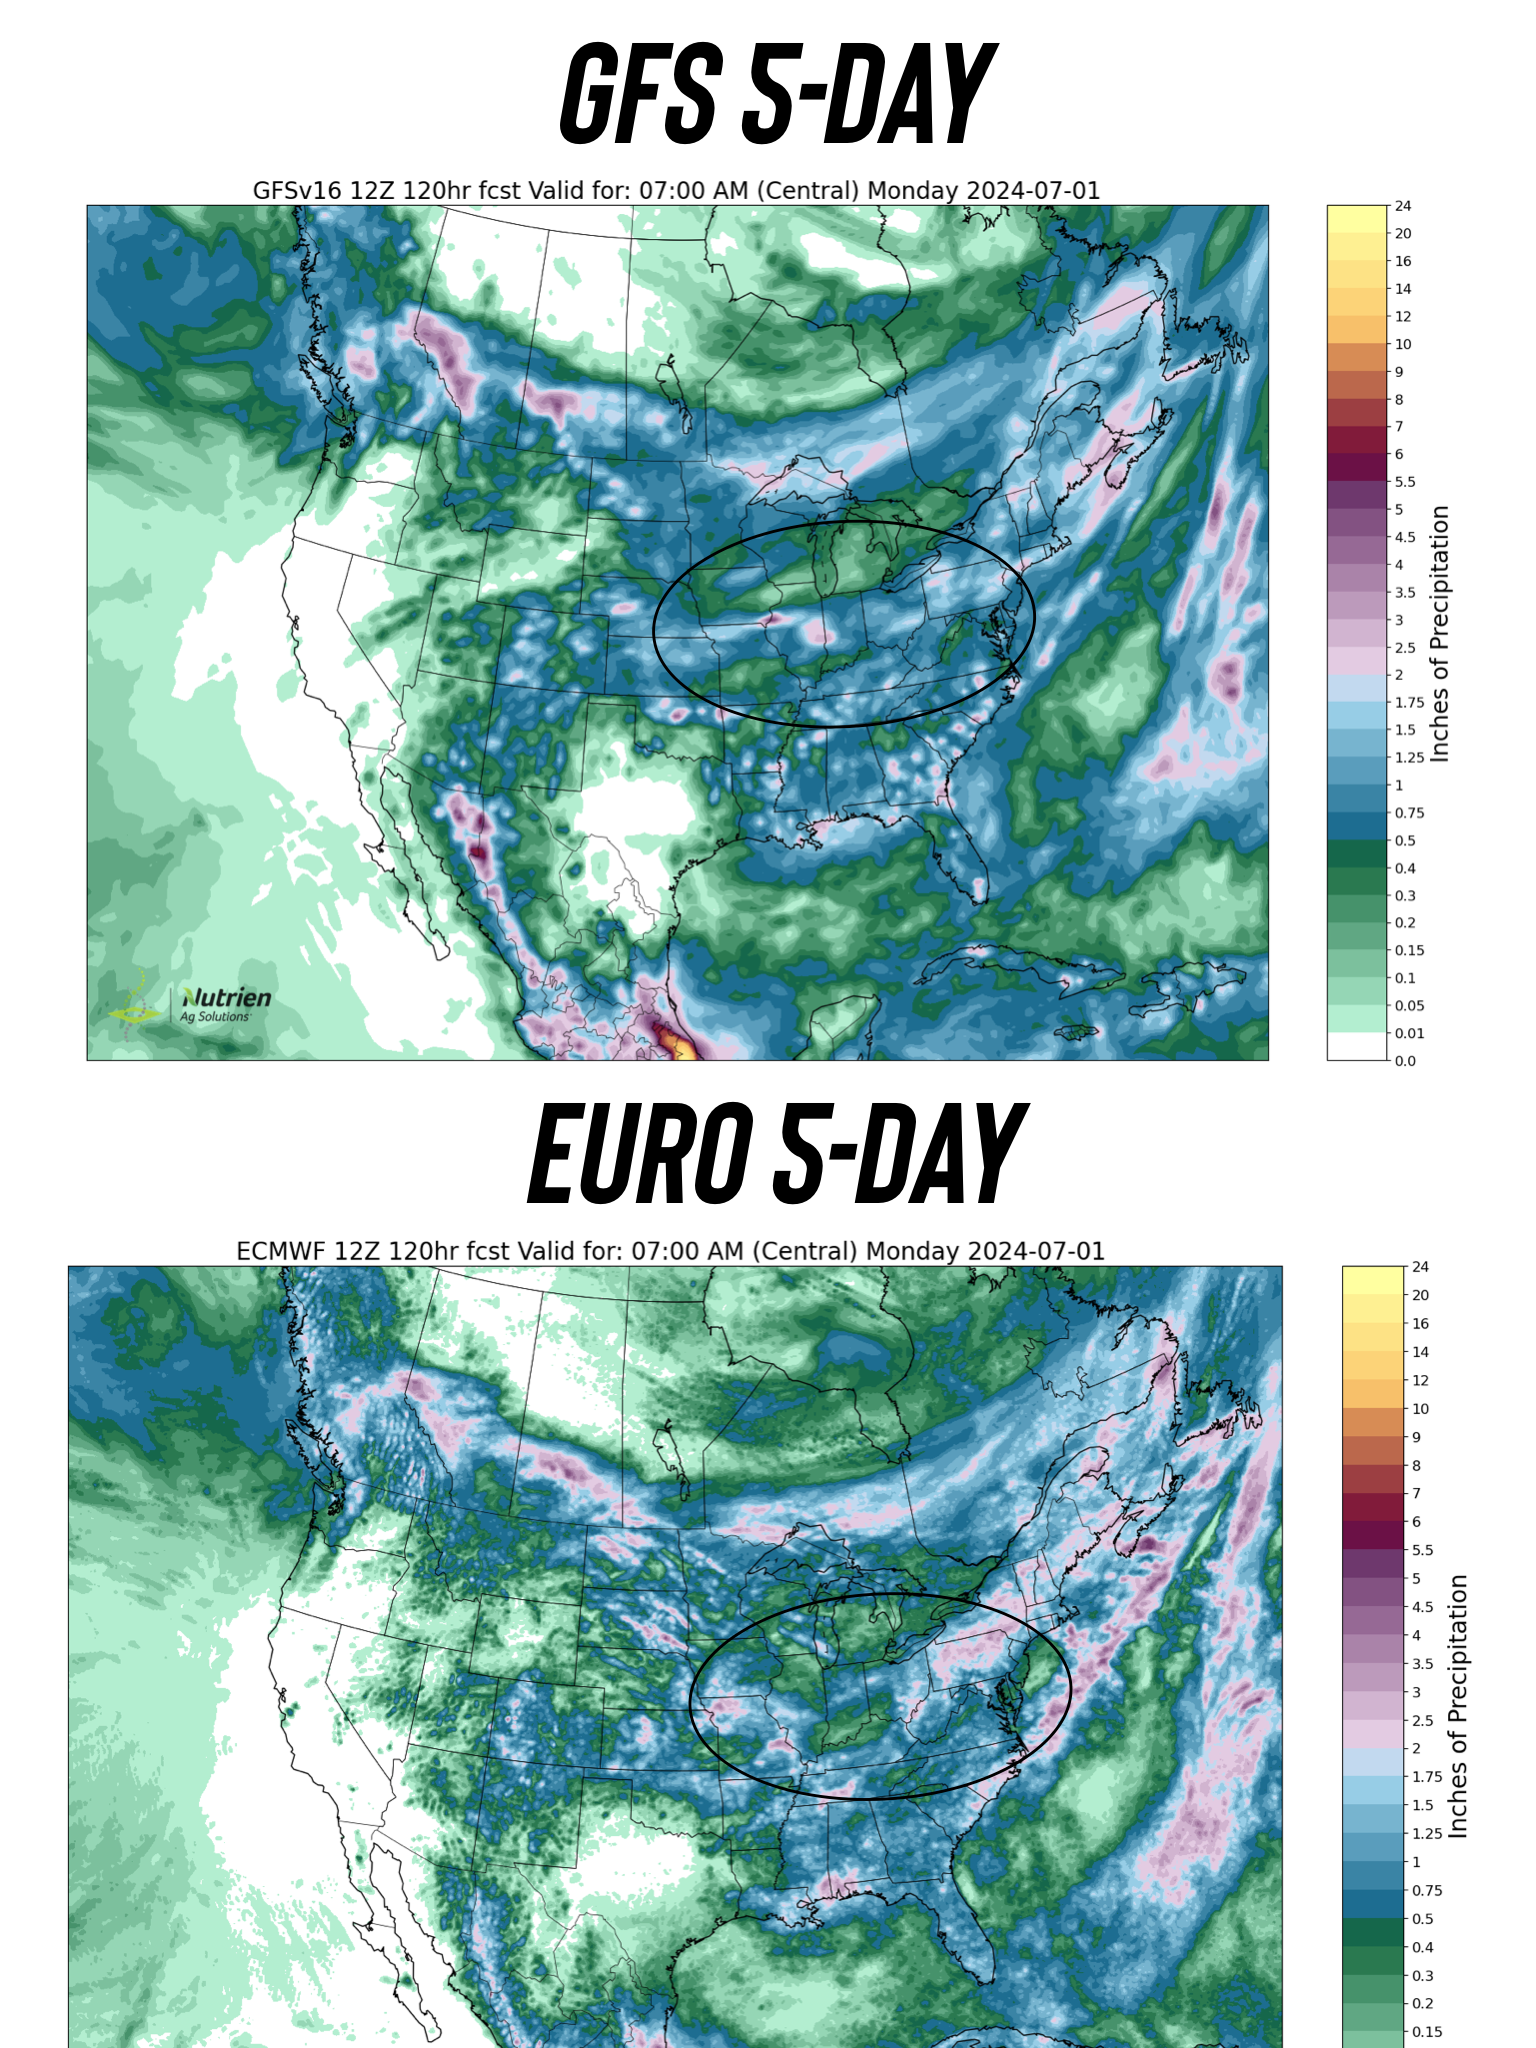
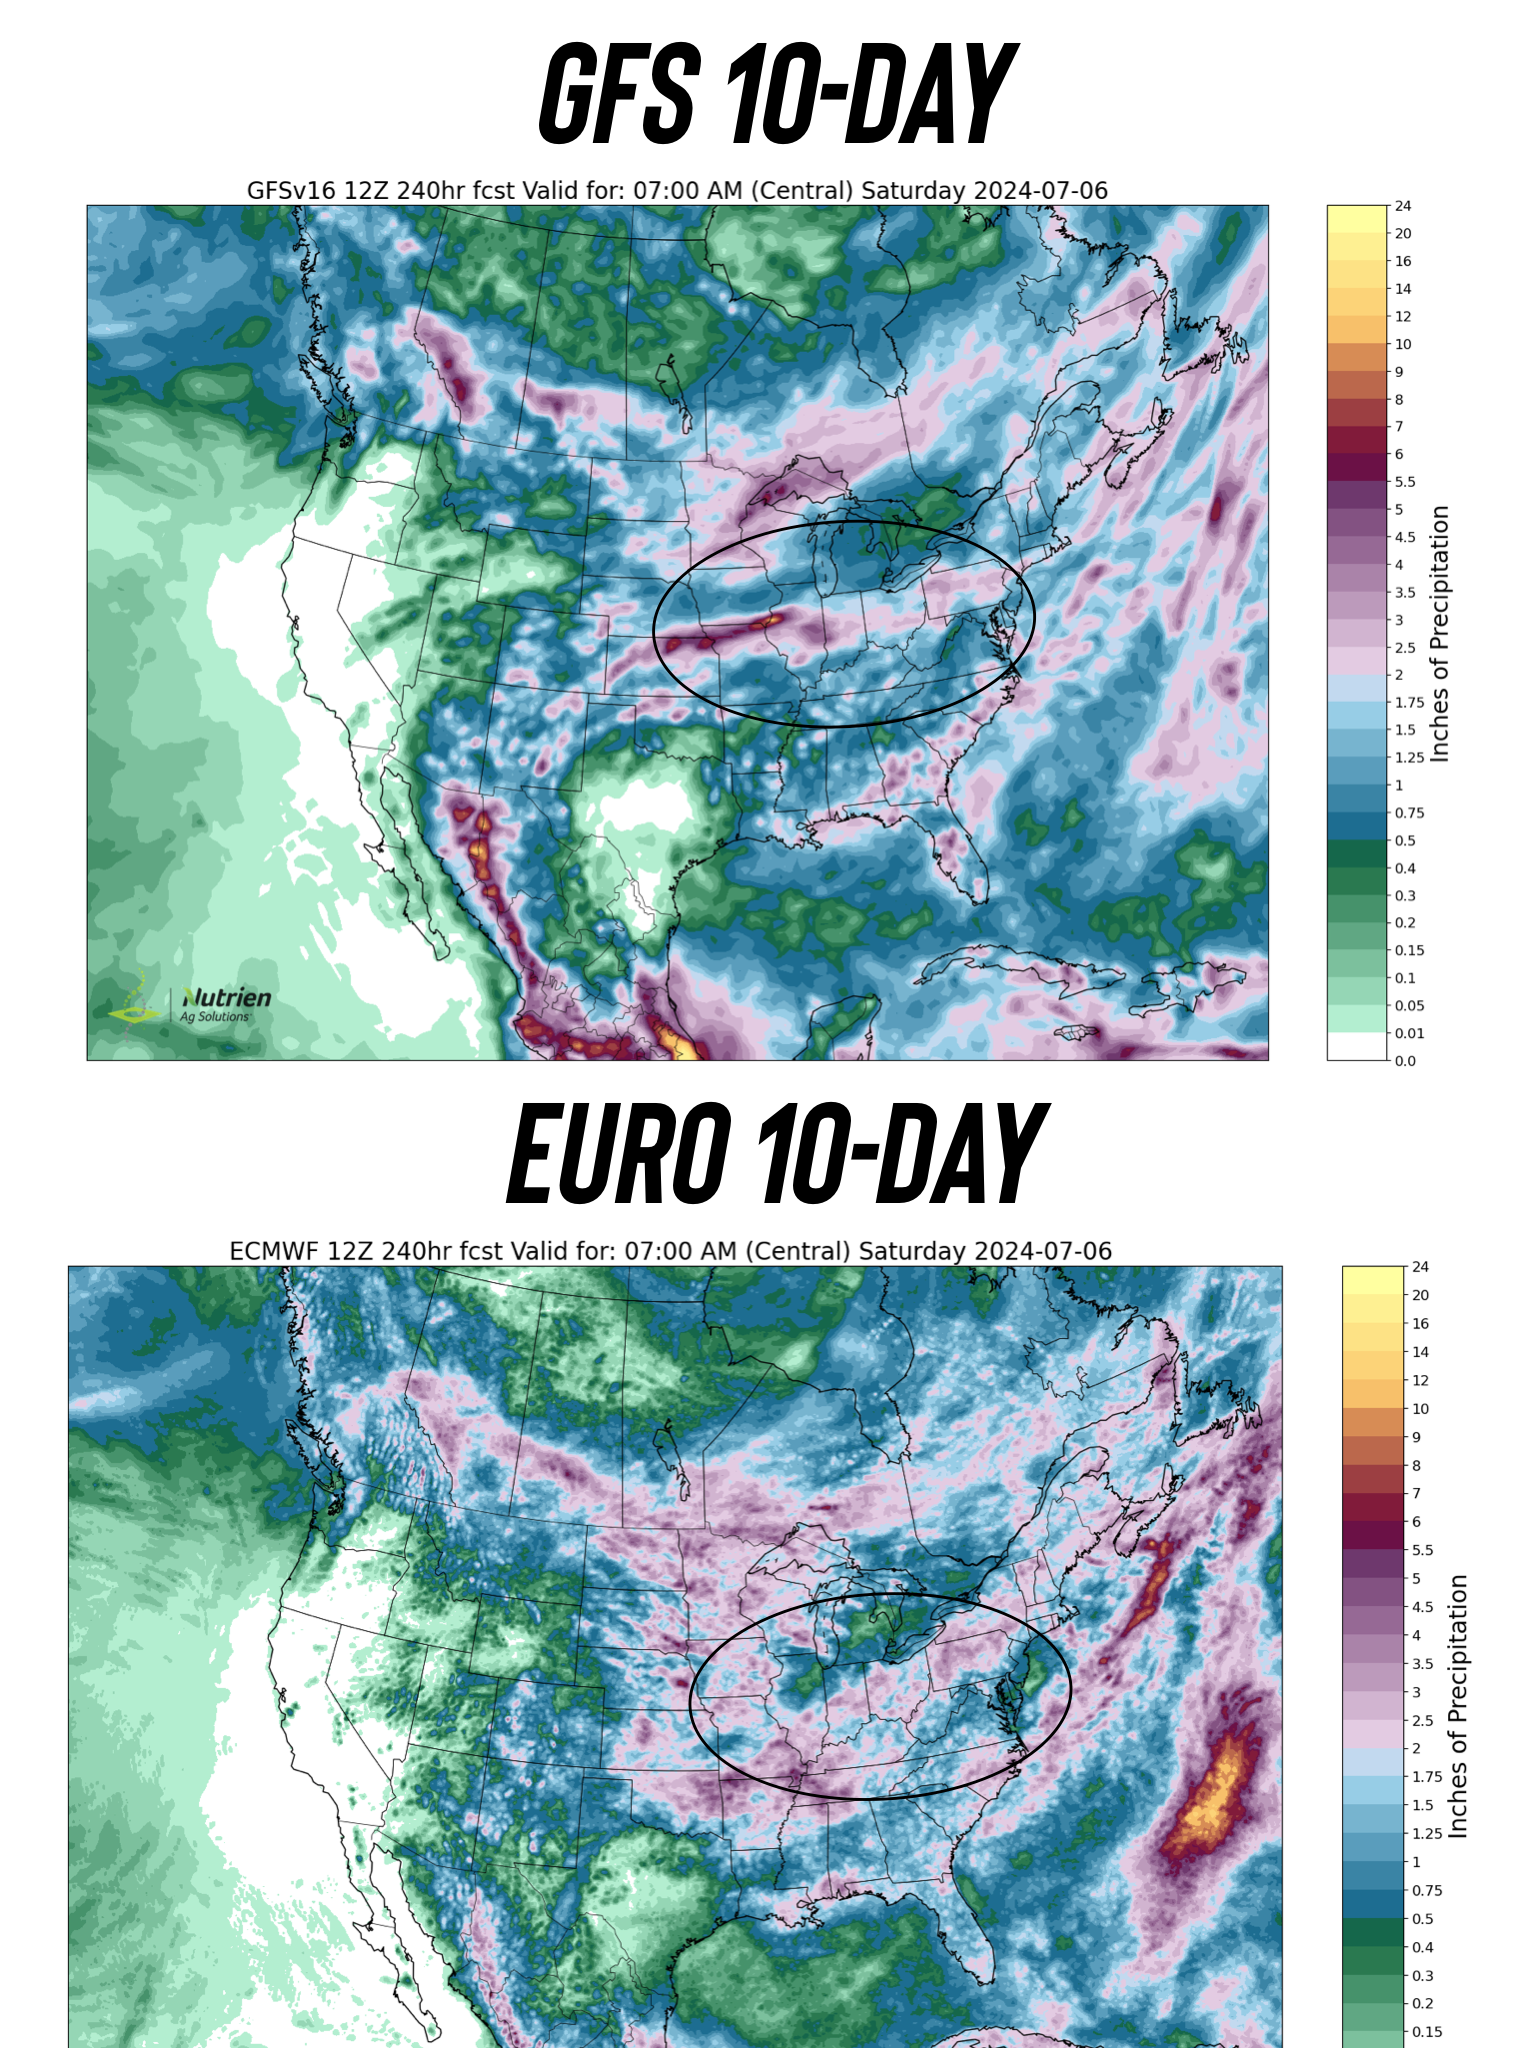
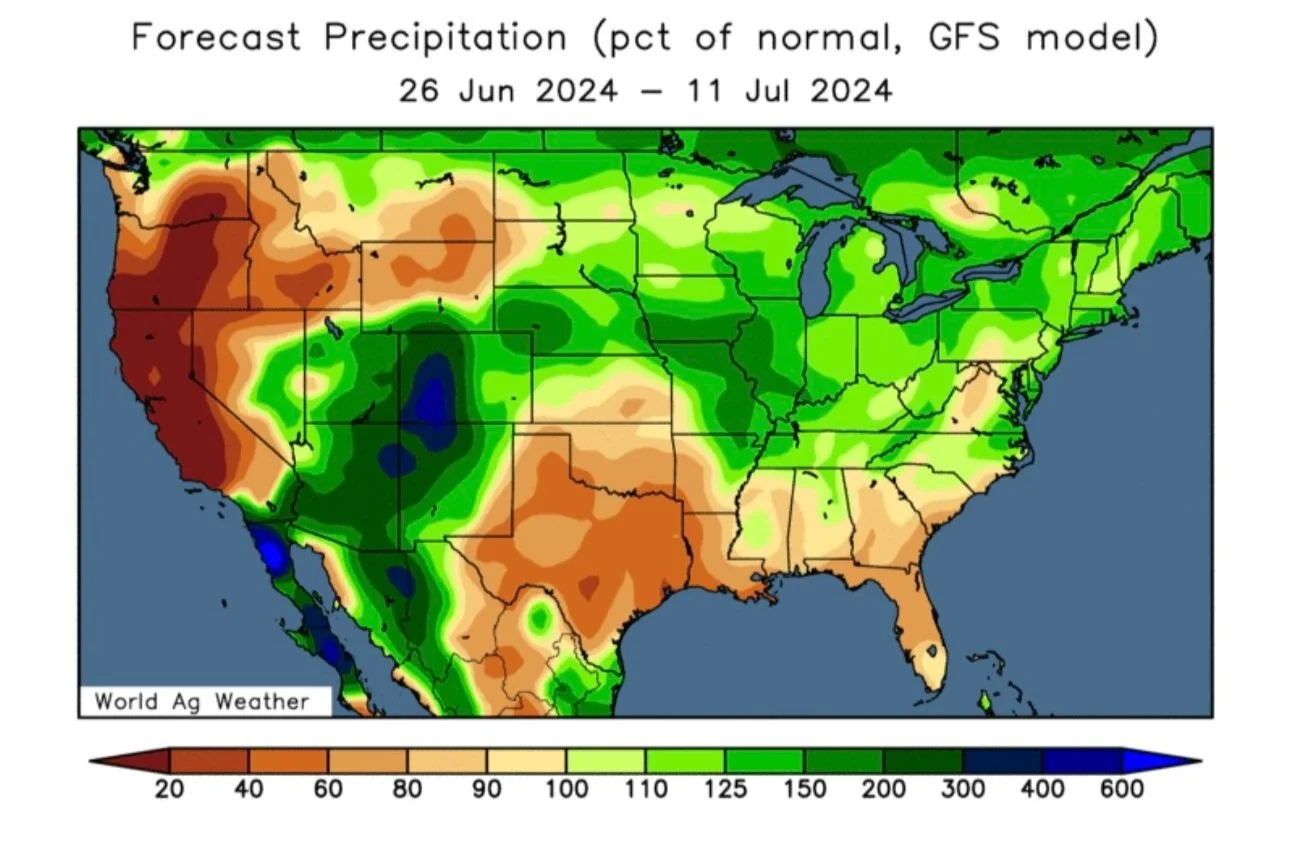
1.) There is rain in the forecasts for areas that have missed it. Some of those rains from Minnesota and South Dakota area are flowing into the eastern corn belt.
Rain in late June will always be viewed as bearish. No matter how many areas are suffering from flooding. The trade views this as rain makes grain. Above average crop conditions to go along with a wet forecast is negative.
2.) We have basis contracts that need to be rolled or priced along with first notice day. This almost always brings some bearishness especially if the US farmer is holding a larger amount.
3.) The USDA report Friday. It has the potential to be the biggest of the year. Everyone and the trade has started penciling in and preparing for bearish numbers.
The forecasts won’t be what matters Friday. This report has the potential to set the stages for higher or lower prices for the next few months.
USDA Preview
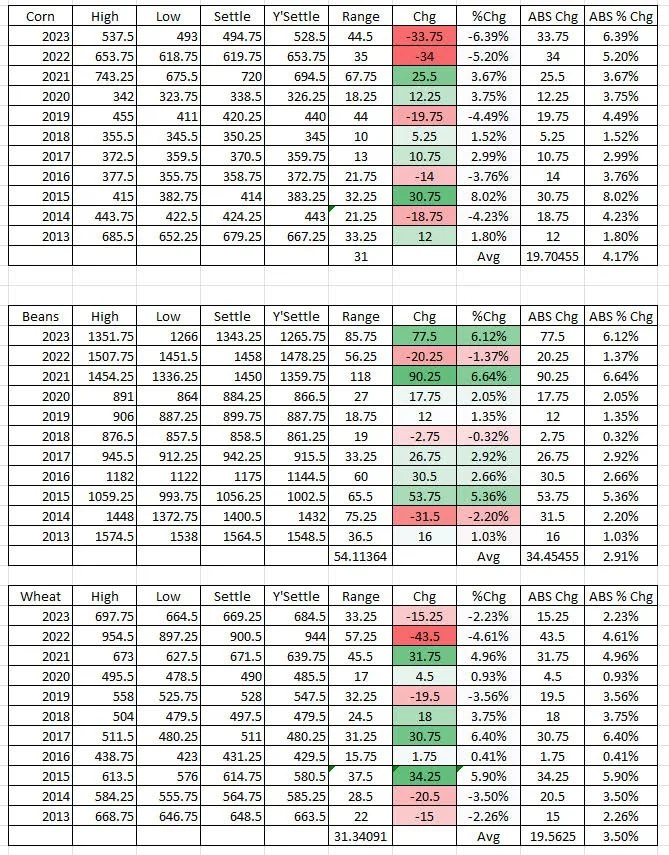
Here is the past 10 years of price changes the day of the report from @WalkSquak on Twitter.
As you can see this is a MAJOR market mover.
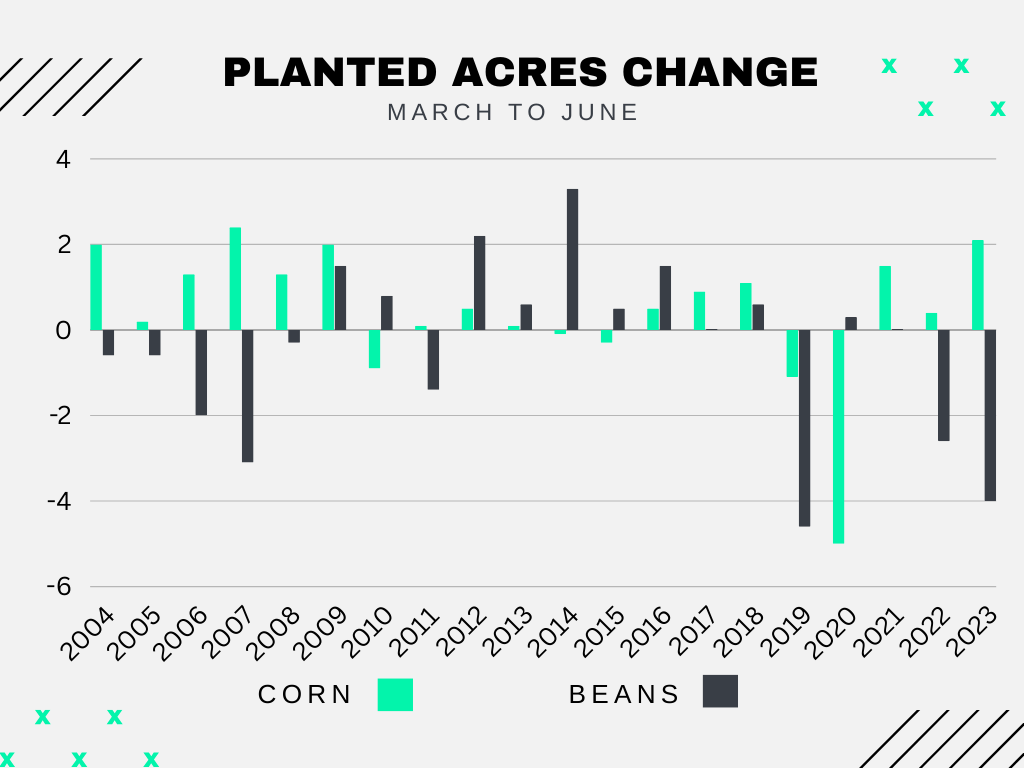
They see acres up slightly from March for both corn & beans.
The ranges:
Corn: 89 to 91.3
Beans: 85.5 to 87.5
We typically do not see acres come in lower from March to June for corn.
We have only seen them lower essentially 3 times.
Beans on the other hand have been a mixed bag.
We have only seen both fall one time. While we have seen both raised 4 times.
Usually we see one higher and one lower, or pretty much unchanged.
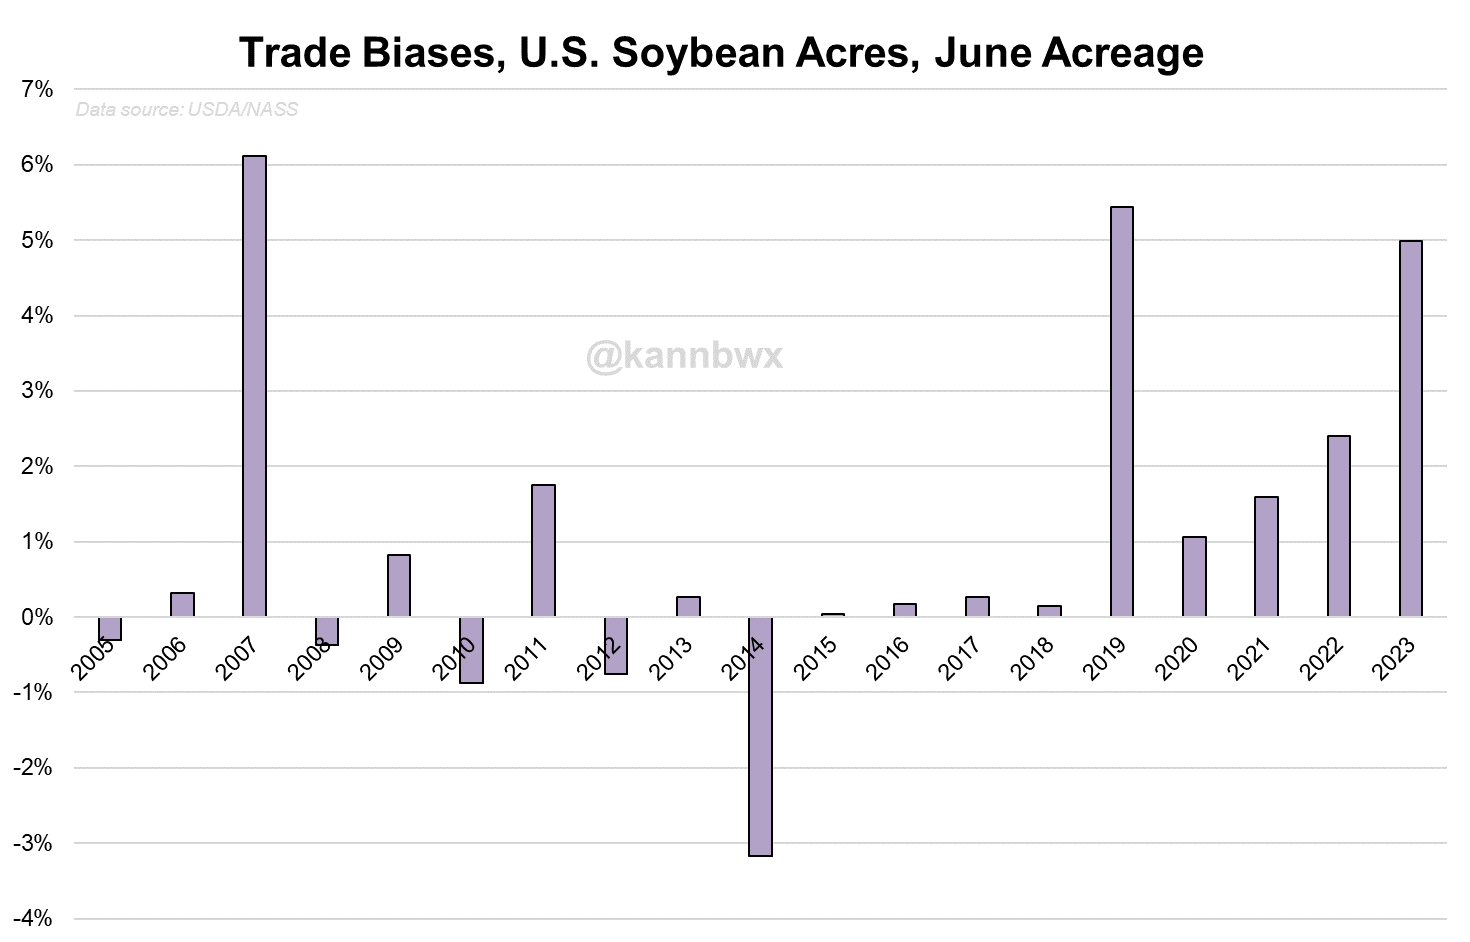
June acres tend to surprise.
We have landed outside of the trade range 4 of past 5 years in beans. 3 of the past 5 years in corn.
The estimates for soybeans have been way too high the past 5 years in a row.
There have only been 3 times where the trade guess was too low for bean acres.
Chart Credit: Karen Braun
Then the stocks.
This will be a good indication of how much the US farmer is holding. The less the farmer is holding, the easier it will be for prices to rally. The more they hold, the harder a rally will be.
Some of you that remember the 2009 light test weight crop, will also remember the USDA June 2010 report that lead to a multiple year bull run for the grain markets. As all of the sudden we lost the stocks, which actually where never there. So this report has a history of being when the USDA has had to come clean about previous years crops.
Will this happen on Friday? Basis indicates it is possible.
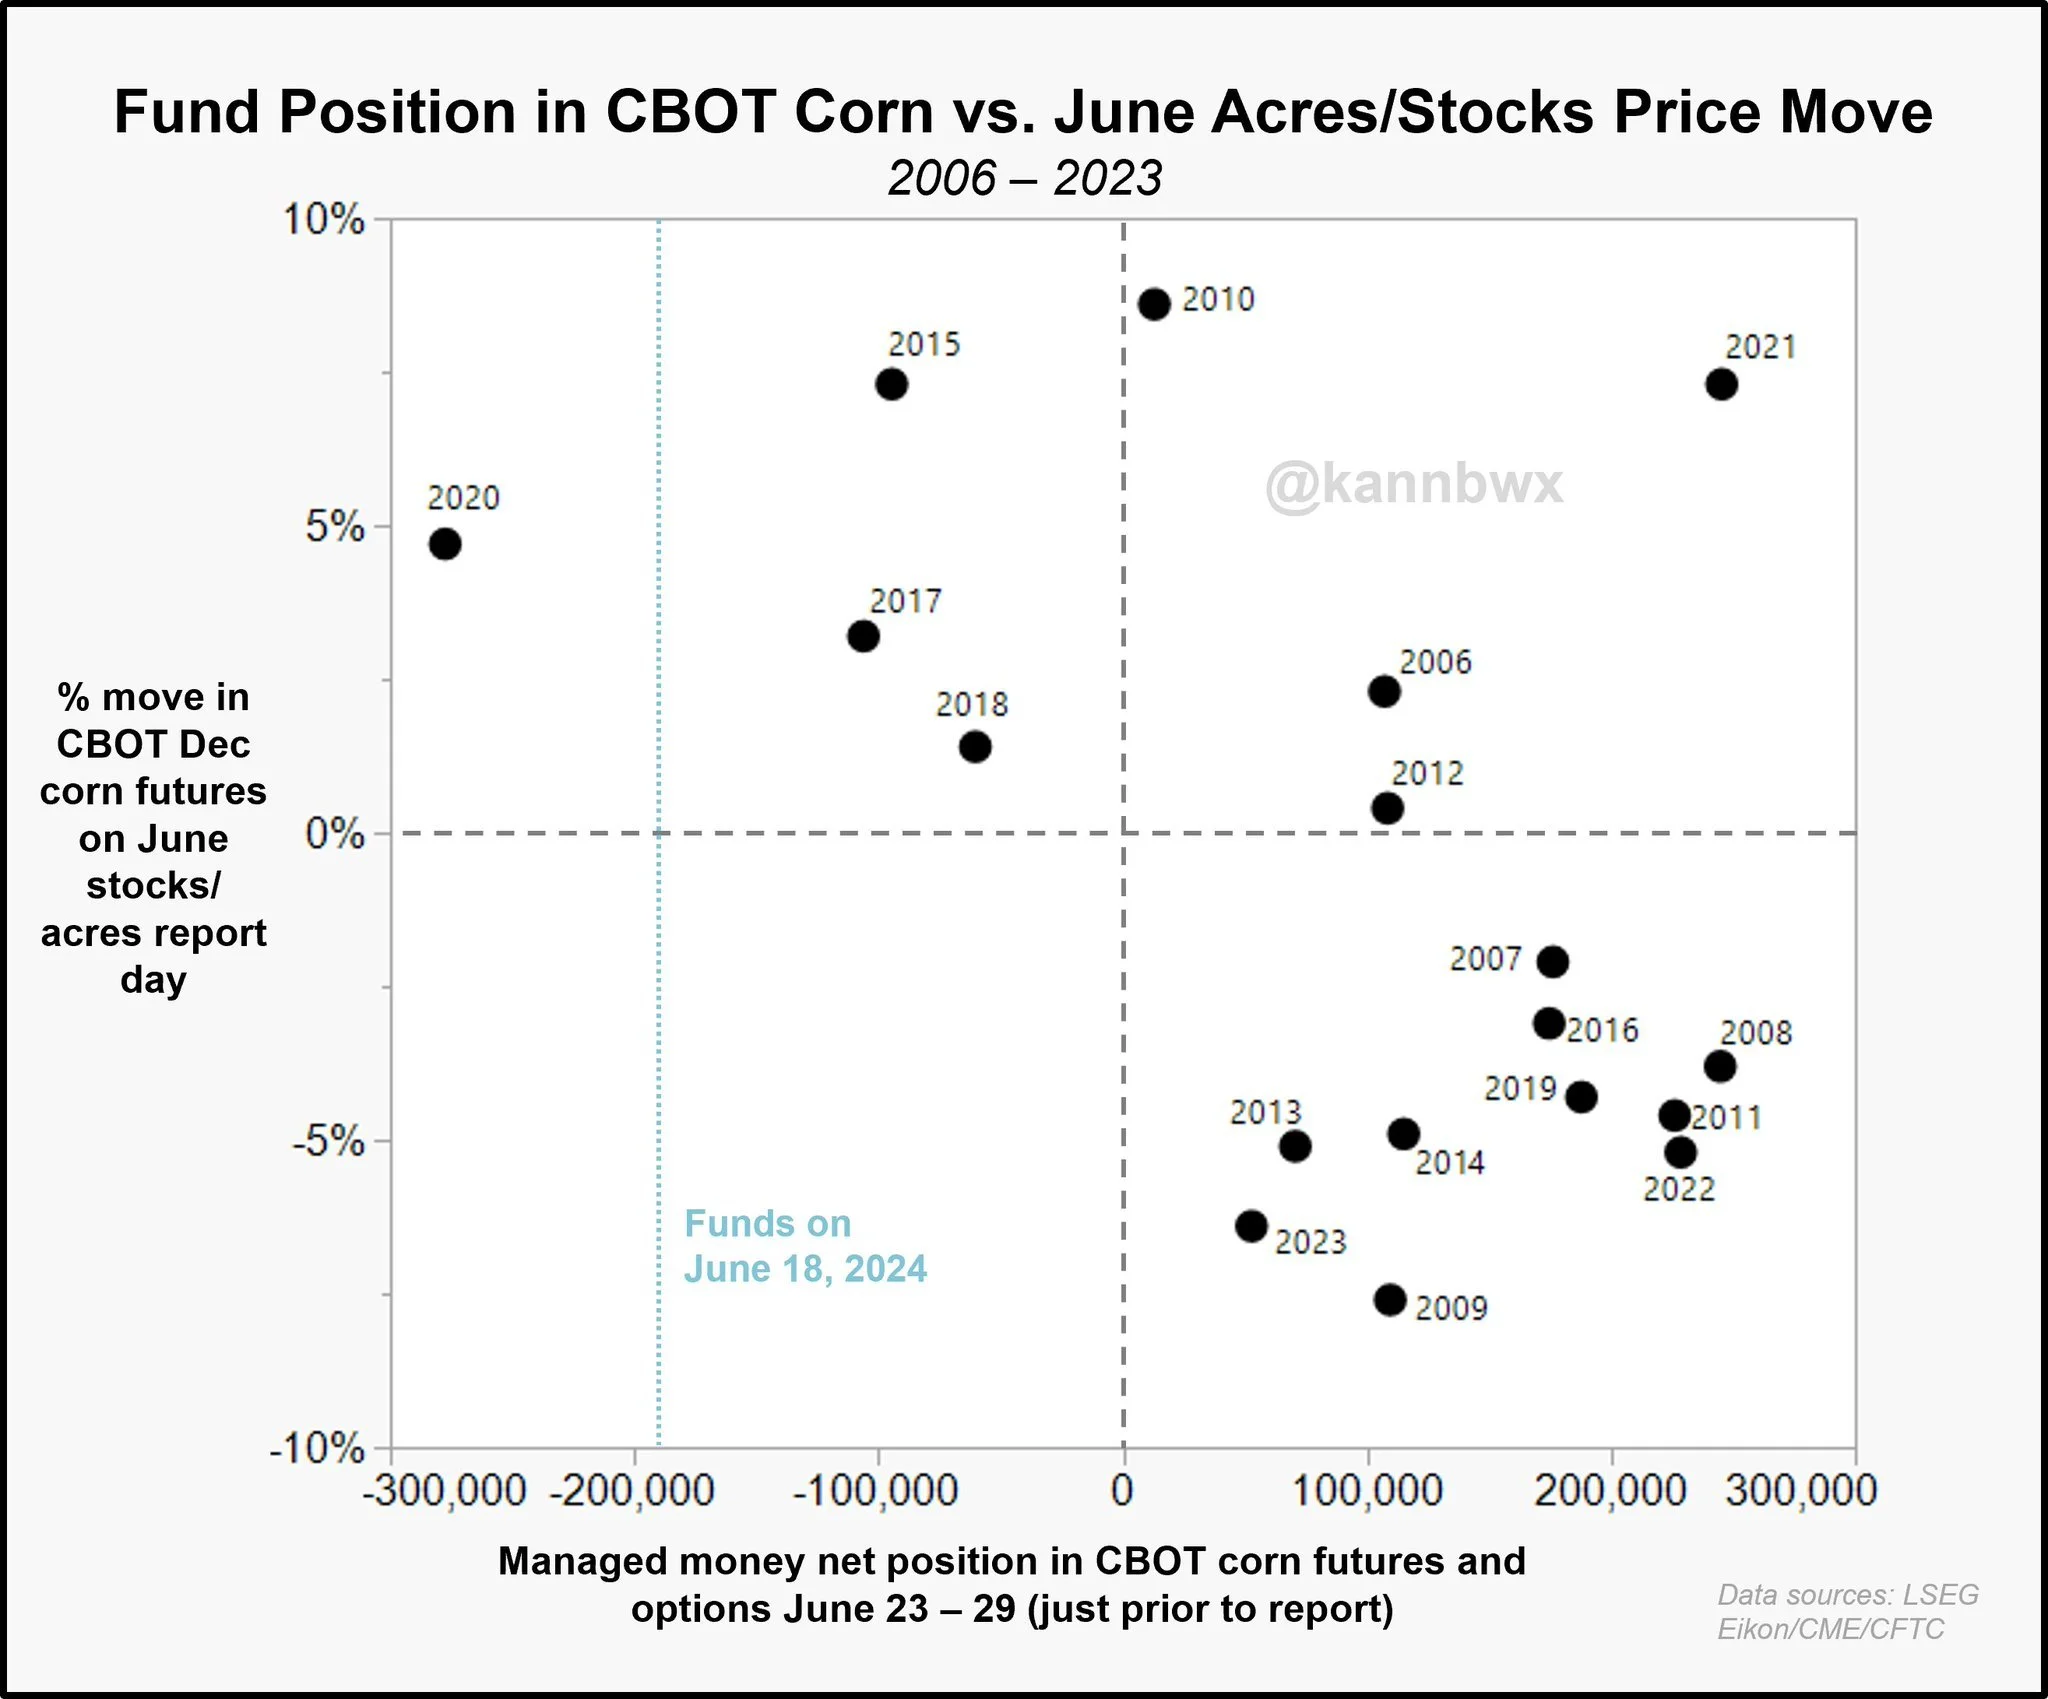
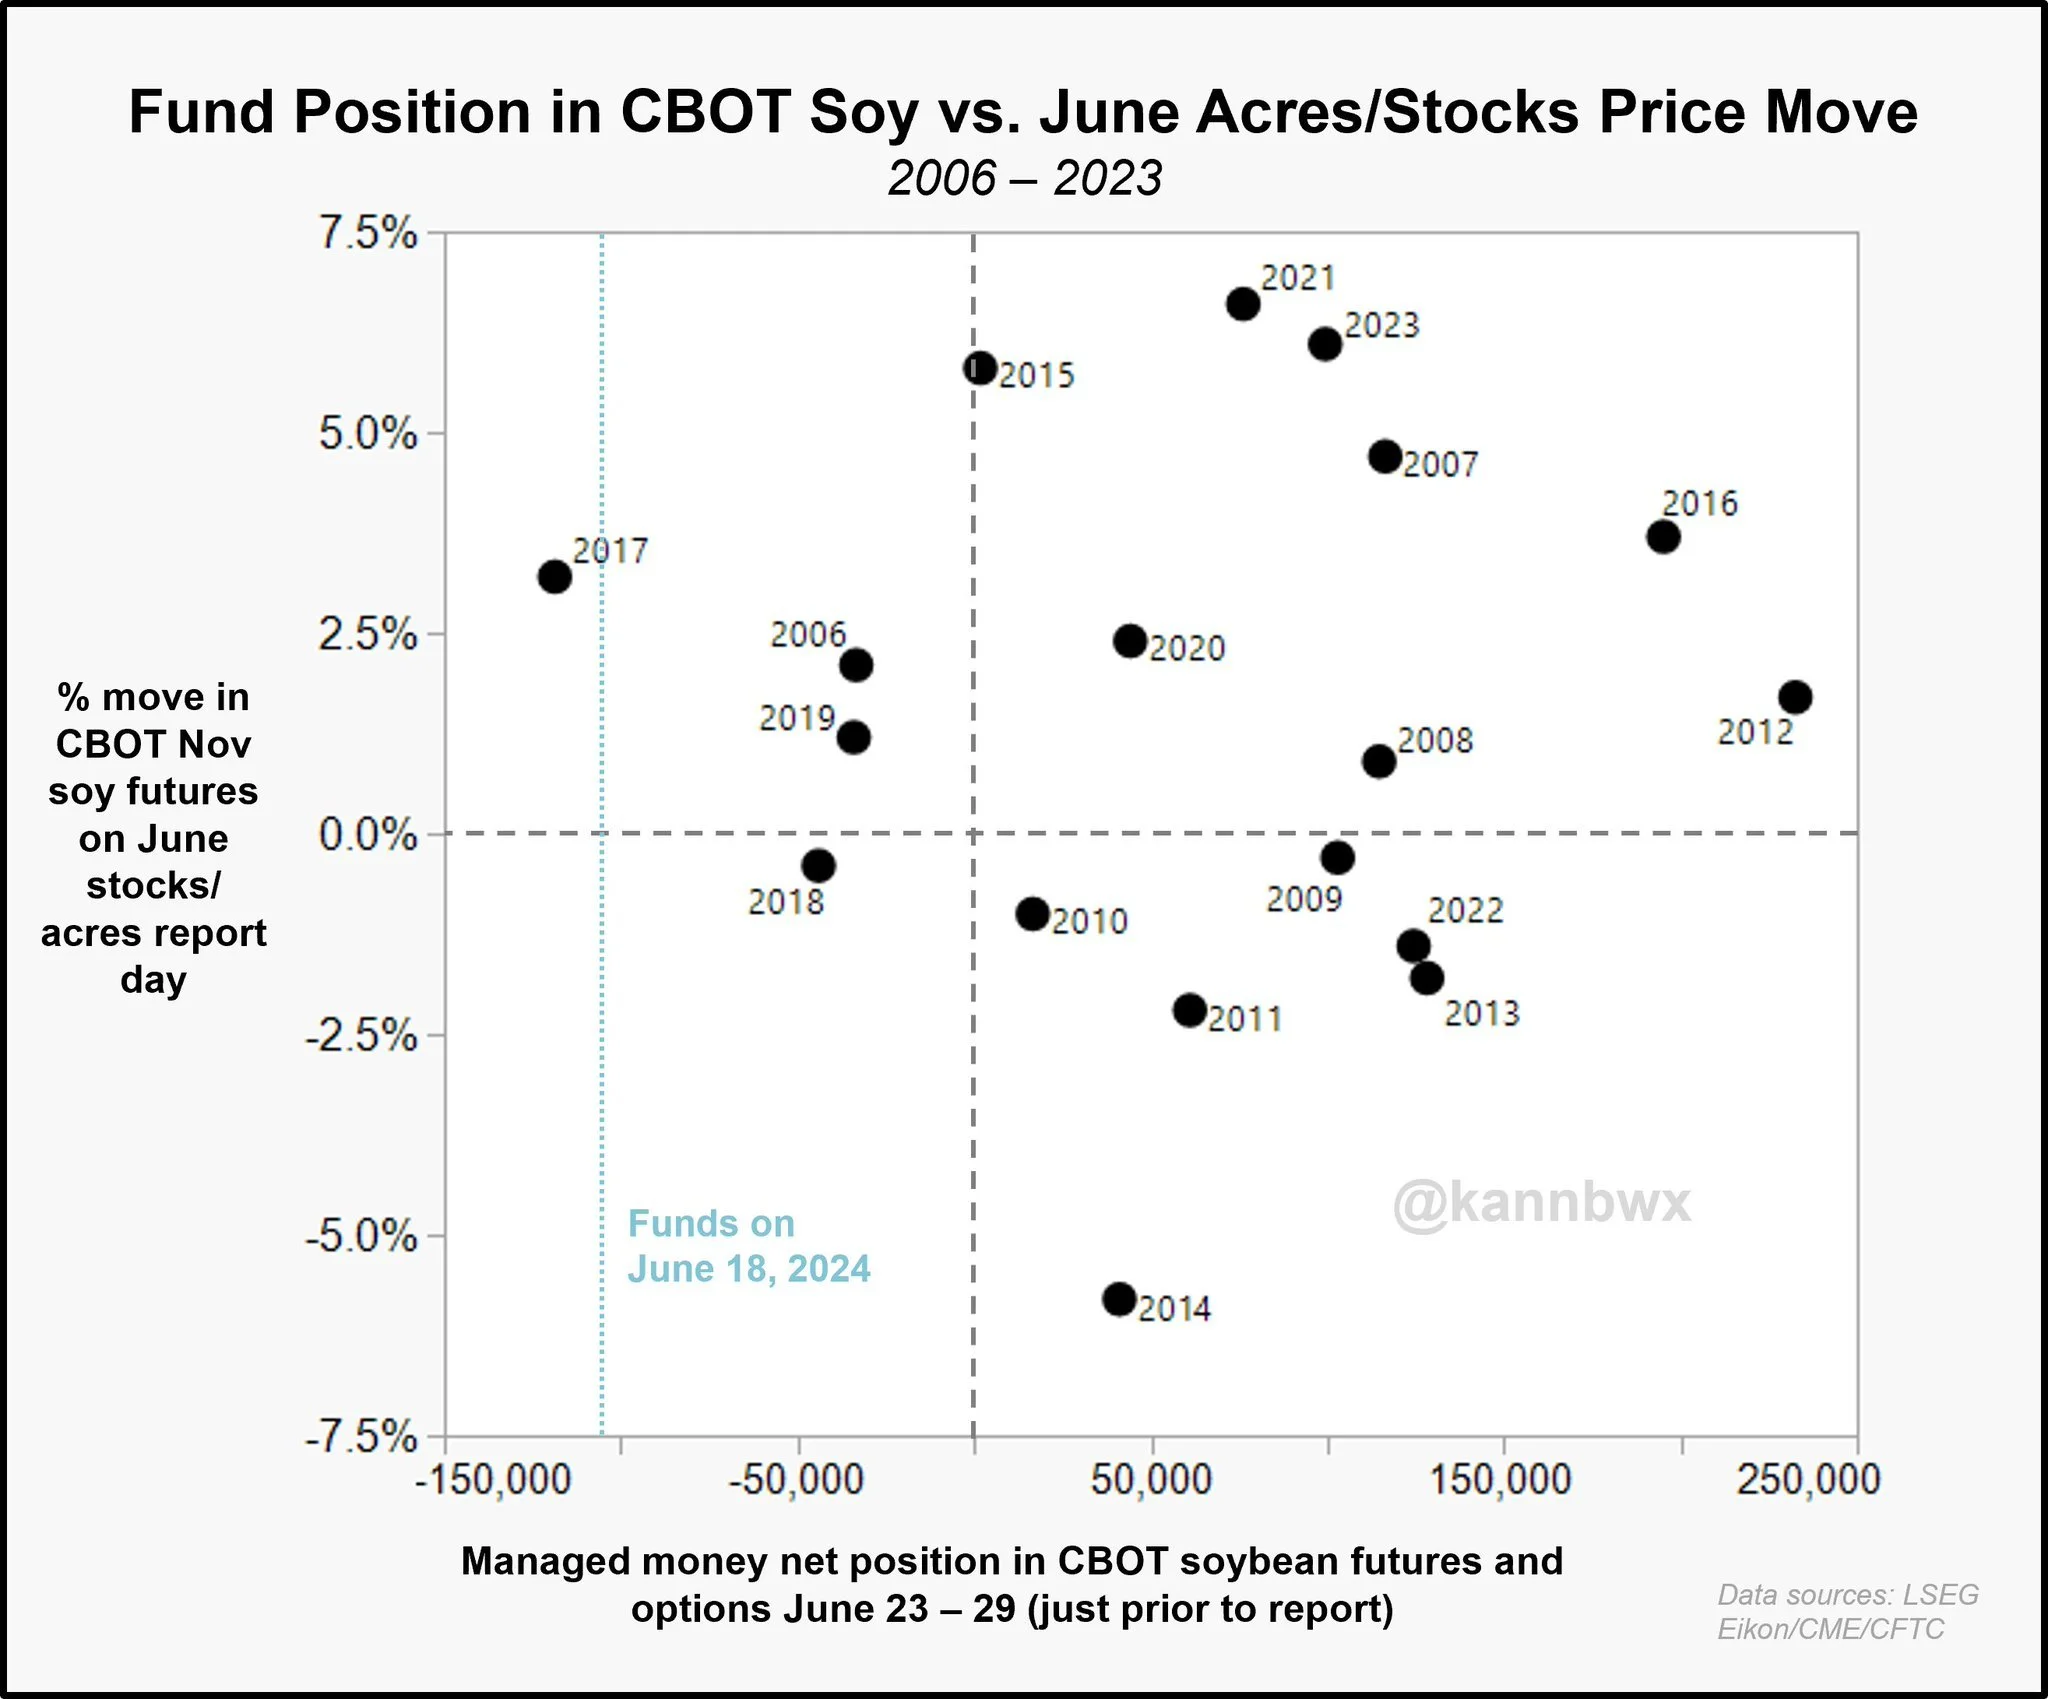
Here are two more interesting charts from Karen Braun.
We know the funds are heavily short. Some of the shortest all time for this time frame of the year.
The funds are usually long this time of year.
She pointed out that Dec corn has not fallen on report days when the funds were short. (Top left dots).
Just like corn, the funds are not usually short beans this time of year.
There isn’t many examples, but when they have been short the only year we got a bearish report was 2018.
Today's Main Takeaways
Corn
Corn posts new lows, as July corn finally broke below those Feb lows of $4.22 and Dec corn trades to it's lowest levels since 2021.
2014 or Counter Seasonal Rally?
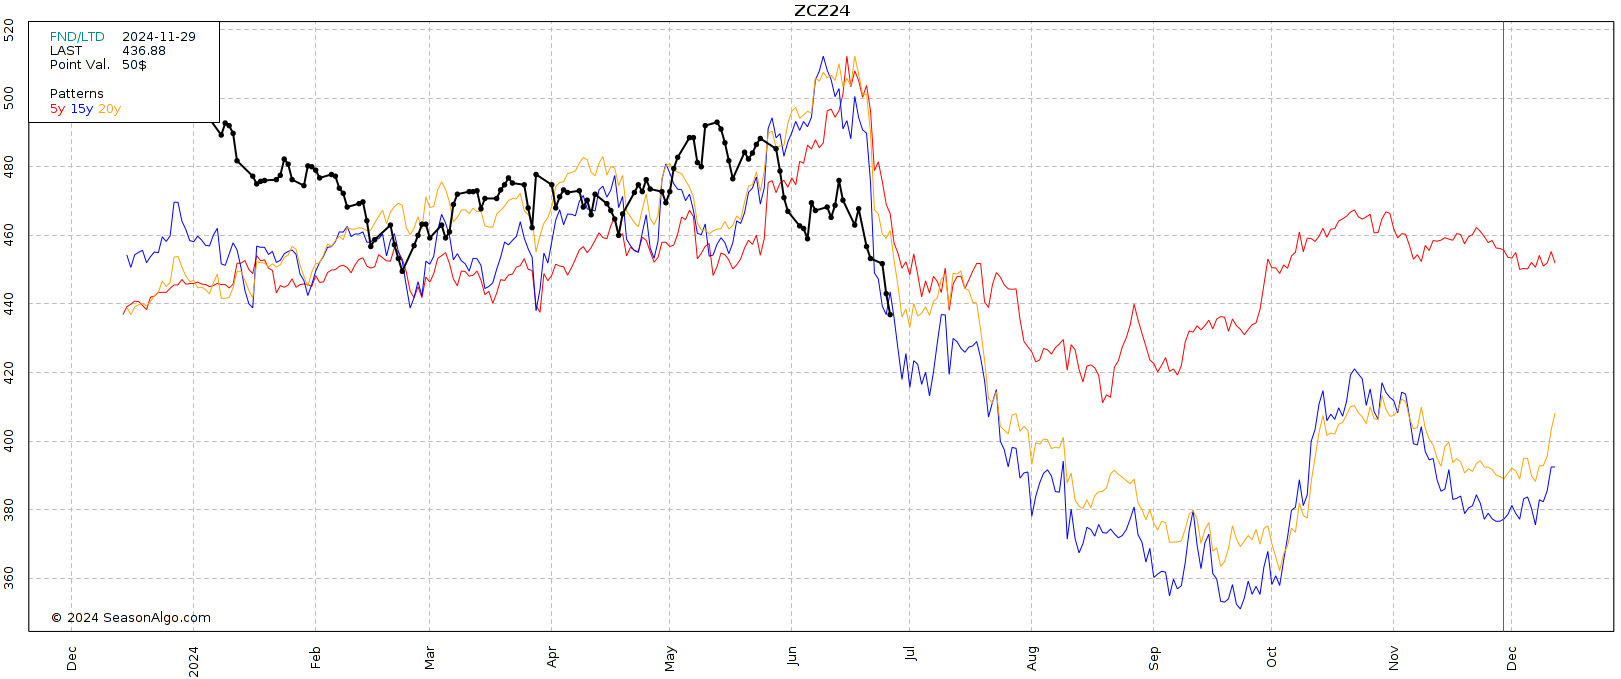
Here is Dec 2024 corn (black line) compared to the 5, 15, & 20 year patterns.
Seasonally, yes the majority of the time we do lower from here.
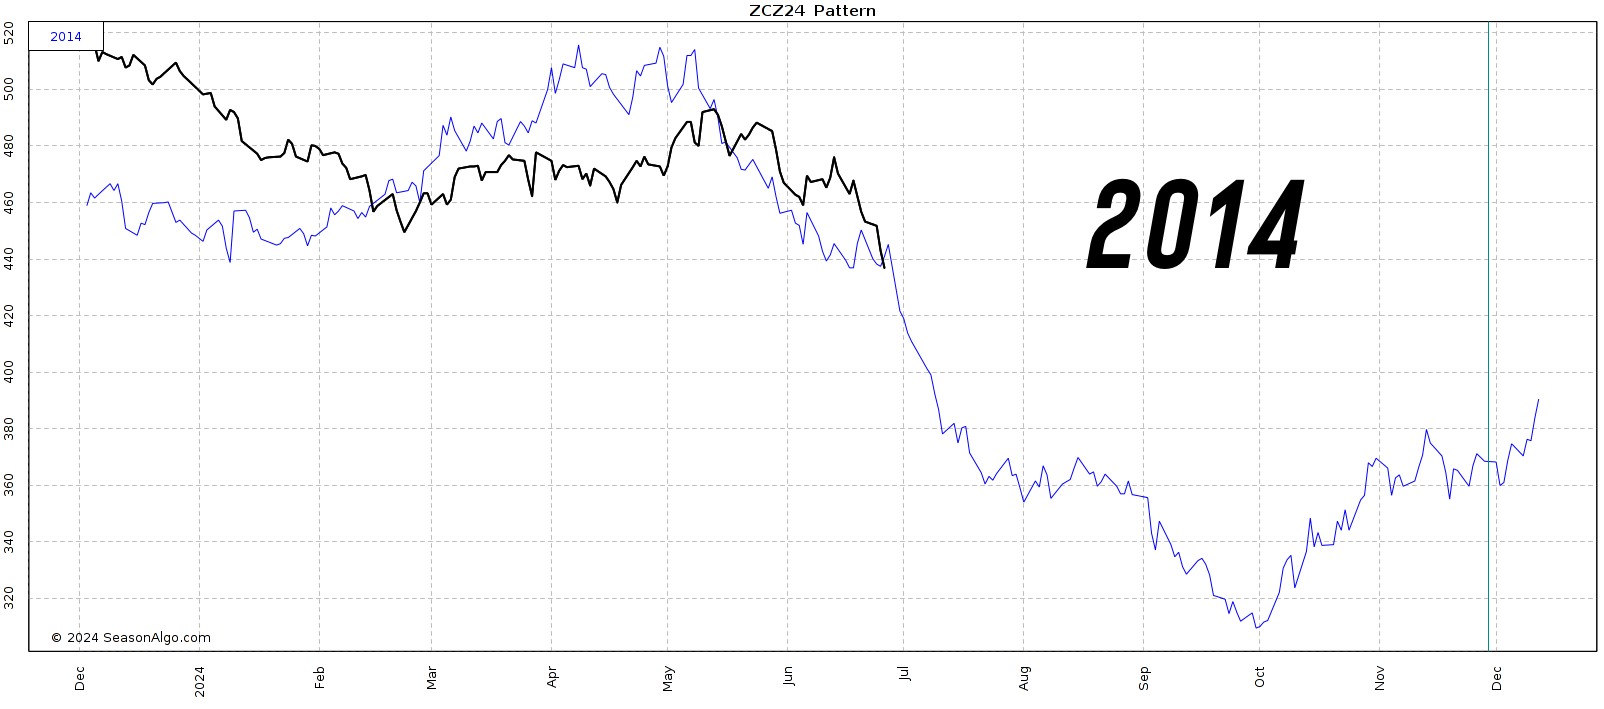
Many people are quick to point out the fact that this year is very similar to 2014 in terms of price pattern thus far.
In 2014, we didn’t get that major summer weather rally scare either. Instead we got about $1.00 rally in March & April and it was about this time where we started falling much lower.
In 2014 on the June stocks report we dropped over -20 cents. We continued lower and by mid-July we were at $3.80 and our harvest low that year was $3.18.
I am not saying 2014 is impossible. However, one could argue the more likely scenario is 2010 or 2020 because………….
The rest of this is subscriber-only. Subscribe to read why this year might be a counter seasonal rally like 2010 or 2020 instead of a downfall like 2014 along with everything else you need to know such as utilizing the inverse in the soybean market.
KEEP READING FOR FREE
Try our daily updates, signals, and 1 on 1 market plans completely free for 30 days. Be prepared for every opportunity.
Want to Talk?
Our phones are open 24/7 for you guys if you ever need anything or want to discuss your operation.
Hedge Account
Interested in a hedge account? Use the link below to set up an account or shoot Jeremey a call at (605)295-3100 or Wade at (605)870-0091
Check Out Past Updates
6/25/24
POSSIBLE RISKS & OUTCOMES THIS USDA REPORT COULD HAVE
6/24/24
VERY STRONG PRICE ACTION: RAINS & USDA KEY
6/21/24
DON’T PUKE SELL. ARE YOU COMFORTABLE RIDING THIS STORM?
6/20/24
RAIN OR NO RAIN FOR EAST CORN BELT?
6/18/24
WEATHER MARKET ENTERING FULL SWING
6/17/24
SELL OFF CONTINUES DESPITE FRIENDLY FORECASTS
6/15/24
EXACT GRAIN MARKETING SITUATION BREAKDOWNS & WHAT YOU SHOULD BE DOING
6/12/24
USDA SNOOZE: WHAT’S NEXT?
6/11/24
USDA TOMORROW
6/10/24
IS USDA OVERSTATING CROP CONDITIONS? DOES IT MATTER?
6/7/24
WEATHER & USDA NEXT WEEK
6/6/24
ARE GRAIN SPREADS TELLING US SOMETHING?
6/5/24
GRAINS NEARING BOTTOM? 7 DAYS OF RED
Read More
6/4/24
HIGH CORN RATINGS, SCORCHING SUMMER, & RUSSIA CONCERNS
Read More
6/3/24
5TH DAY OF THE SELL OFF. ARE YOU COMFORTABLE?
5/31/24
4 STRAIGHT DAYS OF LOSSES IN GRAINS
5/30/24
I DON’T THINK SEASONAL RALLY IS OVER. WHAT IS THE PLAN IF I’M WRONG?
5/29/24
PLANTING DELAY STORY VANISHES. BUT IS REAL STORY OVER?
5/28/24
GETTING COMFORTABLE WITH GRAIN MARKET VOLATILITY
5/24/24
WET SPRINGS DON’T CREATE RECORD YIELDS, DO THEY?
5/23/24
MANAGE RISK DESPITE STUPID PRICE POTENTIAL IN GRAINS
5/22/24
BEANS NEAR NEW HIGHS. WHAT TO DO WITH WHEAT?
5/21/24
BIG MONEY KEEPS DRIVING WHEAT HIGHER
Read More
5/20/24
ALGOS & BIG MONEY CONTINUE TO MOVE GRAIN PRICES
5/17/24
WEATHER MARKET VOLATILITY CONTINUES TO HEAT UP
5/16/24
SITUATIONAL GRAIN MARKETING
5/15/24
HEDGING VS GUESSING
5/14/24
CORRECTIONS ARE HEALTHY
5/13/24
FUNDS DON’T WANT TO BE SHORT GRAINS
5/10/24
PRICE ACTION TELLS DIFFERENT STORY FROM USDA REPORT
Read More
5/9/24
MARKET PRICING IN NEGATIVE REPORT. WHAT TO EXPECT FROM USDA
5/8/24
USDA IN 2 DAYS
5/7/24
WHO SHOULD WAIT FOR TRIGGERS NOT TARGETS
Read More
5/6/24
GRAINS HIGHEST IN 4 MONTHS
Read More
5/3/24
SEASONAL RALLY JUST BEGINNING OR BULL TRAP?
5/2/24
ARE THE TIDES STARTING TO TURN?
5/1/24

