
FIRST NOTICE DAY PRESSURE & CROP TOUR RECAP

Overview
New lows in both corn & wheat, as both post contract lows. With Sep wheat breaking below $5.00 while soybeans bounce +20 cents off their early lows, closing up +8 after being down -13 cents.
The market does not care about the crop tour. If they did, corn would’ve traded higher and beans would’ve traded lower but the exact opposite happened. As the crop tour was somewhat friendly for corn with a 181 bpa yield & very bearish for soybeans as the tour sees a near 55 bpa yield for beans.
Why were corn & wheat lower?
First notice day.
As we have a lot of supply that needs to be sold. As farmers have to decide to price or roll their basis contracts. You see first notice day pressure the markets nearly everytime in a carry market. First notice day selling makes it very hard for those markets to rally.
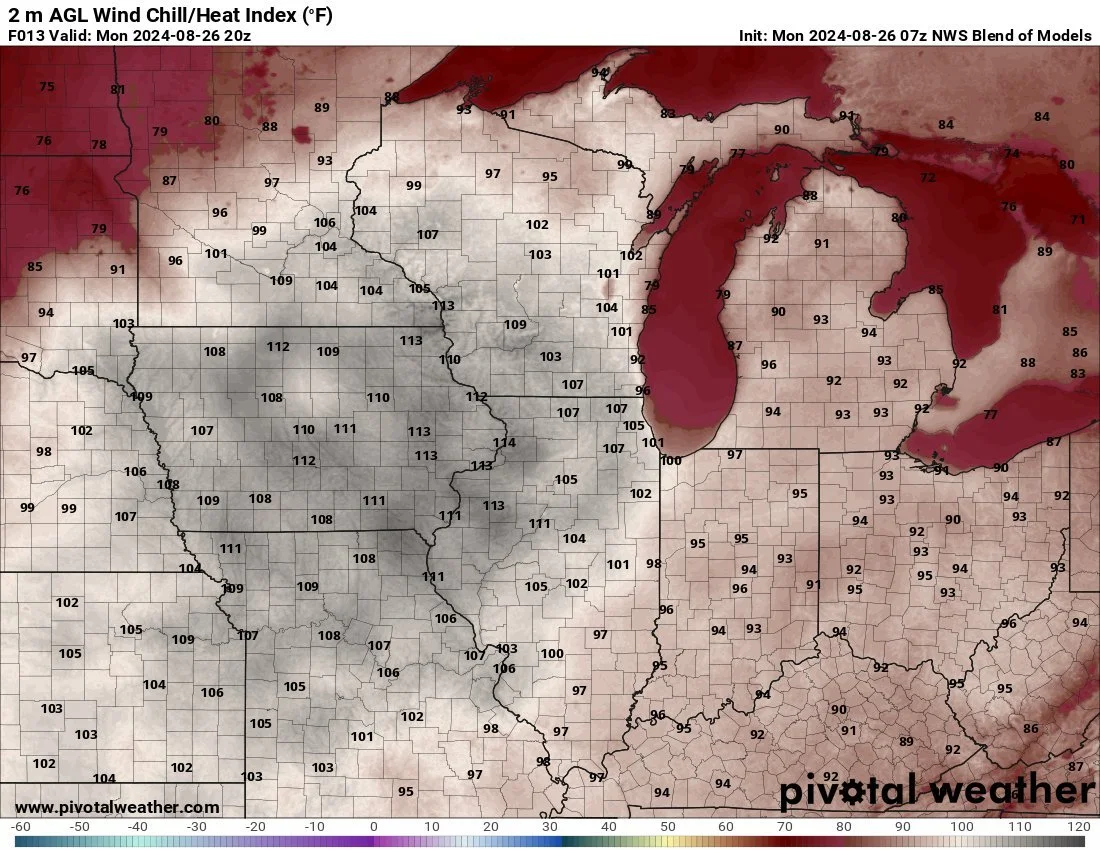
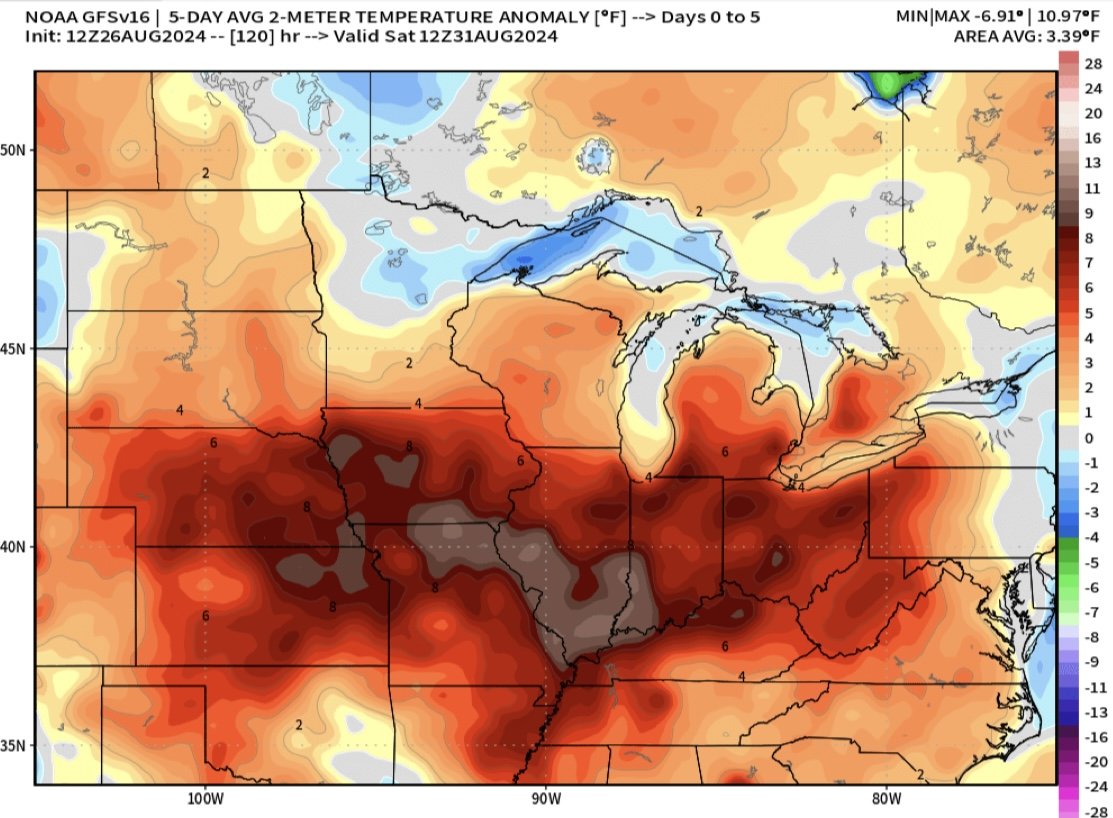
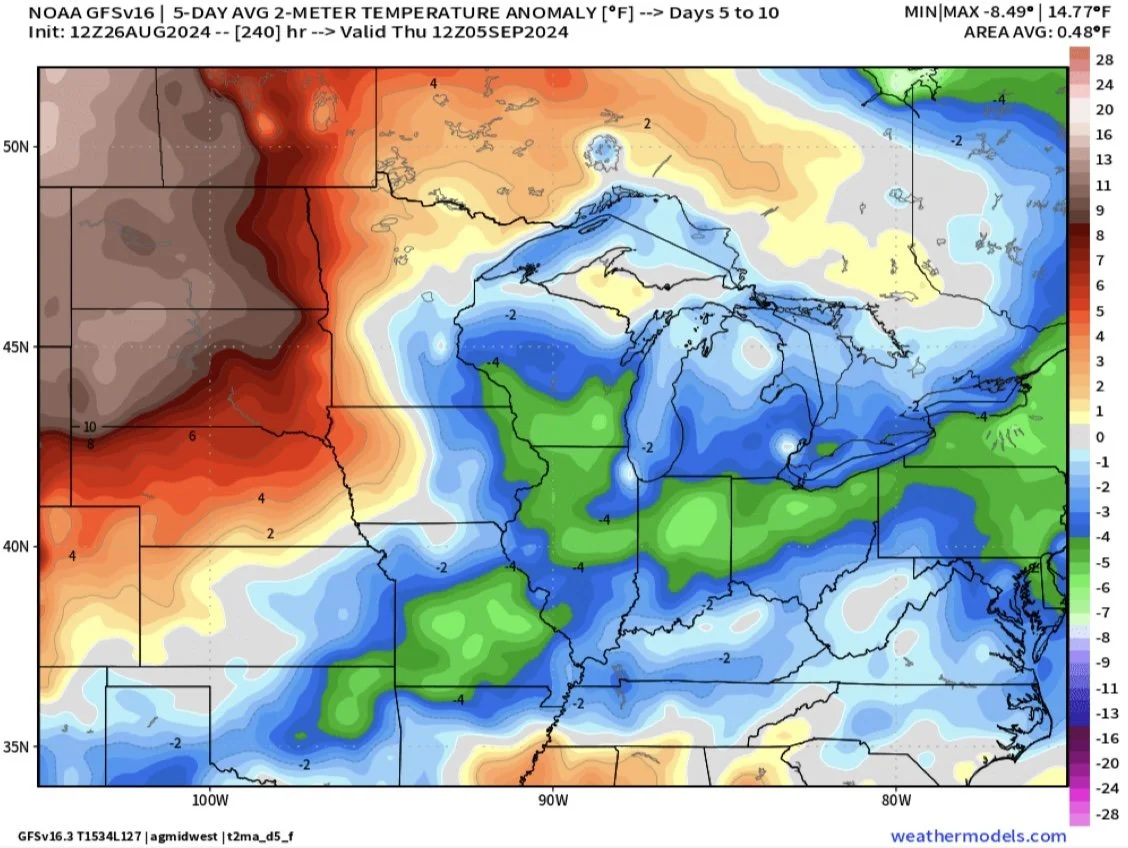
Soybeans saw some support from the weather, as it looks to be brutally hot for a few days this week across the corn belt and will continue until this weekend. Might take a little off the top of the crop but it looks to cool down this weekend.
With the late season weather, StoneX lowered their corn yield by -1.5 bpa to 183.1 bpa but only dropped their bean number by -0.2 to 53.8 bpa.
Quote from an Illinois Farmer:
"This will be the worst finish for crops since 2012. I haven’t seen corn turn this early since that year. It will ding kernel size & prevent really high TW. Pod count is higher on beans but bean size will be very small. Still 178 on corn but beans maybe 51-52."
Todays Heat Index
Temp Days 1-5
Days 6-10
Crop Tour Recap
Pro Farmer National Yield:
Corn: 181.1
Beans: 54.9
Current USDA Yield:
Corn: 183.1
Beans: 53.2
The tours' national yield estimates are not just some math equation where they use the numbers from their state by state tours. They use a bunch of different factors such as maturity, acre changes, areas they didn’t tour, and take into account their historical difference vs the USDA.
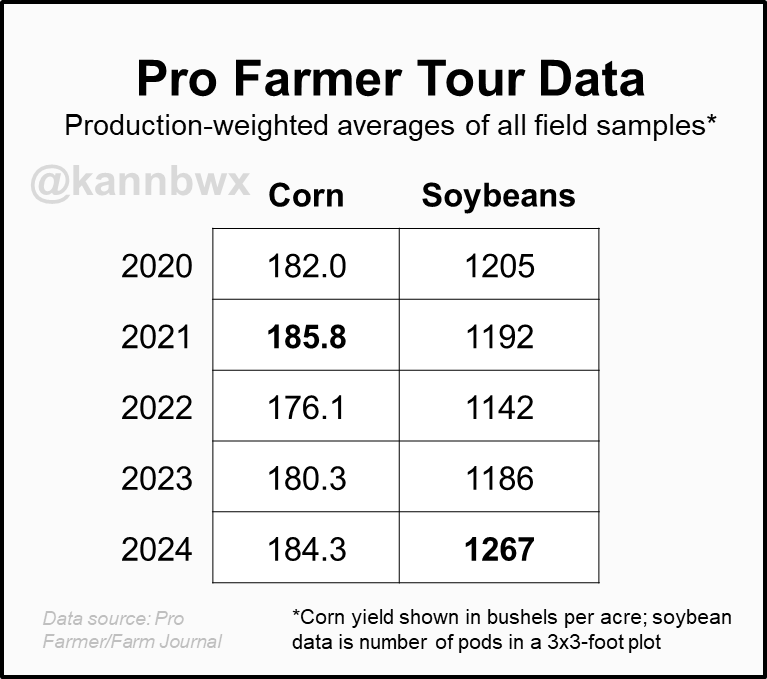
For the actual weighted average of their findings they had 184.3 fro corn. Which is bigger than the actual estimate they came up with. For example last year their weighted average from the findings were 180.3 while their actual estimate was 172.
So they see corn slightly smaller than USDA, while they see this bean crop being a monster one.
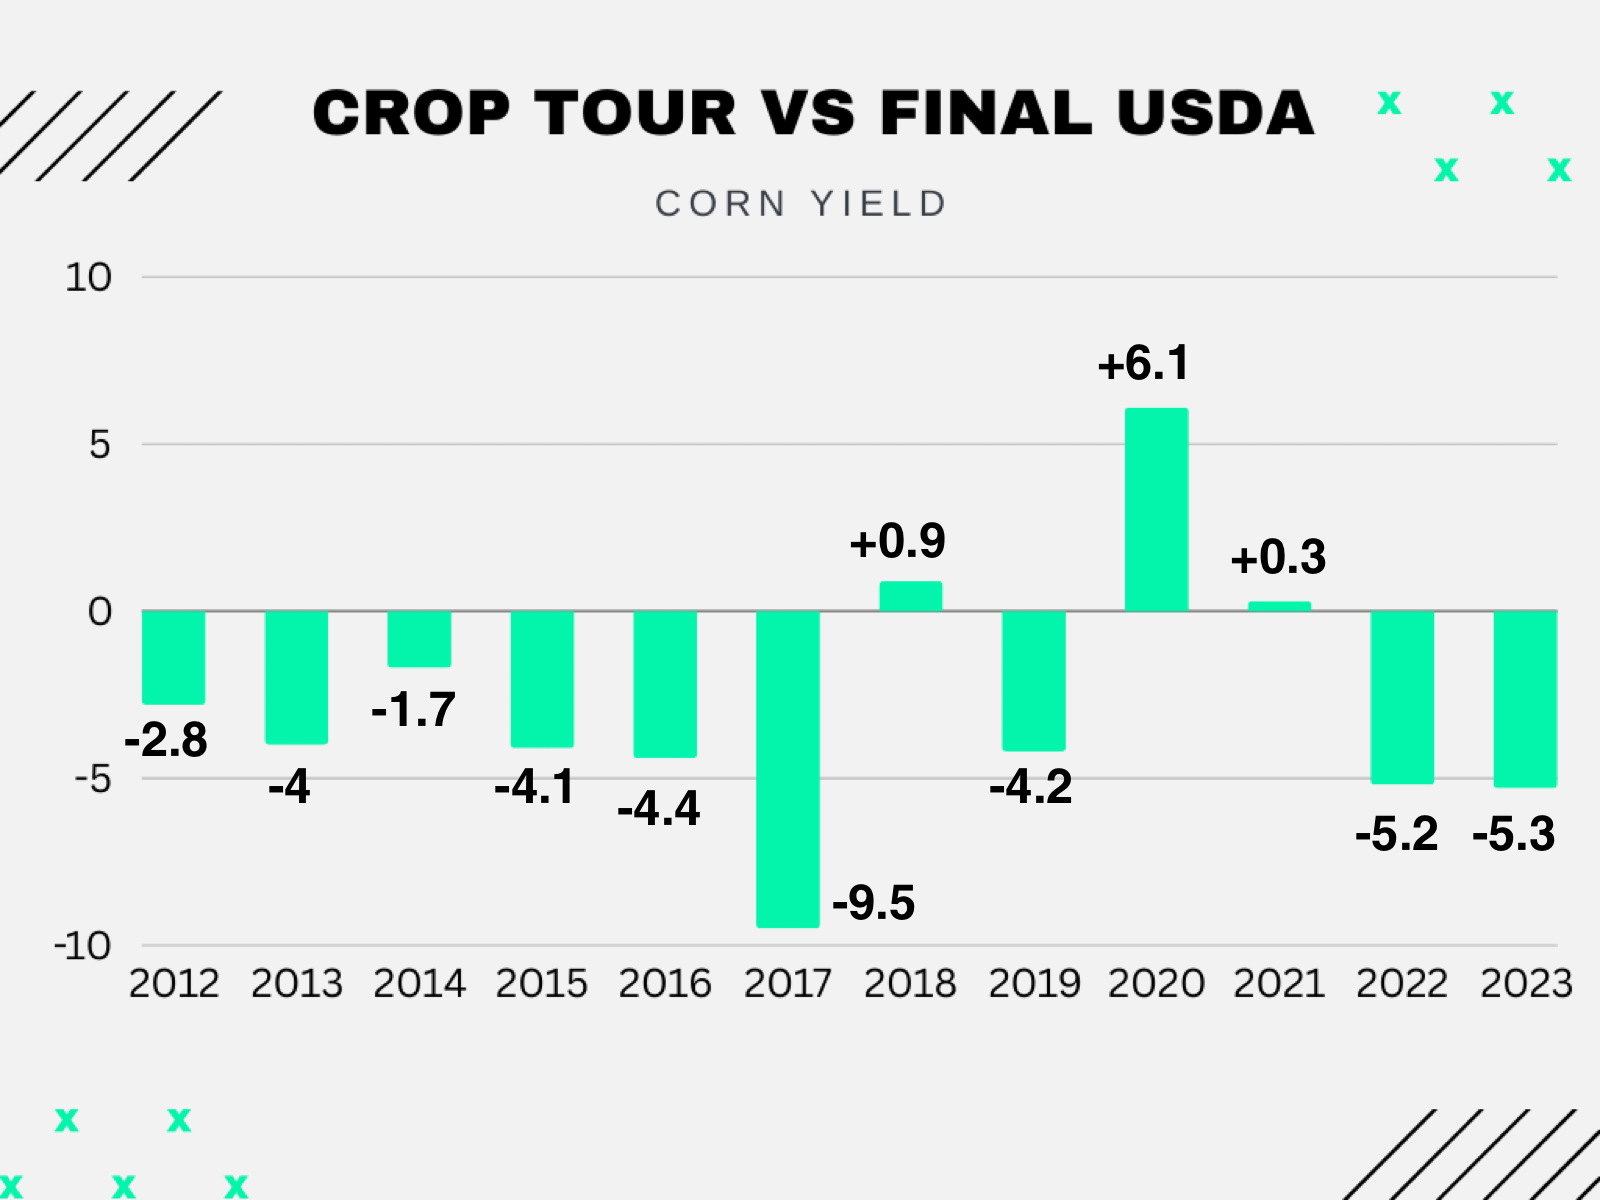
However, let's take a look at the year over year change comparisons rather than the actual yield numbers. The crop tour vs the USDA are always off by a lot. So it makes more sense to gauge just how big or small each of them see the crops growing from last year.
First for corn:
Iowa
USDA: 209 vs 201 (+4%)
Crop Tour: 192.8 vs 182.8 (+5.5%)
Minnesota
USDA: 185 vs 185 (+/-0%)
Crop Tour: 164.9 vs 181.3 (-9%)
Illinois
USDA: 225 vs 206 (+9.2%)
Crop Tour: 204.1 vs 193.7 (+5.4%)
Indiana
USDA: 207 vs 203 (+2%)
Crop Tour: 187.5 vs 180.9 (+3.65%)
Nebraska
USDA: 194 vs 182 (+6.6%)
Crop Tour: 173.25 vs 167.2 (+3.6%)
Ohio
USDA: 188 vs 198 (-5%)
Crop Tour: 183.29 vs 183.94 (-0.35%)
South Dakota
USDA: 162 vs 152 (+6.6%)
Crop Tour: 156.5 vs 157.4 (-0.55%)
National
USDA: 183 vs 177 (+3.4%)
7 State Crop Tour Weighted Avg: 184.3 vs 180.3 (2.17%)
Pro Farmer Guess: 181.1 vs 172 (+4.9%)
So from their findings the only states they see making a bigger jump from last year compared to the USDA are: Iowa, Indiana, & Ohio.
While they see Minnesota, Illinois, Nebraska, & South Dakota all not getting as big year over year compared to the USDA.
Their weighted average sees a smaller increase compared to the USDA, but their actual estimate they came up with is a bigger increase than the USDA had.
Interestingly though, the crop tour usually underestimates this crop on their yield estimate which was 181 this year.
Here are the bean comparisons.
I used USDA yield change while using the crop tour pod count change as the tour uses pod count not yield.
Iowa
USDA: 61 vs 58 (4.9%)
Crop Tour: 1,312 vs 1,190 (+9.3%)
Minnesota
USDA: 49 vs 48 (+2%)
Crop Tour: 1,037 vs 985 (+5%)
Illinois
USDA: 66 vs 63 (+4.5%)
Crop Tour: 1,419 vs 1,271 (+10.4%)
Indiana
USDA:62 vs 61 (+1.6%)
Crop Tour: 1,409 vs 1,310 (+7.6%)
Nebraska
USDA: 59 vs 51.5 (+12.7%)
Crop Tour: 1,172 vs 1,160 (+1%)
Ohio
USDA: 59 vs 58 (+1.7%)
Crop Tour: 1,230 vs 1,253 (+1.87%)
South Dakota
USDA: 47 vs 44 (+6%)
Crop Tour: 1,026 vs 1,013 (+1.3%)
National
USDA: 52.5 vs 50.6 (+3.6%)
7 State Crop Tour Pod Count Weighted Avg: 1,267 vs 1,186 (+6.4%)
So the crop tours sees nearly every state getting bigger year over year compared to the USDA. The only ones they see not getting quite as big comparatively are South Dakota and Nebraska. So overall the tour is expecting quiet a bit bigger bean crop.
Today's Main Takeaways
Corn
New lows in corn today.
After market close, crop conditions dropped -2% to 65% G/E which is friendly, the trade was expecting just -1% decrease.
Let's take a look at the potential balance sheet situation.
For these estimates demand will remain unchanged.
Currently USDA has a 181 yield, +6 bpa over last years record 177.
We are going to have an amazing crop. No doubt. I would be shocked if we don’t have a record.
But the interesting question is: What if we have a record yield but not by this massive amount? What if yield is closer to 180 rather than 183?
With the current demand estimates, a 180 yield would give us a sub 2 billion bushel carryout. A -10% drop from today.


This is not a "bull market" number, but keep in mind………………
The rest of this is subscriber only.. Subscribe to keep reading.
Along with our daily updates, you will get 1 on 1 completely tailored market plans where we walk you through every step of your marketing.
IN TODAYS FULL UPDATE
Balance sheet break downs
Seasonal bottoms?
Short term risk
What to do with old crop
Demand & SA
When will wheat start to move higher?
Downside targets & risks
TRY 30 DAYS FREE
A month completely free to our updates, signals & 1 on 1 plans
Want to Talk?
Our phones are open 24/7 for you guys if you ever need anything or want to discuss your operation.
Hedge Account
Interested in a hedge account? Use the link below to set up an account or shoot Jeremey a call at (605)295-3100.
Check Out Past Updates
8/23/24
CROP TOUR SHOWS MASSIVE BEAN YIELD
8/22/24
UGLY DAY FOR WHEAT & BEANS, STILL RISK, CROP TOURS, CAPTURING CARRY
8/21/24
CROP TOUR DAY 3. NOT HUGE MOVEMENT
8/20/24
CROP TOUR SO FAR & COMPARISON TO USDA
8/19/24
CROP TOUR BOUNCE
8/16/24
RISK REMAINS LOWER. MANAGE YOUR RISK
8/15/24
DEMAND, BIG US CROPS & BRAZIL DROUGHT
8/14/24
DEAD CAT BOUNCE
8/13/24
POST USDA SELL OFF
8/12/24
USDA REPORT: BEARISH BEANS. SMALLER CORN CARRYOUT & RECORD YIELDS
8/9/24
USDA REPORT MONDAY
8/7/24
HUGE USDA REPORT MONDAY
8/6/24
WHEAT UNDERVALUED? CORN YIELD? WHAT TO DO WITH GRAIN OFF COMBINE
8/5/24
GRAINS STRONG WHILE WORLD PANICS
8/2/24
GRAINS RALLY, YIELD ESTIMATES, CHINA STARTS TO BUY
8/1/24