USDA ACRES & STOCKS REPORT IN 3 DAYS
Overview
Markets mixed as soybeans rally and take back nearly all of Friday's sell off. Wheat manages to close higher despite closing -12 cents off the early highs. Corn continues to chop around in this tight range, down just a penny and a half today.
Thursday we have the USDA acres and stocks report.
The USDA outlook forum had 91 million for corn, and beans at 87.5 million.
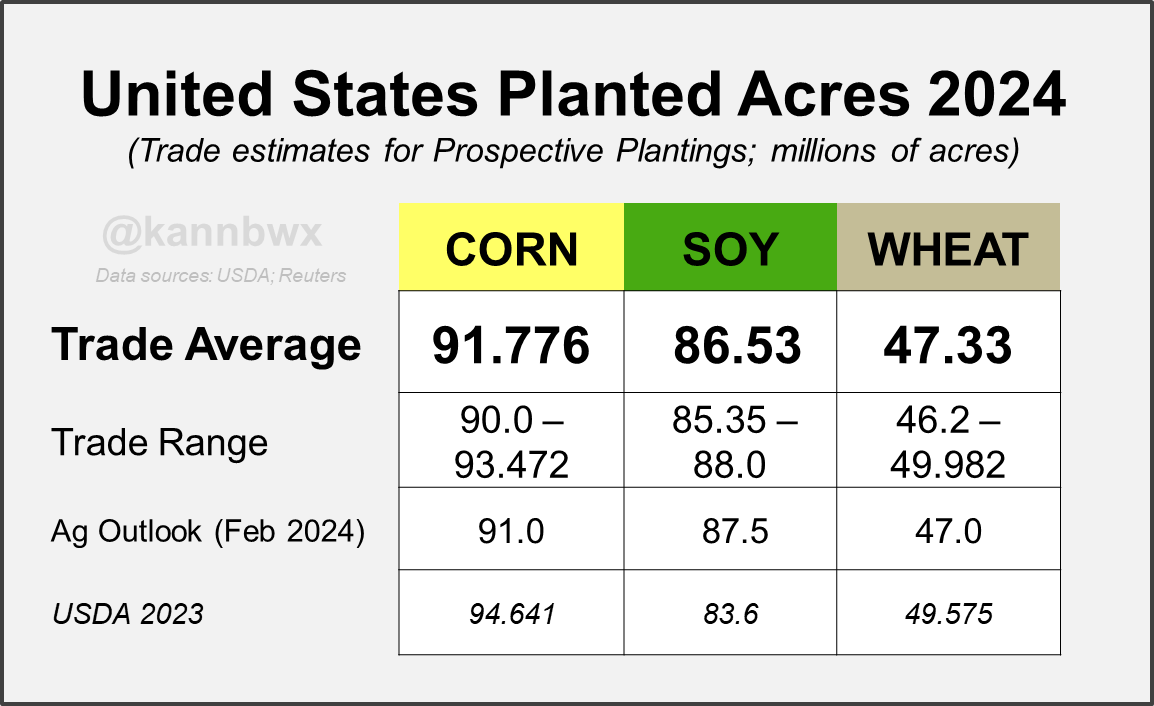
The estimates for the this report have corn coming in at 91.78 million. Which is nearly +1 million higher than the USDA outlook forum but still smaller than last year's 94.64 million.
The estimates for soybeans are 86.53 million, down -1 million from the USDA outlook but nearly +3 million more than last year.
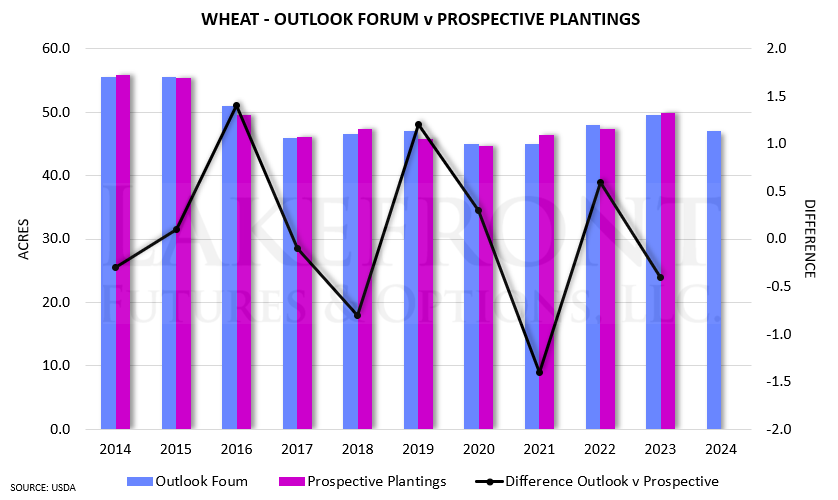
Wheat acre estimates are slightly higher than the USDA outlook, but down over -2 million from last year.
Here are the estimates from Karen Braun:
Here were Pro Farmers farmer survey results:
Corn: 91.75 million, down -2.9 million
Soybeans: 89.75 million, up +3.15 million
Spring wheat: 10.9 million, down -300k
Cotton: 10.5 million, up +270k
There is many who believe that the current cotton acre estimates will be too low, given the recent price action difference in cotton vs other crops such as corn and wheat.
From Wright on the Market:
"Our clients in the south east US are saying that cotton is going to take 10-20% of the corn acres this spring."
Let's take a look at some history for this upcoming report.
Keep in mind, the actual results of this report are impossible to predict.
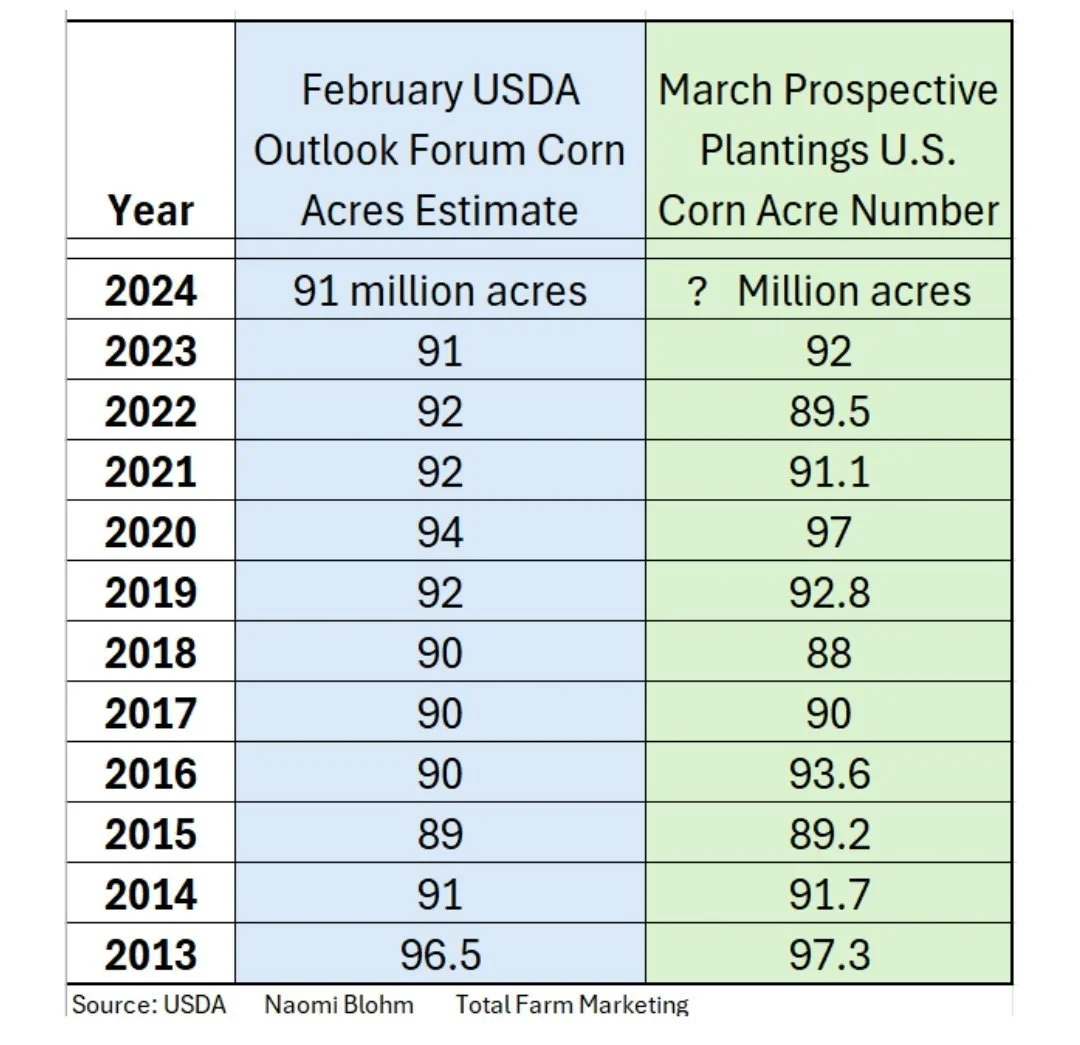
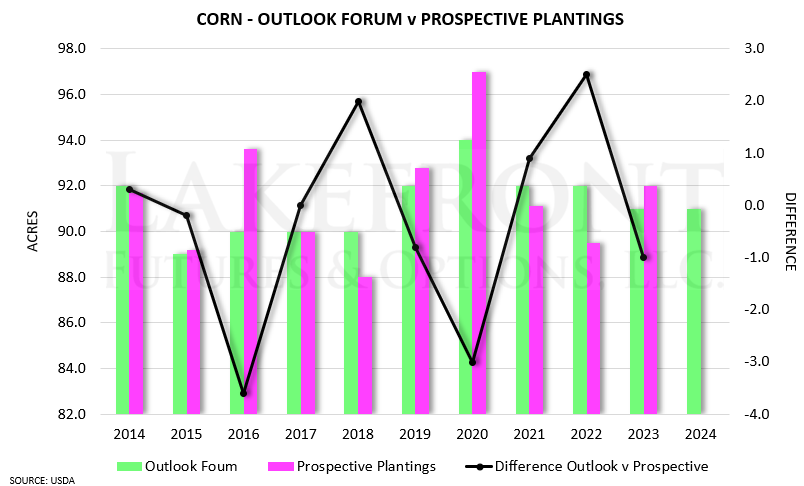
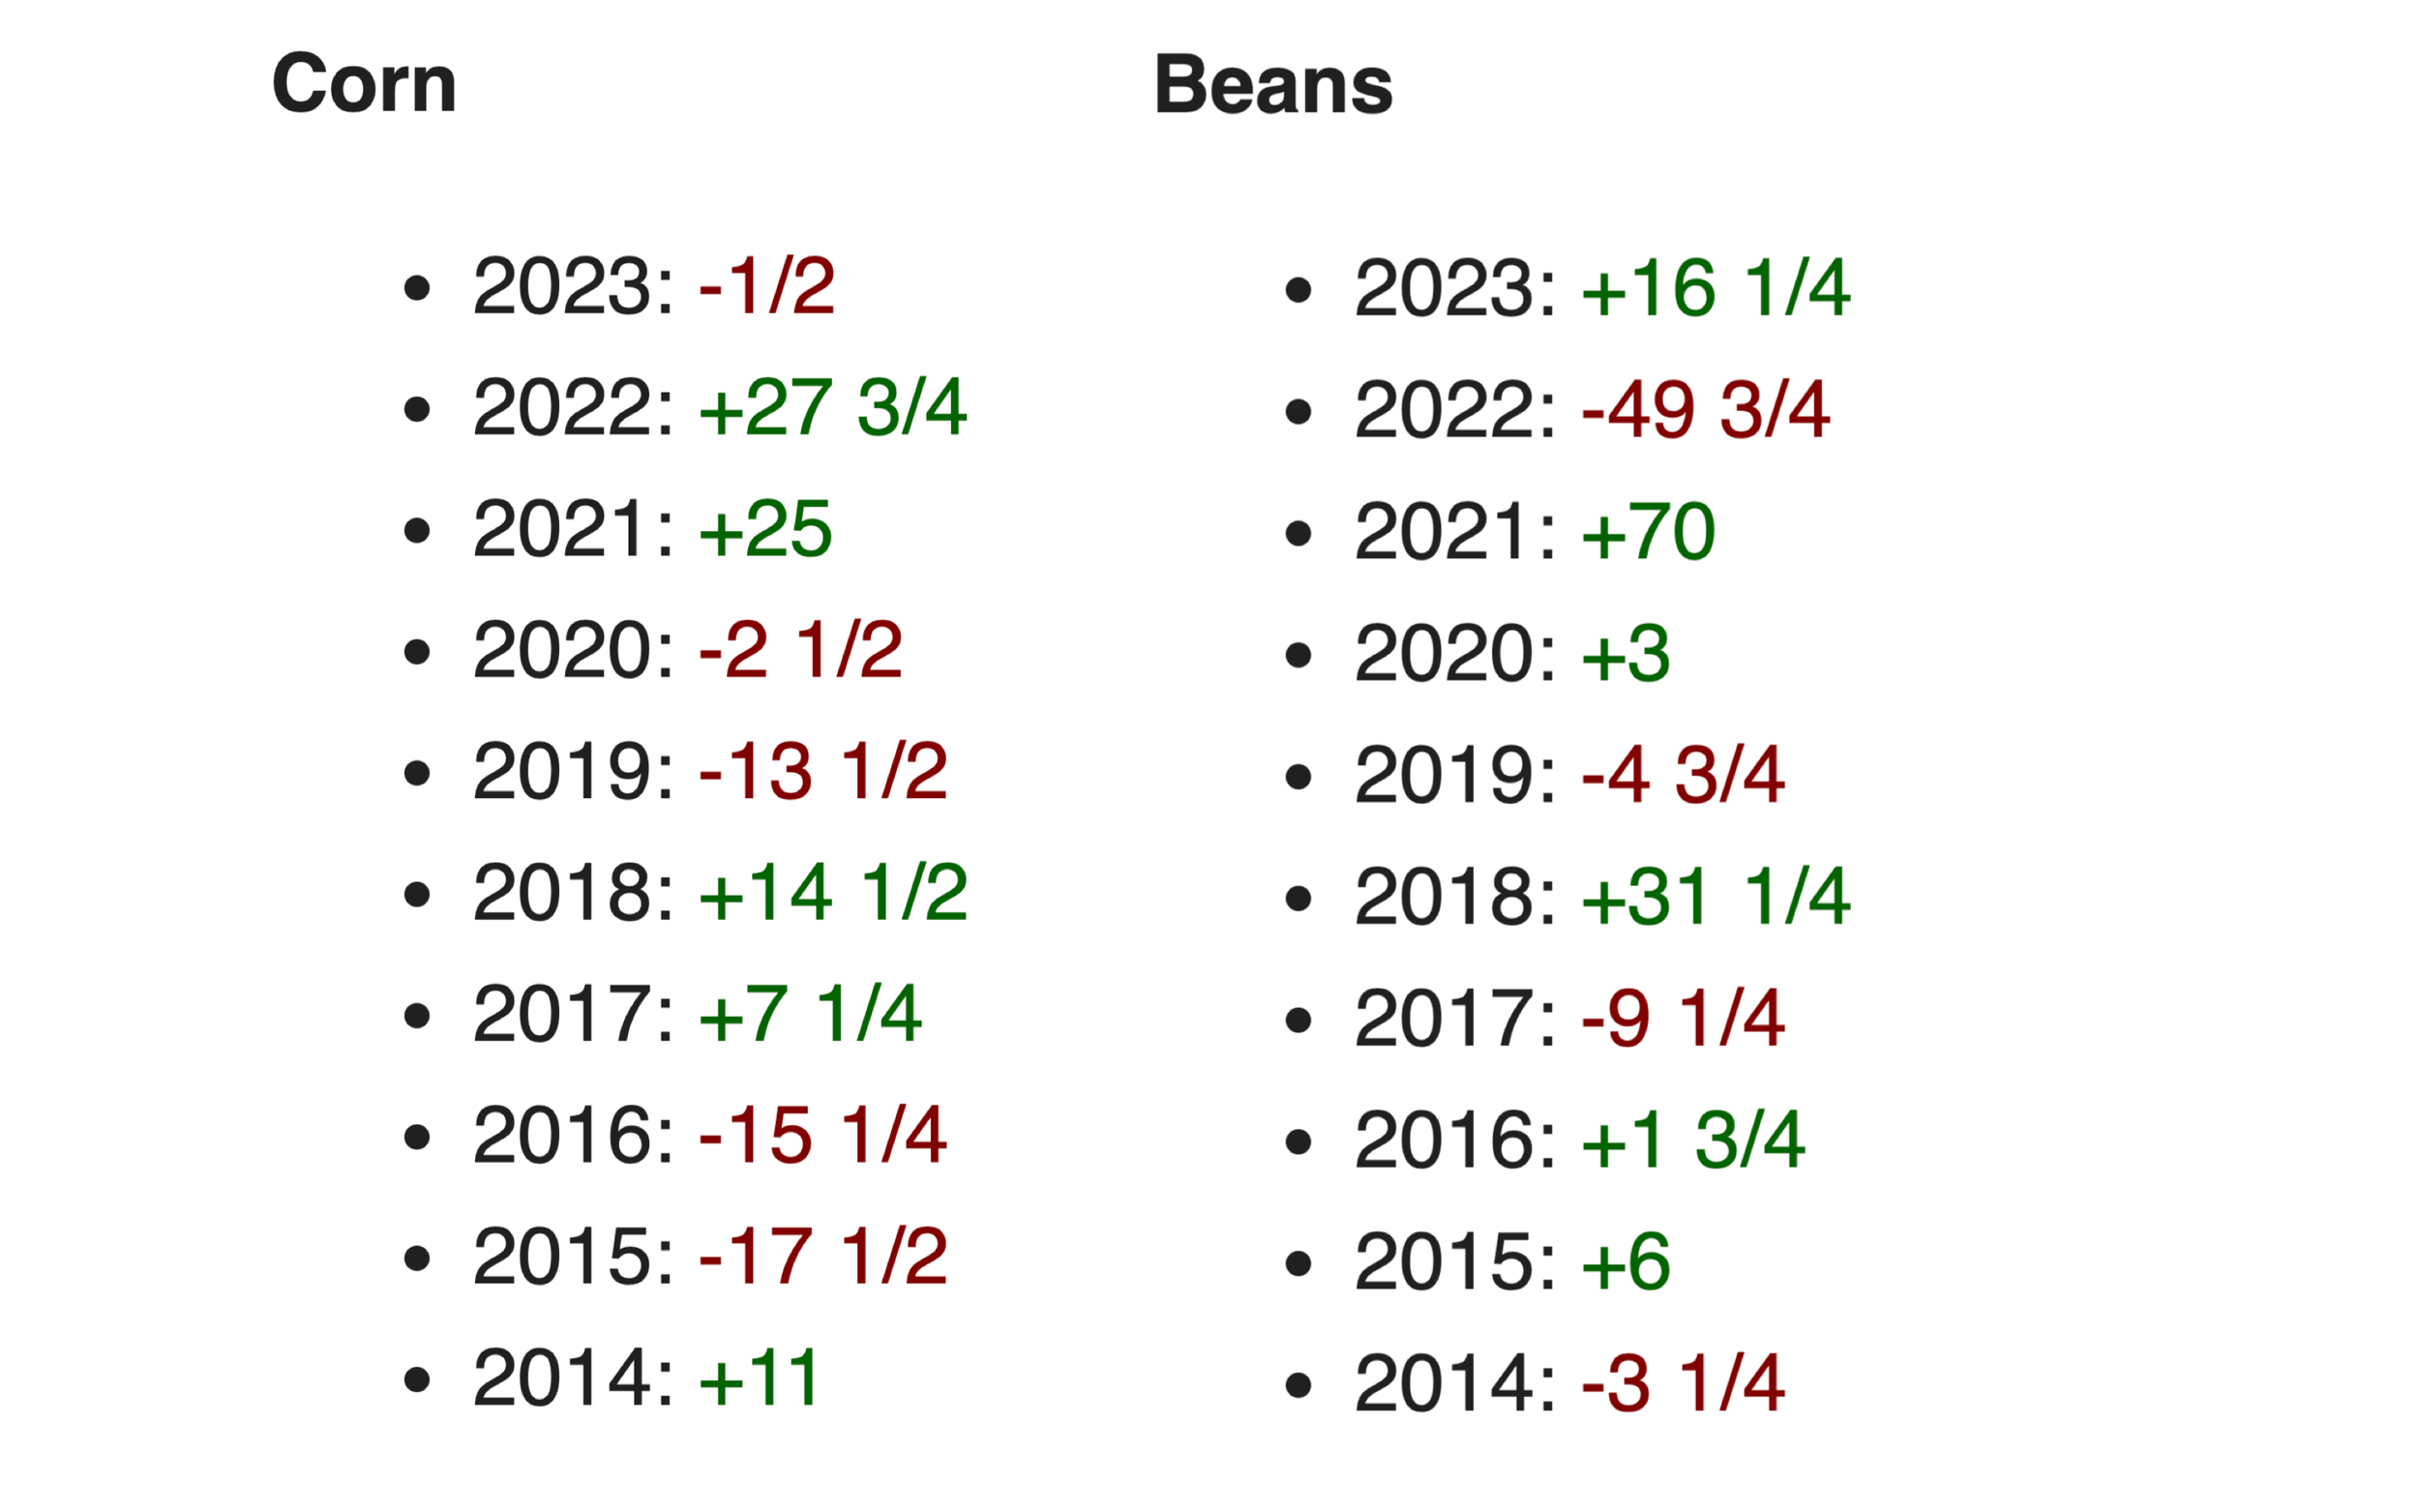
For corn, the prospective plantings acres have came in higher than the USDA outlook forum the past 7 of 11 years.
The prospective plantings have came in lower than the USDA outlook just 3 times. However, 2 of those 3 years have came within the past 3 years alone. In 2022, 2021, and 2018.
Here is a chart from Naomi Blohm of all the numbers.
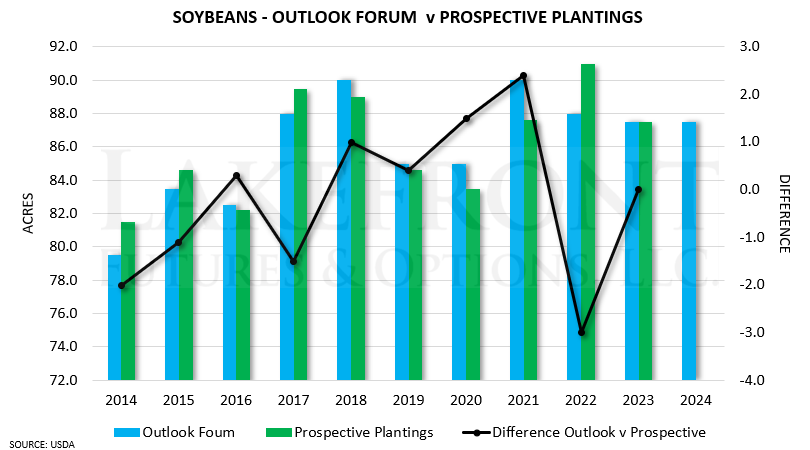
Soybean prospective plantings for this report have came in higher 4 times in the past decade. 2014, 2015, 2017, and 2022.
They have came in lower than the USDA outlook 5 times in the past decade. In 2016, 2018, 2019, 2020, and 2021.
Here is a chart from Darin Fessler of all 3 main grains and how the prospective planting numbers have shaped up compared to the USDA outlook.
From Karen Braun:
"Are US corn acres going to be bearish on Thursday? Not sure, but new-crop CBOT soybeans have been trading around 2.5 times that of corn so far this year, a ratio not recently associated with the shockingly large corn intentions. It's just one factor though, no guarantees."
So essentially she is pointing out that historically when the corn to soybean ratio is high (meaning corn is trading a lot lower than soybeans are in comparison) we tend to not see as bearish of planting intentions.
When the ratio is low (meaning corn is trading higher in comparison to soybeans) we tend to more bearish planting intentions.
The thought process is here is that when corn prices are low, producers often won’t go out of their way to plant extra corn.
Lastly here is the price action from the day of this upcoming report in past years.
As you can see, this report is often times a very big market mover.
Since this report does have the ability to pressure prices heavily, I do like protecting the downside with floors for some of you, especially for those of you who are undersold. There are a few different strategies to use, so please give us a call if you have questions. (605)295-3100.
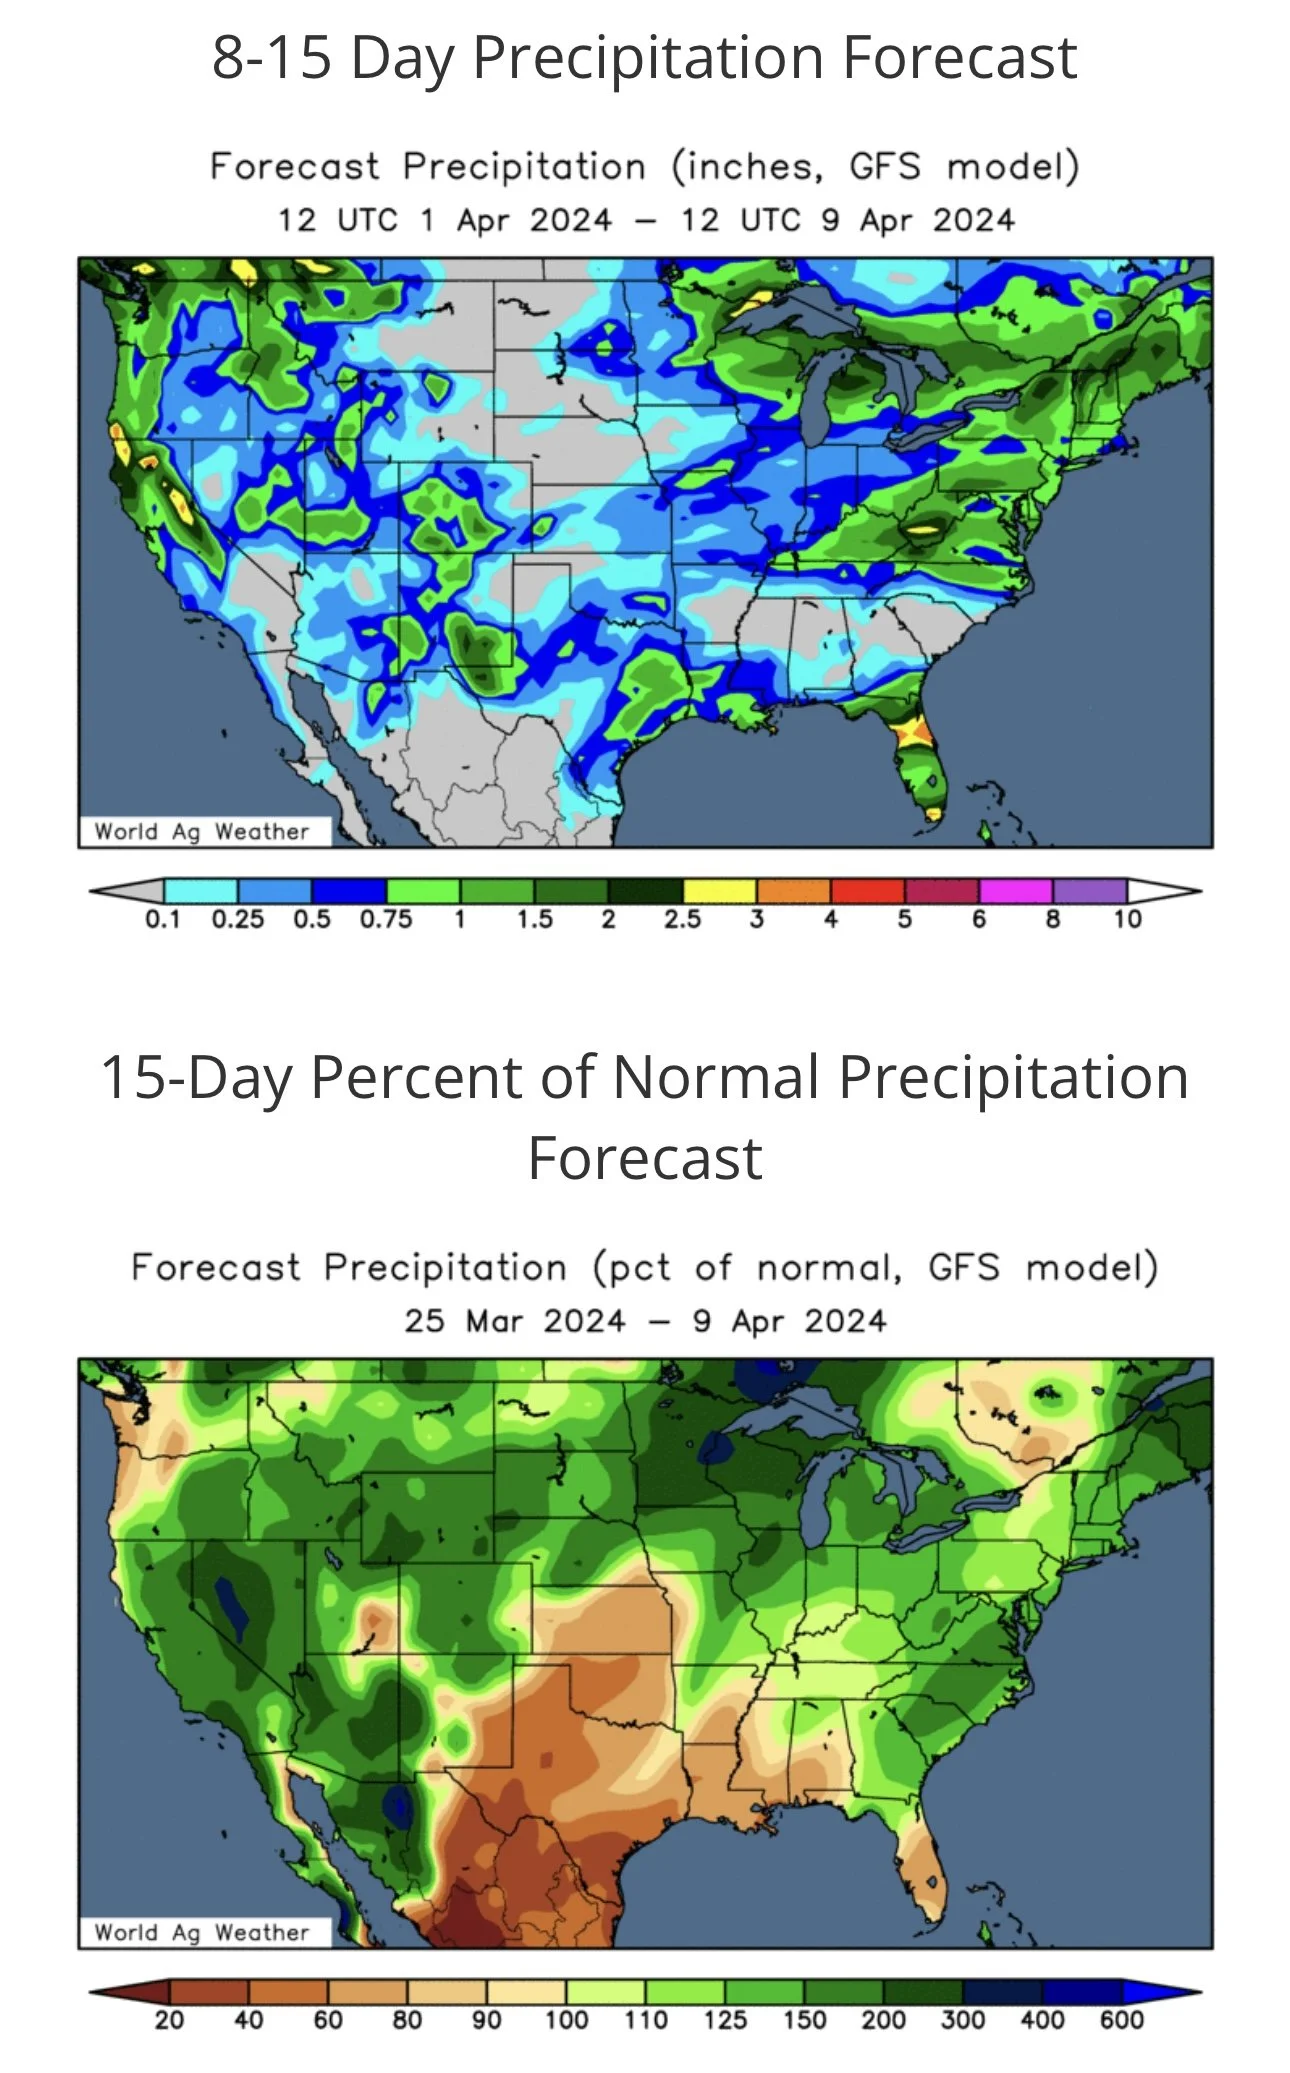
Taking a look at US weather, the upper midwest is getting a bunch of snow and rain.
This is replenishing a good amount of that soil moisture that was missing and will take away a lot of that early planting talk we were seeing.
Delayed planting is not yet a concern.
The seasonal outlook for spring and summer is still far warmer than normal. Dryness could still very well be a concern come summer.
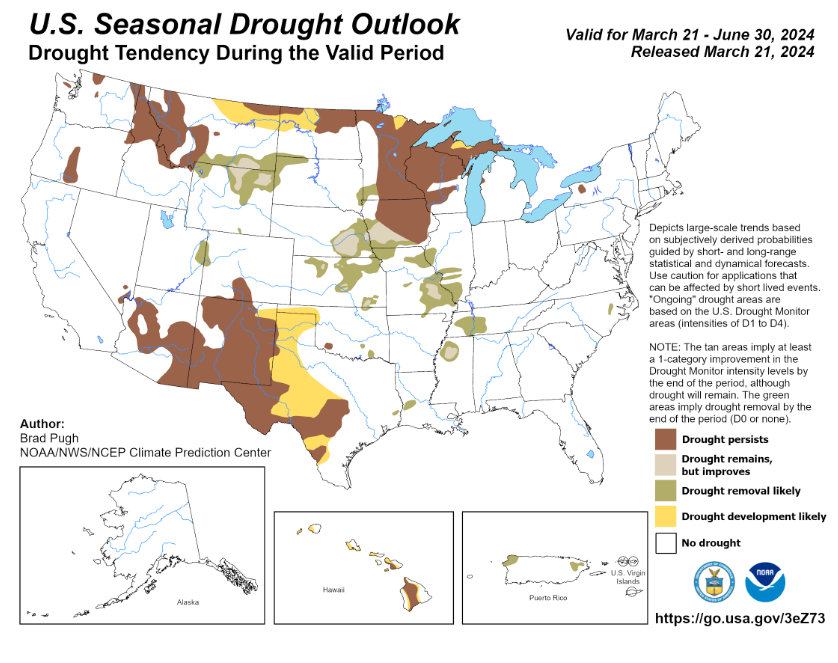
Below is a seasonal drought outlook. It calls for drought to persist across much of Iowa as well as Minnesota and Wisconsin through June.
How much rain does it take to bust a drought?
Below is a drought severity index.
Areas such as Iowa will still need some good rain and snow to make up for the 3 to 6 inch deficit. But this recent snow should help for the time being.
Next we have South America.
Right now their weather is mostly favorable. As they have been receiving rains.
This is beneficial for that second corn crop, but negative for the beans as it only delays the harvest of beans.
However, there is some concerns as these rains they have received were lighter than expected to go along with the fact that the outlook is still hot and dry for April.
From StoneX's Arlan Suderman:
"Brazil corn, 5-day rainfall exceeded 1 inch over 54% of their corn belt, and exceeded 2 inches over 23% of the belt as rains fall short of forecasts. Fear is that they will be insufficient if the pattern shifts drier again for April, which many anticipate.”
Today's Main Takeaways
Corn
Corn was slightly lower as we continue to chop around this 15 cent range.
Although Brazil is receiving rains, many still believe this second corn crop is going to be as much as 20% smaller than it was last year.
Last year the crop was 137 MMT. A 20% cut would bring the crop to 109.6 MMT.
Which is close to the CONAB's estimate of 113.7 while the USDA is at 124. That difference between the CONAB and the USDA is still the widest difference between their estimates of all time.
You have to ask yourself, why would CONAB make such a sizable downgrade to this second corn crop BEFORE it even got planted..?
One answer would be less corn acres, as corn acres are being switched.
If China starts to get nervous about the size of this crop, they will likely start coming to buy corn from the US.
However, do NOT expect the USDA to take their Brazil corn estimate much lower until the May 10th USDA report.
As for this upcoming report, it does tend to be negative. So keep that in mind.
This report is IMPOSSIBLE to predict. It is based off a bunch of surveys.
Because it has the possibility to be negative, I like protecting the downside especially if you are undersold or have unprotected bushels.
I went over these options last week, but you could consider a new crop put that expires the day of the report, or give yourself more time with a new crop put that expires in a little over a month. No matter what you do, do NOT overspend on protection at these lower levels.
Not everyone should be getting puts. Some of you shouldn’t be doing anything. But for some of you it might make sense. Give us a call if you have questions or want to discuss what the best plan of attack would be for you. (605)295-3100.
Historically, prices do not have any reason to rally right now at this time.
Looking towards spring and summer, I see more upside. The path higher is not going to be a straight line, but we want to be making sales when we aren't sure what we are going to raise.
Taking a look at the chart, a close above $4.45 should bring more upside.
Support remains right around $4.30, which bulls need to hold to keep the rally alive.
Corn May-24
Soybeans
Soybeans lead the way today, taking all but 1 penny of Friday's sell off back. Back above $12.00 once again.
This week is all about the upcoming USDA acres and stocks report.
There is some talk that one surprise we could see is lower soybean stocks.
In February the USDA started bean yield at 52. The USDA is actually surprisingly too low on the yield usually. They have been too low the past 7 of 10 years.
Below is a chart that shows how our carryout could be effected vs how many acres we plant and if yield comes in around 50 to 51.
If we plant less than 87.5 million acres, things could get very tight very fast.
The current US carryout is 315 million.
As for this report, just like corn I am being aware it has the possibility to be a very negative report.
So for some of you, you may want to consider puts going into the report if you are nervous. Give us a call if you want to discuss puts, marketing, or anything else (605295-3100. When we get puts at these levels, we are hoping they go to zero and that futures rise so we can make better sales. But if prices drop, having these puts will add to your bottom line and make you more comfortable.
Looking at one other bullish factor we have is the crush numbers for beans. Now the market already knows this, but we have set record after record each month. There is a solid chance that the USDA is at least 50 million bushels light on their export demand numbers. This would take the 2023/24 carryout stocks from 315 to 265 million.
Bottom line, I think there are plenty of factors that could justify soybeans trading anywhere from $13 to $14 this year.
$14 might seem like a stretch, but remember last summer we went from $11.30 to +$14 very fast. When everyone was saying it wouldn’t happen, we did. The path way for that to happen this year again is there.
I do not love making sales here. Undersold? There is nothing wrong with rewarding a near $1 rally. But personally we want to be making sales in soybeans closer to summer and when we seasonally make our highs.
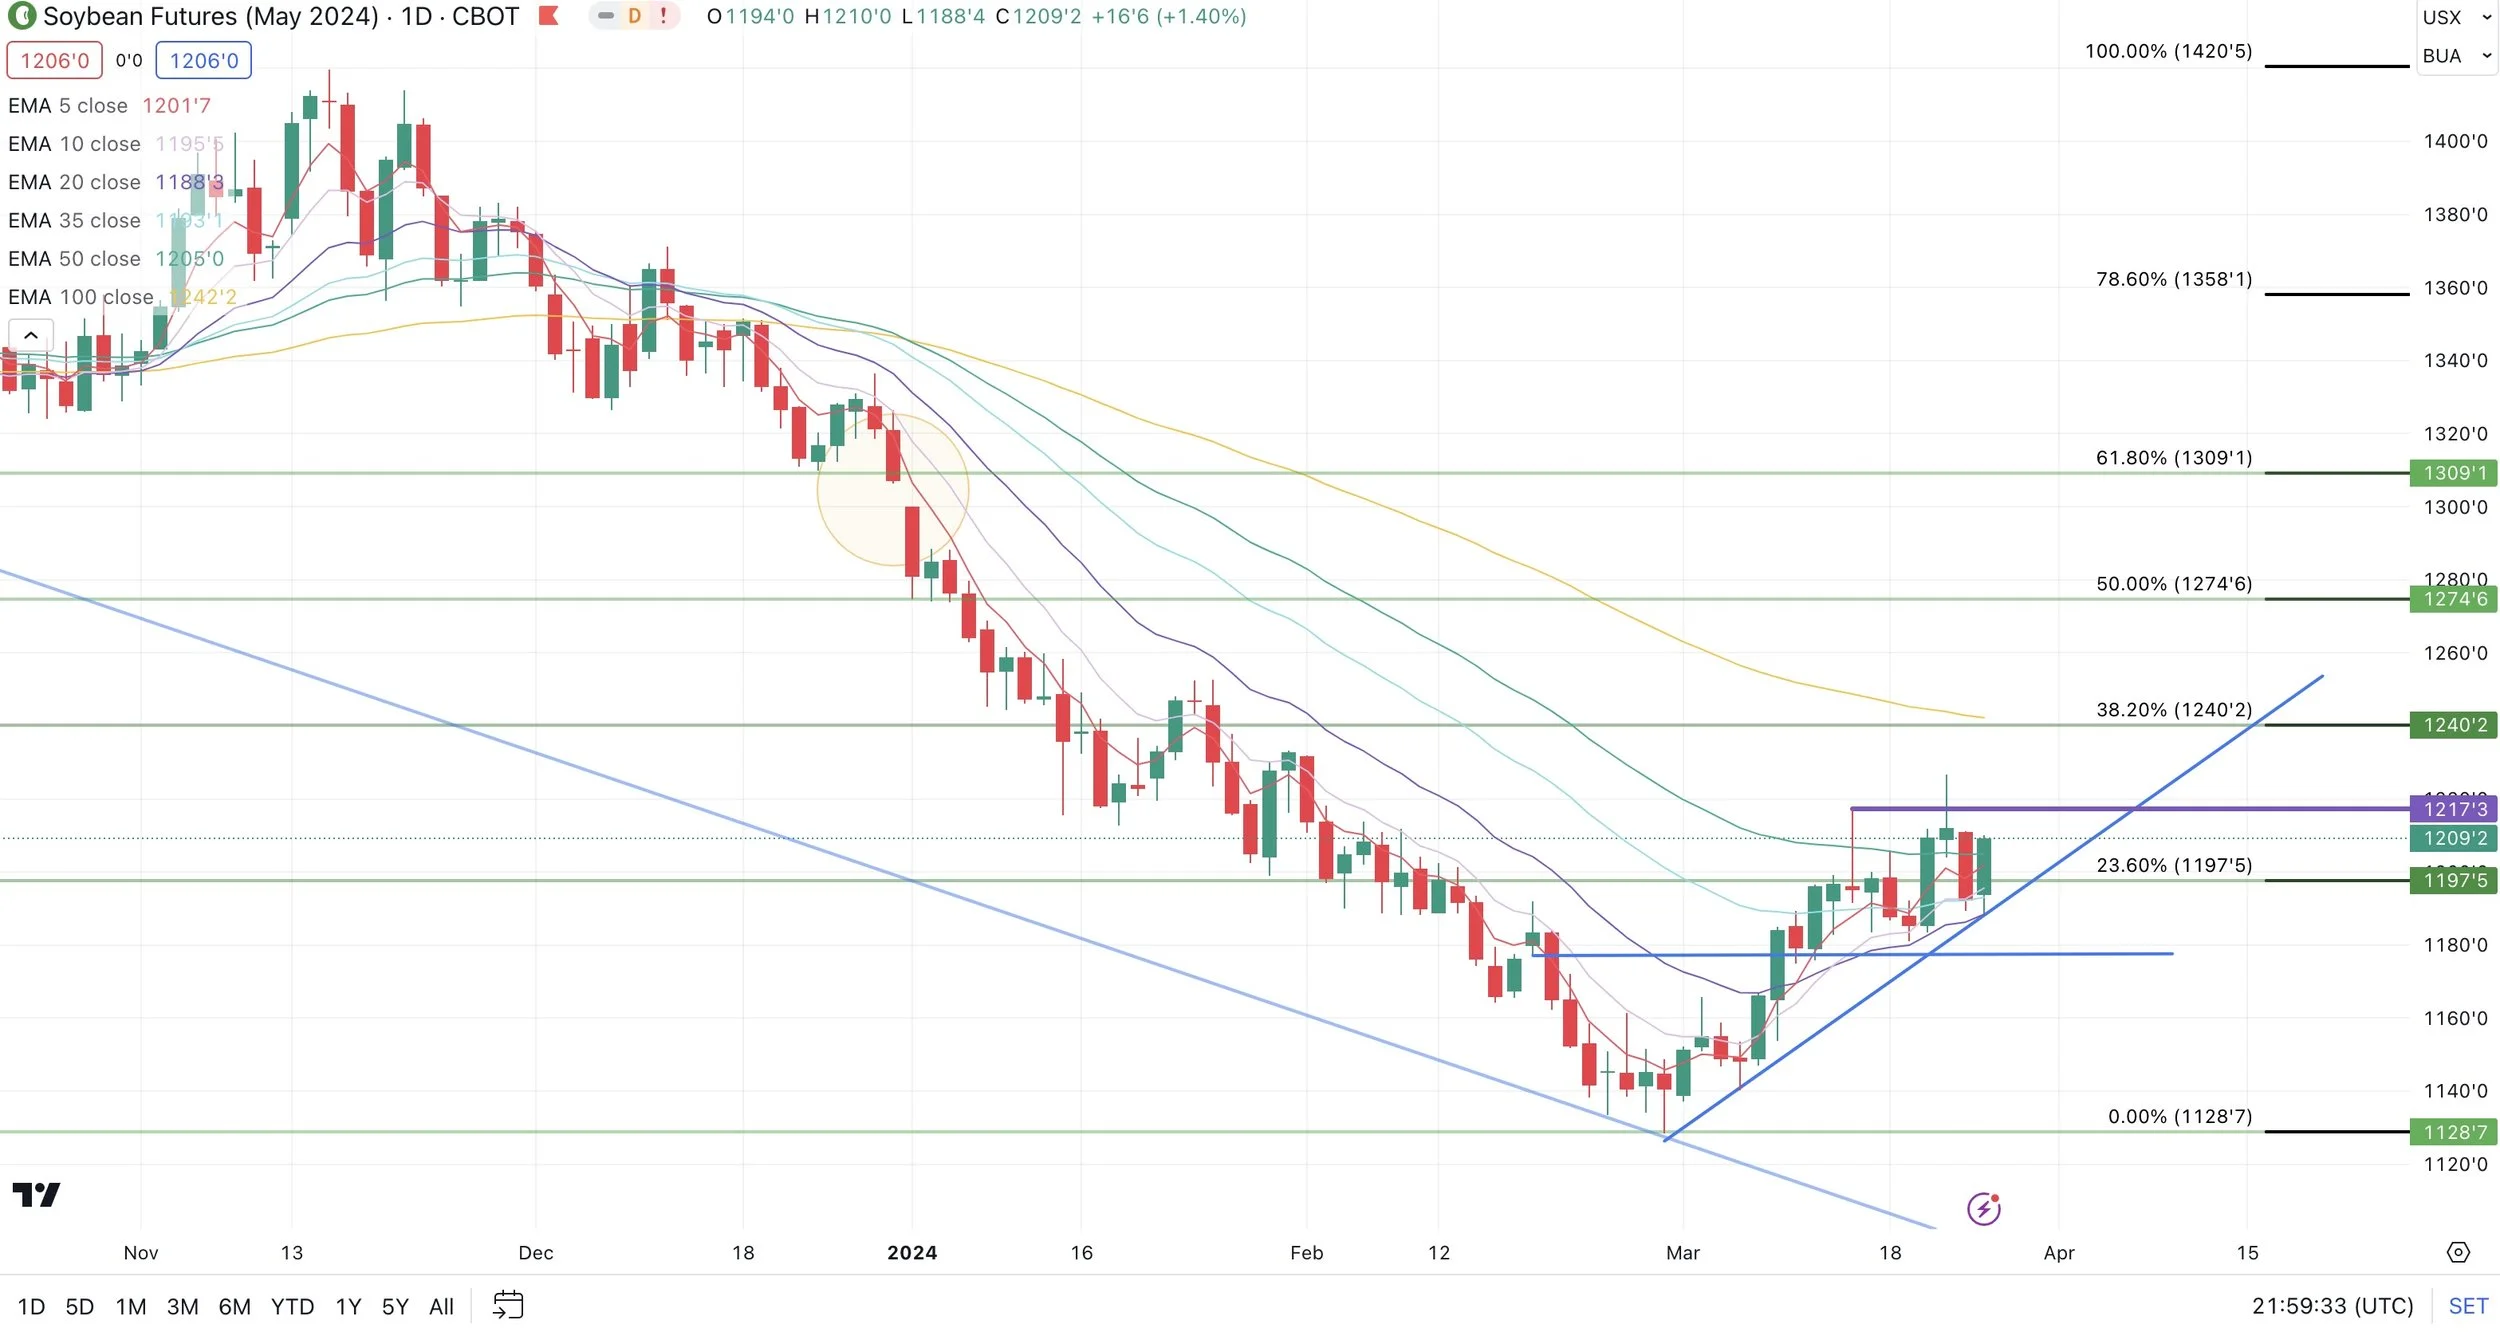
The soybean chart still looks friendly. We bounced right off that trendline, still remaining in an uptrend. We have a lot of smaller moving averages crossing over the larger ones.
A close above $12.17 should bring more upside.
From 247 Ag:
"Key support is $11.75, which absolutely needs to hold. Still need a weekly close over $12.00. Everything is set up for beans to reach $13.00 minimum."
Soybeans May-24
Wheat
The wheat market closes well off it's highs, closing just slightly higher in Chicago and slightly lower in KC and Minneapolis.
Chicago wheat rallied to a near 4 week highs before falling, but did make it's highest close since March 4th.
Wheat has been seeing a lot of war news.
Russia thinks that Ukraine is behind the terrorist attack in Russia that took the lives of more than 100 people.
This has the potential to cause more escalations, but war rallies tend to not hold.
France wheat was rated at 66% G/E which is down a whopping 28% from last year's 94%. But France does not hold a huge stake in the global wheat market.
Russia farmers are considering reducing wheat acres in favor of soybeans and peas due to the low wheat prices along with rising input costs and export duties making wheat less profitable.
As for the upcoming report, estimates have spring wheat acres at 10.89 million, down from last year's 11.2 million.
All wheat plantings are seen at 47.33 million acres, down from 49.58 last year.
Overall the market is not expecting this report to be quiet as big of a market mover for wheat as it is for corn and beans.
Bottom line, I still see higher prices for the wheat market and wheat remains a sleeper. It's more a question of "when" rather than "if". It might take some time, but wheat will have it's time to shine.
A close above last week's high of $5.59 should bring more upside in Chicago.
On KC, we close above that brutal trendline for the first time since August of last year. It has the potential to be a bull trap, but if we could get some more follow through that chart could start to turn around.
May-24 Chicago
May-24 KC
Cattle
Cattle lower, I have been saying for some time that this market looks like it could topping.
The cattle on feed report was negative today.
We could still go higher, but I still like taking risk off the table for some of you.
We are nearing some potential moving average crossovers to the downside that could possibly trigger a sell signal.
If you want to discuss different strategies to use please give us a call (605)295-3100.
Live Cattle
Feeder Cattle
Want to Talk?
Our phones are open 24/7 for you guys if you ever need anything or want to discuss your operation.
Hedge Account
Interested in a hedge account? Use the link below to set up an account or shoot Jeremey a call at (605)295-3100 or Wade at (605)870-0091
Check Out Past Updates
3/22/24
PRE-USDA REPORT POSITIONING
3/21/24
GRAINS FAIL TO HOLD OVERNIGHT RALLY
3/20/24
MORE SHORT COVERING LEADS TO MORE SHORT COVERING
3/19/24
WHEAT LEADS WITH RUSSIA TARIFF RUMORS
3/18/24
ARE YOU PREPARED FOR 160 OR 190 BU CORN?
3/15/24
BULLISH & BEARISH FACTORS DRIVING GRAINS
3/14/24
ARE YOU COMFORTABLE WITH THIS VOLATILITY?
3/13/24
RALLY TAKES A PAUSE
3/12/24
CONAB A LOT SMARTER & SMALLER THAN USDA
3/11/24
CORN 4TH DAY HIGHER & KEY REVERSAL IN WHEAT
3/8/24
USDA RECAP: POOR REPORT, GREAT REACTION

