USDA GAME CHANGER OR NOT?
MARKET UPDATE
You can scroll to read the usual update as well. As the written version is the exact same as the video.
Want to talk or put together a market plan?
(605)295-3100
Futures Prices Close
Overview
Another strong day in grains following Friday's really bullish report from corn & soybeans.
This USDA report is usually a top 3 most important report of the entire year regardless of the outcome.
In Friday's report we saw the largest Nov-Jan report yield drop in soybeans ever. It was also one of the largest drops in corn yield in recent memory as well.
As ALL the production numbers for corn & beans fell way below the trade estimates.
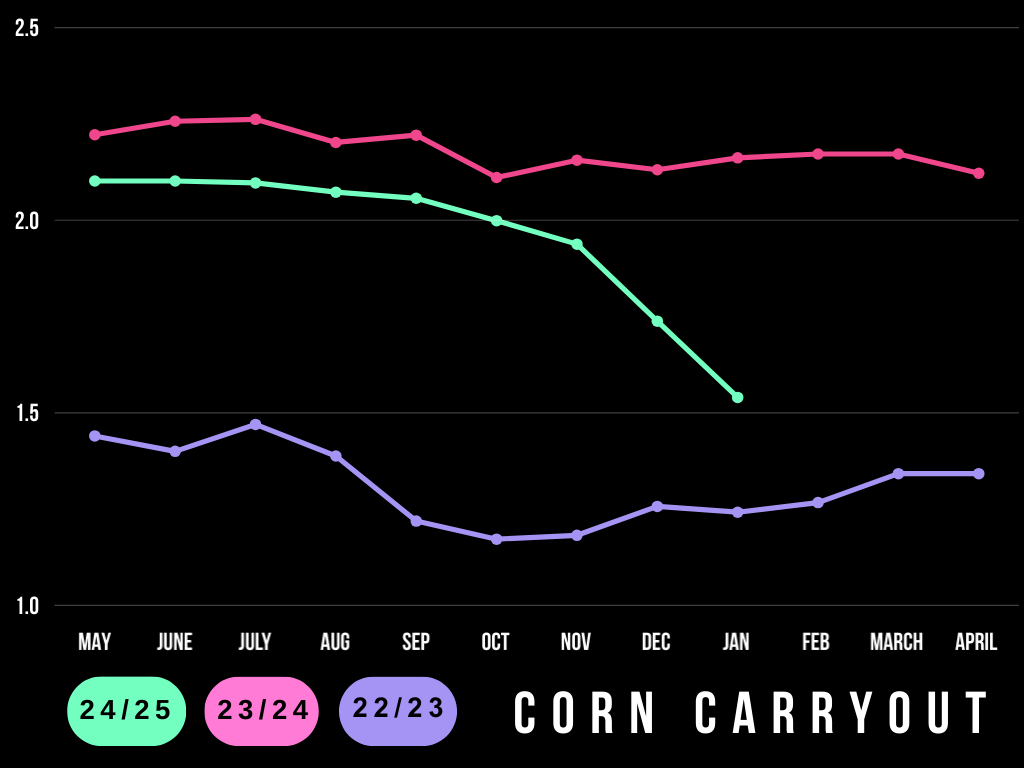
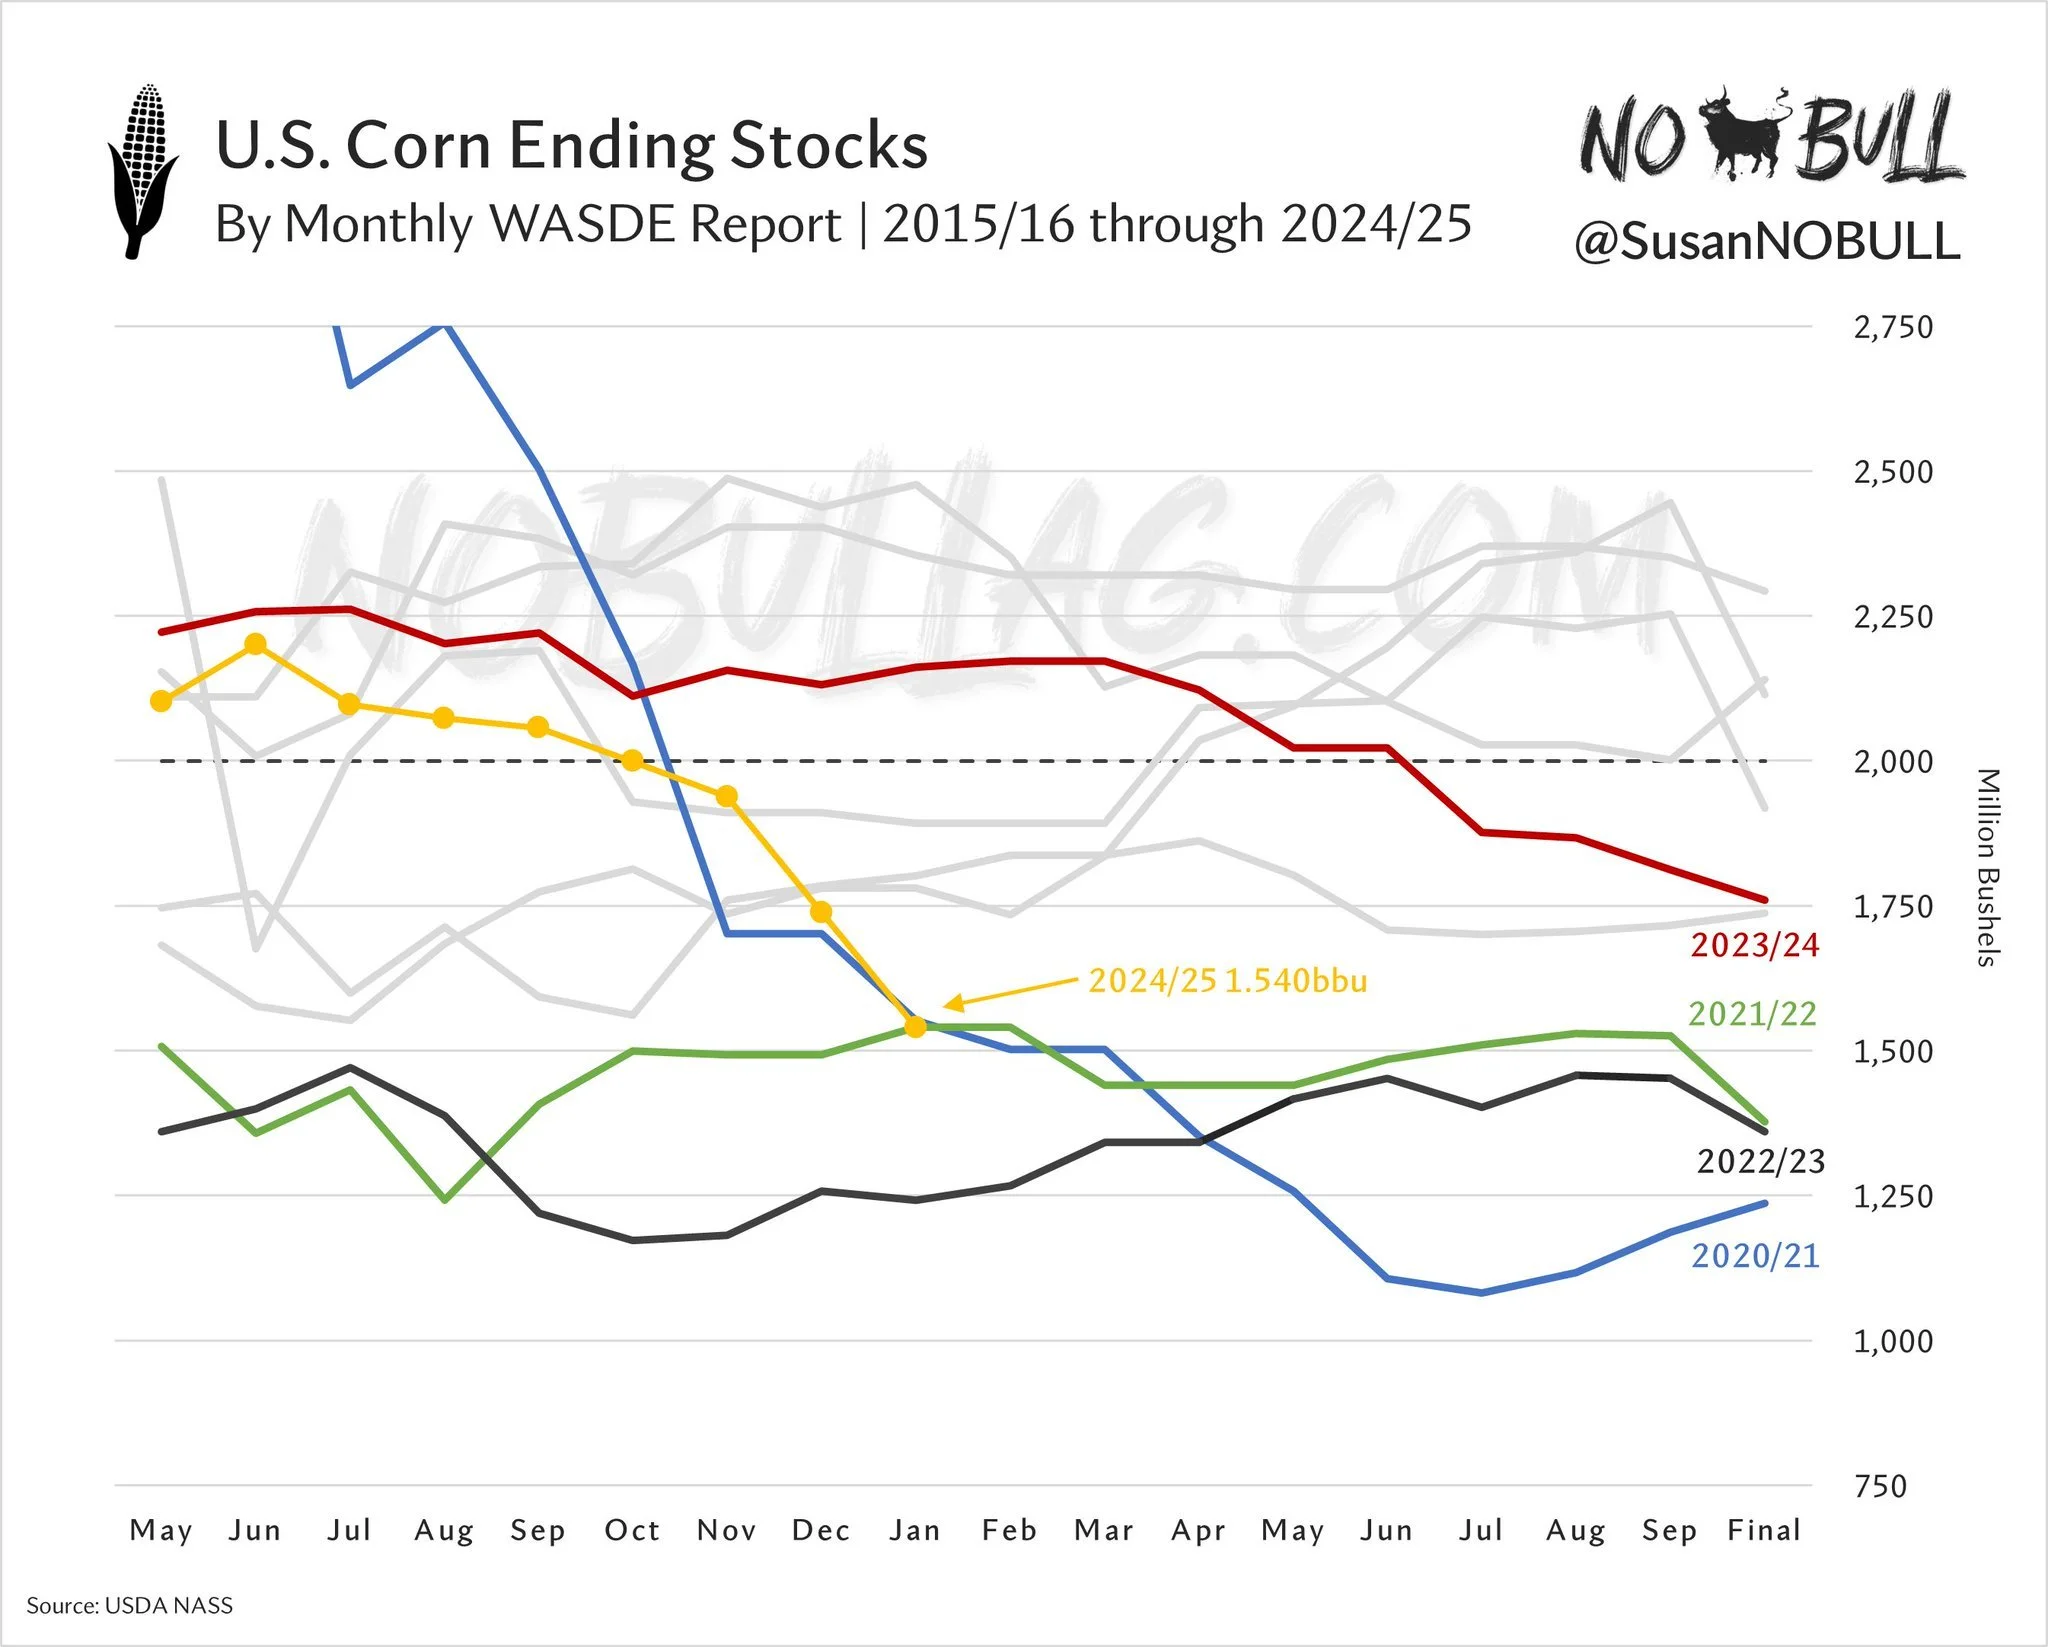
Corn carryout started the marketing year over +2 billion
It is now nearly 1.5 billion.
Carryout has dropped in 7 straight reports.
The longest streak in over +20 years.
Corn carryout is now right about on par with where we were in 2021 and 2022 at this same time in the year.
Chart from NoBull Ag
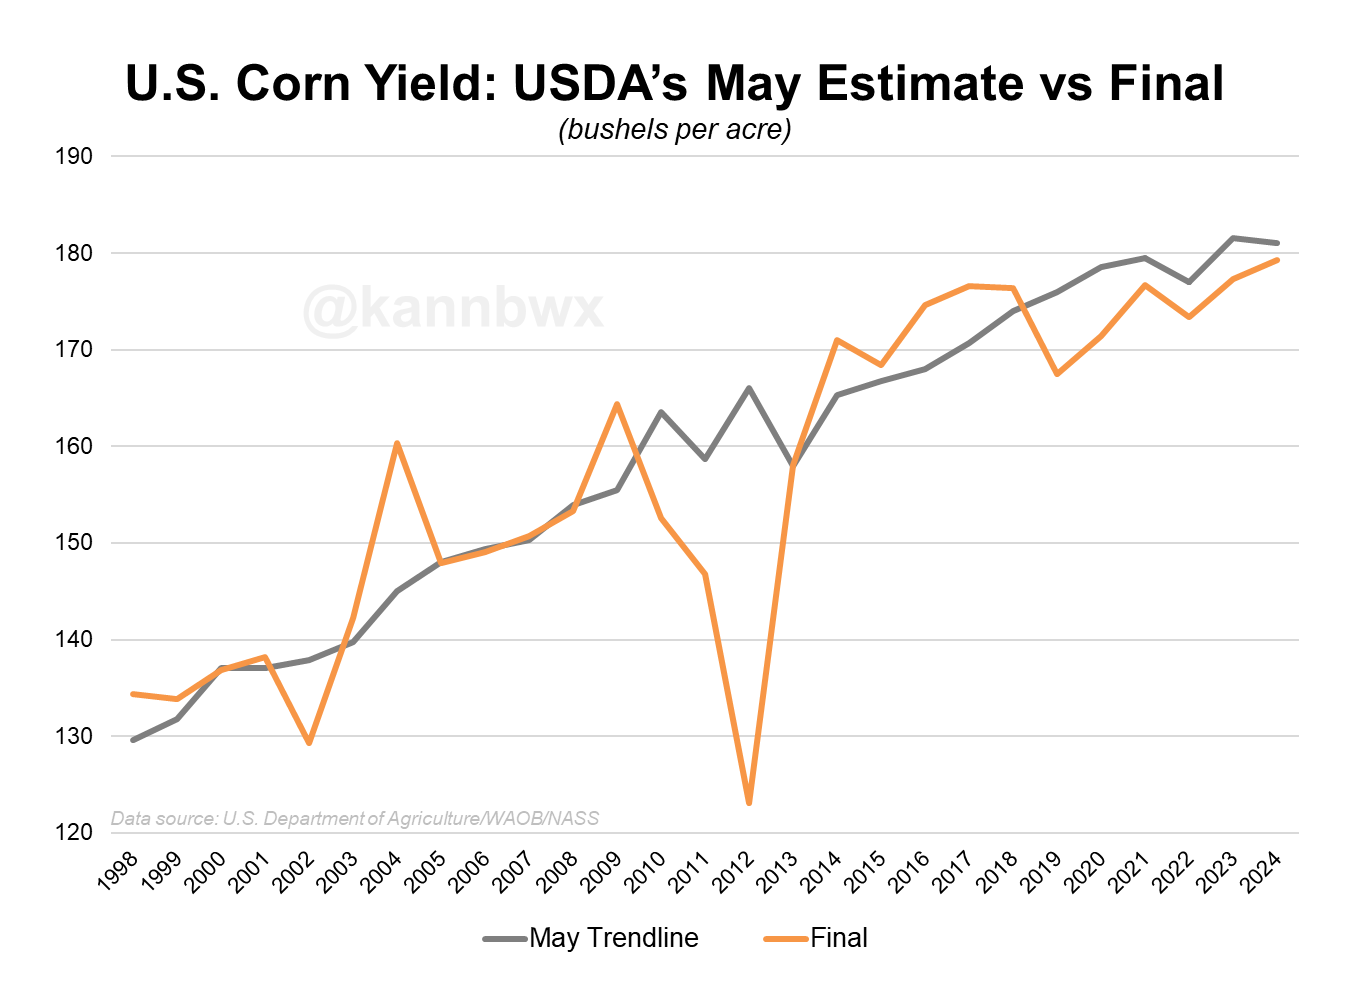
Corn yield failed to break the USDA's inital trendline yield for the 6th year in a row.
The market first called for 180 bpa back in 2018. It has still yet to happen even with the near perfect summer for the I-states this year.
The trendline might be too aggressive. Altough we had record yields the past 2 years, yield has pretty much chopped around in the 170-175 range since 2013.
Chart from Karen Braun
So how does this change things?
Let's take a look at the US vs World situations.
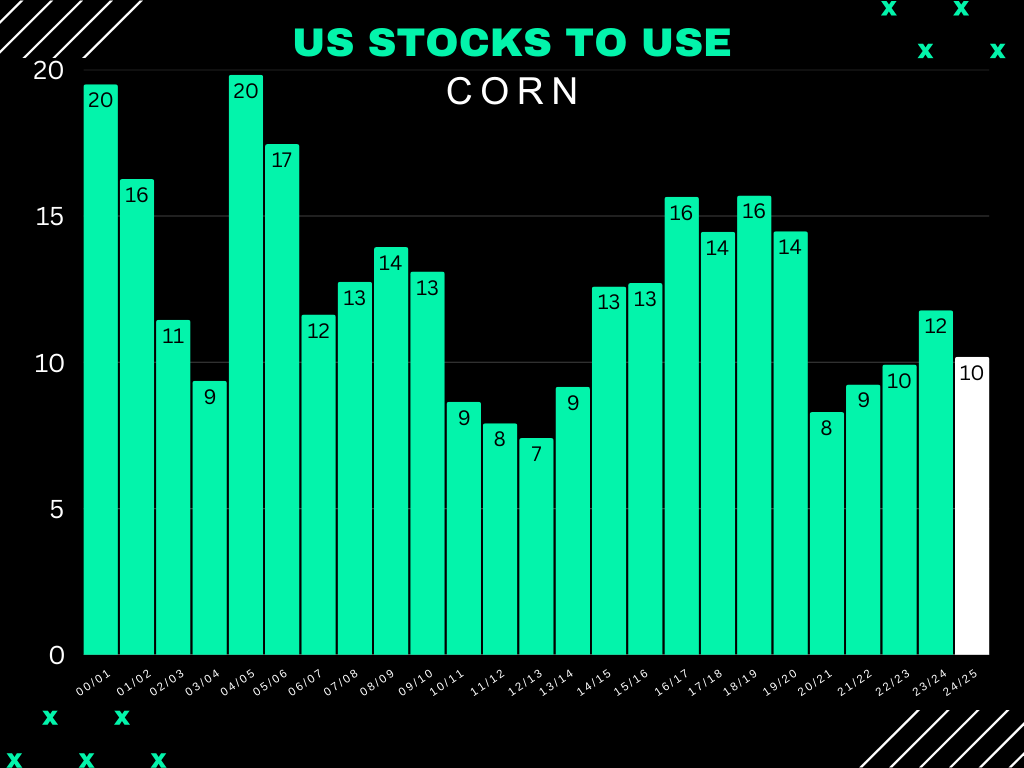
The stocks to use ratio is by far the most accurate way to determine how supply and demand is shaping up.
First US corn stocks to use ratio.
We are now near "bull market territory". Which is usually considered when stocks to use is under 10%. Right now it is 10.19%
It's not quiet as bullish as 2020/21 to 2022/23 where we saw 8-9%
But it is more friendly than 2023/24's 11.78% and FAR better than the bear market years of 2014-2019 where it ranged from 13-16%.
2018/19 - 15.7%
2019/20 - 14.48%
2020/21 - 8.3%
2021/22 - 9.24%
2022/23 - 9.92%
2023/24 - 11.78%
2024/25 - 10.19%
So right now we are basically in the middle of the bear market and the bull market.
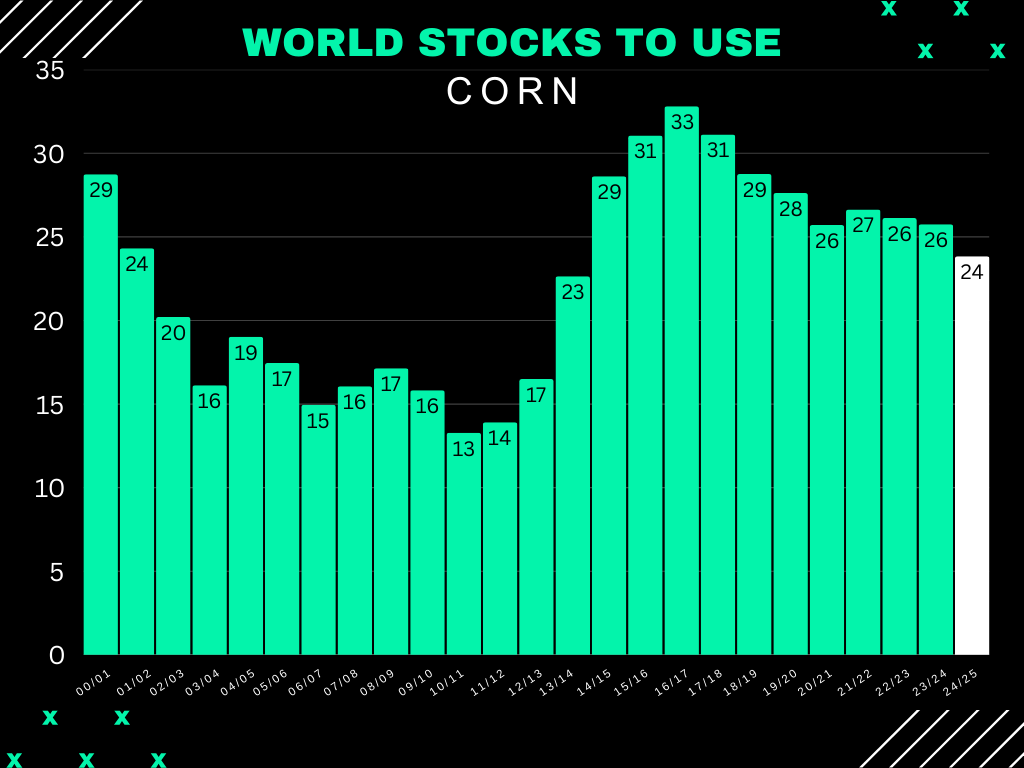
Looking at the world situation, corn actually has it's lowest stocks to use ratio since 2013/14.
As it has continued to decline for the past 7 of 8 years.
Decently friendly there as well.
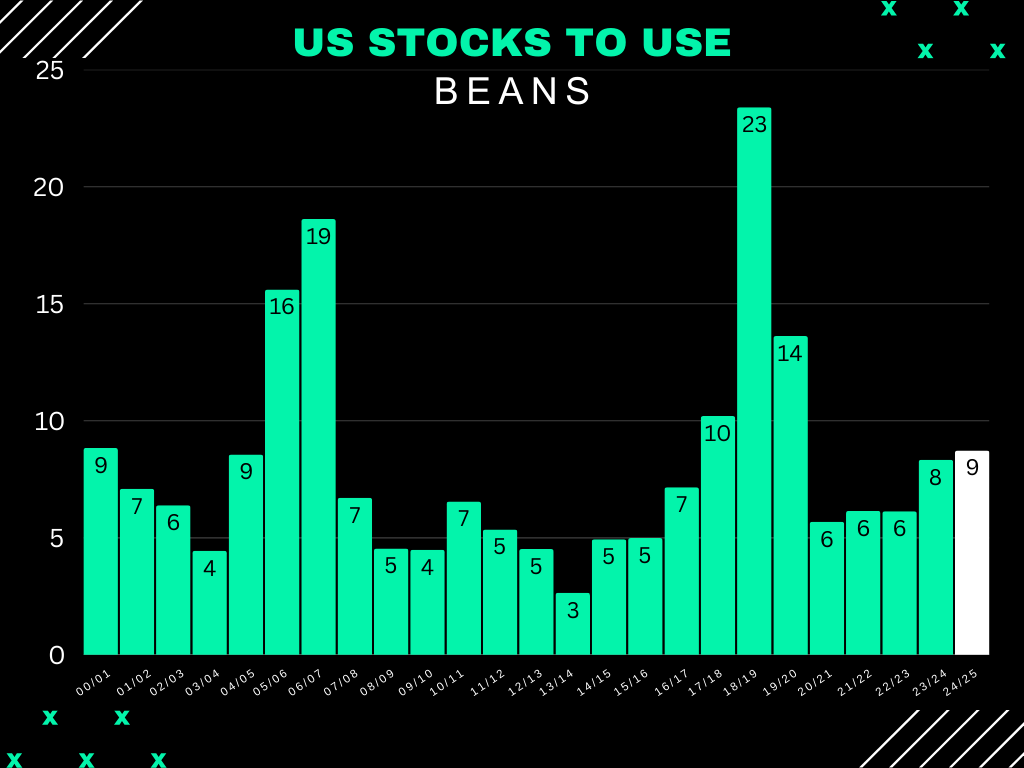
Looking at US soybeans, just like corn it is somewhat in the middle of the bear market years and bull market years but isn’t quiet as close to bull market as corn.
It is also still the most bearish we have seen since 2019/20.
2016/17 - 7.16%
2017/18 - 10.2%
2018/19 - 23.39%
2019/20 - 13.62%
2020/21 - 5.69%
2021/22 - 6.15%
2022/23 - 6.14%
2023/24 8.34%
2024/25 - 8.73%
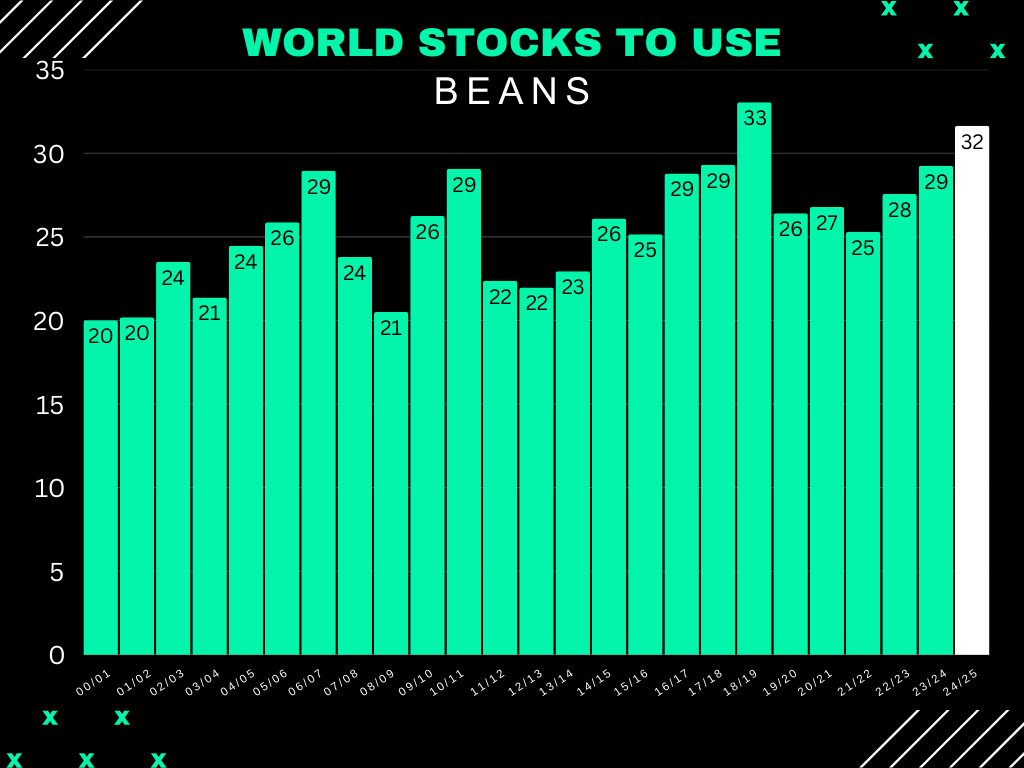
The world situation is of course the biggest issue for beans.
2nd most bearish of all time.
Argentina could potentially still face some issues but there is a decent chance Brazil's monster crop will be more than enough to make up for the losses.
Even if Argentina had some issues, it is not going to make a major dent in this figure on a global scale.
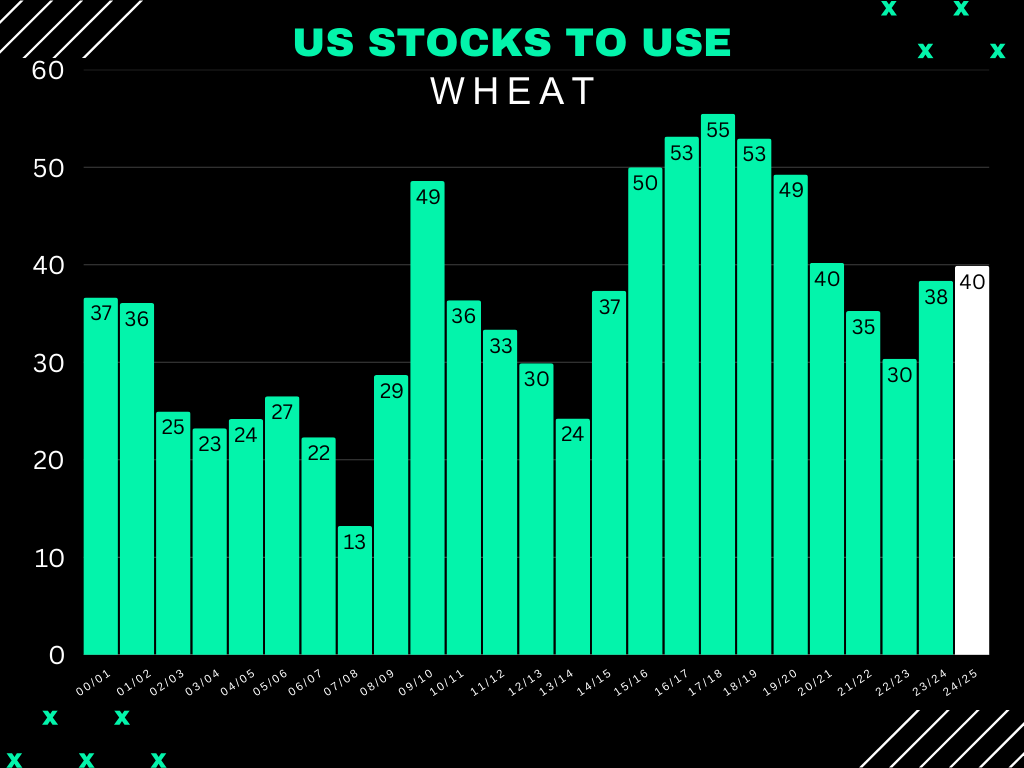
Looking at US wheat, we are in somewhat of a more bearish situation compared the past few years but nowhere near as bearish as many like 2017/18.
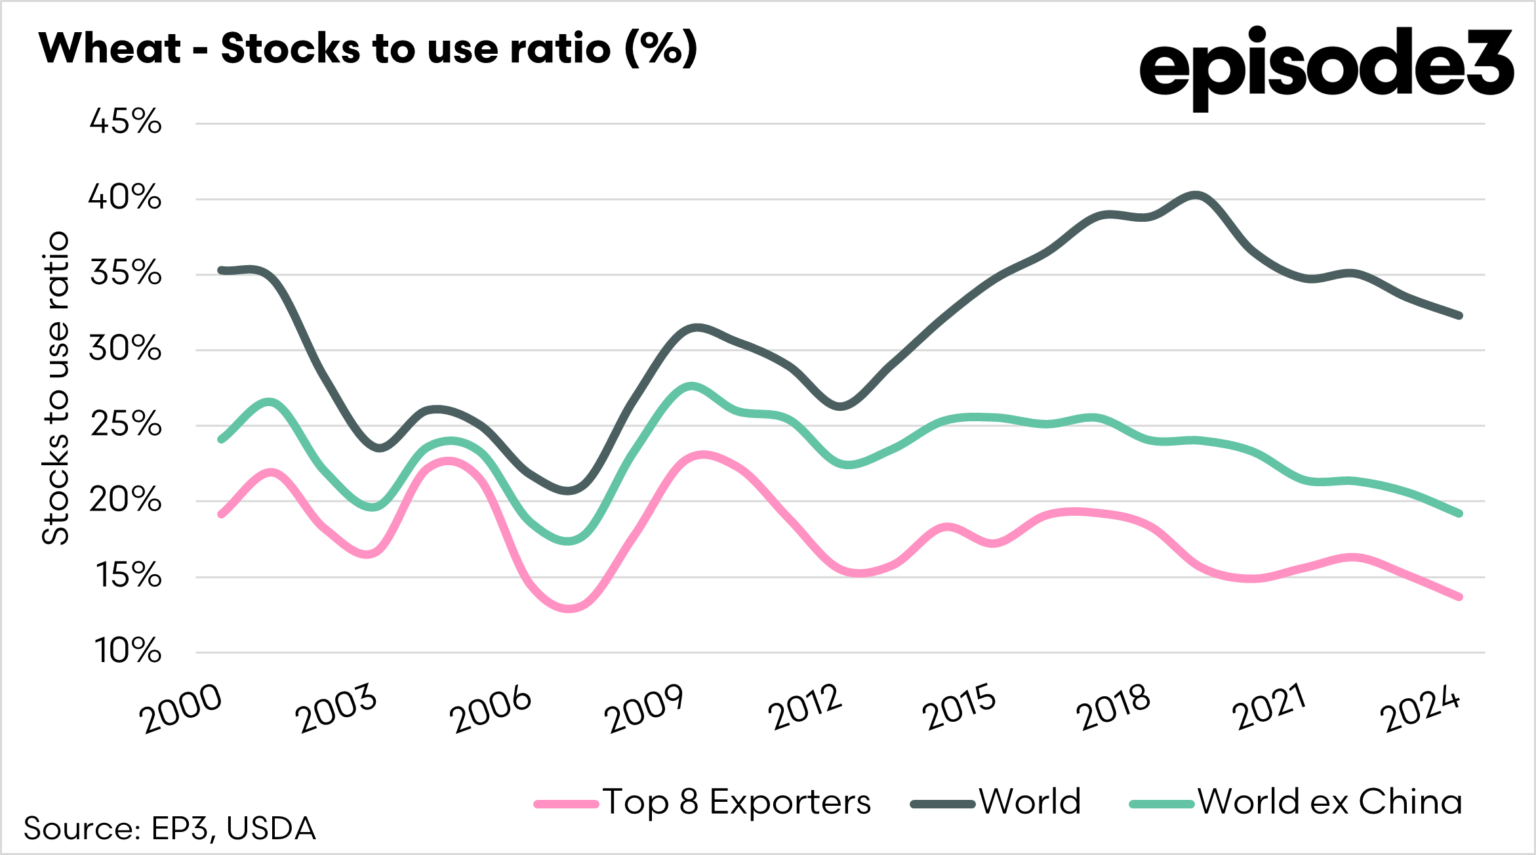
The world situation for wheat is friendly.
This number has shrunk for the 5th year in a row. Sitting at it's smallest since 2014/15.
The global wheat situation is even more friendly when you only use major global exporters.
So you take out countries such as China who grows wheat but does not export any.
This is the friendliest this number has been since 2008.
Today's Main Takeaways
Corn
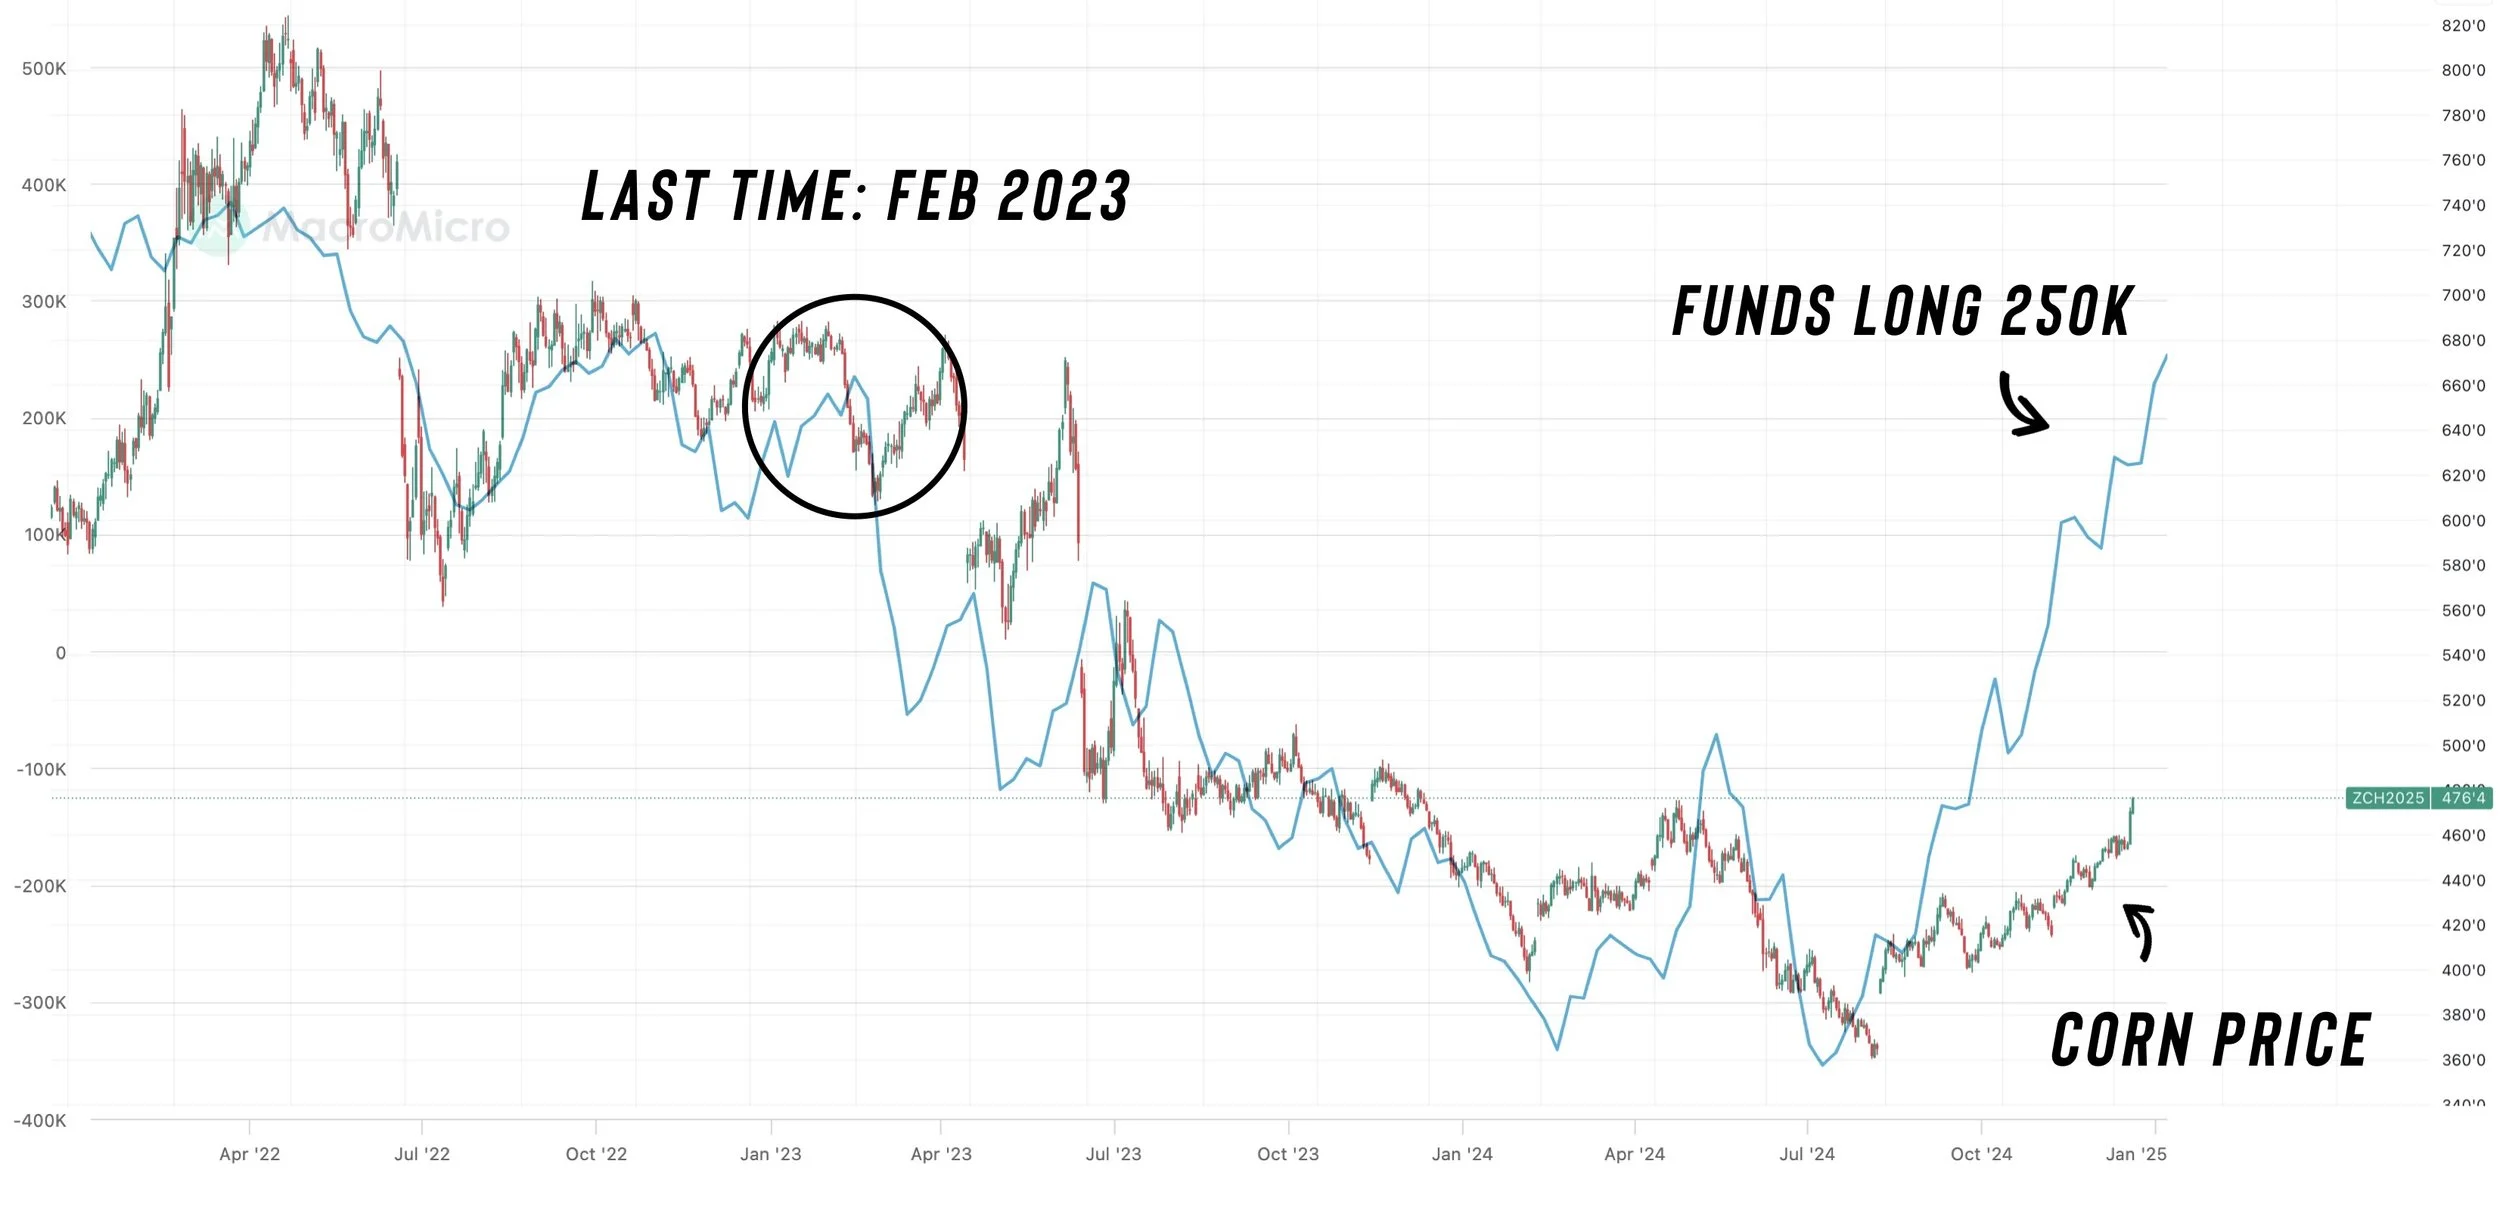
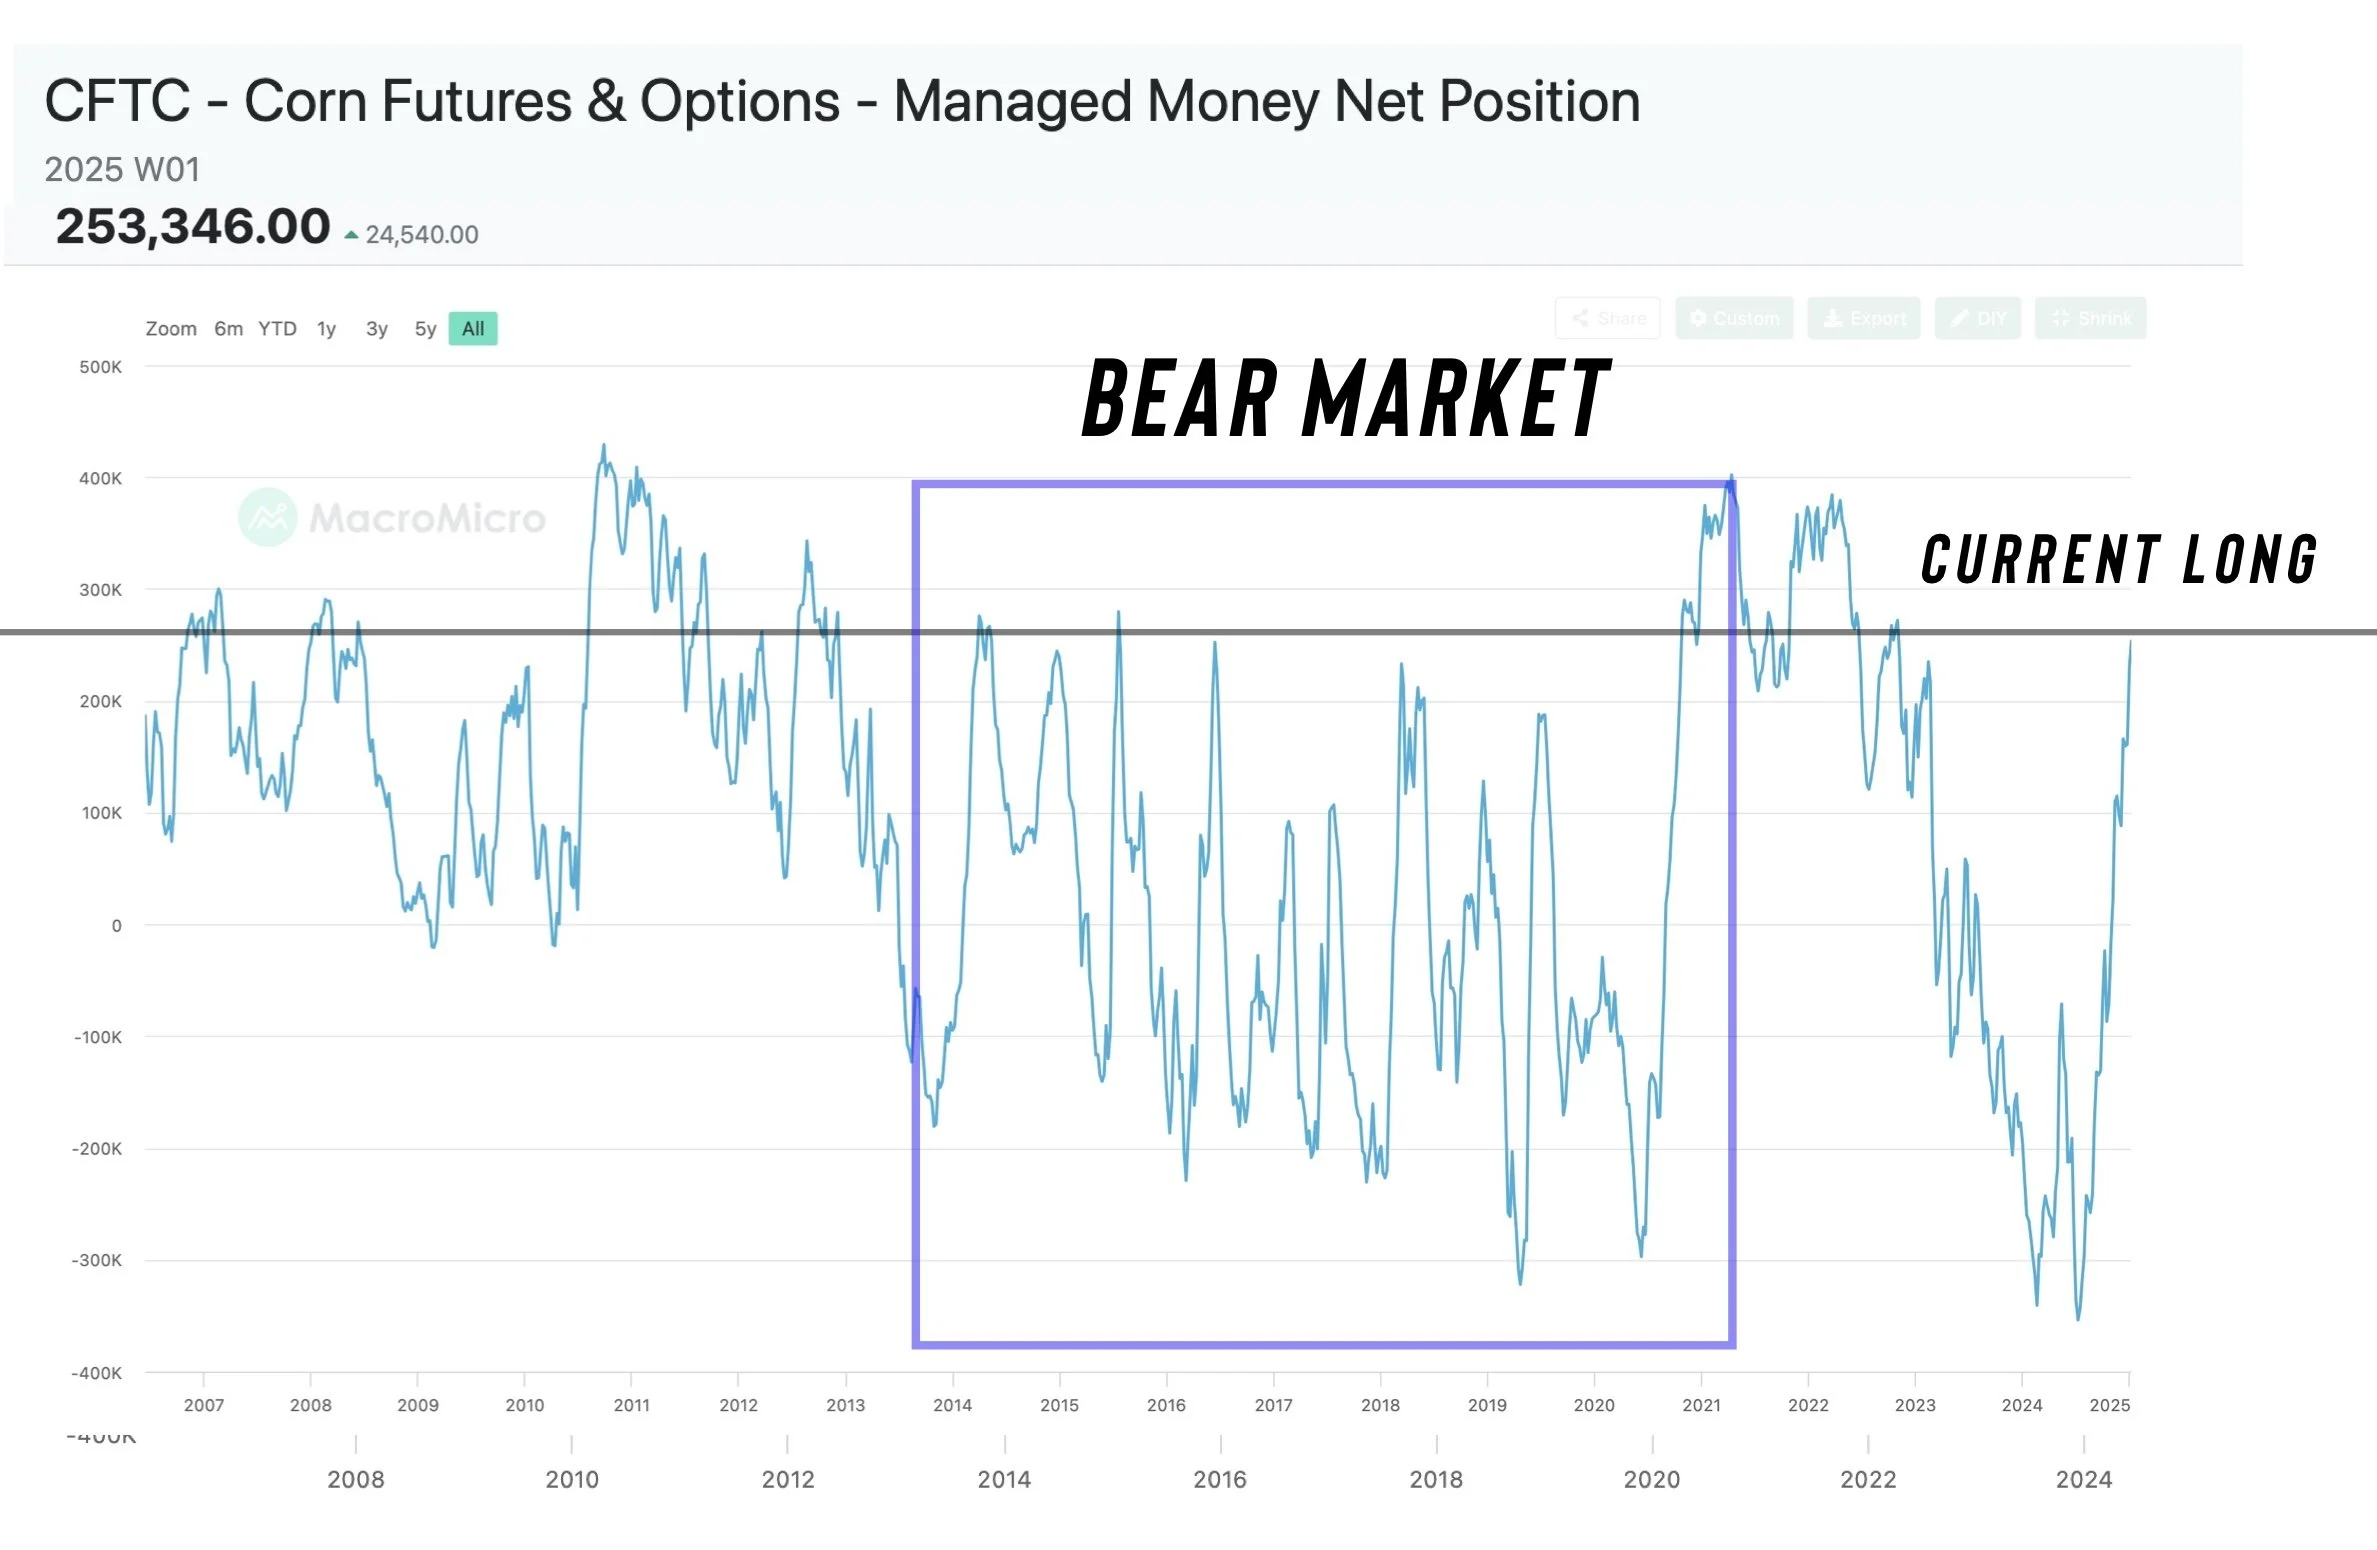
The funds are now long 250k contracts with some rumors that number is closer 300k now after the report.
Corn was trading at nearly $7 the last time the funds were this long corn.
Short term I think this is friendly, as they are wanting to buy corn for a reason.
They do not go from holding a record short to now holding the largest long position in 2 years, all in the span of a few months for no rhyme or reason. They are long for a reason and like to follow the trend.
More often than not, the funds tend to be right. Just like how they pushed corn to multi-year lows with that record short.
However, looking a little longer term the we do have to be cautious of them selling this new long position.
Historically, the funds top out around 200k contracts or so in bear market years and 400k in bull market years.
But for now it looks like they are on board.
Another big issue we might face this year is acres.
One of the reasons why the spreads have rallied so hard (old crop strong vs new crop) is because the market is very aware of the potential acre issue.
There are several people calling for 95 million corn acres this year.
So this has been weighing down new crop corn.
Here is the soybean to corn ratio price chart.
We currently still heavily favor more corn acres. This ratio is the smallest for this date since 2013.
But that being said, I still think corn has potential from here.
We completely shifted the fundamentals. Going from a +2 billion carryout to now 1.5 billion.
I would like to think we have a "chance" to see Dec-25 eventually trade in the realm of $4.75 to possibly even $5.00 at some point.
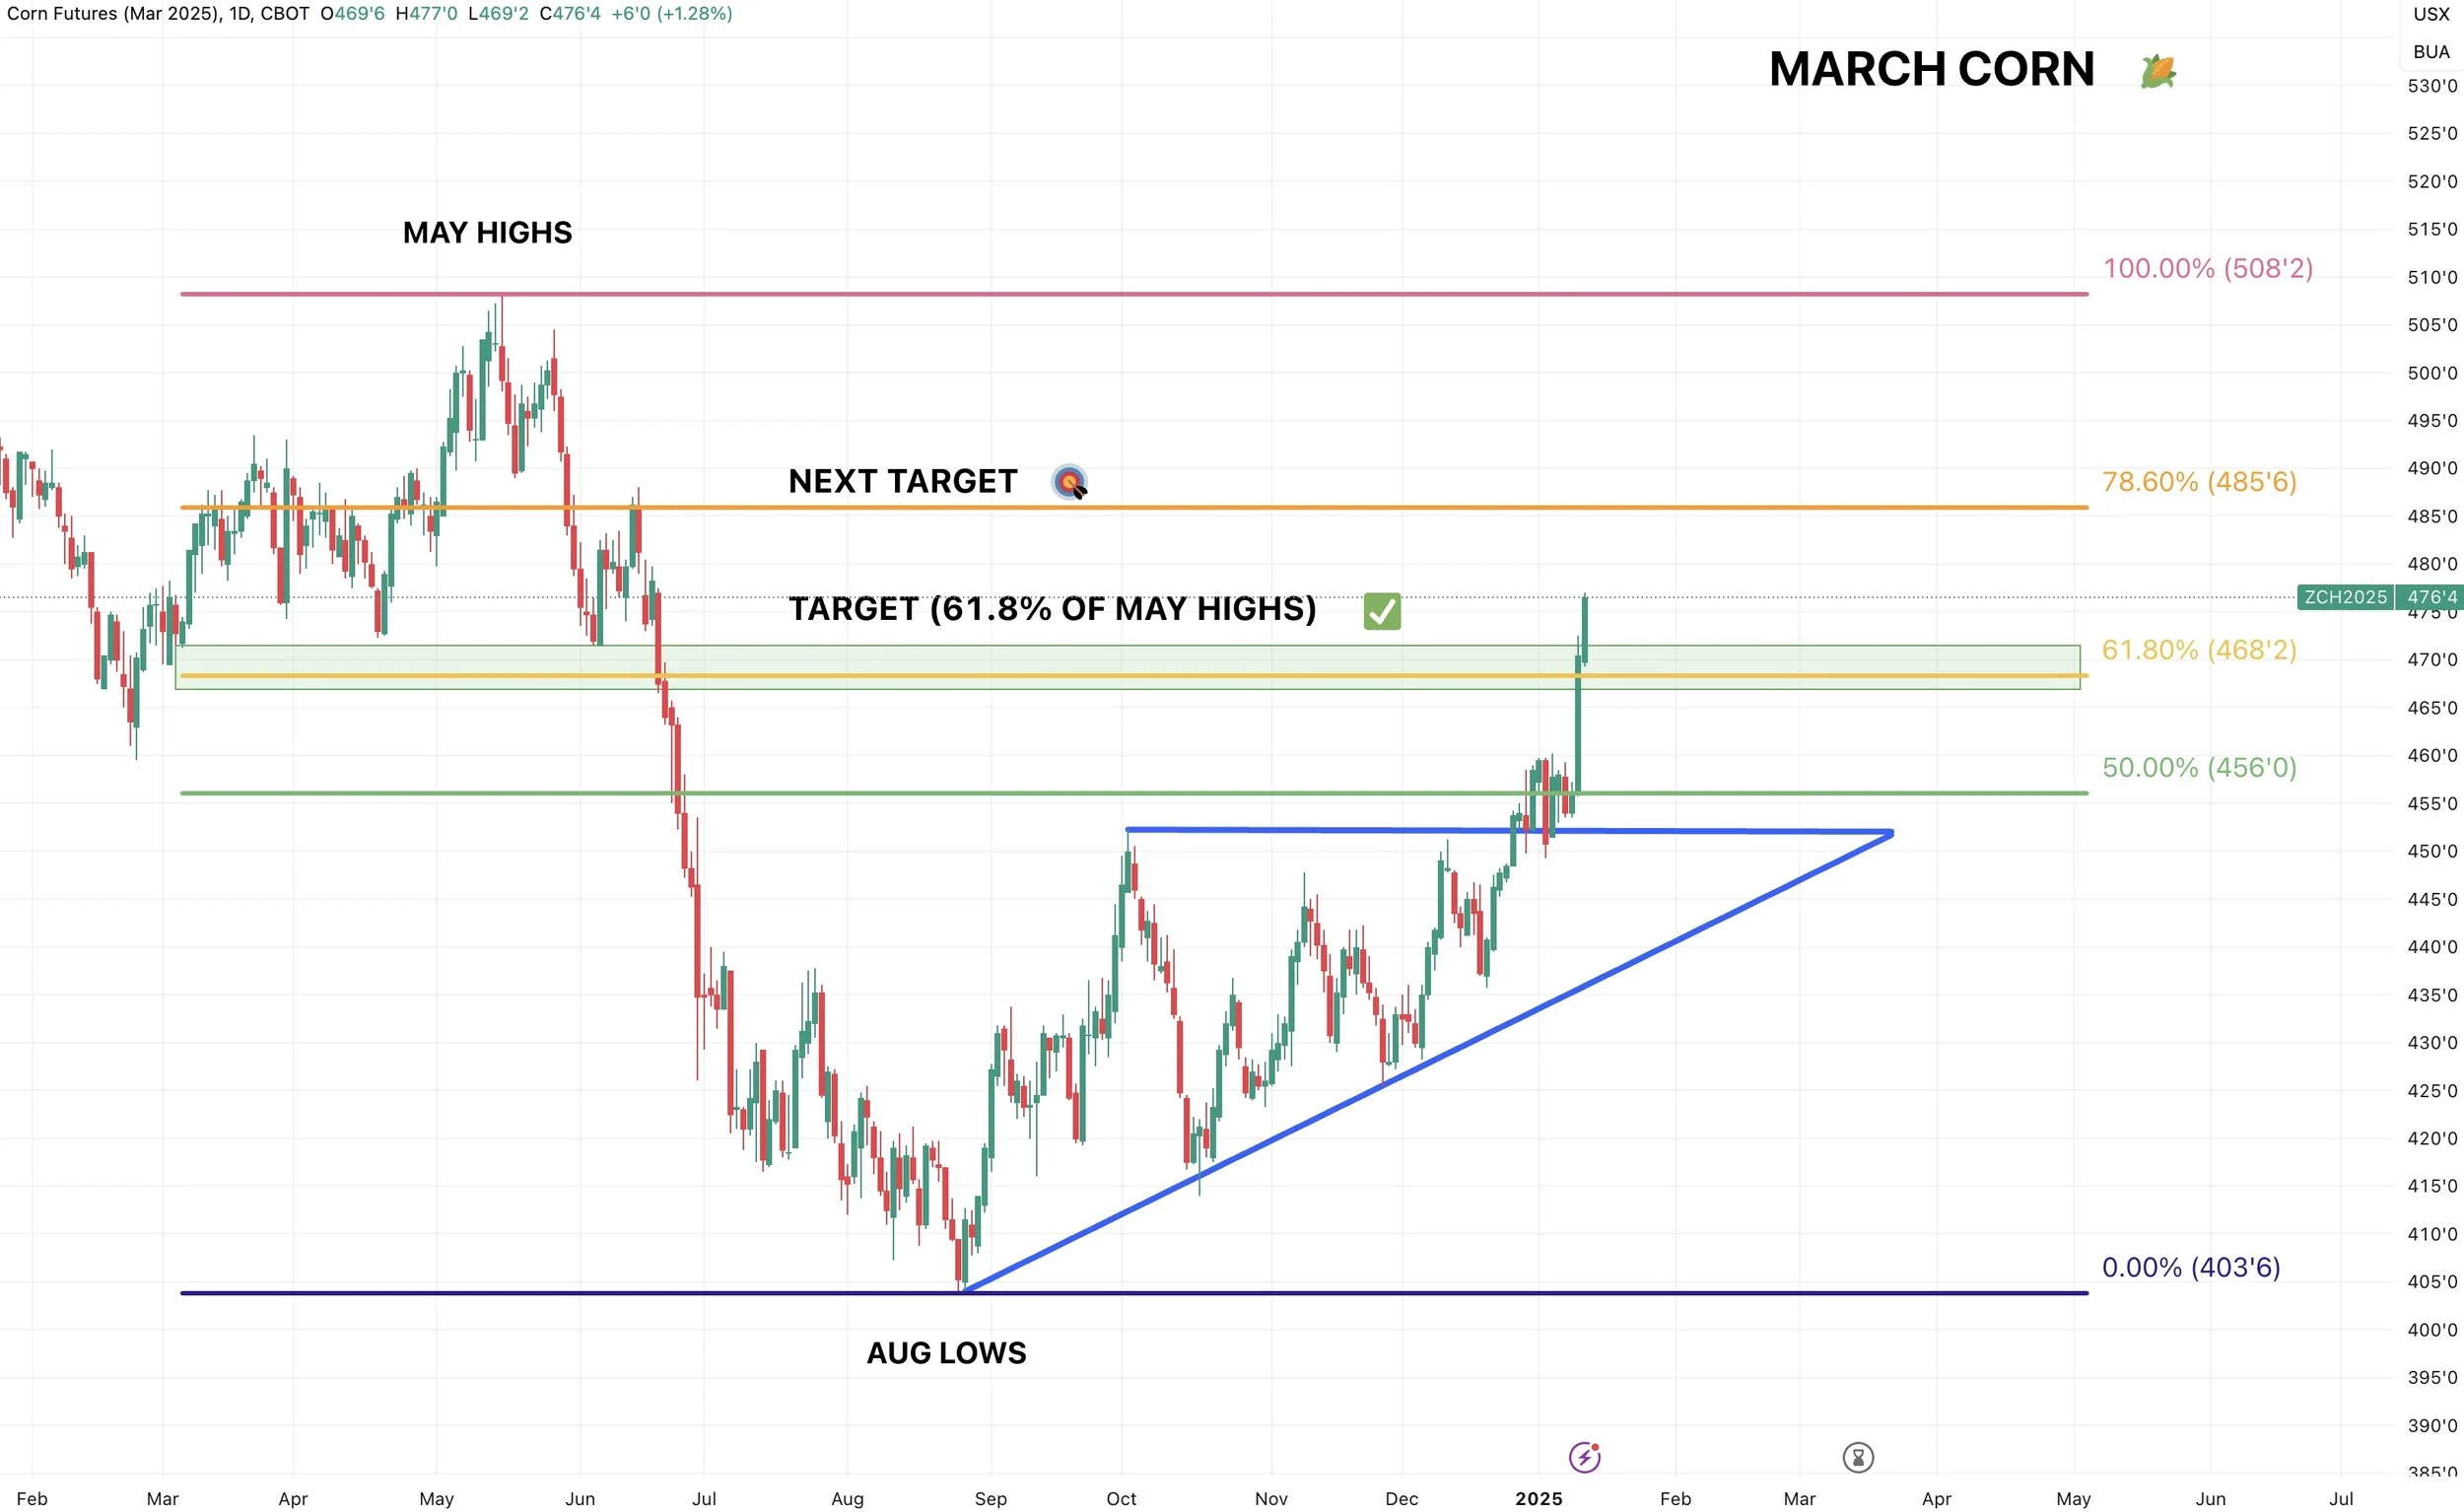
Looking at the chart our next targets for Dec-25 are $4.64 and then $4.72 (the 50-61.8% retracments to the May highs).
I do not "love" making new crop sales here unless you have your inputs locked in.
But not the worst idea to start scaling into a small amount of sales at $4.64 then $4.72 then $4.84 and so on. A simple idea would to just sell 5-10% at each fib level on the way up.
We have not officially had a sell signal for new crop yet.
The more aggressive approach would be to simply hedge new crop by buying puts on old crop. Working with the theory that since we are in an inverse, you have puts on what is overvalued and what should lead us lower if we head lower. We like this rather than straight up new crop sales.
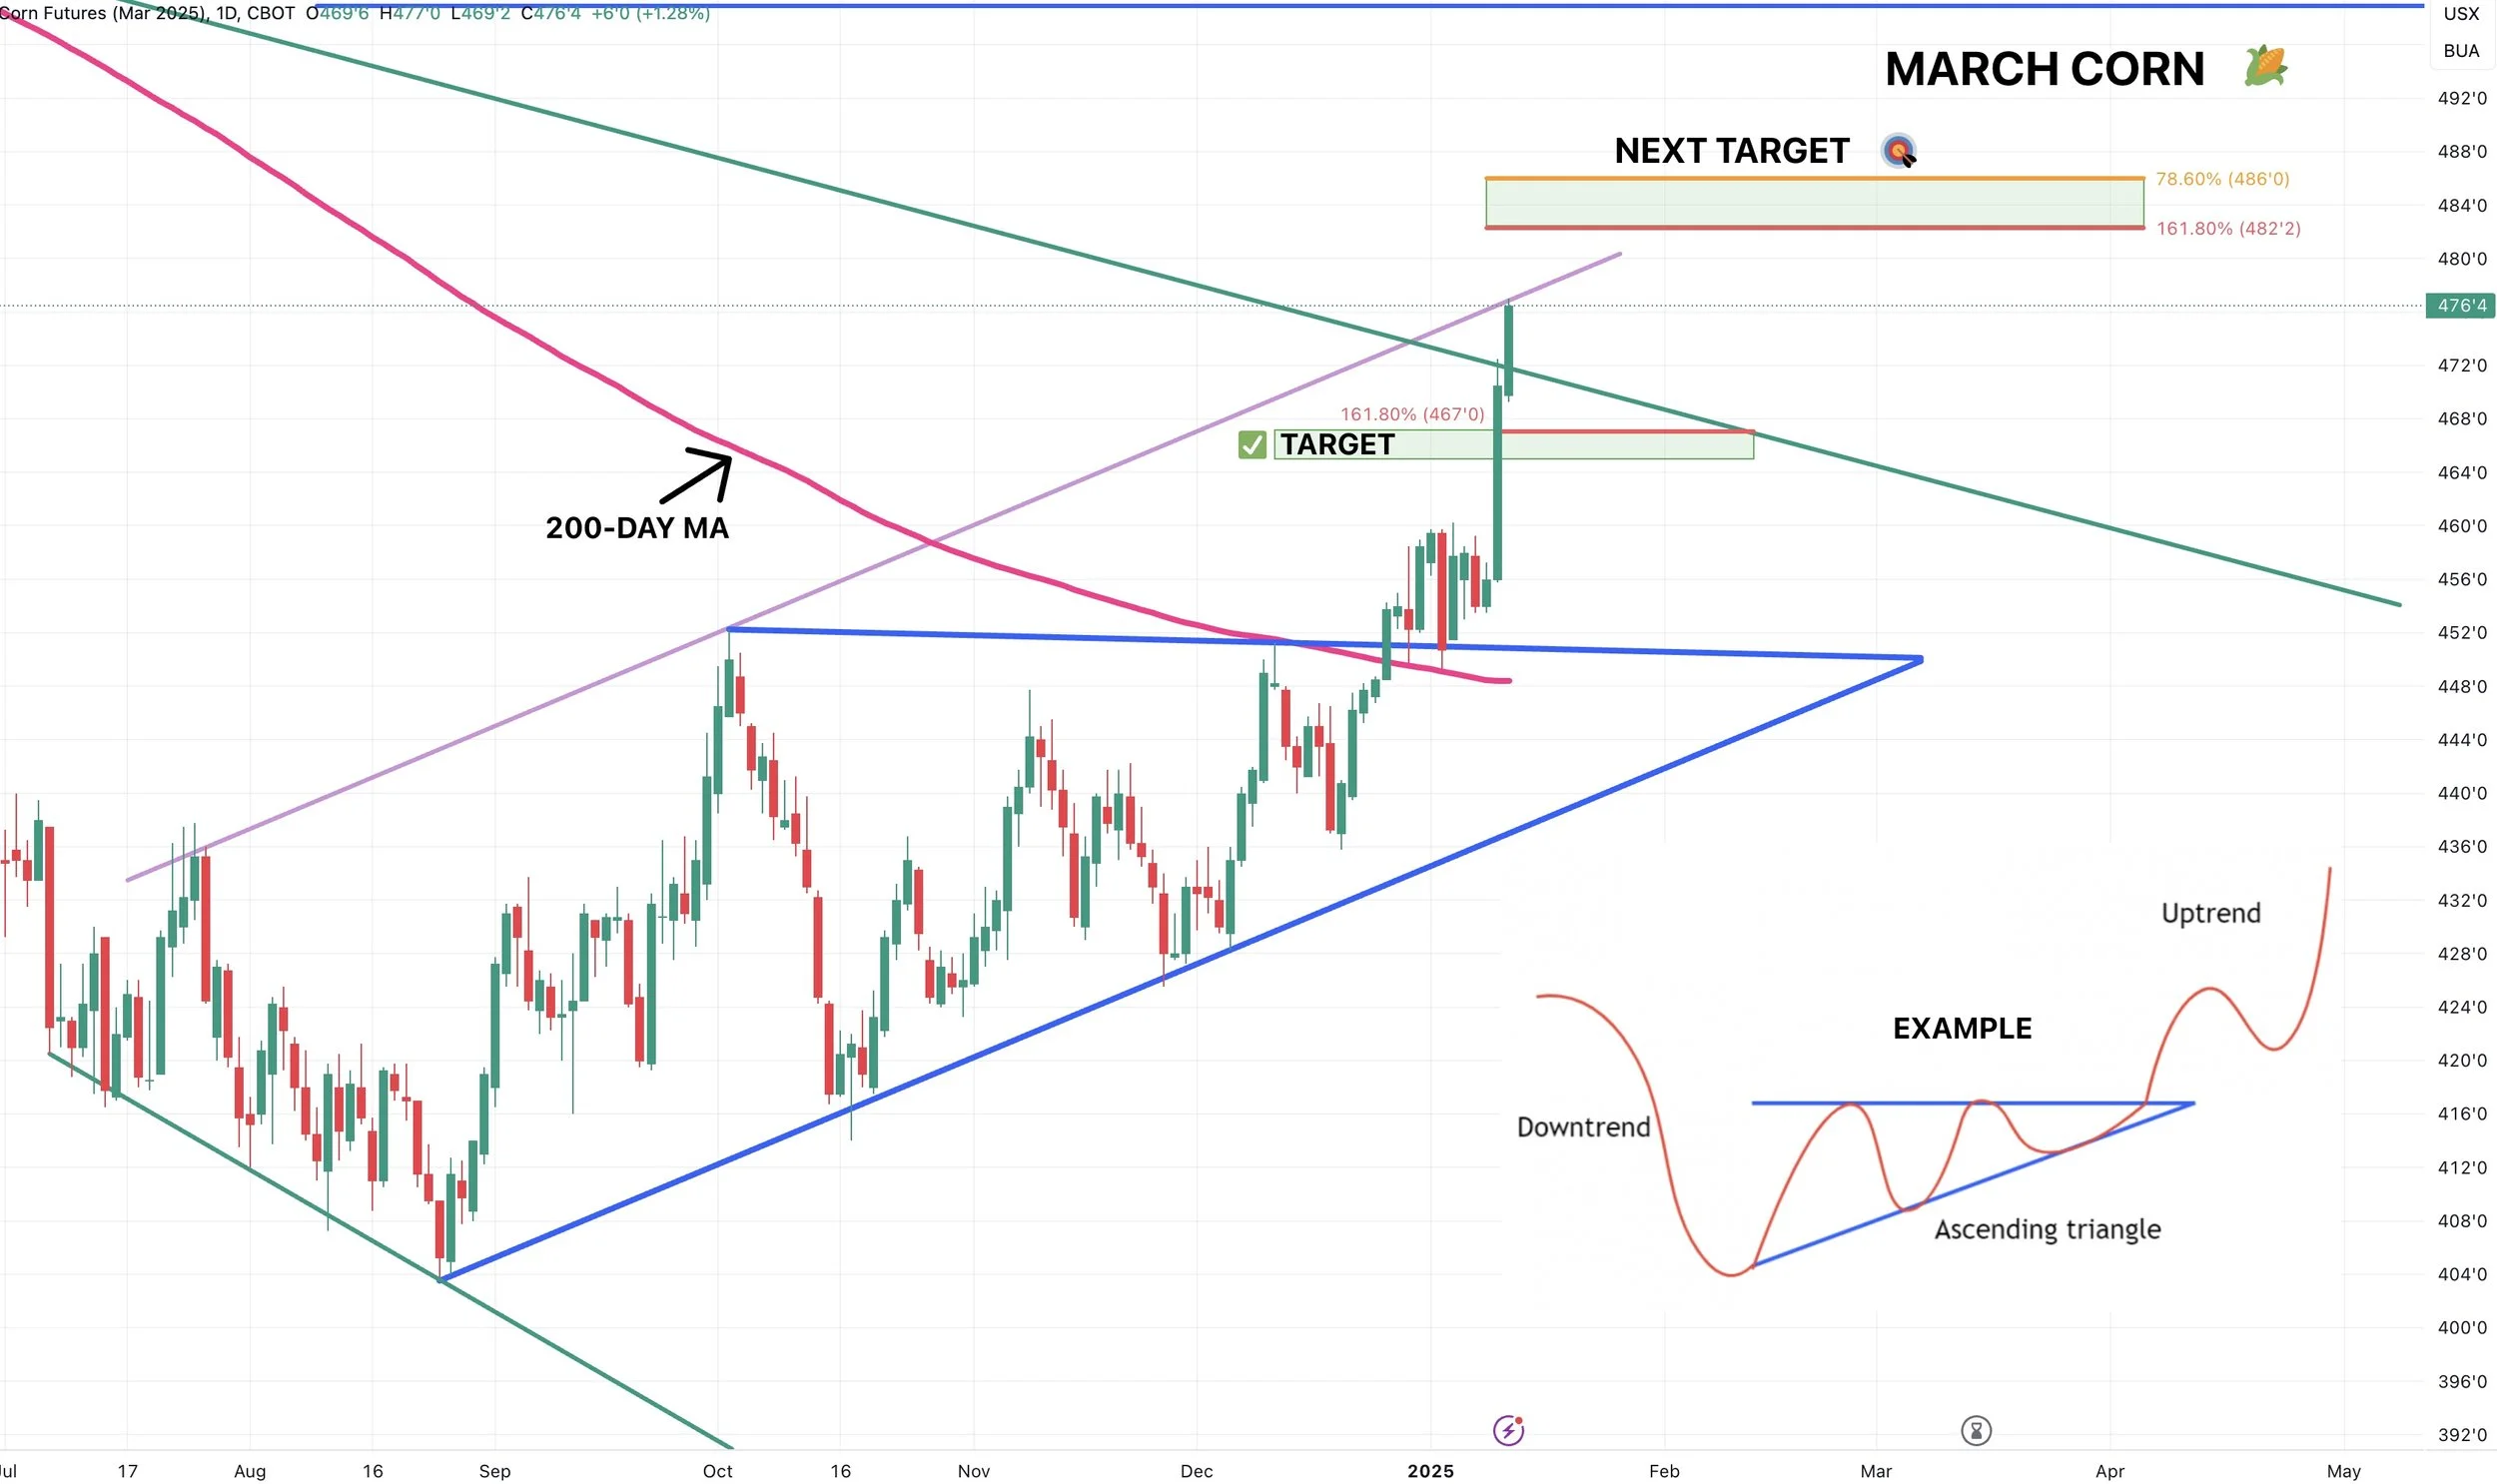
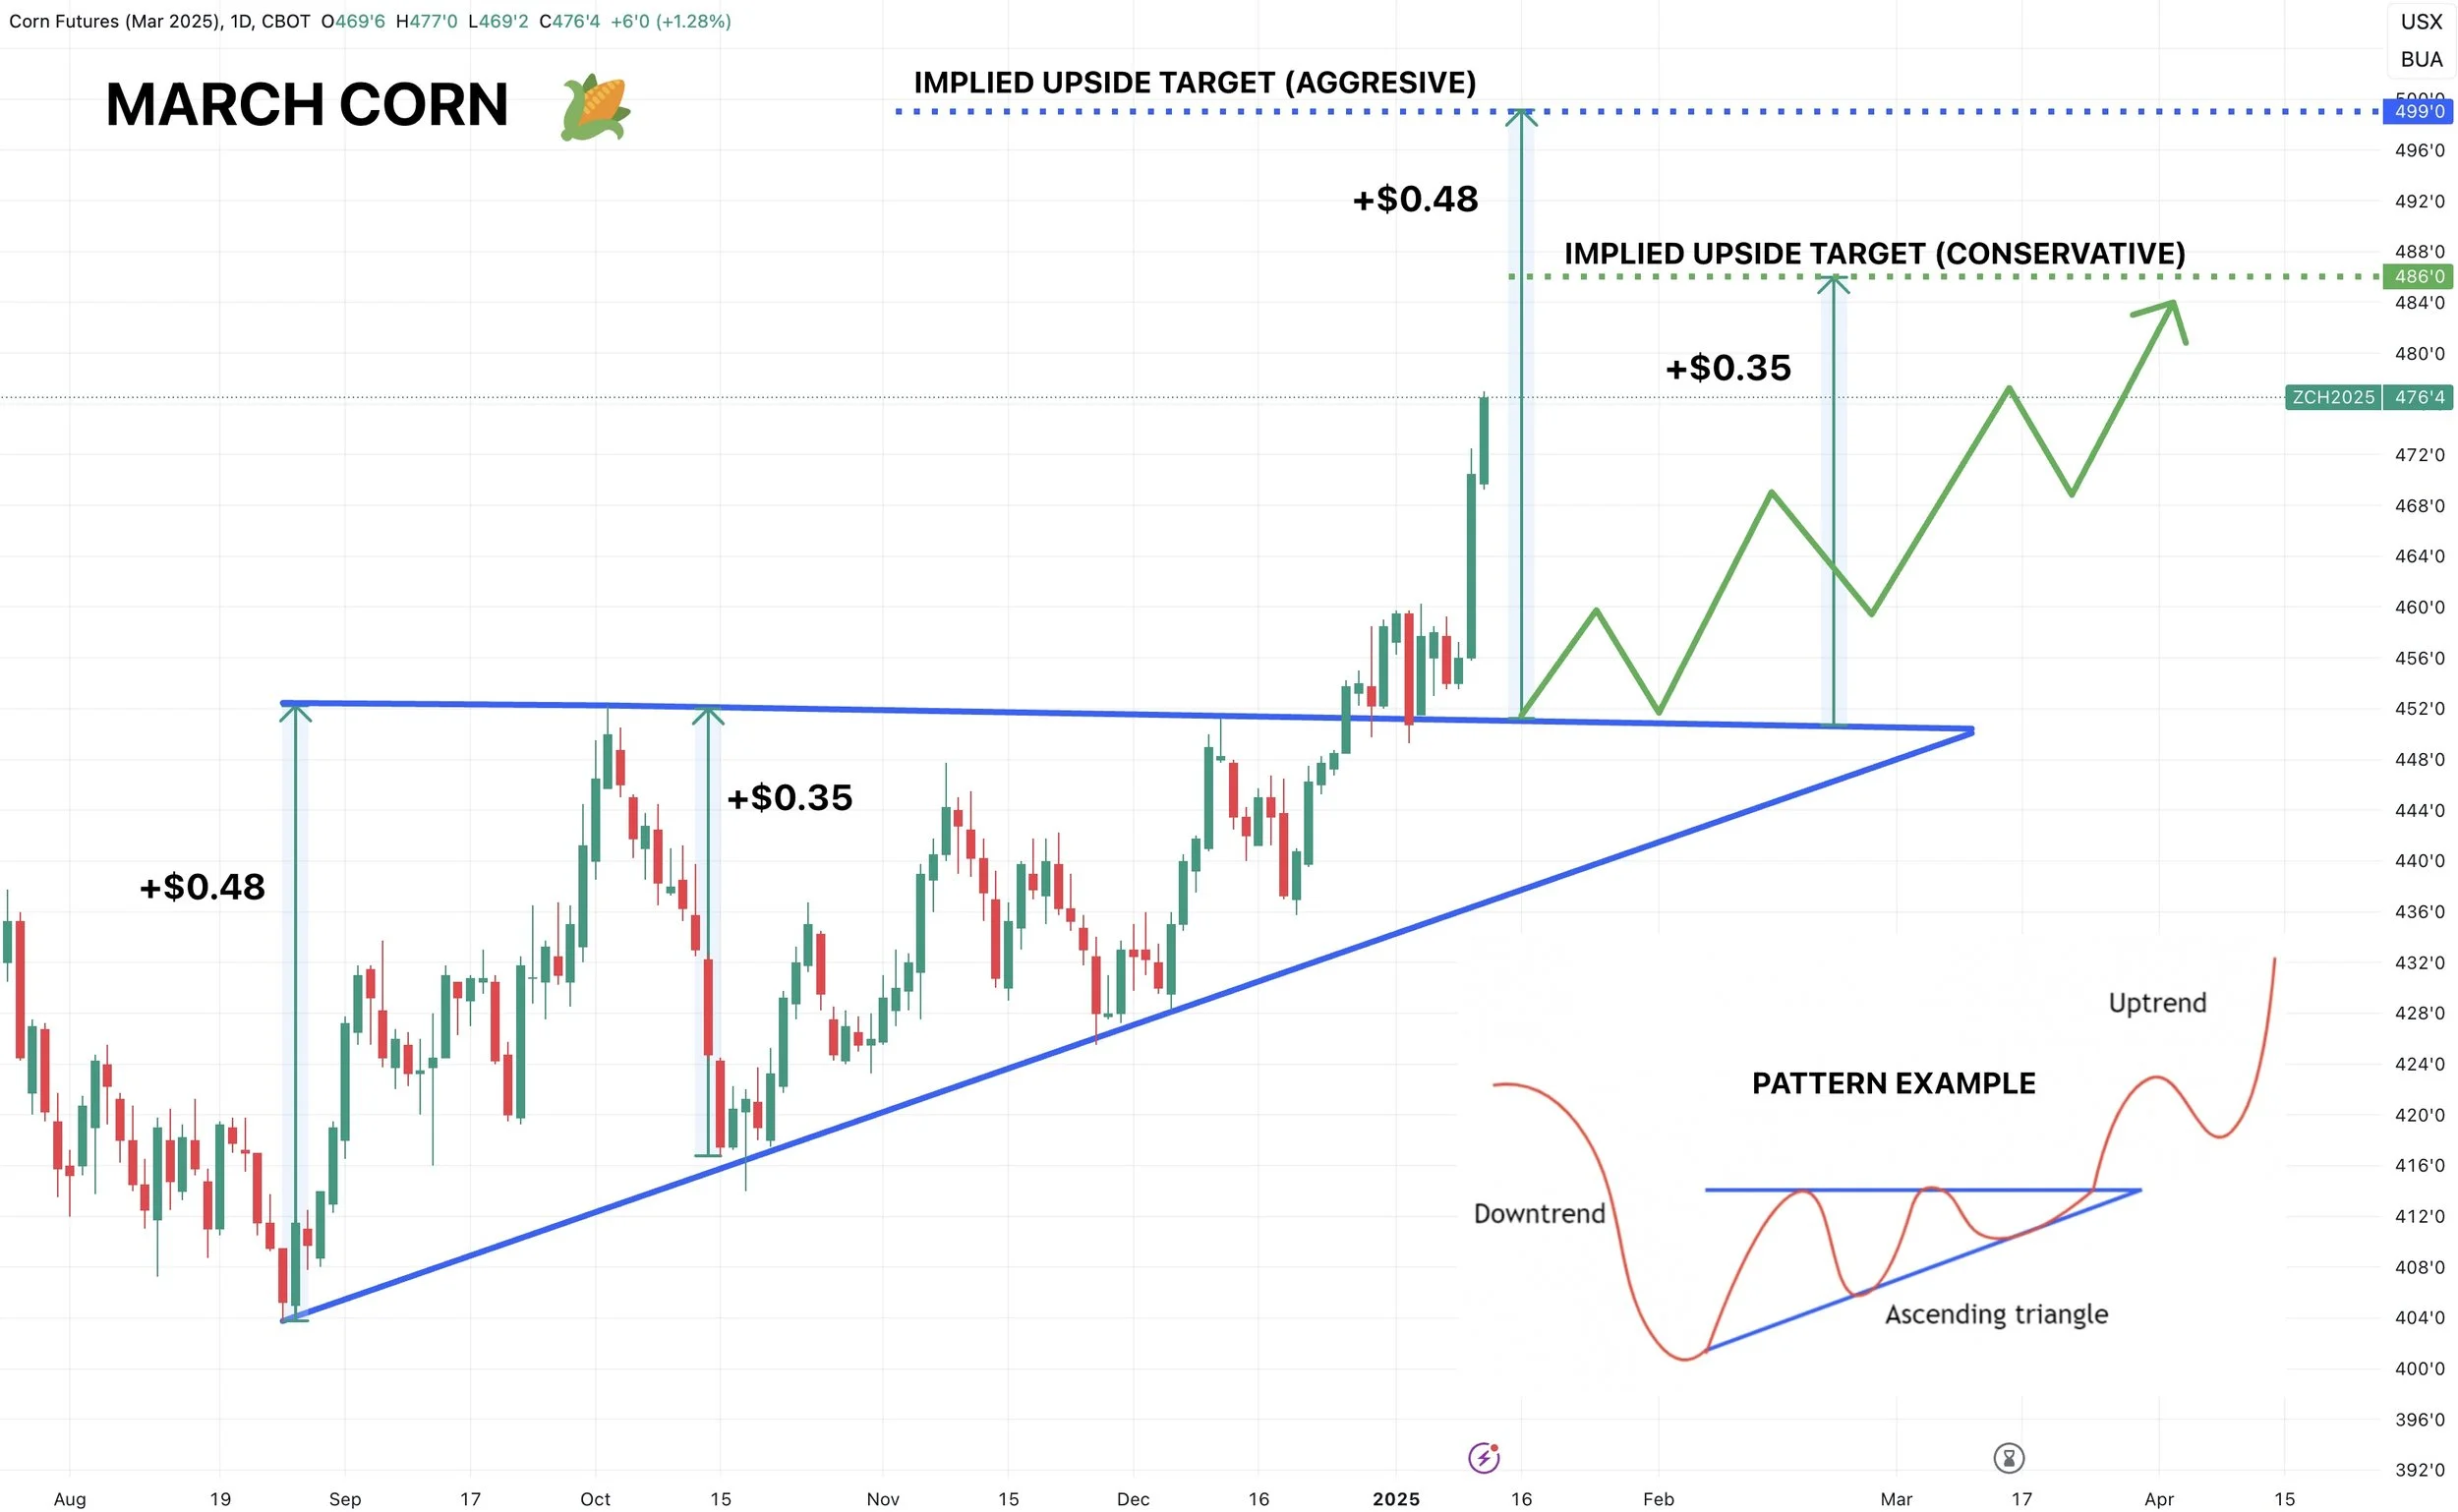
Looking at March corn, we hit my first target of $4.67
So if you are someone who has yet to take advantage of this rally at all then you might want to consider doing so even though we have not officially alerted a sell signal for old crop since $4.51.
That sell signal will likely come at my next target of $4.85 which is 8 1/2 cents away.
Still not a bad idea to price a small amount here or take some risk off the table now +74 cents off the August lows. Many would advise 5-10% depending on how sold you already are.
If you don’t want to make a cash sale you could substitute that sale and buy a put for downside protection instead. Then once you make the sale you lift the put is the typical hedging 101.
Keep in mind, not long ago everyone was worried about $3 corn.
I think it's likely we get a correction here shortly, as the markets don’t go up in straight lines. But bottom line, $4.85 is the next target
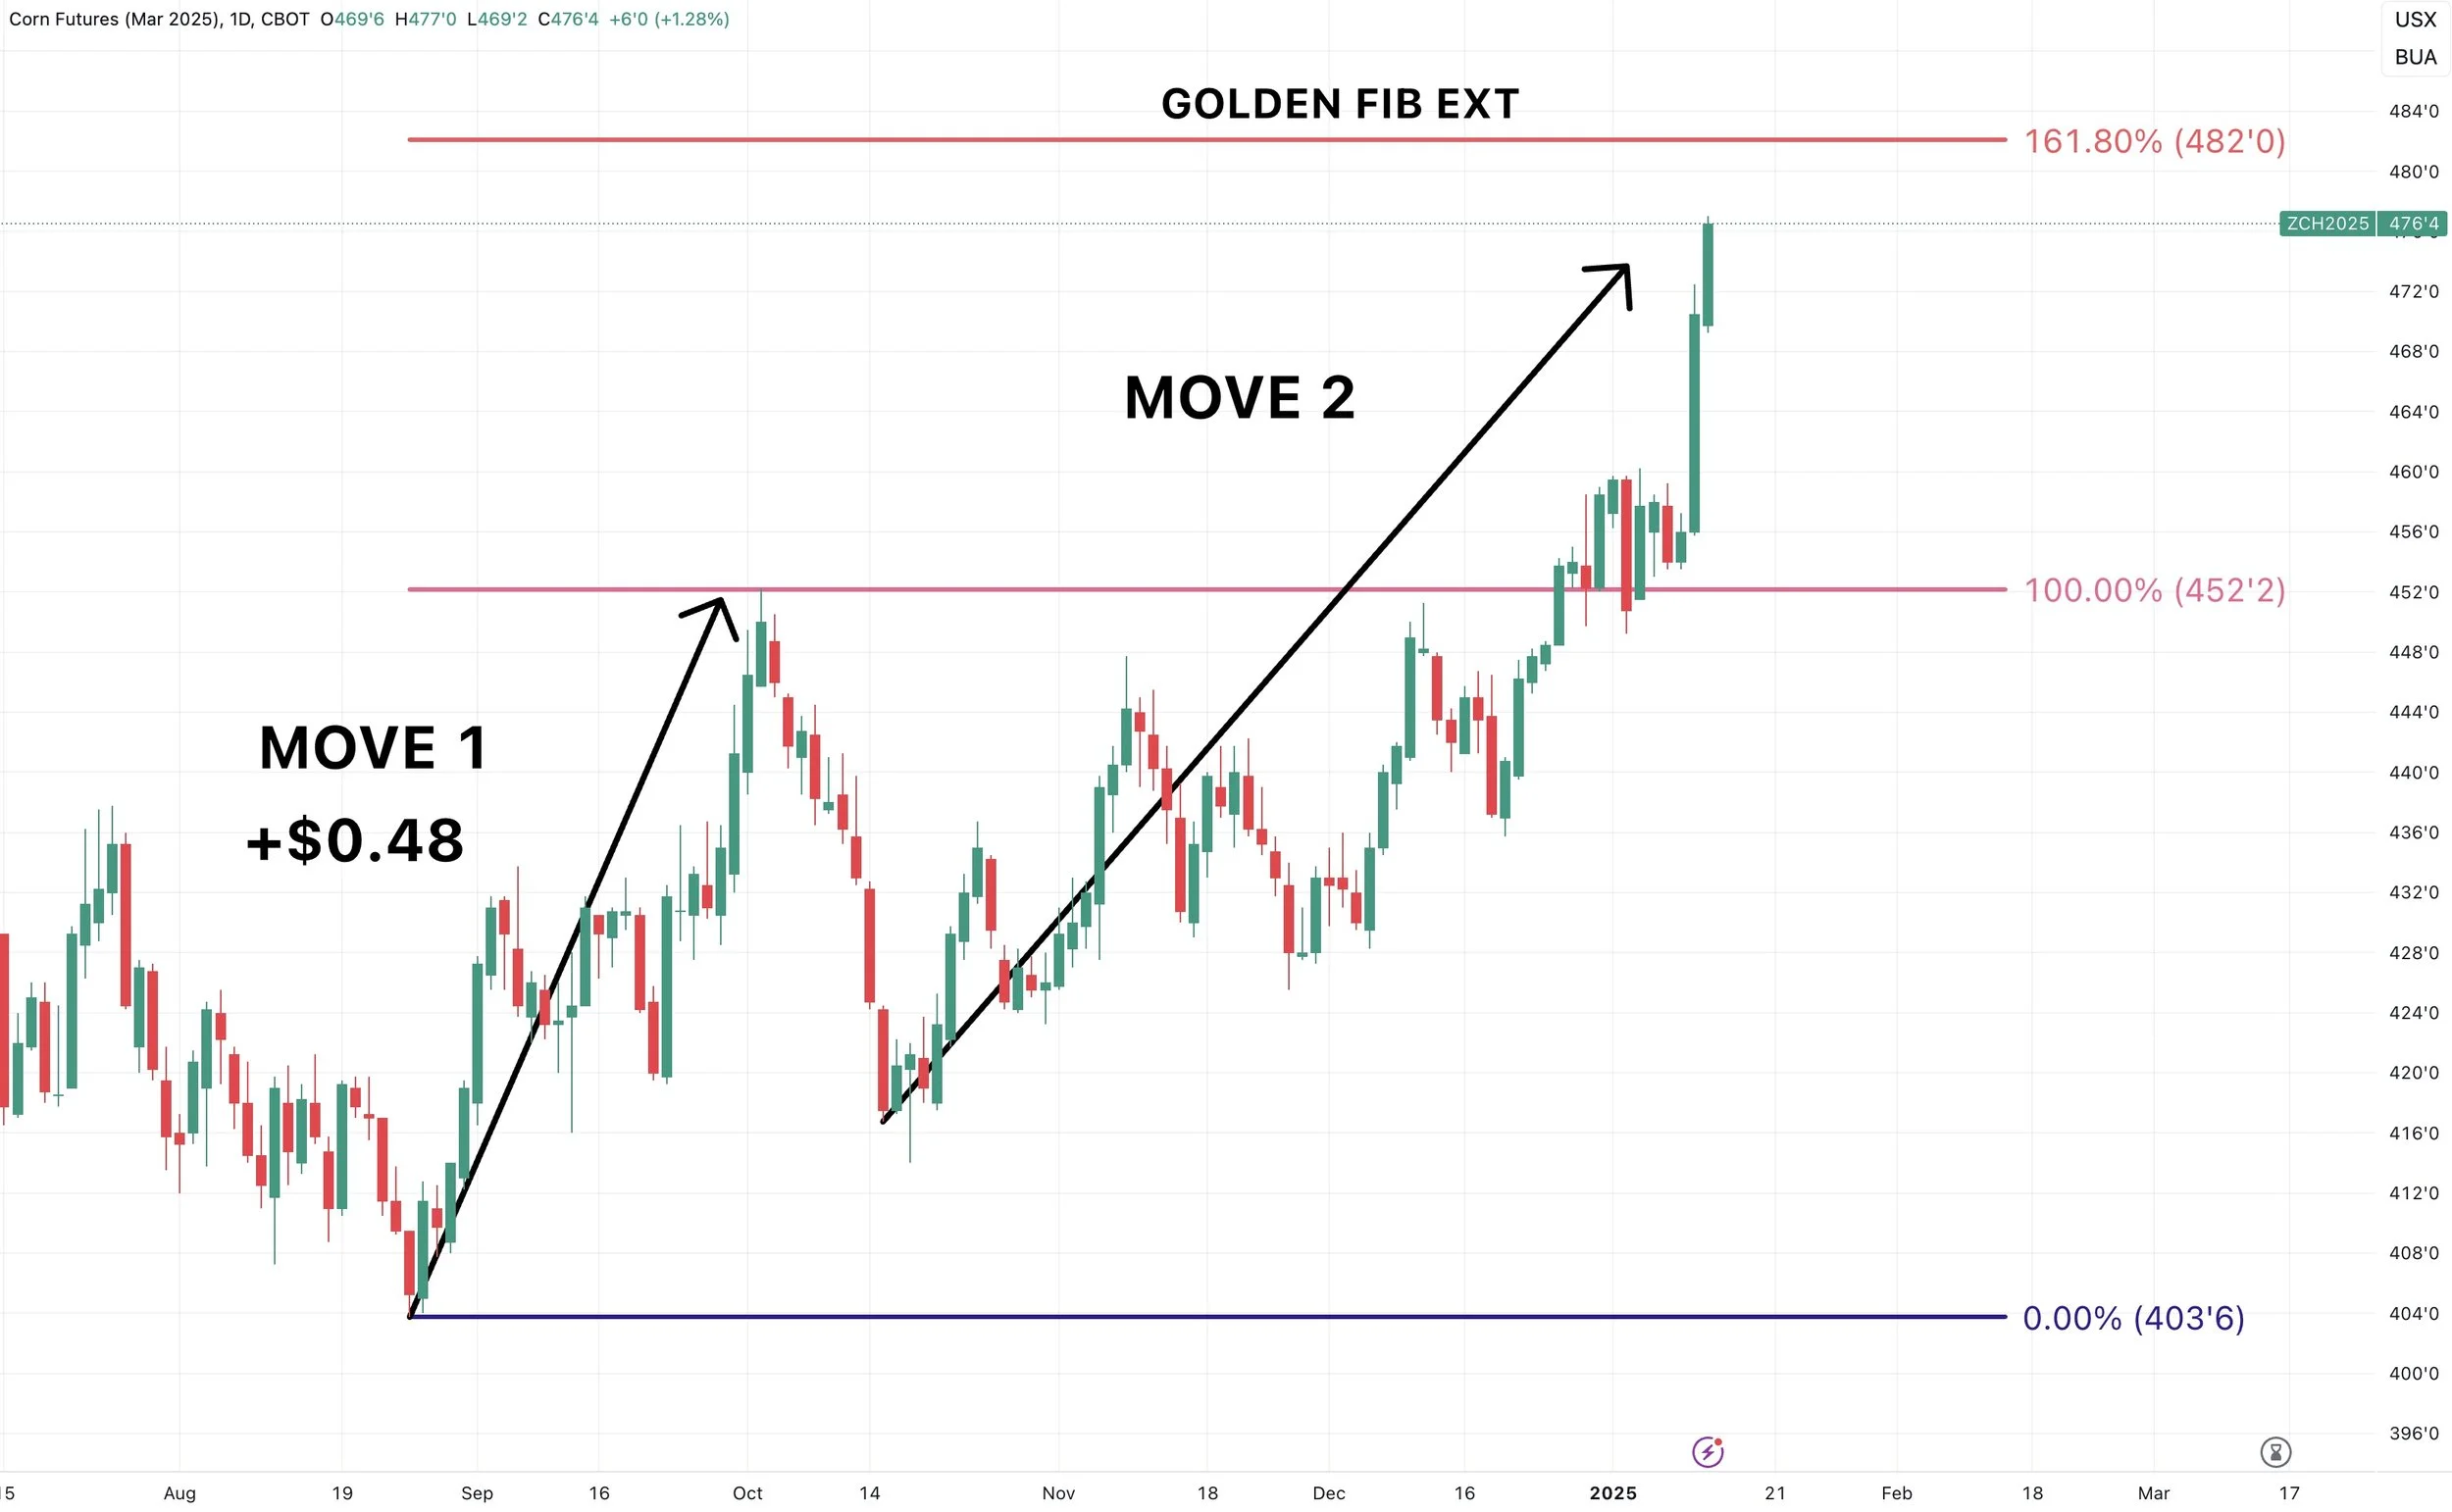
3 Reasons Why $4.85 is Next Target
Reason #1:
It is the implied move of this asending triangle.
I explained this further in Friday's video: Watch Here
Reason #2:
It is 78.6% of the May highs.
$4.67 was 61.8% of the May highs. Hence why that was the previous target.
Next fib up 78.6% is $4.85.
Reason #3
$4.82 is 161.8% of the August contract lows of $4.04 to the Oct 2nd highs of $4.52. That was our initial rally from the contract lows.
The math:
($4.52 - $4.04 = $0.48 cent rally)
(48 cents X 161.8% = 78 cents)
($4.04 + 78 cents = $4.82)
Often times 2nd moves will hit the golden fib extension which is 161.8% of the first move.
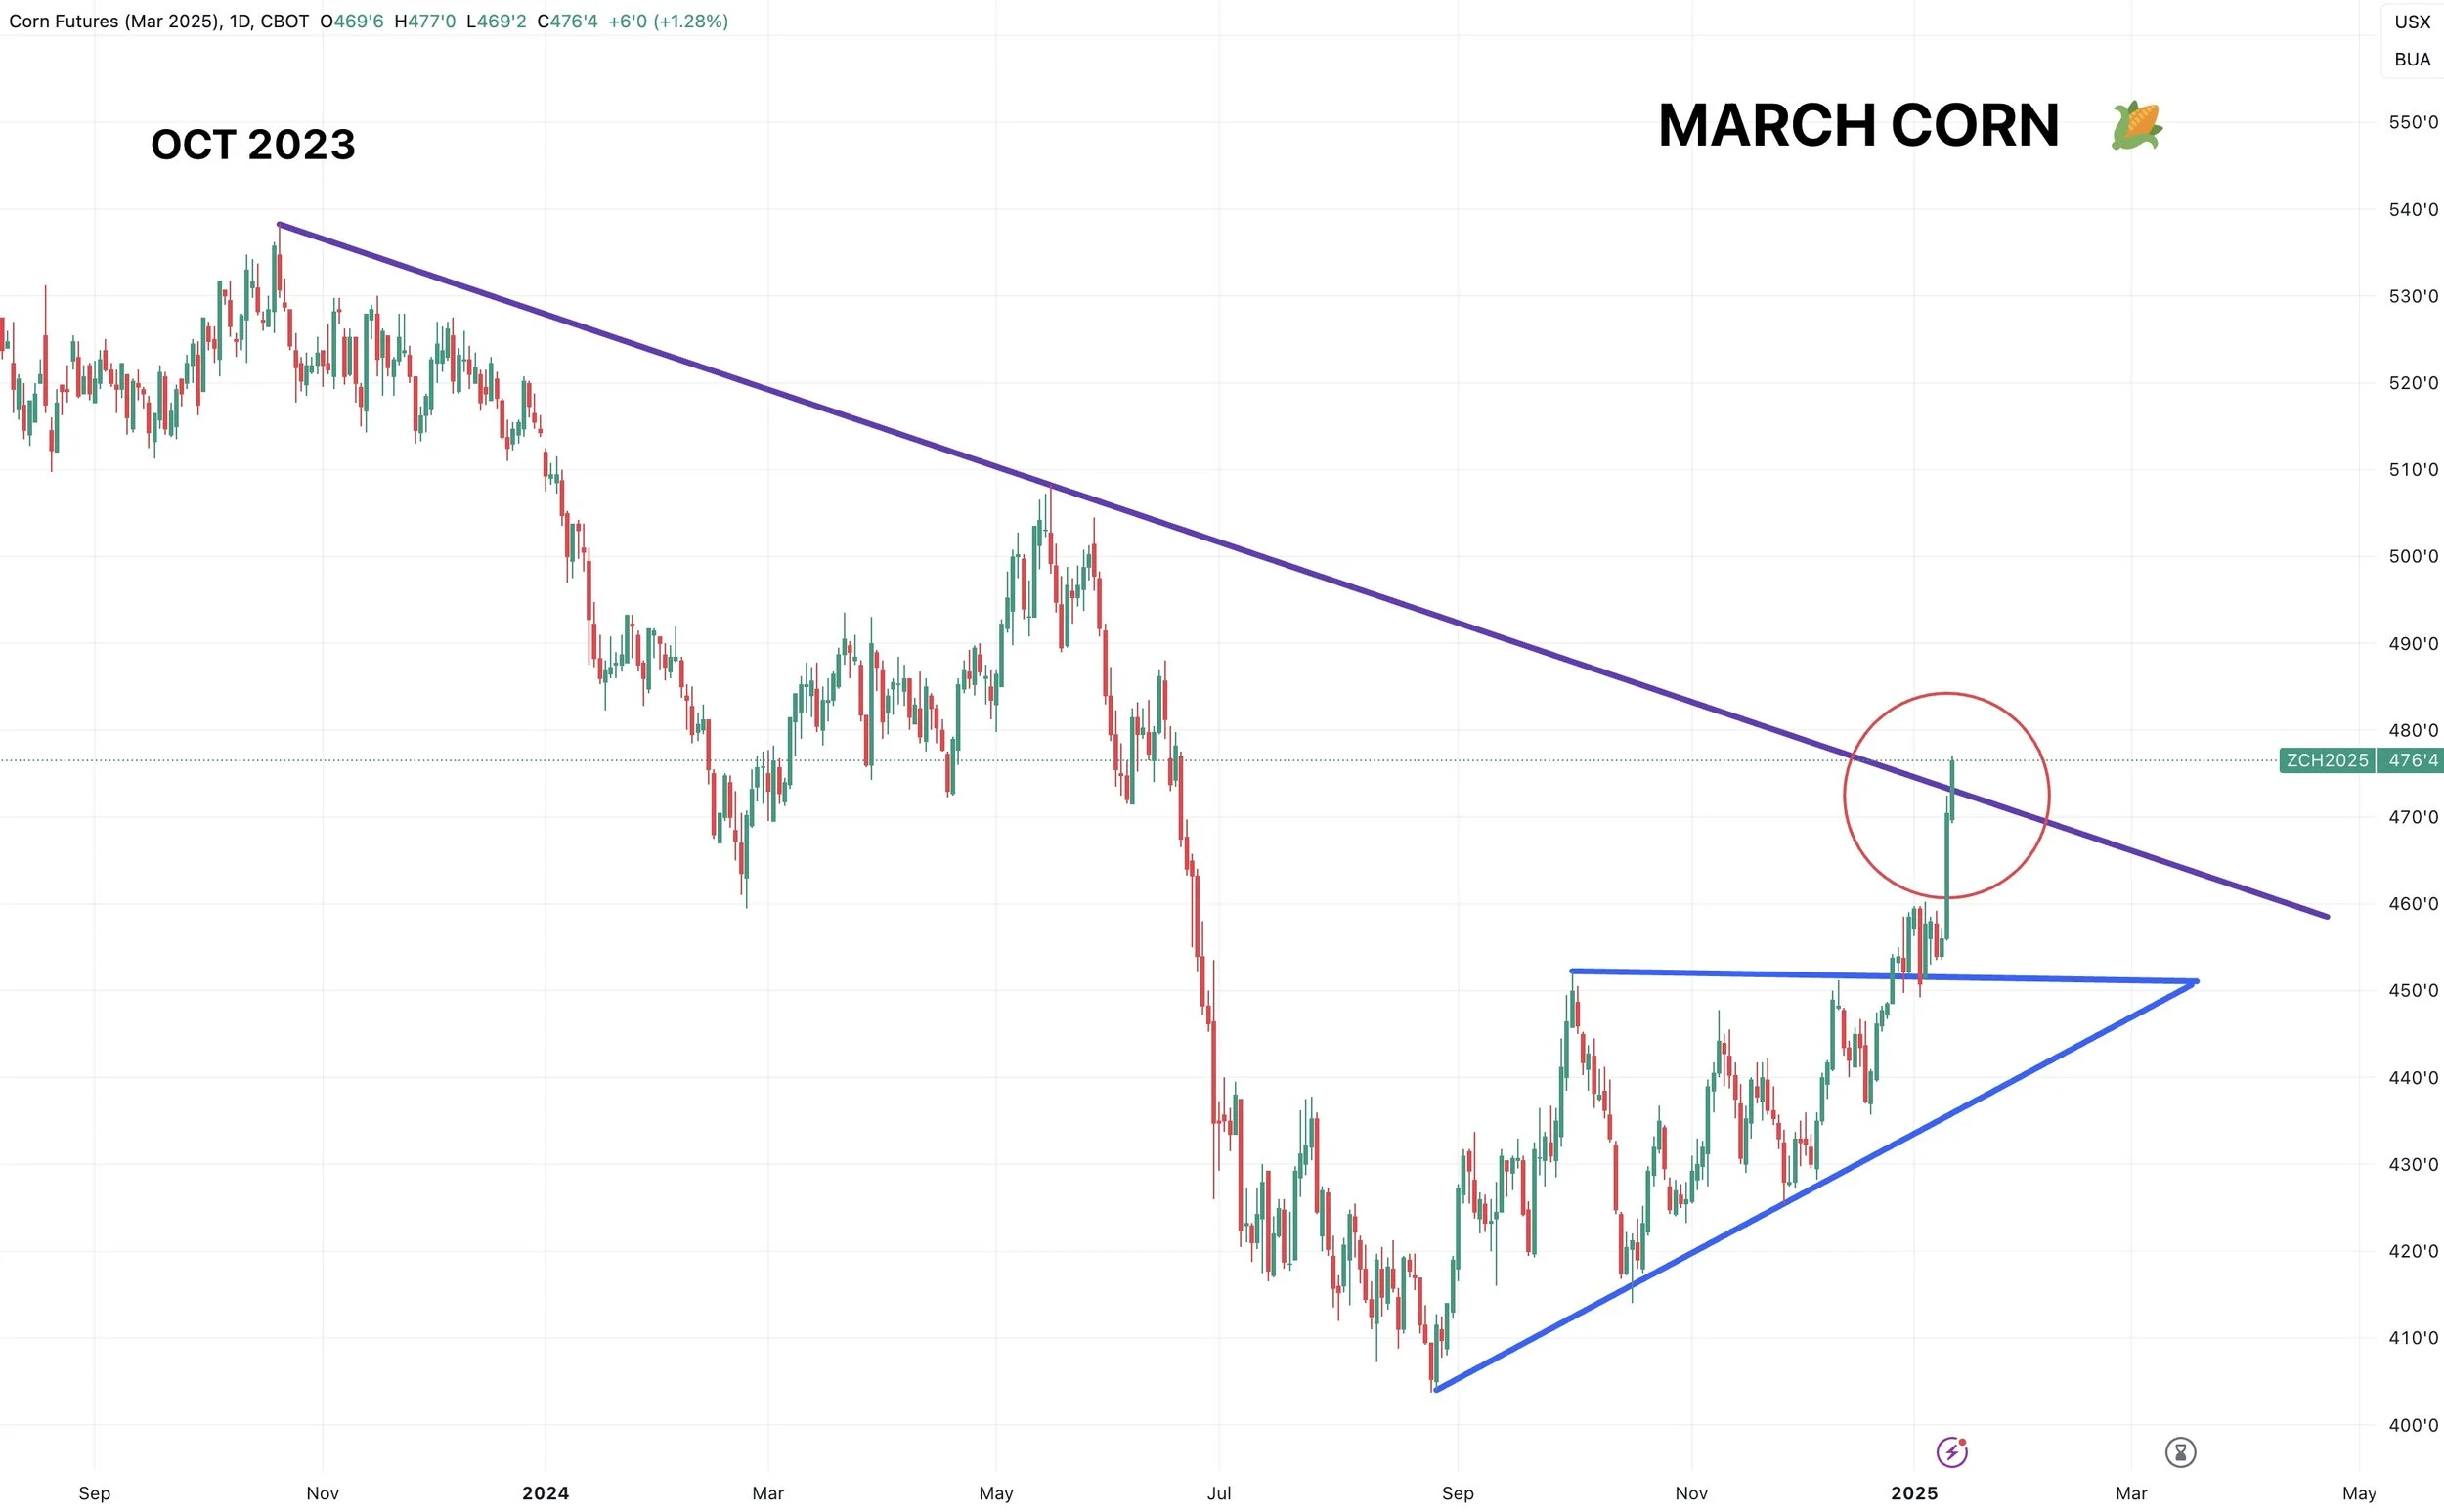
Broke Downtrend from 2023
Corn broke the downtrend we have held since October 2023.
Good win for the bulls and hopefully can bring more upside.
Soybeans
Fundamentally it's hard to justify soybeans rallying, but beans are now +$1.00 of the holiday lows a few weeks ago.
This happened even with the big Brazil crop starting harvest, China imports flattening, and US demand in question.
The report was bullish but doesn’t change the fundamentals enough to put soybeans into "bull market" territory or anything like that. Not to mention the global situation still remains bearish.
But we are seeing the funds covering some shorts and a technical breakout on the charts.
Soybeans broke that downward trend from May and also closed above the 100-day MA for the first time since May. This has the funds on the buy side here short term.
The funds do not seem too concerned about Trump and tariffs. He takes office in a week and the funds are basically sitting even right now, short just -28k contracts.
One potential risk has to be tariffs. If we get headlines about tariffs beans are gonna take it on the chin.
Argentina still looks dry for another week or so, which could give this rally a little more life here and provide a weather scare opportunity. But looking at the big picture, I don’t think it will make a big change on the global balance sheet. As the Brazil crop will be massive either way.
The report was bullish, but not bullish enough for me to say we are going to +$12. The US balance sheet isn’t necessarily bullish but it's not bearish enough for me to think sub $9 beans has a high chance of happening anymore.
Looking at the chart, we hit that short term target I had if you were someone who was looking for a spot to take risk off the table.
The next possible upside target is around $10.80 (the black downward trendline) If we crawl up there I would definitely recommend taking risk off the table.
As when Brazil's crop comes online here soon it will add pressure.
If you have to move beans within the next few months I would reward this rally +$1.00 off the lows.
The February puts are a cheap way to protect in case Trump is going to send this market right back down.
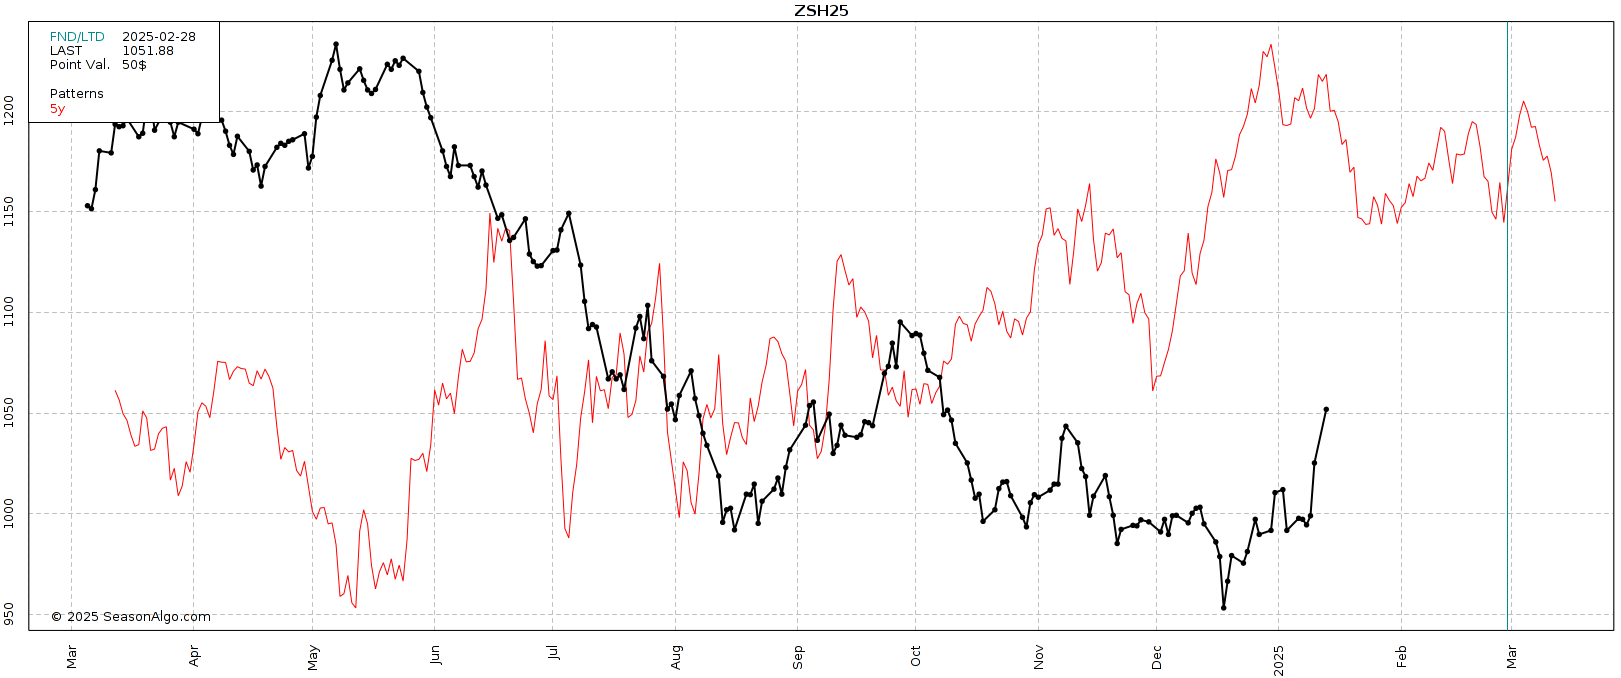
I am still being cautious of this seasonal.
Seasonally we rally into mid-Jan and then sell off hard starting really soon.
This seasonal usually coincides with the pressure the market can see from Brazil's crop.
But then again, we were suppose to rally seasonally in Dec and did not.
Wheat
Great day today but the wheat market was the disappointment of the report. Really nothing note worthy.
Overall it feels like the market simply wants to short wheat as a hedge while buying the other grains. But I don’t think that will last forever.
Bottom line, not much to update here.
Long term I still think we have a lot of potential for several reasons I've mentioned before.
We are closer to a bottom than we are a top and I have zero interest in selling any wheat below $6.
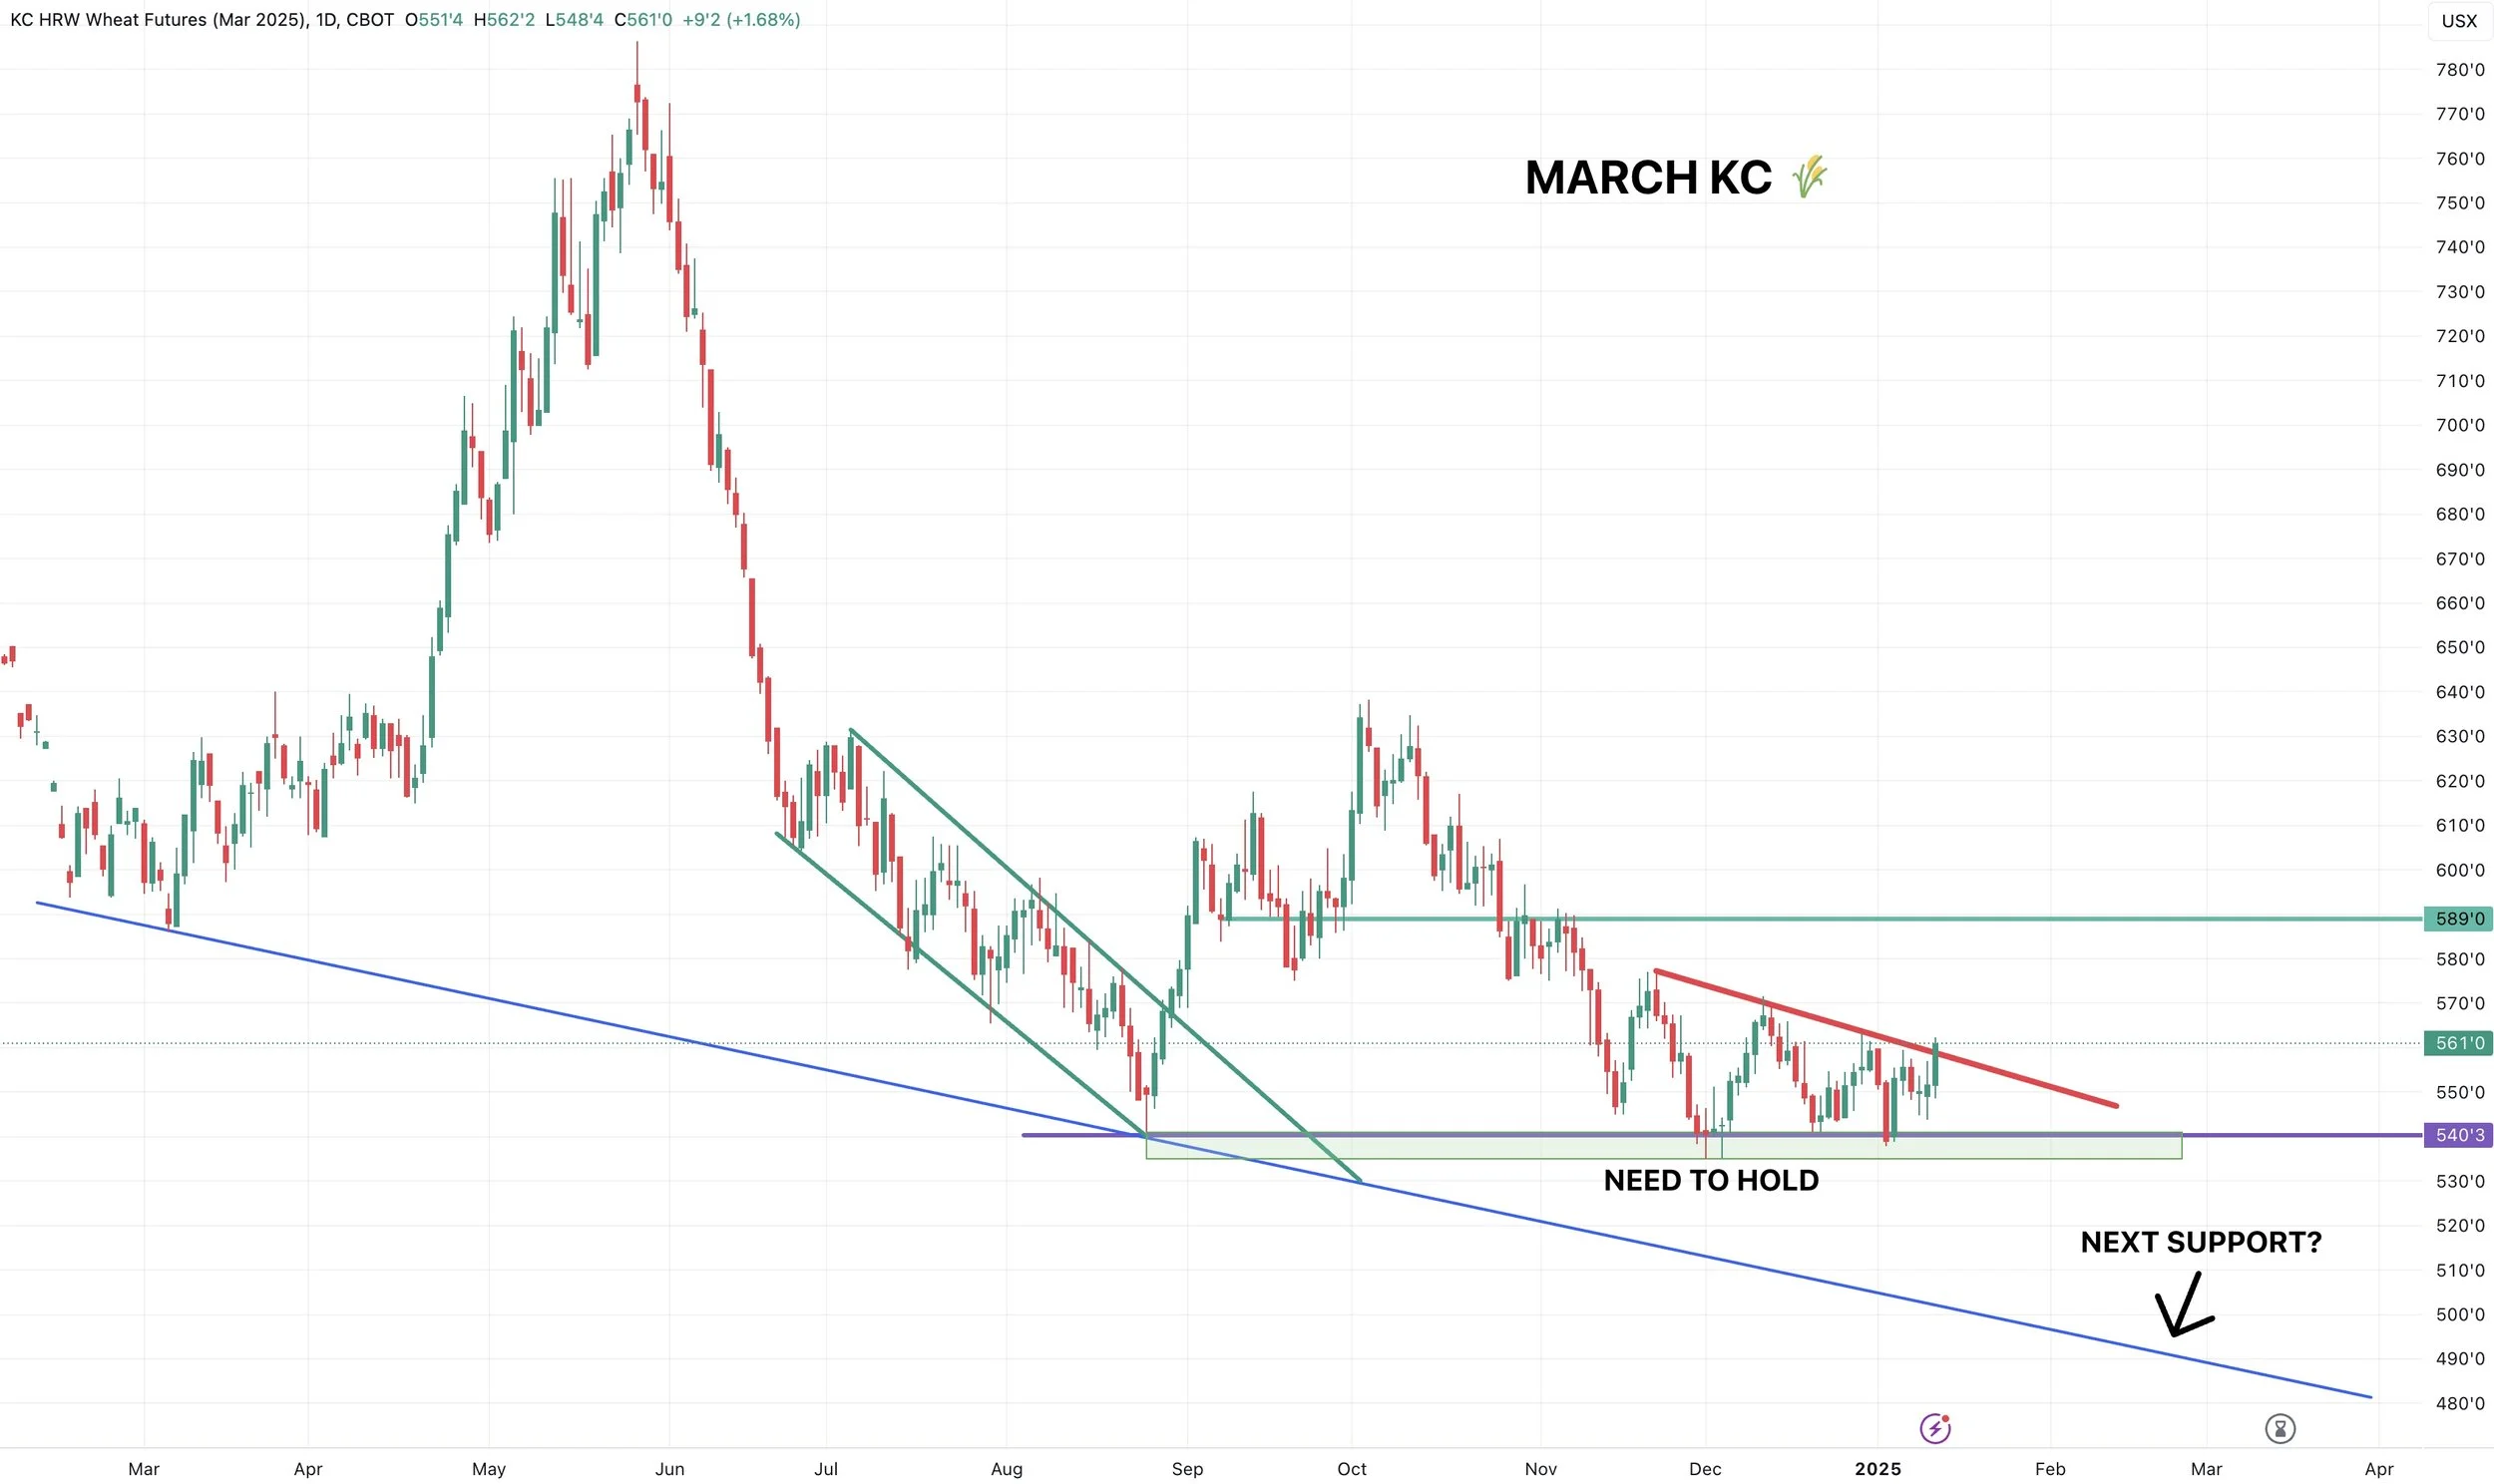
Looking at the March chart, we are potentially breaking out of this falling wedge and that downward trend from our May highs.
A bullish pattern. Need one more leg up to confirm a breakout.
KC also potentially breaking it's recent downtrend. (red line)
Past Sell or Protection Signals
We recently incorporated these. Here are our past signals.
Jan 2nd: 🐮
Cattle hedge alert at new all-time highs & target.
Dec 11th: 🌽
Corn sell signal at $4.51 200-day MA
CLICK HERE TO VIEW
Oct 2nd: 🌾
Wheat sell signal at $6.12 target
Sep 30th: 🌽
Corn protection signal at $4.23-26
Sep 27th: 🌱
Soybean sell & protection signal at $10.65
Sep 13th: 🌾
Wheat sell signal at $5.98
May 22nd: 🌾
Wheat sell signal when wheat traded +$7.00
Want to Talk?
Our phones are open 24/7 for you guys if you ever need anything or want to discuss your operation.
Hedge Account
Interested in a hedge account? Use the link below to set up an account or shoot Jeremey a call at (605)295-3100.
Check Out Past Updates
1/10/25
BULLISH USDA FOR CORN & BEANS
1/9/25
USDA OUT TOMORROW
1/8/25
2 DAYS UNTIL USDA. BE PREPARED
1/7/25
THE HISTORY OF THE JAN USDA & MORE
1/6/25
MAJOR USDA REPORT FRIDAY
1/2/25
LONG TERM CORN UPTREND? JANUARY DROP OFF IN BEANS? LONG TERM WHEAT FACTORS
1/2/25
CATTLE HEDGE ALERT
12/31/24
MASSIVE DAY FOR GRAINS. FLOORS? 2025 SALES? GAME PLAN? CHART BREAKDOWNS
12/30/24
GRAINS FADE EARLY HIGHS
12/27/24
STILL LONG TERM UPSIDE POTENTIAL, BUT TAKE ADVANTAGE OF 6 MONTH CORN HIGH
12/26/24
CORN ABOVE 200-DAY MA. ARGY DRY. BEANS +44 CENTS OFF LOWS
12/23/24
CORN & BEANS TALE OF 2 STORIES. BEANS REJECT OLD SUPPORT
12/20/24
PERFECT BOUNCE IN CORN. SIMPLE BEAN BACKTEST BEFORE LOWER?
12/19/24
THE SOYBEAN PROBLEM. NEW WHEAT LOWS. CORN UPTREND
12/18/24
BEANS BREAK SUPPORT & OPEN FLOOD GATES
12/17/24
SINK OR SWIM TIME FOR SOYBEANS
12/16/24
SOYBEANS & WHEAT FIGHTING LOWS. WILL CORN DEMAND CONTINUE
12/13/24
POST USDA COOL OFF
12/12/24
CORN CORRECTION. WHY WE ALERTED SELL SIGNAL YESTERDAY
12/11/24
USDA PRICED IN? FAIR VALUE OF CORN? BEAN BREAKOUT?
12/11/24
CORN SELL SIGNAL
12/10/24
USDA BREAKDOWN
12/9/24
USDA TOMORROW
12/6/24
CORN TRYING TO BREAKOUT. MAKING MARKETING DECISIONS
12/5/24
OPTIMISTIC BOUNCE IN GRAINS
12/4/24
WHEAT UNDERVALUED? MOST RISK IN BEANS. HAVE A GAME PLAN
12/3/24
BEANS HOLDING DESPITE LACK OF BULLISH STORY
12/2/24
TRUMP & BRAZIL HURDLES
11/27/24
CORN SPREADS, CRUCIAL SPOT FOR BEANS, SEASONALITY SAYS BUY
11/26/24
TARIFF TALK PRESSURE
11/25/24
HOLIDAY TRADE, SEASONALS, TARGETS & DOWNSIDE RISKS
11/22/24
CORN TARGETS & CHINA CONCERNS
11/21/24
BEANS NEAR LOWS. CORN NEAR HIGHS. 2025 SALE THOUGHTS
11/19/24
WHAT’S NEXT FOR GRAINS
11/18/24
WHEAT LEADS THE GRAINS REBOUND
11/15/24
BIG BOUNCE, FUNDS LONG CORN, DOLLAR & DEMAND
11/14/24
3RD DAY OF GRAINS FALL OUT
11/13/24
GRAINS CONTINUE WEAKNESS & DOLLAR CONTINUES RALLY
11/12/24
ANOTHER POOR PERFORMANCE IN GRAINS
11/11/24
POOR ACTION IN GRAINS POST FRIENDLY USDA
11/8/24
USDA FRIENDLY BUT GRAINS WELL OFF HIGHS
11/6/24
GRAINS STORM BACK POST TRADE WAR FEAR
11/5/24
ALL ABOUT THE ELECTION & VIDEO CHART UDPATE
11/4/24
ELECTION TOMORROW
11/1/24
GRAINS WAITING ON NEWS
10/31/24
ELECTION & USDA NEXT WEEK
10/30/24
SEASONALS, CORN DEMAND, BRAZIL REAL & MORE
10/29/24
WHAT’S NEXT AFTER HARVEST?
10/25/24
POOR PRICE ACTION & SPREADS WEAKEN
10/24/24
BIG BUYERS WANT CORN?
10/23/24
6TH STRAIGHT DAY OF CORN SALES
10/22/24
STRONG DEMAND & TECHNICAL BUYING FOR GRAINS
10/21/24
SPREADS, BASIS CONTRACTS, STRONG CORN, BIG SALES
10/18/24
BEANS & WHEAT HAMMERED
10/17/24
OPTIMISTIC PRICE ACTION IN GRAINS
10/16/24
BEANS CONTINUE DOWNFALL. CORN & WHEAT FIND SUPPORT
10/15/24
MORE PAIN FOR GRAINS
10/14/24
GRAINS SMACKED. BEANS BREAK $10.00
10/10/24
USDA TOMORROW
10/9/24
MARKETING STYLES, USDA RISK, & FEED NEEDS
10/8/24
BEANS FALL APART
10/7/24
FLOORS, RISKS, & POTENTIAL UPSIDE
10/4/24
HEDGE PRESSURE
10/3/24
GRAINS TAKE A STEP BACK
10/2/24
CORN & WHEAT CONTINUE RUN
10/1/24
CORN & WHEAT POST MULTI-MONTH HIGHS
9/30/24


