CORN BREAKS $5. IS WHEAT NEXT? - SOYBEAN RECCOMENDATION
AUDIO COMMENTARY
Corn breaks $5 for first time since August 1st
Can we see $5.40 to $5.50?
$13 resistance turns to support for beans
Beans had highest close since September 20th
All 3 of the markets have erased our September 30th losses from poor stocks report
We are opening door to potential higher prices
Sunflower market situation
Soybean recommendation is below this audio
Listen to today’s audio below
SOYBEAN RECCOMENDATION
For some of you, it might make sense to reward this +67 cent rally from just last week.
Bean recommendation for those that need to sell in the next couple of weeks
If you are in an area and you believe basis will firm, look at buying the $13.10 puts.
If you are in an area where you believe basis will weaken, sell the cash and replace with a Nov. $13.20 call option.
We want to take advantage of this rally, yet keep upside open should we see more technical buying come in with the recent break out we had.
This recommendation is based off the opinion of your local basis. Please make sure to give Jeremey a call at (605)295-3100 to discuss and make sure this recommendation fits your operation.
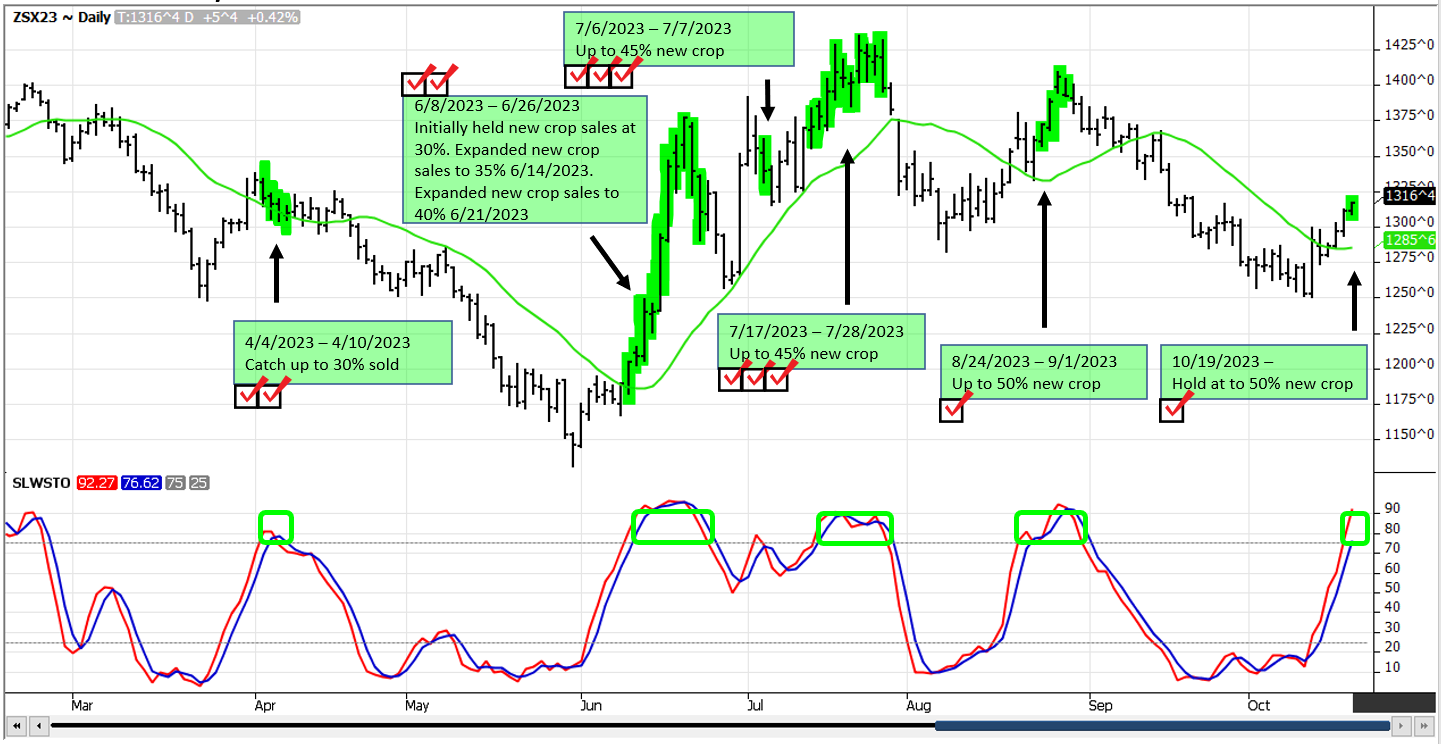
We noticed Roach Ag had a sell signal today. They recommended that producers be 50% sold of their 2023 soybean production
This is why Roach Ag had a sell signal today. They said:
"We use the bottom part of our chart as a digital thermometer. It tells us when the markets are hot or cold. When the red and blue lines are over 75, it is a hot market and triggers a Sell Signal. When the red and blue lines are under 25, it is a cold market and triggers a Buy Signal.
If the red and blue lines are in between 25 and 75, we typically will say to wait for the next Sell Signal or Buy Signal.
The green rectangles on the bottom part of the chart show when the red and blue lines are in a Sell Signal.
The green highlighted daily prices on the top of the chart show the price range on each day of our Sell Signals.
The Sell Signal Indicator (blue and red lines on bottom of chart) we use to generate signals are based on the delivery month with the largest daily volume of trade which is normally the lead month."
CHARTS
Corn 🌽
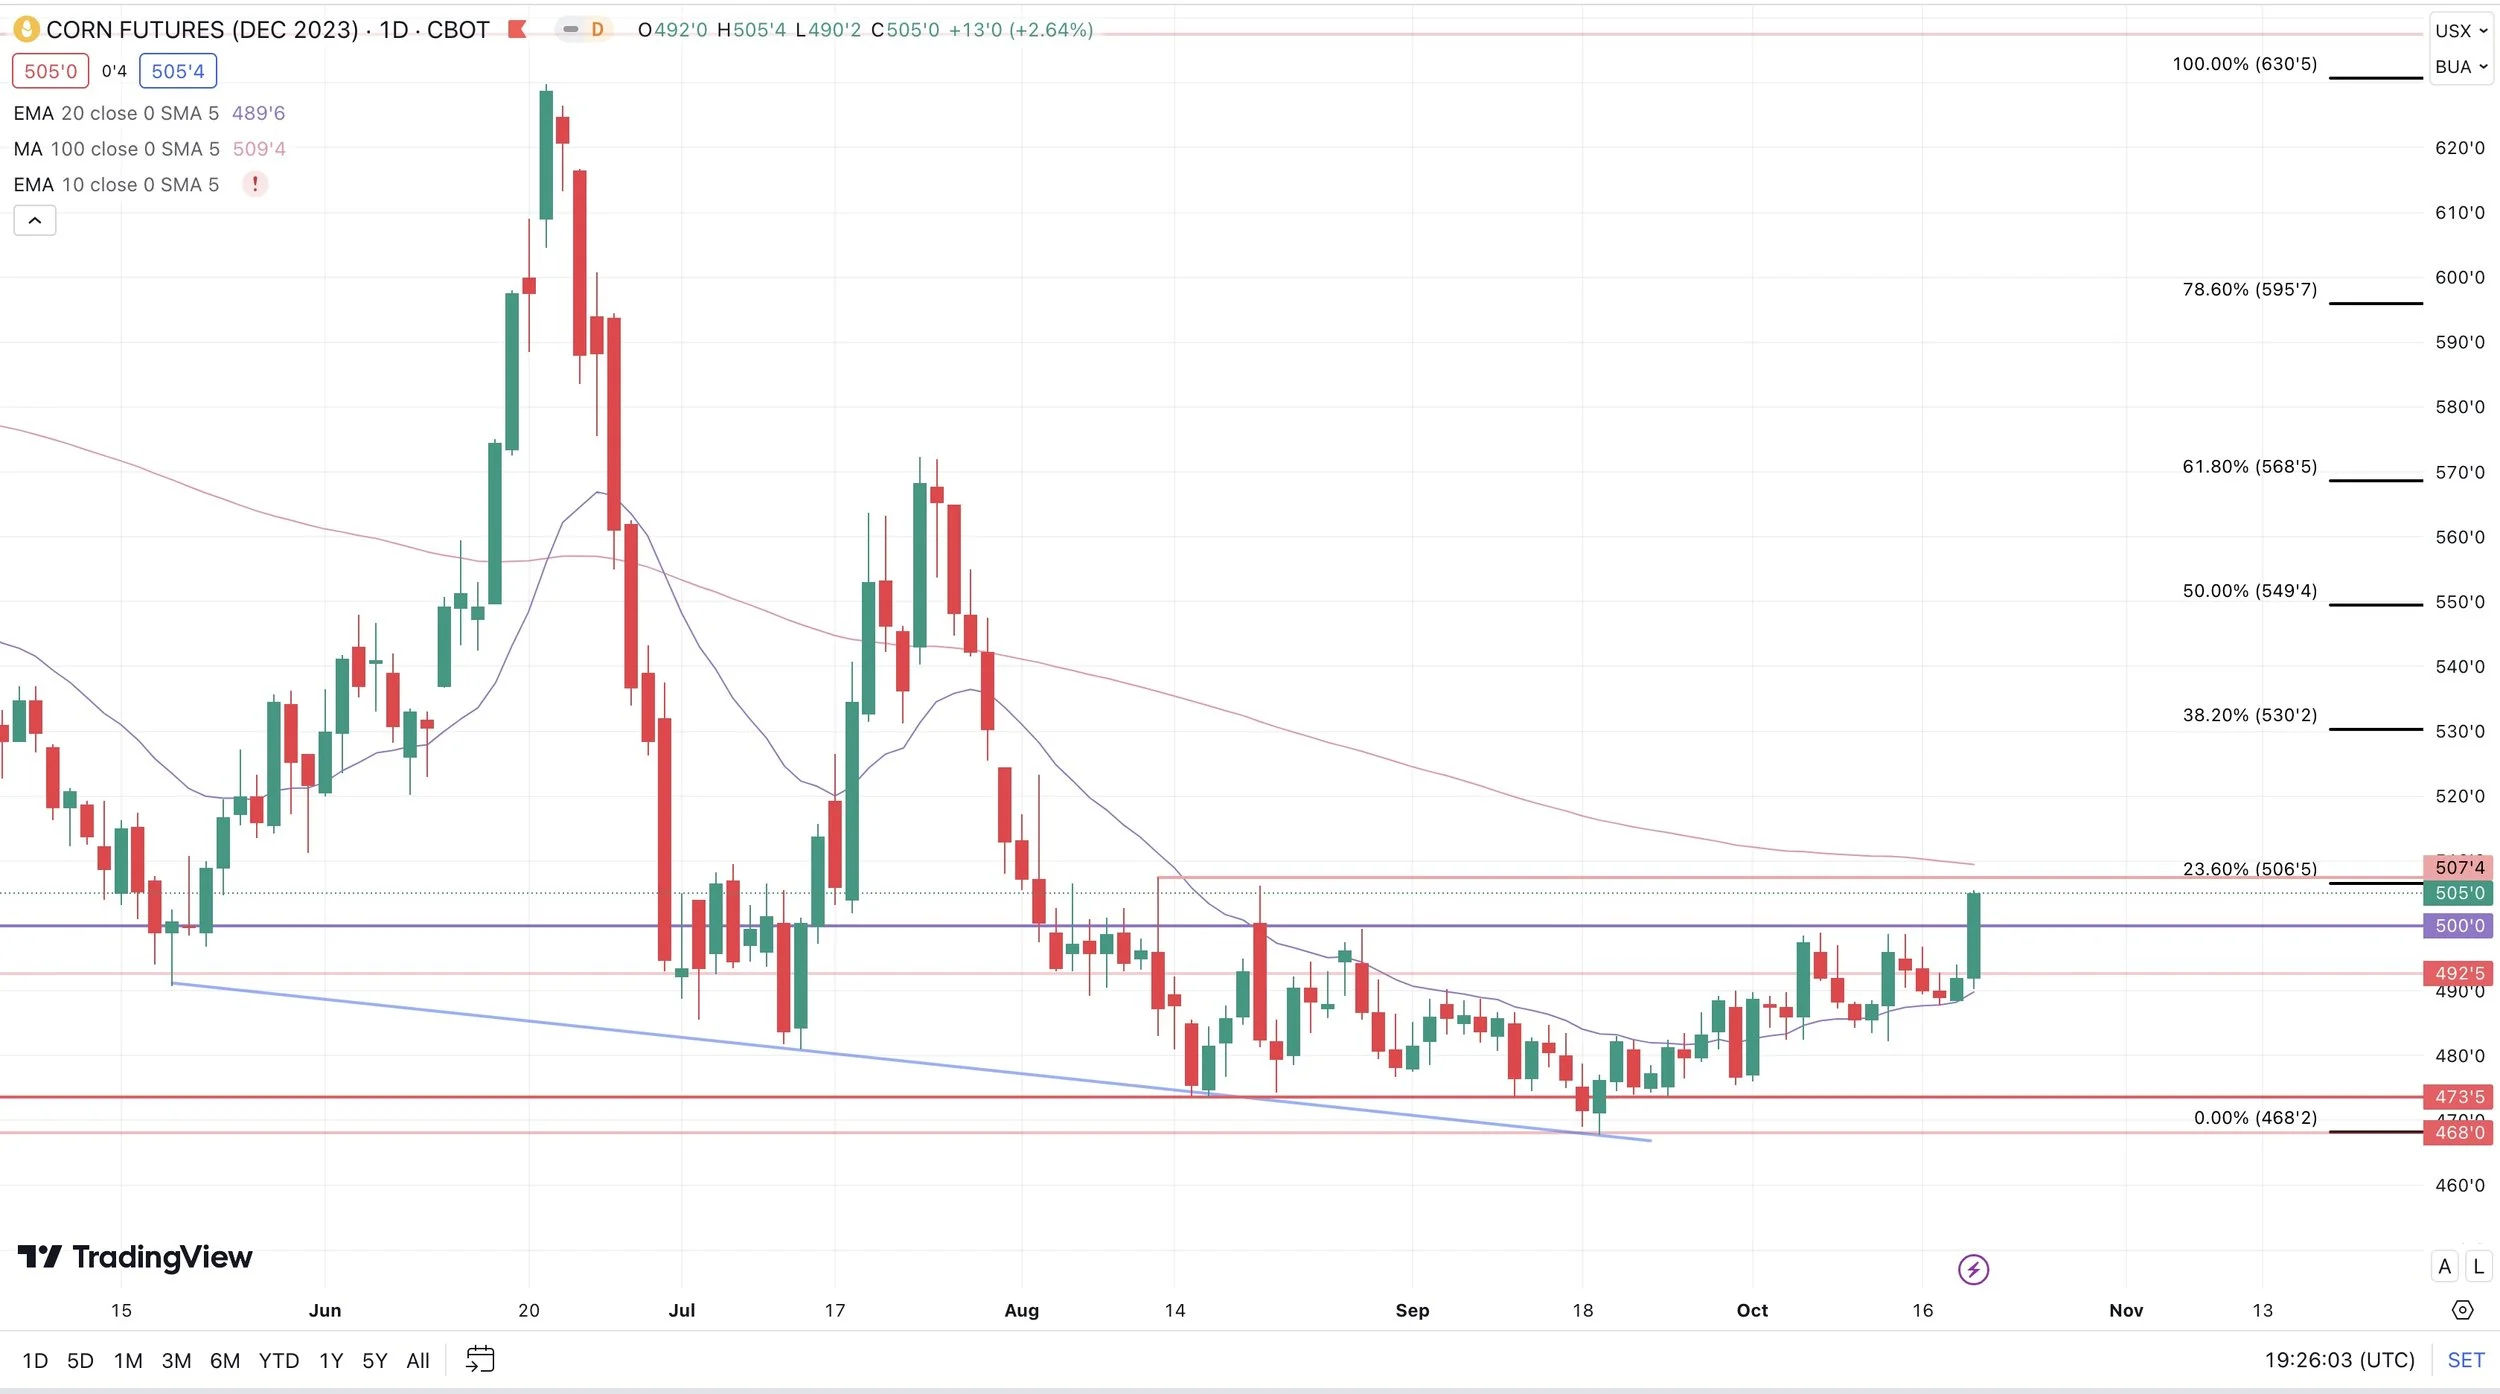
Corn got that close above $5 we had been talking about. Closing at $5.05. Opens the door to higher prices. Next targets are $5.09 (our 100-day moving average) then our retracement levels of $5.30 and $5.49.
Again, I’m not expecting a massive rally out of nowhere with our 2 billion carryout. But I do expect a slow grind to the upside like we have seen over the course of the past month.
Beans 🌱
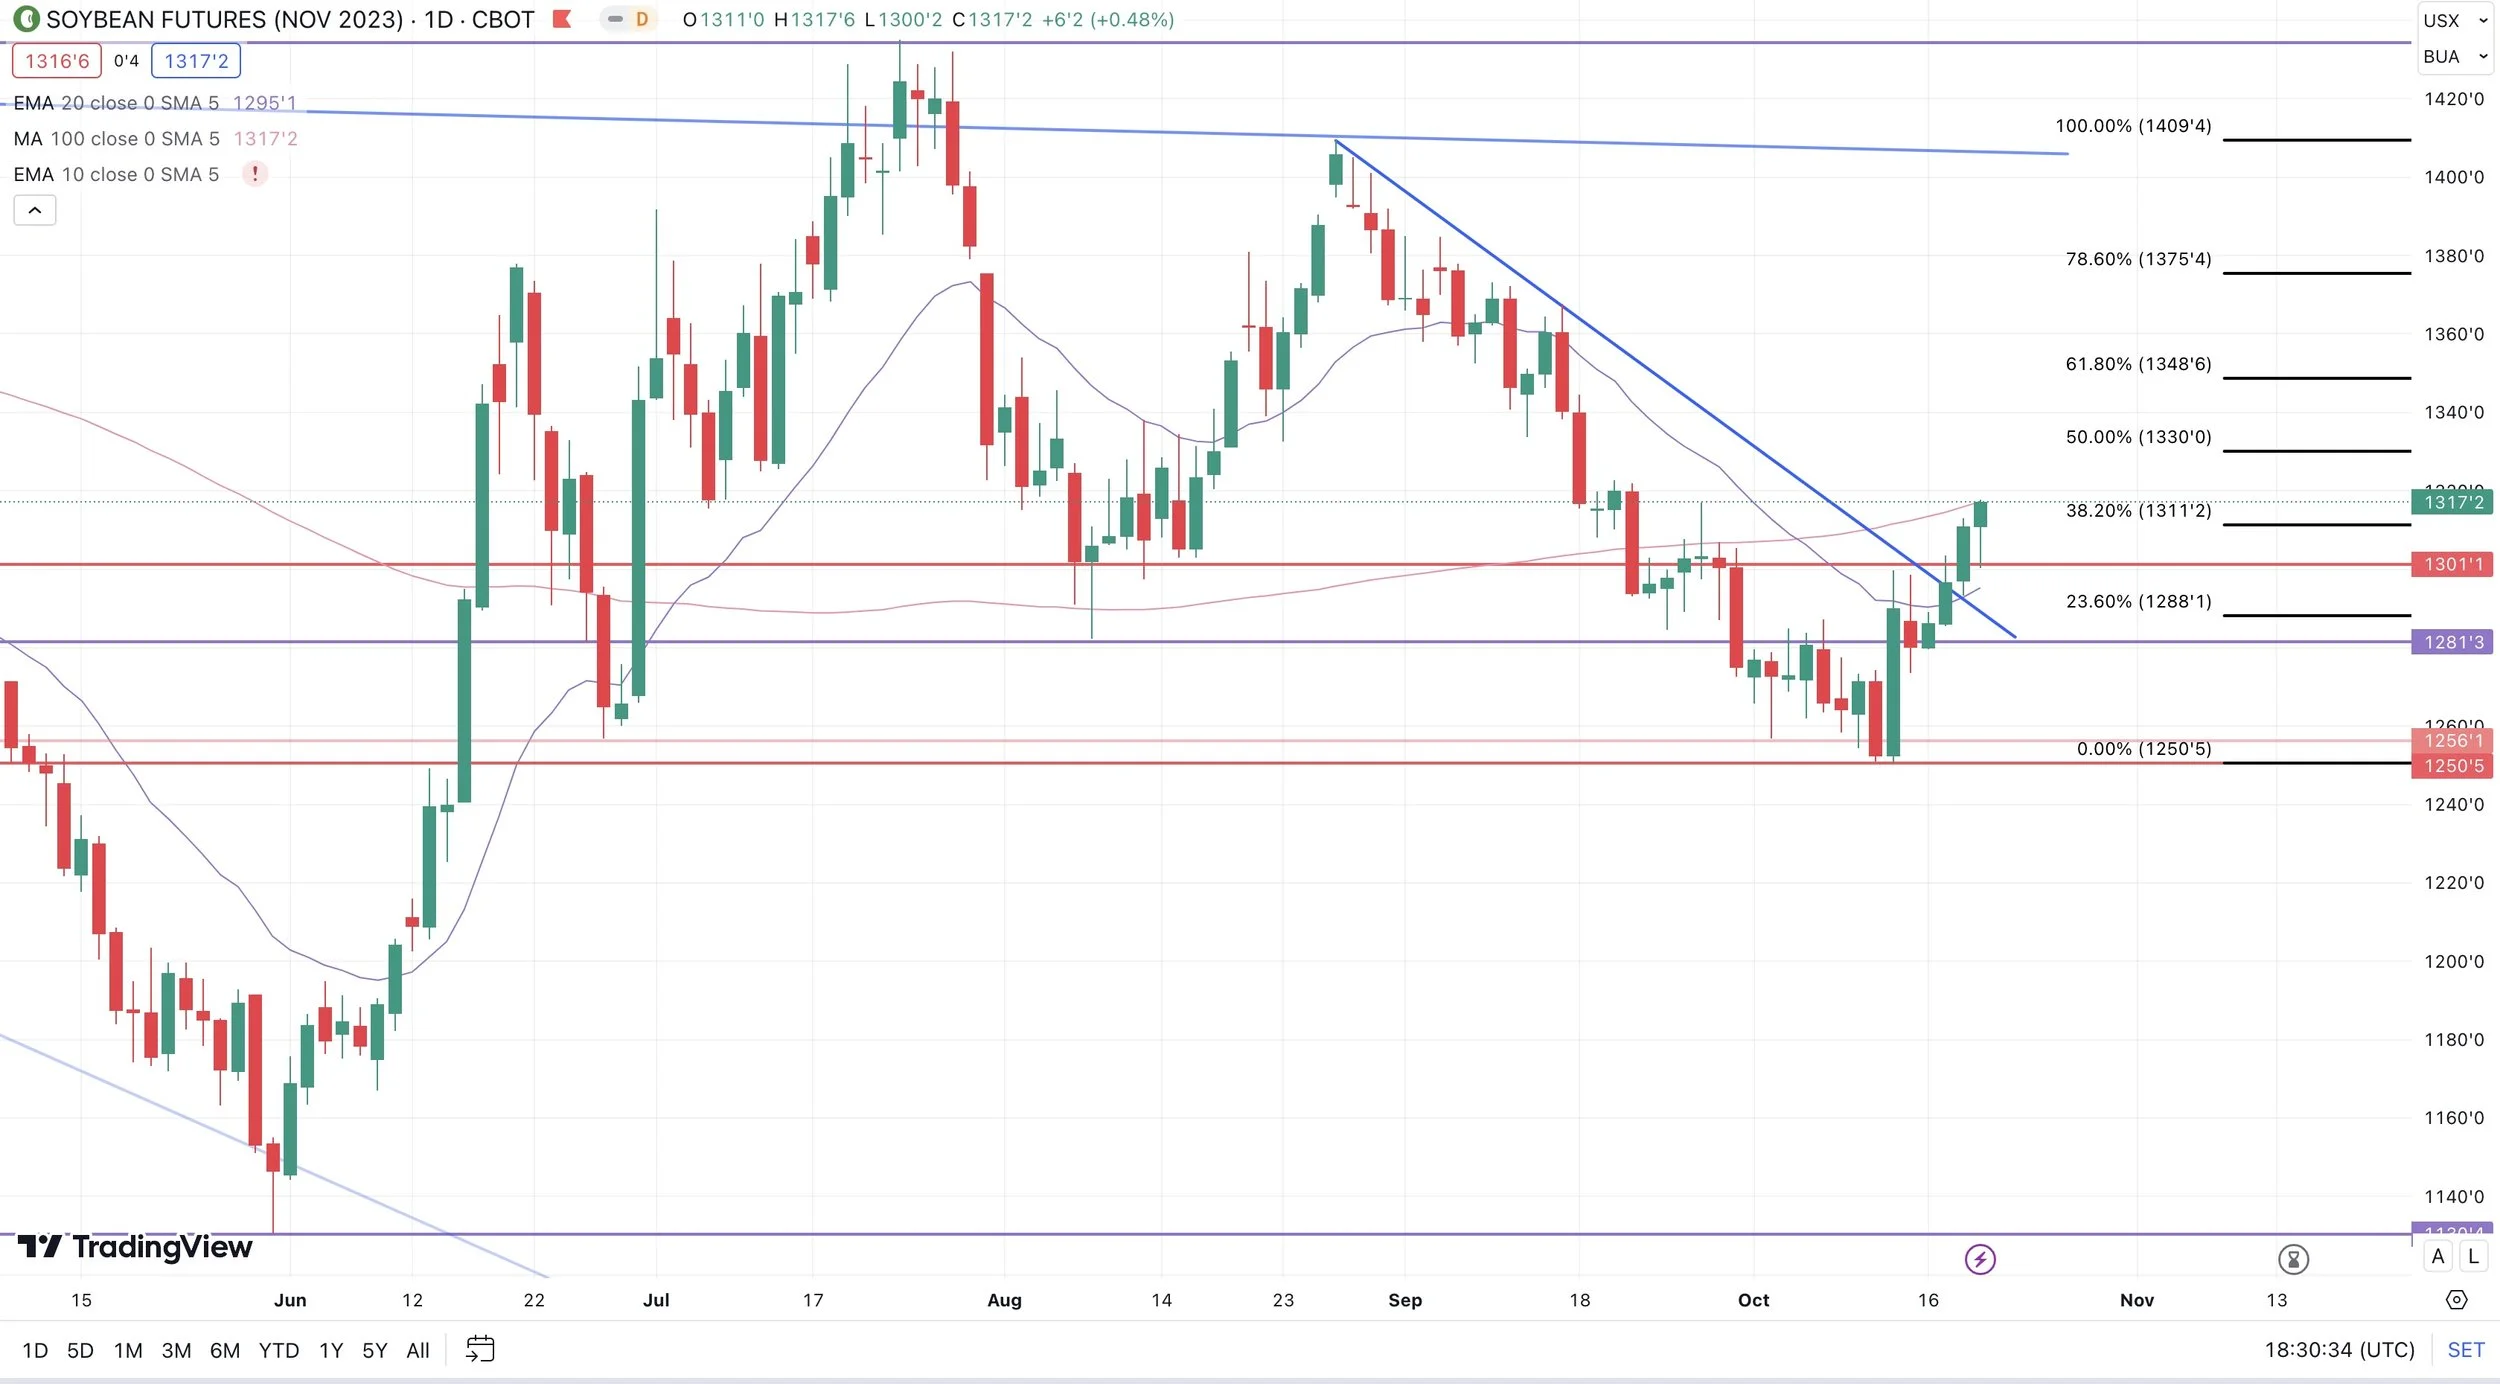
Yesterday beans closed above $13 for the first time since Sep. 28th. Today we traded -11 cents lower and bounced right off that $13 which is now support, before closing higher at $13.15 1/2.
We officially broke that downtrend.
Now +67 cents off those lows.
Next target is our 50% retracement of $13.30, then $13.49 and $13.60.
The soybean chart looks great. Could see this rally take a breather, but I still see more upside.
Chicago 🌾
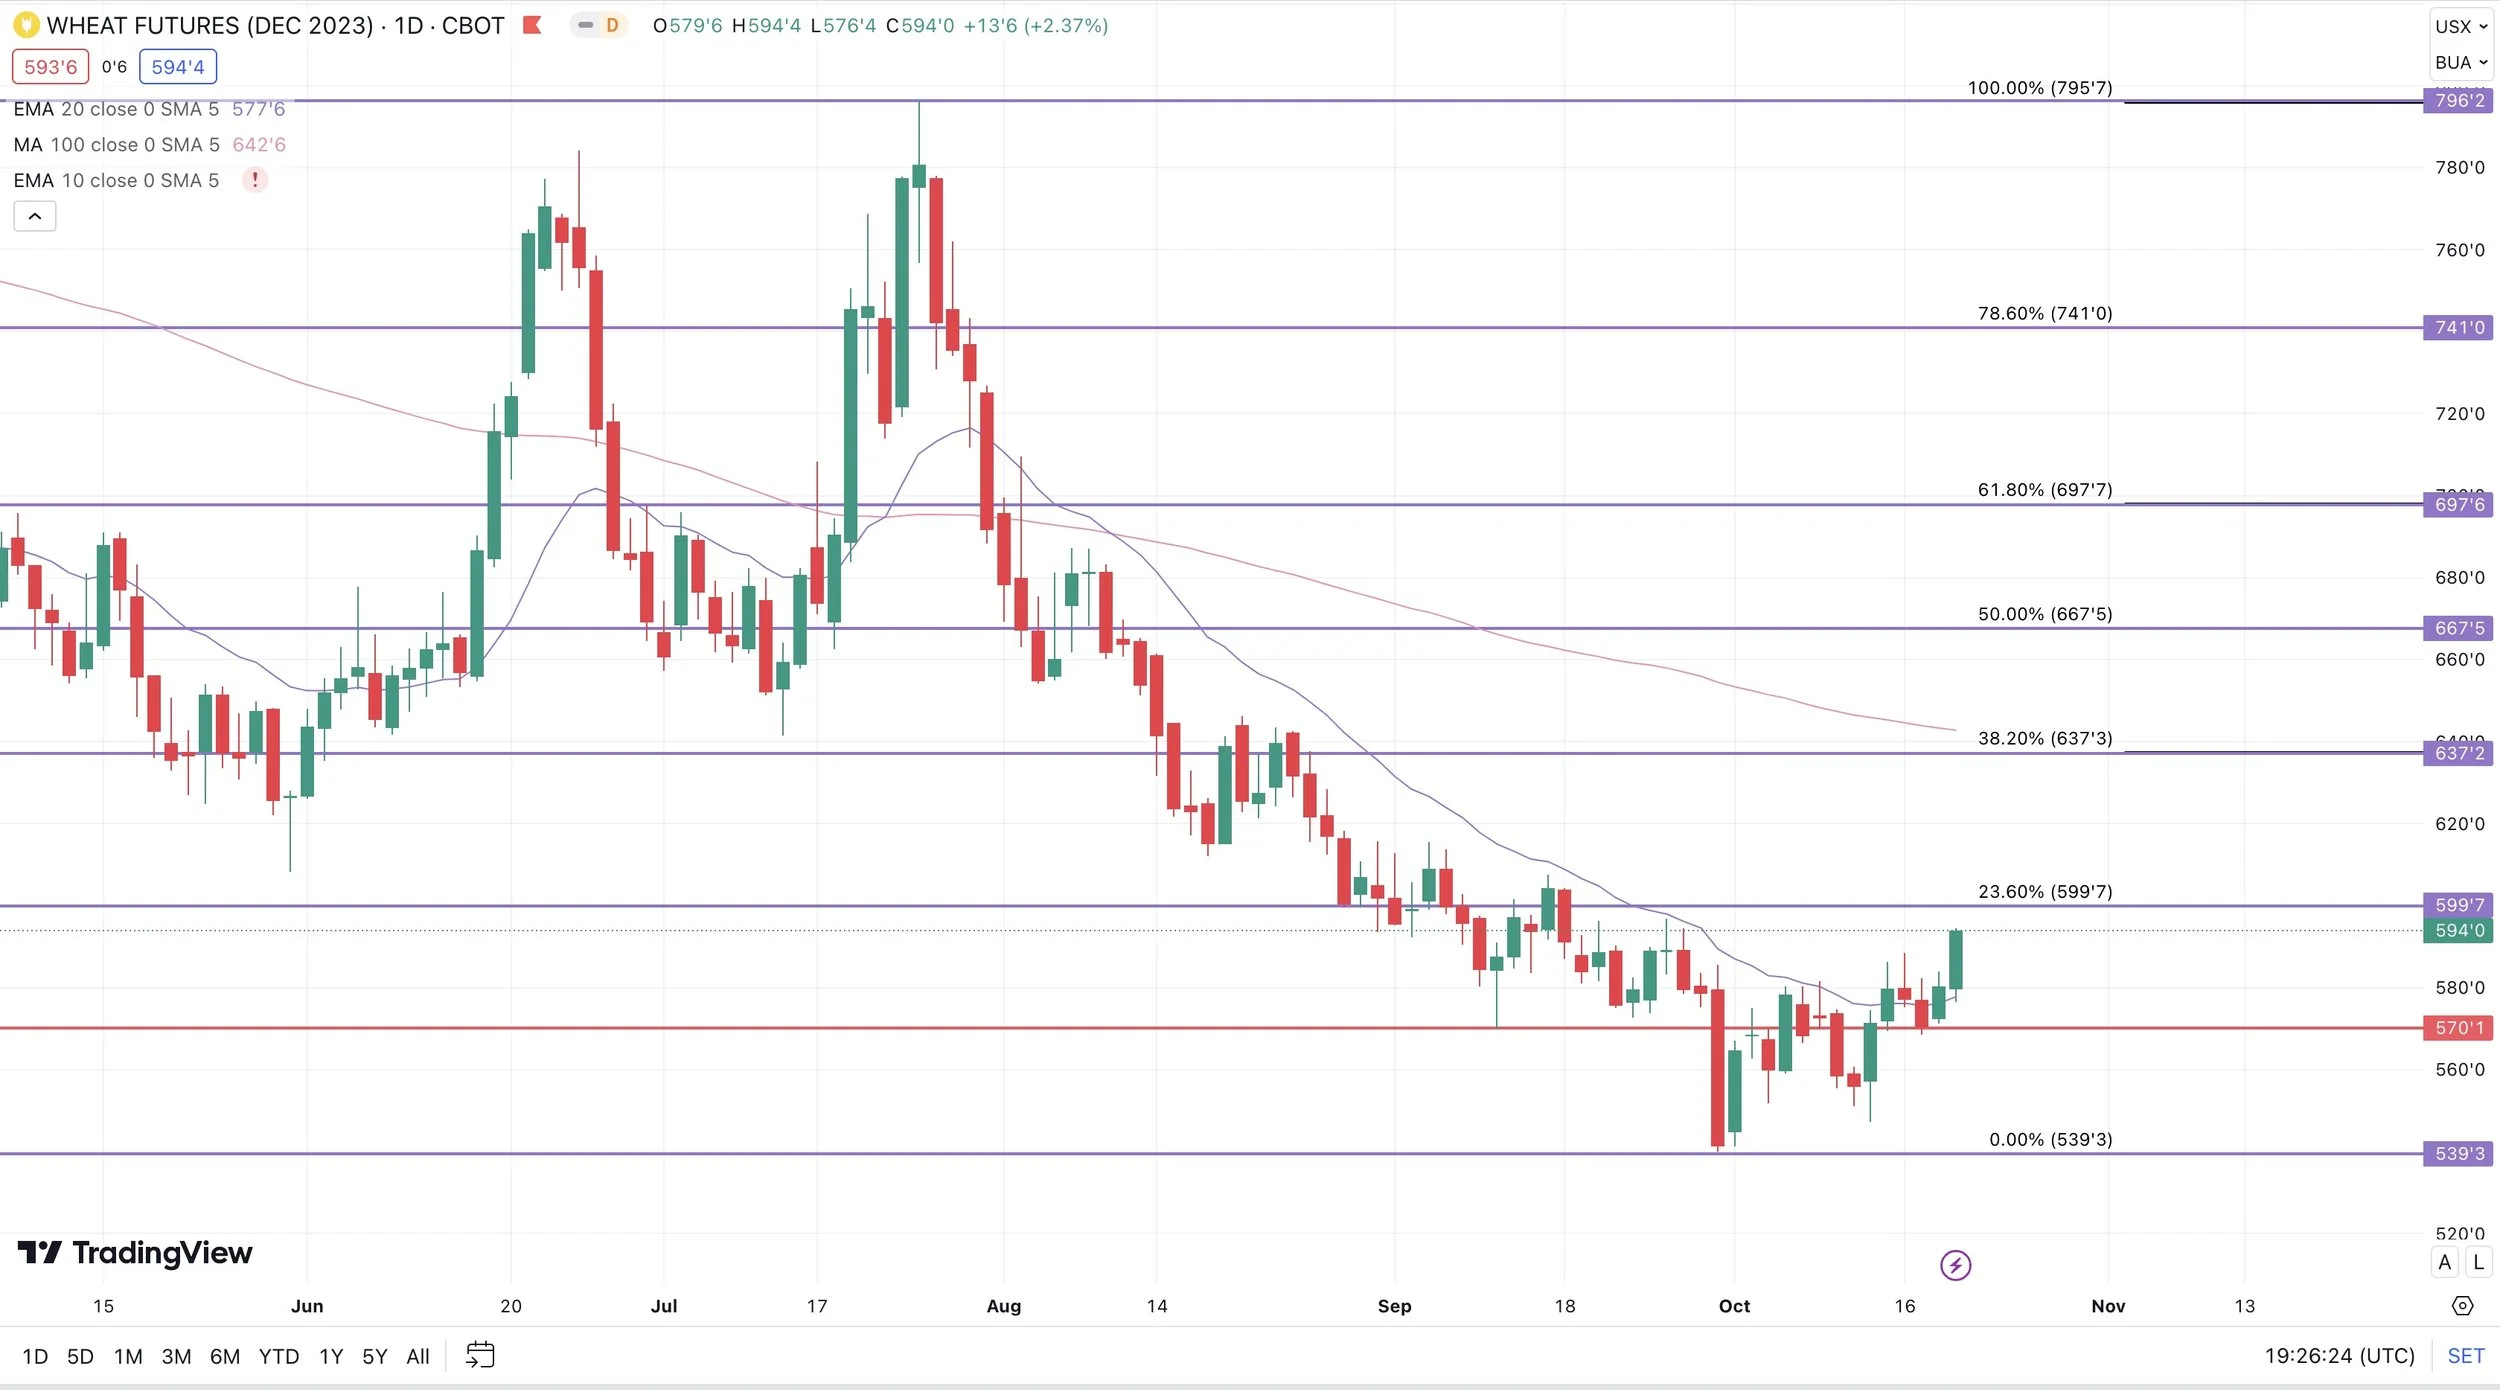
Highest close since September 15th. Now +55 cents off their lows from a few weeks ago.
We are getting close. A break above $6 and we likely see more short covering.
Seasonals still point higher.
HAVE QUESTIONS?
Our phones are open 24/7 for you guys. If you need help with anything at all, don’t hesitate to shoot us a call, text, or email. Every situation is unique.
PAST UPDATES
10/18/23
BEANS BREAK $13. IS CORN NEXT?
Read More
10/17/23
DID BEANS CONFIRM REVERSAL?
10/16/23
CHOPPY BORING TRADE
10/13/23
POST USDA REPORT CORRECTION
10/12/23
BULLISH REACTION TO USDA REPORT
10/11/23


