
GRAINS CONTINUE BREAK OUT FROM LOWS

Overview
Huge day for the grains, as we follow up last week's strong action with more upside today.
On Friday, corn closed above $4 for the first since since August 6th. Beans closed above $10 for the first time since August 9th.
This move followed up corn & KC wheat's weekly key reversals from last week. All the charts look very strong as we took out several layers of resistance for most.
All grains also closed above their 35-day moving averages for the first time May.
I have full daily & weekly chart breakdowns later in today's update.
Last week I was cautiously optimistic about the lows being potentially in as I mentioned, as we had been flirting with resistance, but I didn’t want to fall for a bull trap. But today we took out some great resistance, so make sure you scroll to check out all the charts and what they mean.
This weekend marked the official end of the marketing year for corn & soybeans. So the crop is the ground you are getting ready to harvest is considered old crop now, while the crop you will harvest in 2025 is new crop. Just make sure you are clear and careful when you talk to your elevator. As many will think you are talking about the 2023 crop when you mention old crop.
We saw yet another flash sale of soybeans to China. But a huge amount, just 132k MT. But we are starting to see sales pick up with rumors that China wants more.
Yes, bean exports are FAR behind. BUT these past 4 weeks have been amazing.
The 5 year average for the last 4 weeks is 5.25 million MT. We exported 6.6 million.
The past week alone we exported 2.6 million. Which was the best week in history for that week.
So still running way behind, but a good start.
Here is a chart from GrainStats that shows the weekly exports.
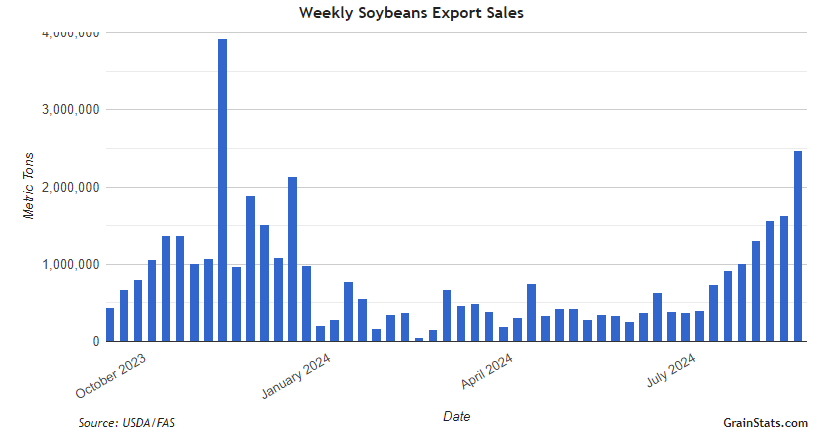
If China wants beans, they will have to come to the US until Brazil's harvest comes.
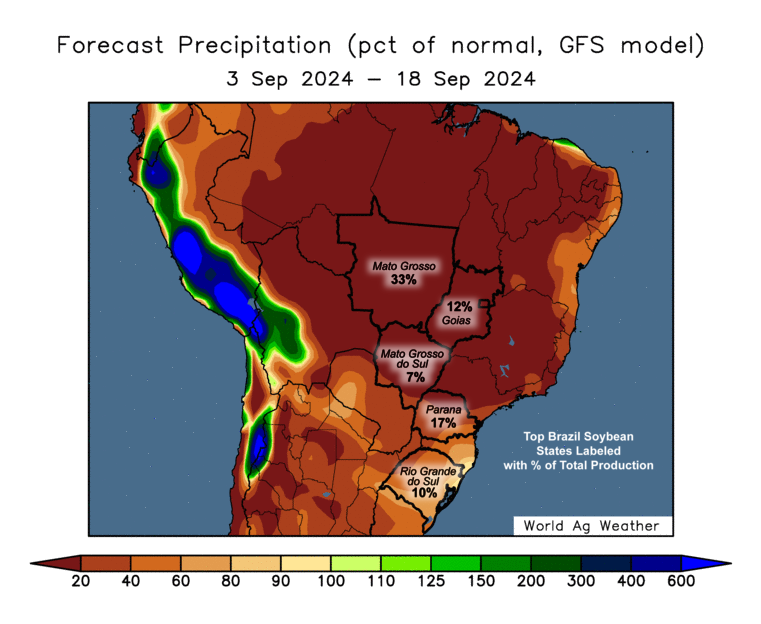
Another big potential headline is still Brazil.
Yes, Brazil weather scares are still early. But this is a huge factor that needs to be watched.
Brazil is having it's worst drought since 1981.
It looks like their bean planting is going to be delayed until October. If this happens, it will give us another month for export business. Still too early, but it is a reason for the funds to cover.
It is being delayed due to the forecasts for below average rain in September & October. Typically their rainy season starts to pick up in September to October, but the forecasts show the typical spring rains being delayed to late October for now. With dry weather for at least another two weeks.
If you are the funds, this is something you are watching.
If you are China, this is also something you are watching.
Not a huge deal today, but right now the USDA projects a monster Brazil crop and a large US crop. Neither of those are set in stone.
If a few weeks from now it is still dry, and the forecasts still look dry the trade will start to take notice.
Next 2 Weeks
Next the funds.
They still hold MASSIVE short postions.
The funds have actually been buying/short covering a good amount of corn the last few weeks.
When we were continuing lower throughout the end of August and posting new lows, the funds were buying.
But why were prices going lower if the funds were buying?
Because it was met with farmer selling. A lot of it.
Farmer selling has been significantly reduced now that first notice day is behind us.
So now when the funds cover, there will be no farmer selling to offset their buying. Thus making their buying more influential to price action.
Since they are still heavily short, that leaves even more room to for them to buy.
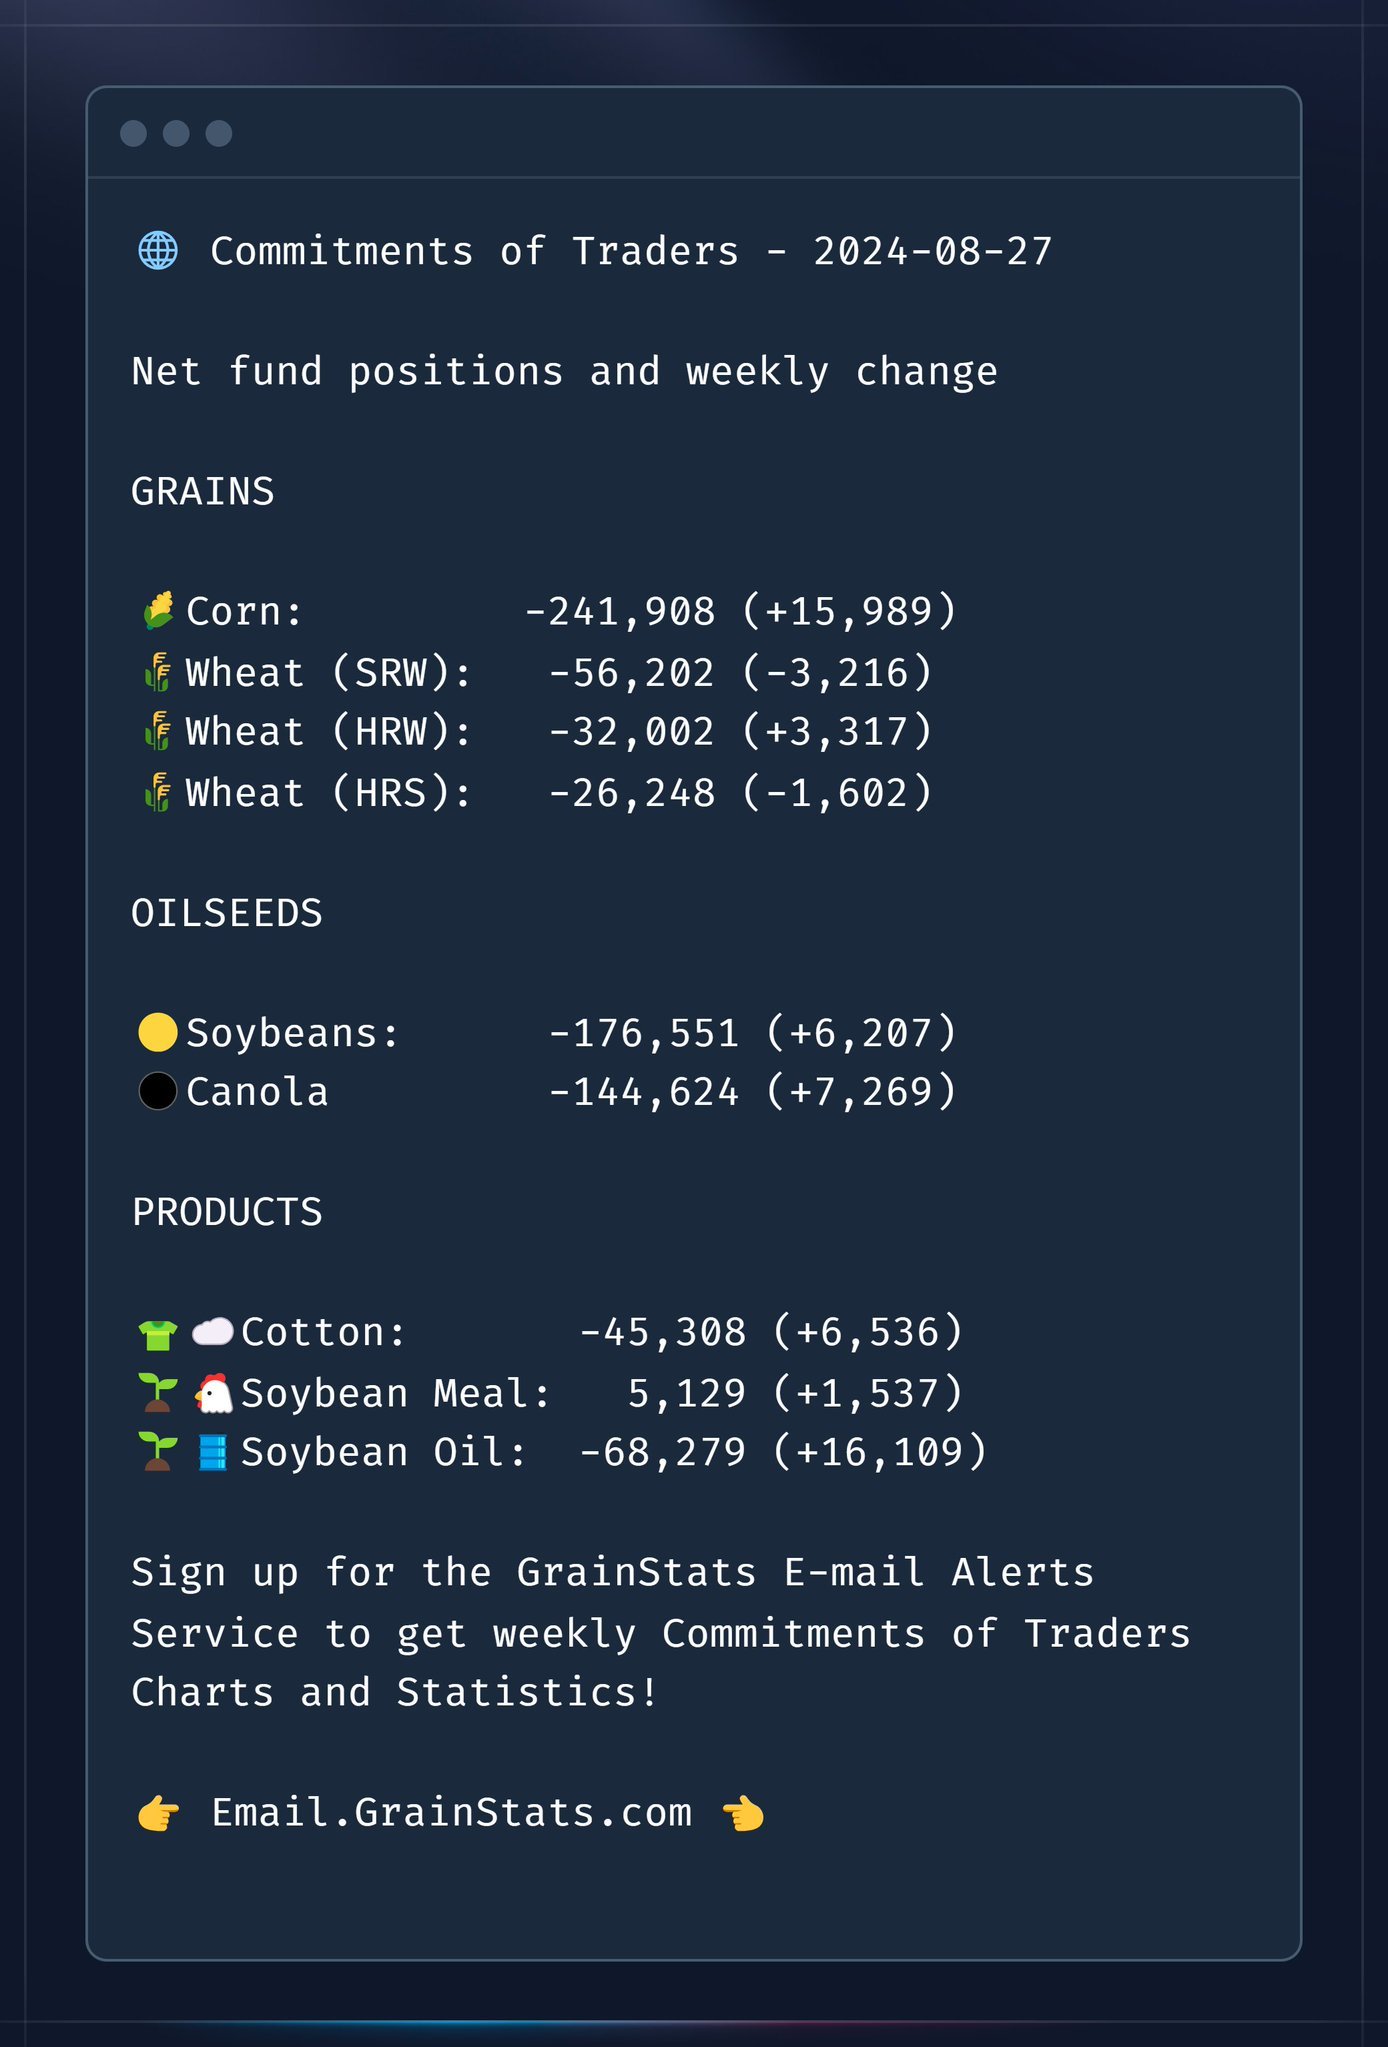
Weekly Fund Changes from GrainStats
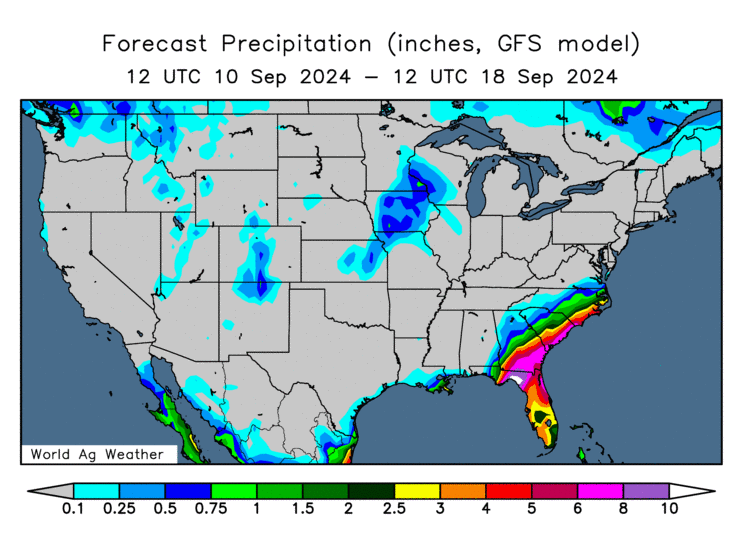
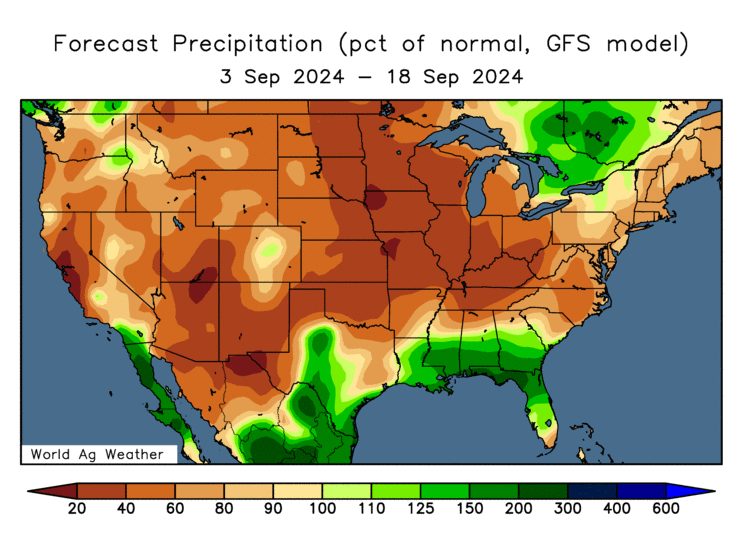
Lastly, before we jump into each grain. Let's look at US weather quick and some comments from others.
We have had some dryness and heat that will likely take a little bit off the tops of the crops, but I am not sure just how much. I am no agronomist, but doesn’t seem like an ideal finish.
Take a look at the drought monitor change. Obviously this is not huge as we didn’t have drought all year long. But it just shows that the recent heat & dryness did have a a slight impact.
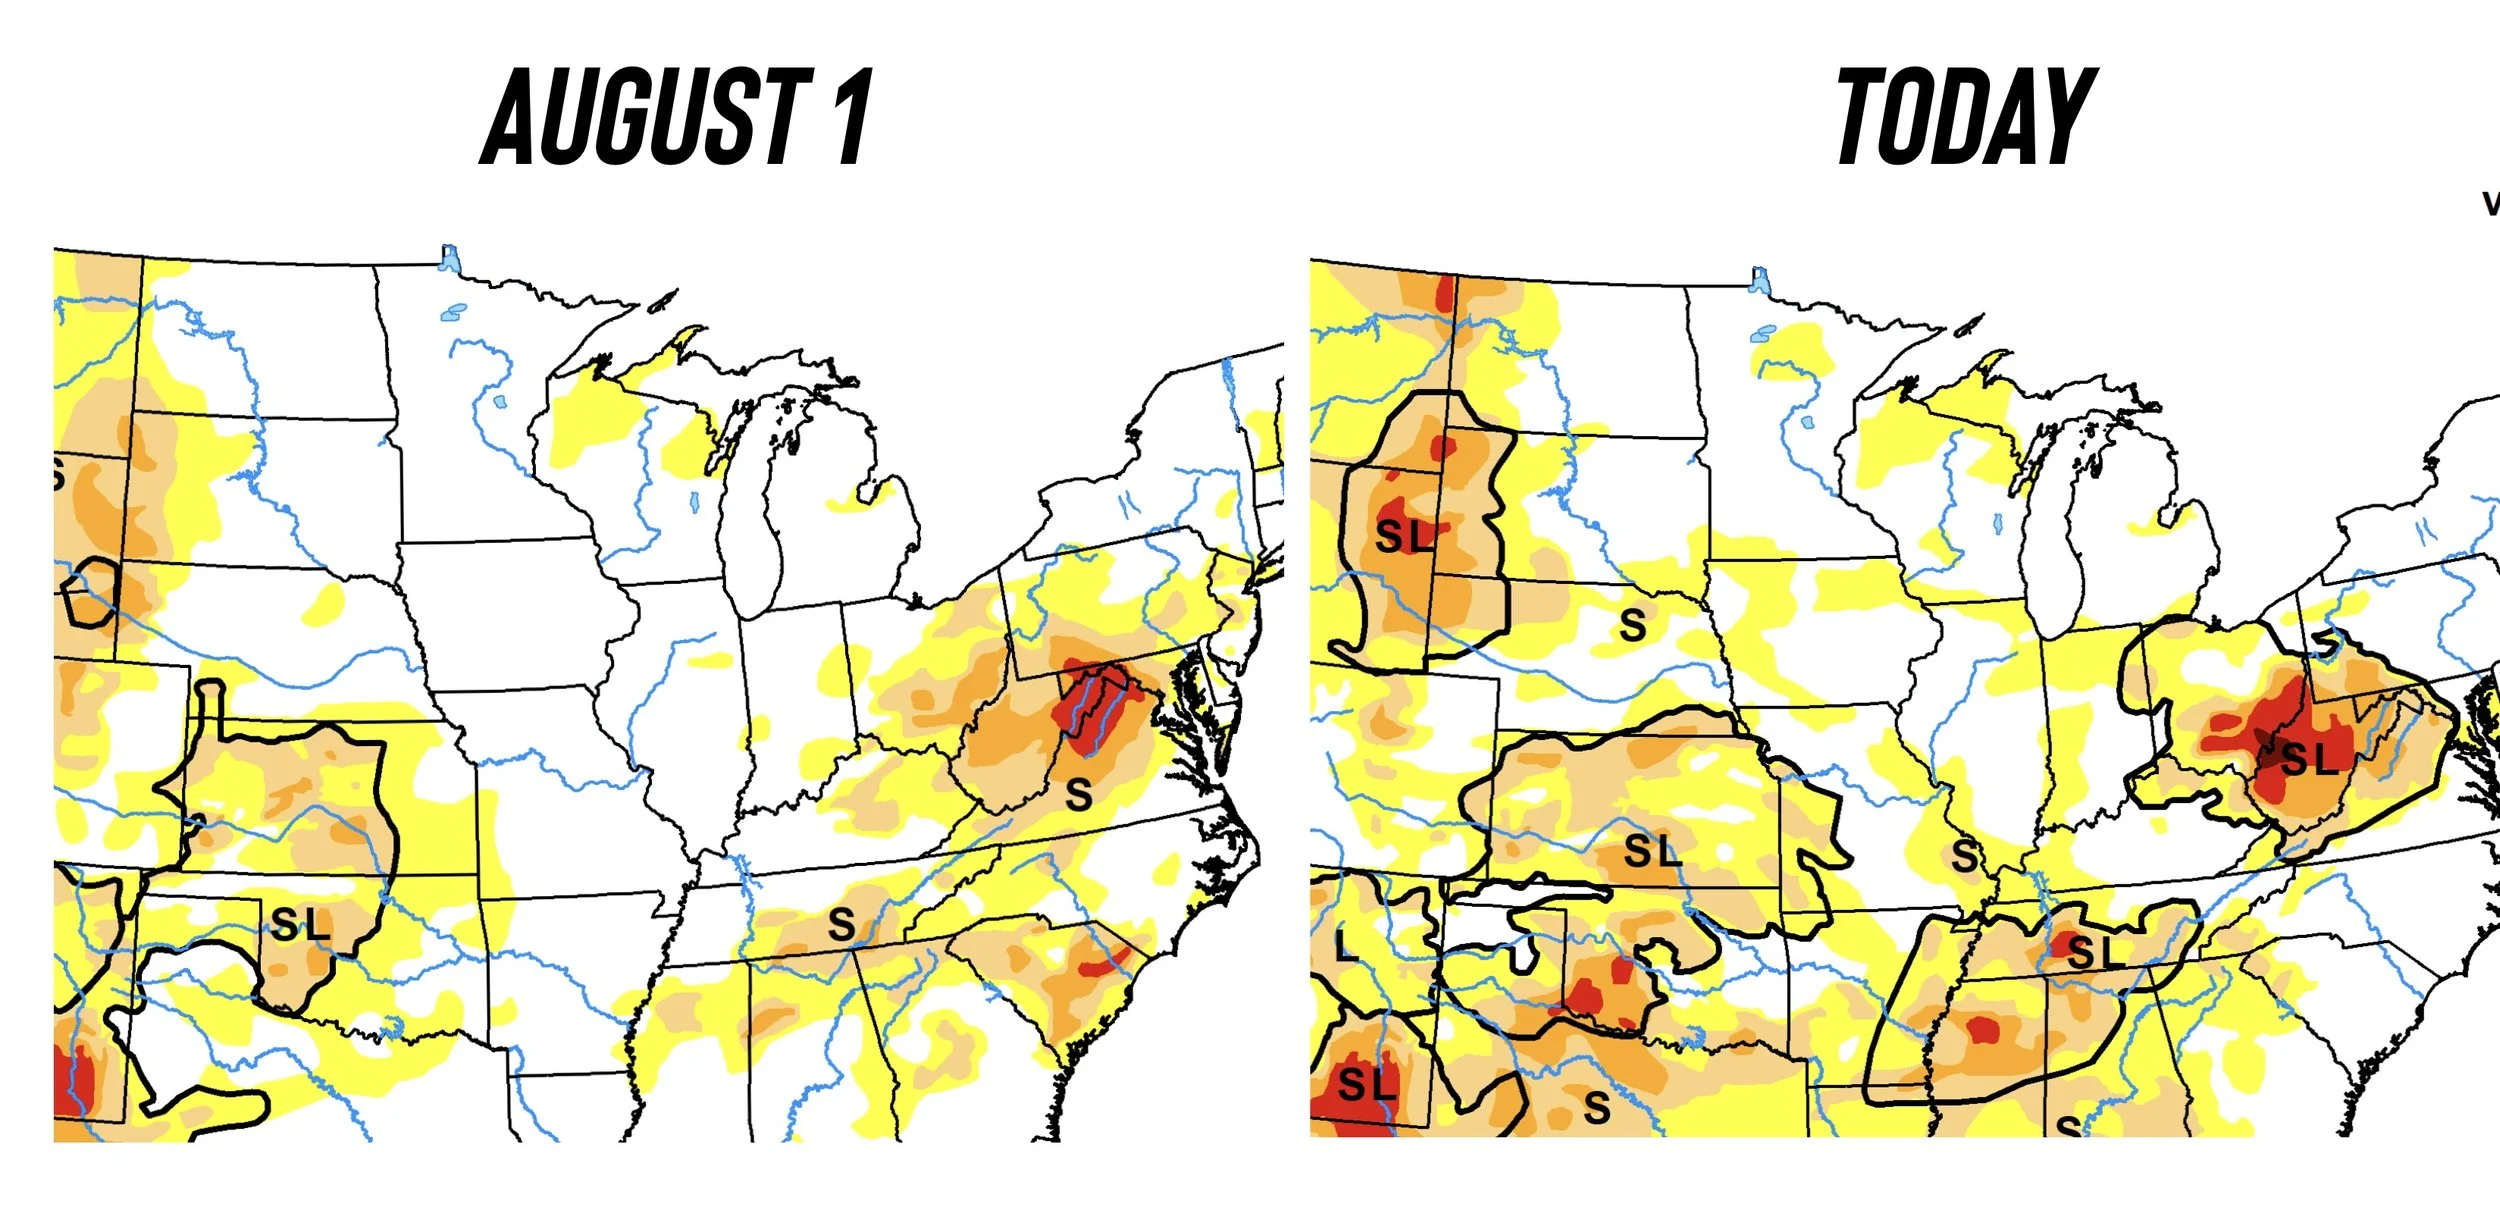
There is zero rain in the forecasts for the next 2 weeks. Also not super ideal.
Next 2 Weeks Rain
From a Nebraska farmer:
"Soybeans look 50-52 nationally and corn is around 179. Stick that in the carryout. Question is how many acres did we lose in July. I think some bullish surprises are on the way"
From an Illinois farmer:
"It will be record at 178, not 183. With 2 more weeks of dry weather, beans will be 51-52 not a record"
From Commstock in Iowa:
"Personally, my beans are going slightly backwards as we just missed too many rains in August. Will they be good? Sure. A record? Most likely not."
We will have to wait until we get in the fields to verify anything. But if yield does wind up coming down even a little bit, it would make a huge difference on the balance sheets and justify higher prices. For corn we could still have a record yield of 178-180 yet see our carryout drop under 2 billion.
Today's Main Takeaways
Corn
Great day for corn. Our 4th day higher in 5 days. Now +25 cents off the lows posted last week.
A good portion of this rally is coming from the fact that we are seeing less farmer selling with first notice day out of the way. That was adding a ton of pressure. The funds are still short -250k contracts, so plenty of room to keep covering.
Any farmer selling that "had" to be done is done for now.
Posting lows during first notice day is very common. That is exactly what happened when we posted our lows in February and then got that small rally into May.
Seasonally, the past 5 years this is right around the time where we have made our lows. So it would not be surprising at all if this was indeed our lows.
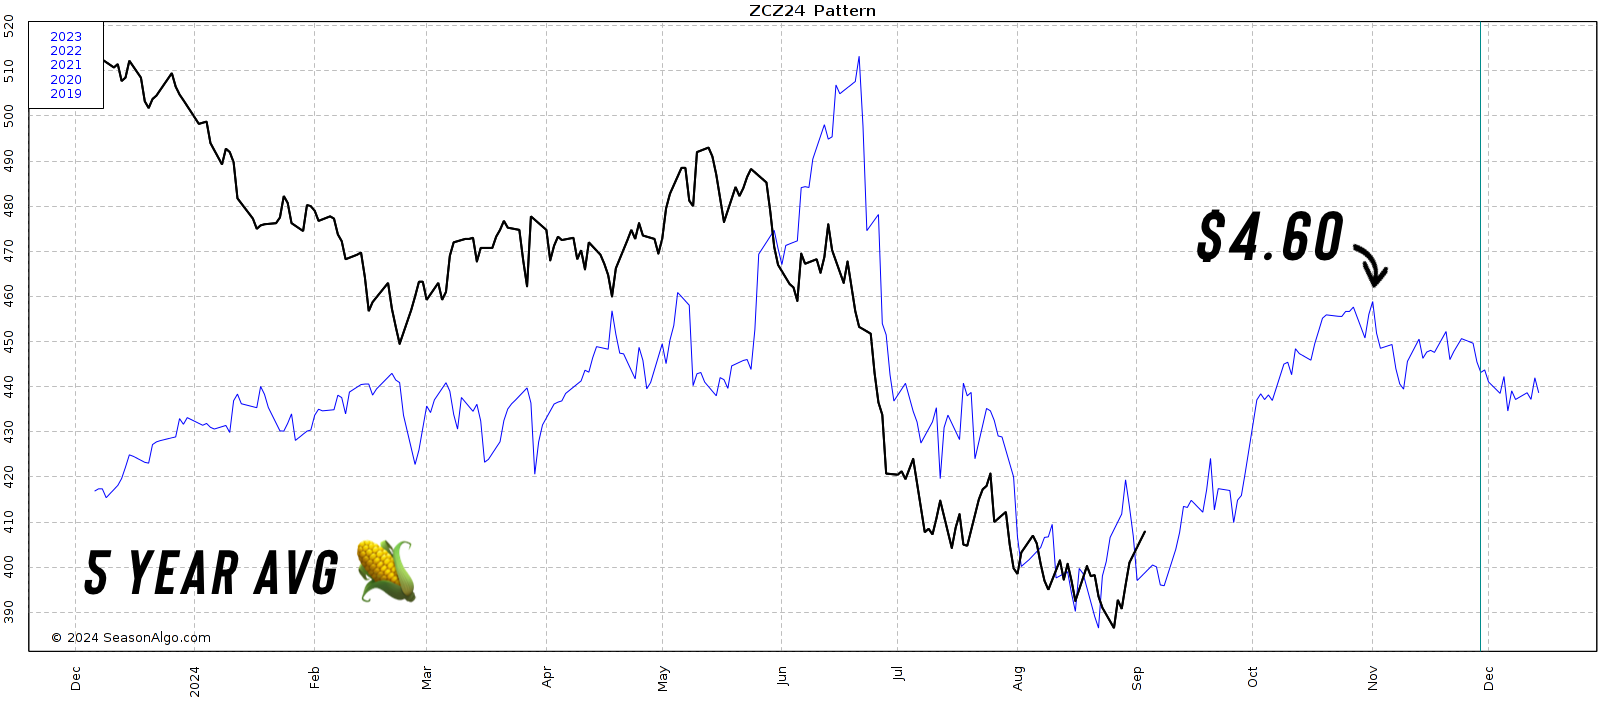
Looking at seasonals, the average of the last 5 years has up topping out at $4.60 by November 1st.
Let's look at the last 5 years.
Specifically looking at around fall/harvest timeframes, August to mid-November.
When did corn bottom, and how much did we rally?
The past 5 years, all the lows have came in August or September.
2023:
Low: Aug 22nd - $4.61
High: Oct 20th - $4.95
Rally: +34 cents
2022:
Low: Aug 17th - $6.08
High: Oct 10th - $7.06
Rally: +98 cents
2021:
Low: Sep 10th - $4.97
High: Nov 2nd - $5.86
Rally: +89 cents
2020:
Low: Aug 10th - $3.07
High: Nov 11th - $4.28
Rally: +$1.21
2019:
Low: Sep 9th - $3.52
High: Oct 14th - $4.01
Rally: +49 cents
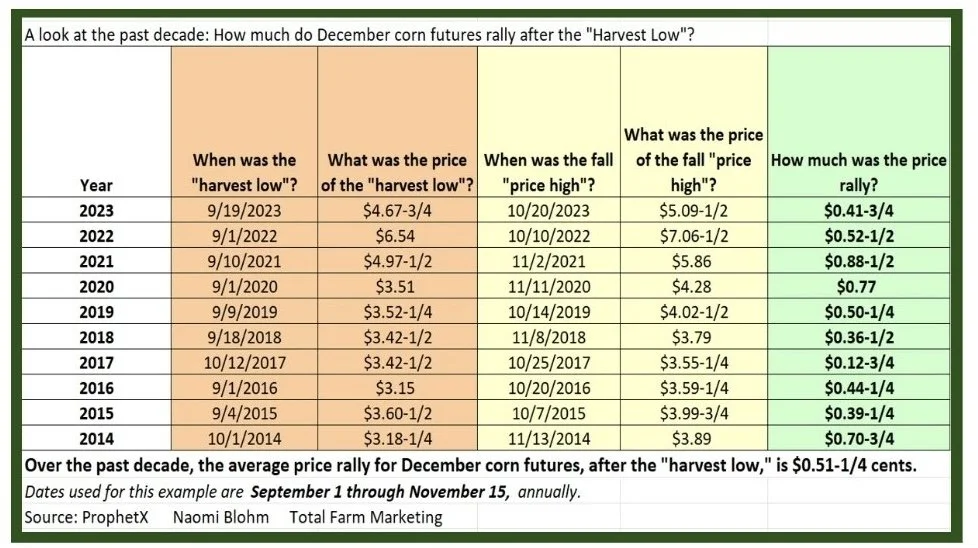
Here is a chart from Naomi Blohm where she took the harvest lows to the harvest highs for the past 10 years using September 1st to November 15th.
The past 8/10 years we bottomed before or during September.
The average rally was +51 cents.
If you use our current August 27th low of $3.85 you'd get $4.36. If you use our September 1st price of $3.98 like she used for other years in her graph, you'd get $4.49
Just some food for thought on how high we could potentially go if this was indeed the bottom.
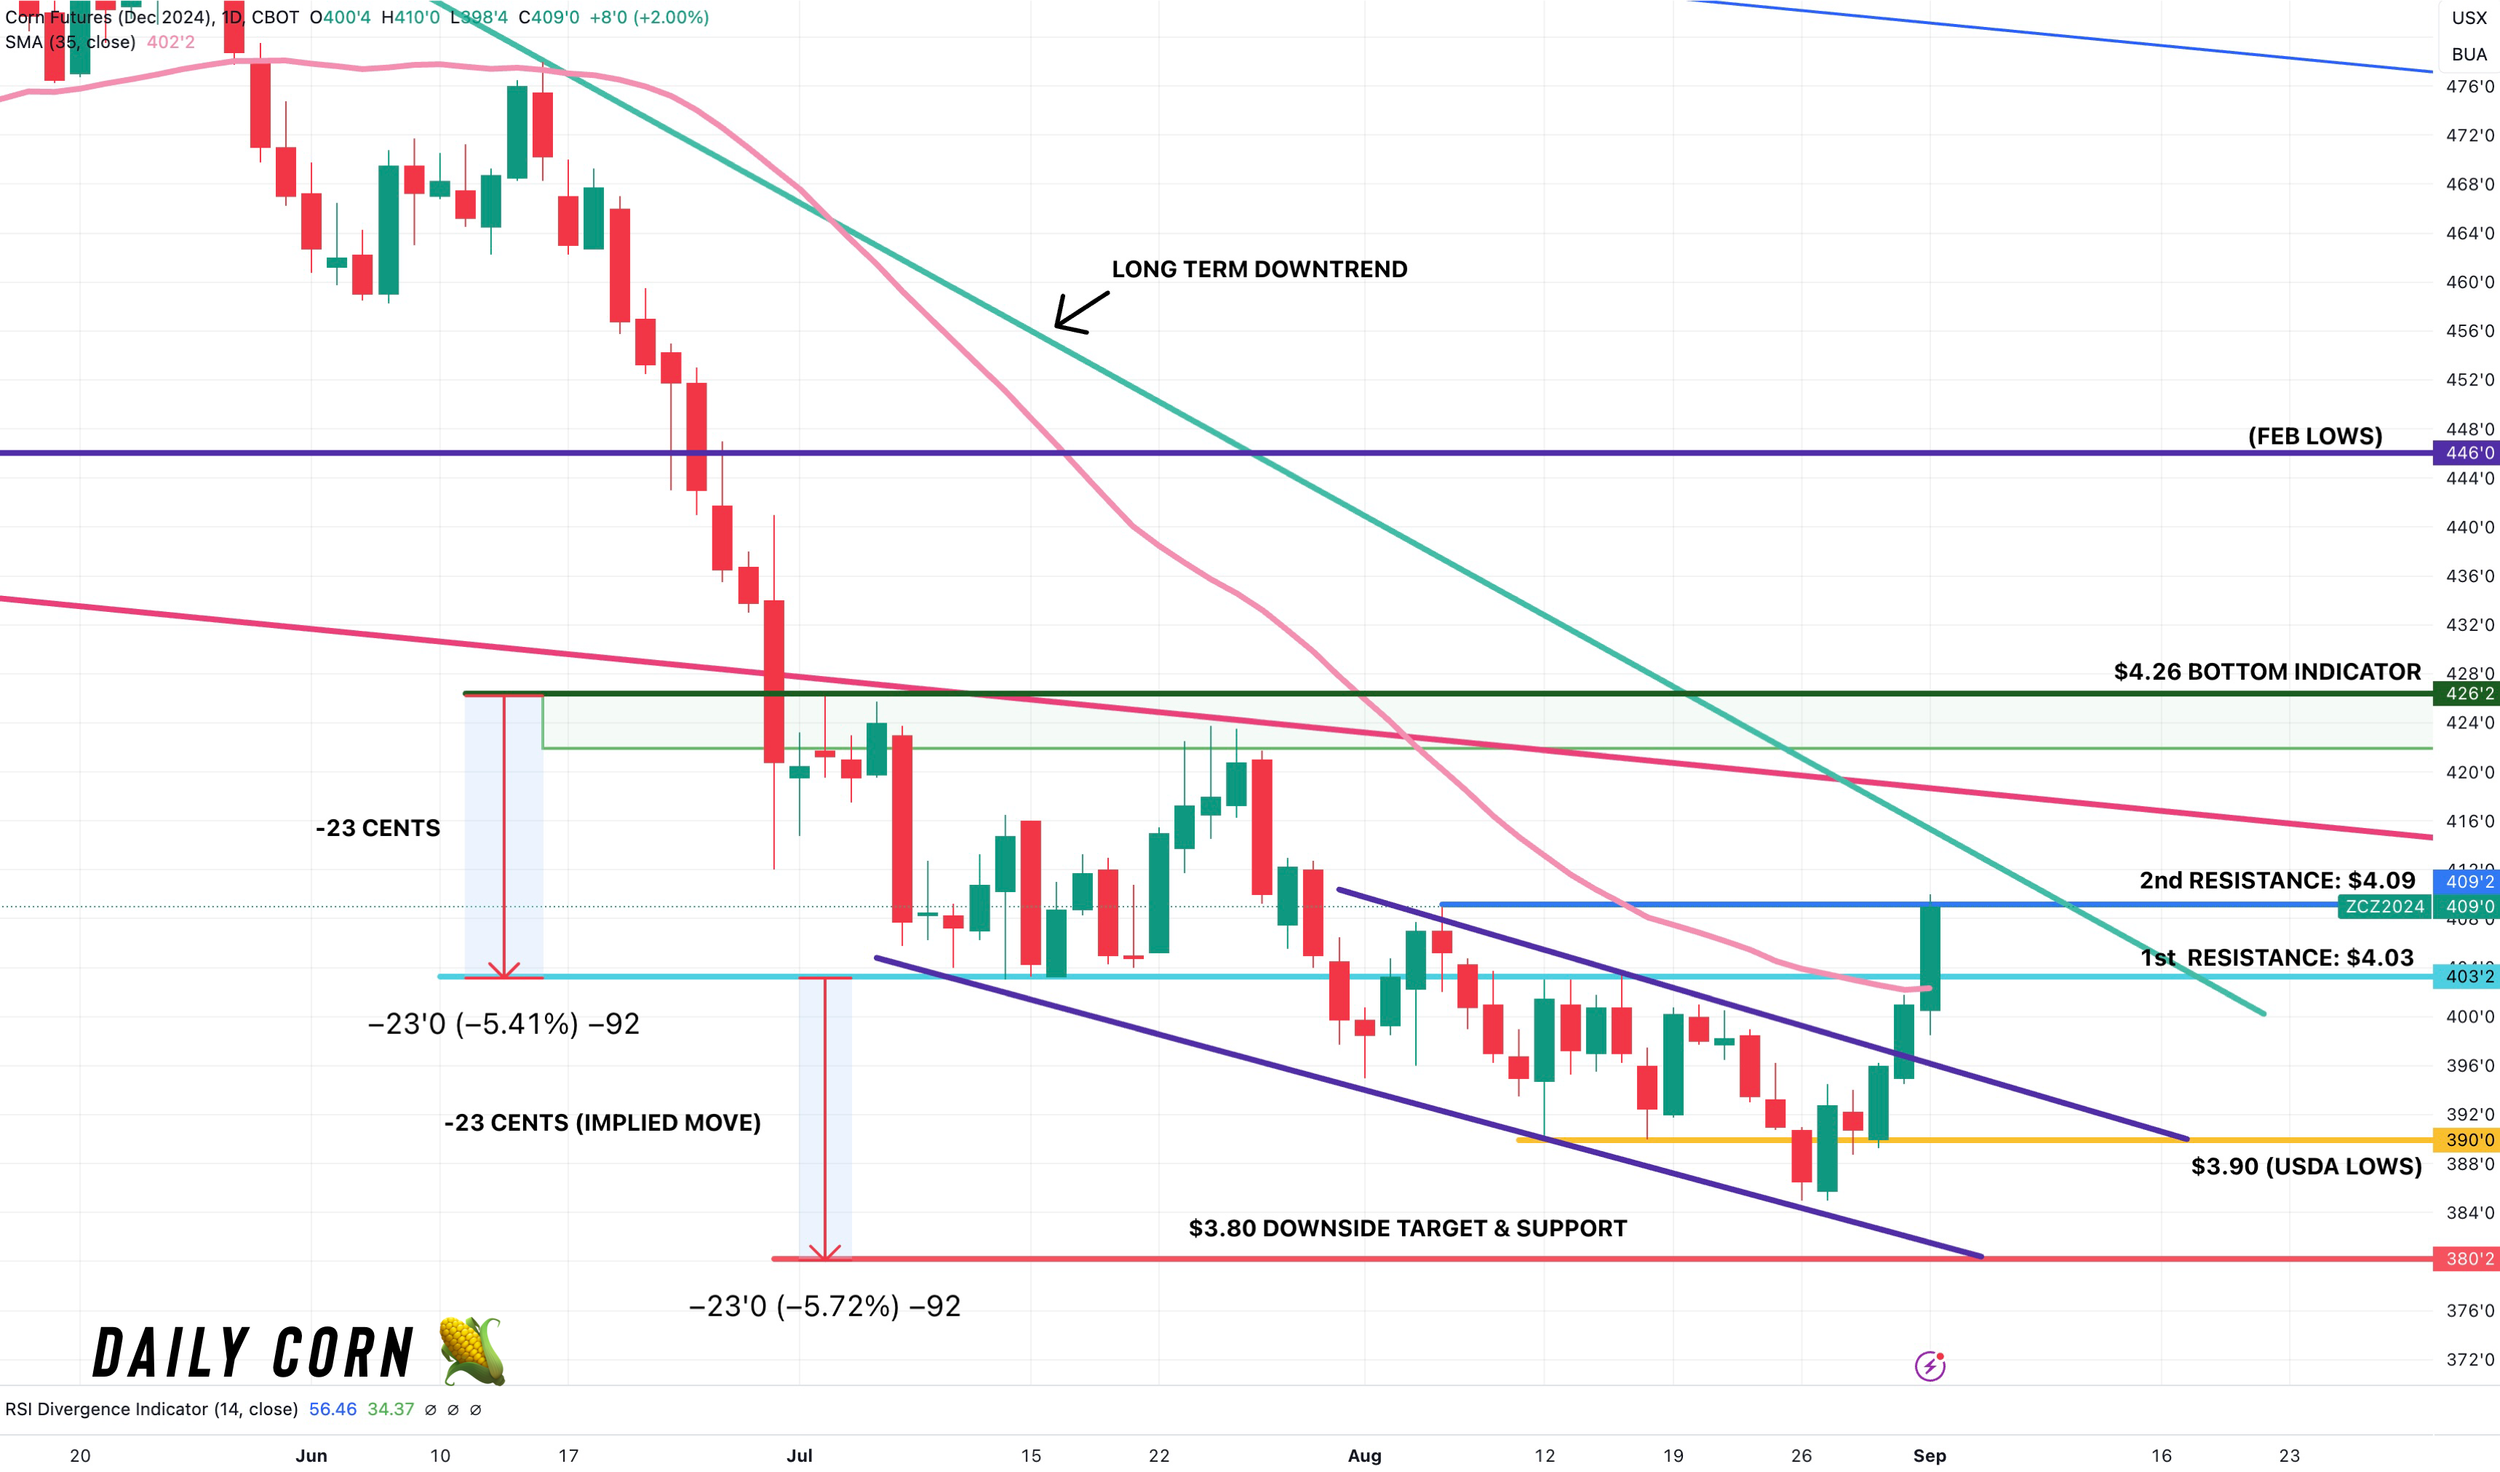
Looking at the chart, it looks great.
We closed at our August highs of $4.09. So we have already completely taken out our entire August trading range the past week.
We closed above the 35-day MA for the first time since May.
We had a clear breakout of this channel (purple line) and broke $4.03 resistance.
Now we might see some resistance here at $4.09, so do not be shocked if we get a short term set back. But if we can clear it the next stop in my opinion is the $4.23 area which was our July highs.
I expect farmer selling to remain low until we get into those July highs of $4.23, then perhaps we run into some farmer selling. But for now, I do not see a reason for us to get any farmer selling with prices this unattractive.
So overall I do not see any reason why we couldn’t continue higher from here. I am getting pretty confident the lows are in, but we still need over $4.09 first. Ideally I still want to take out $4.23 before saying we couldn’t make another low.
But the chart looks great and poised to go higher.
I did also noticed that another well respected advisor placed a buy signal in corn today.
Daily Dec Corn
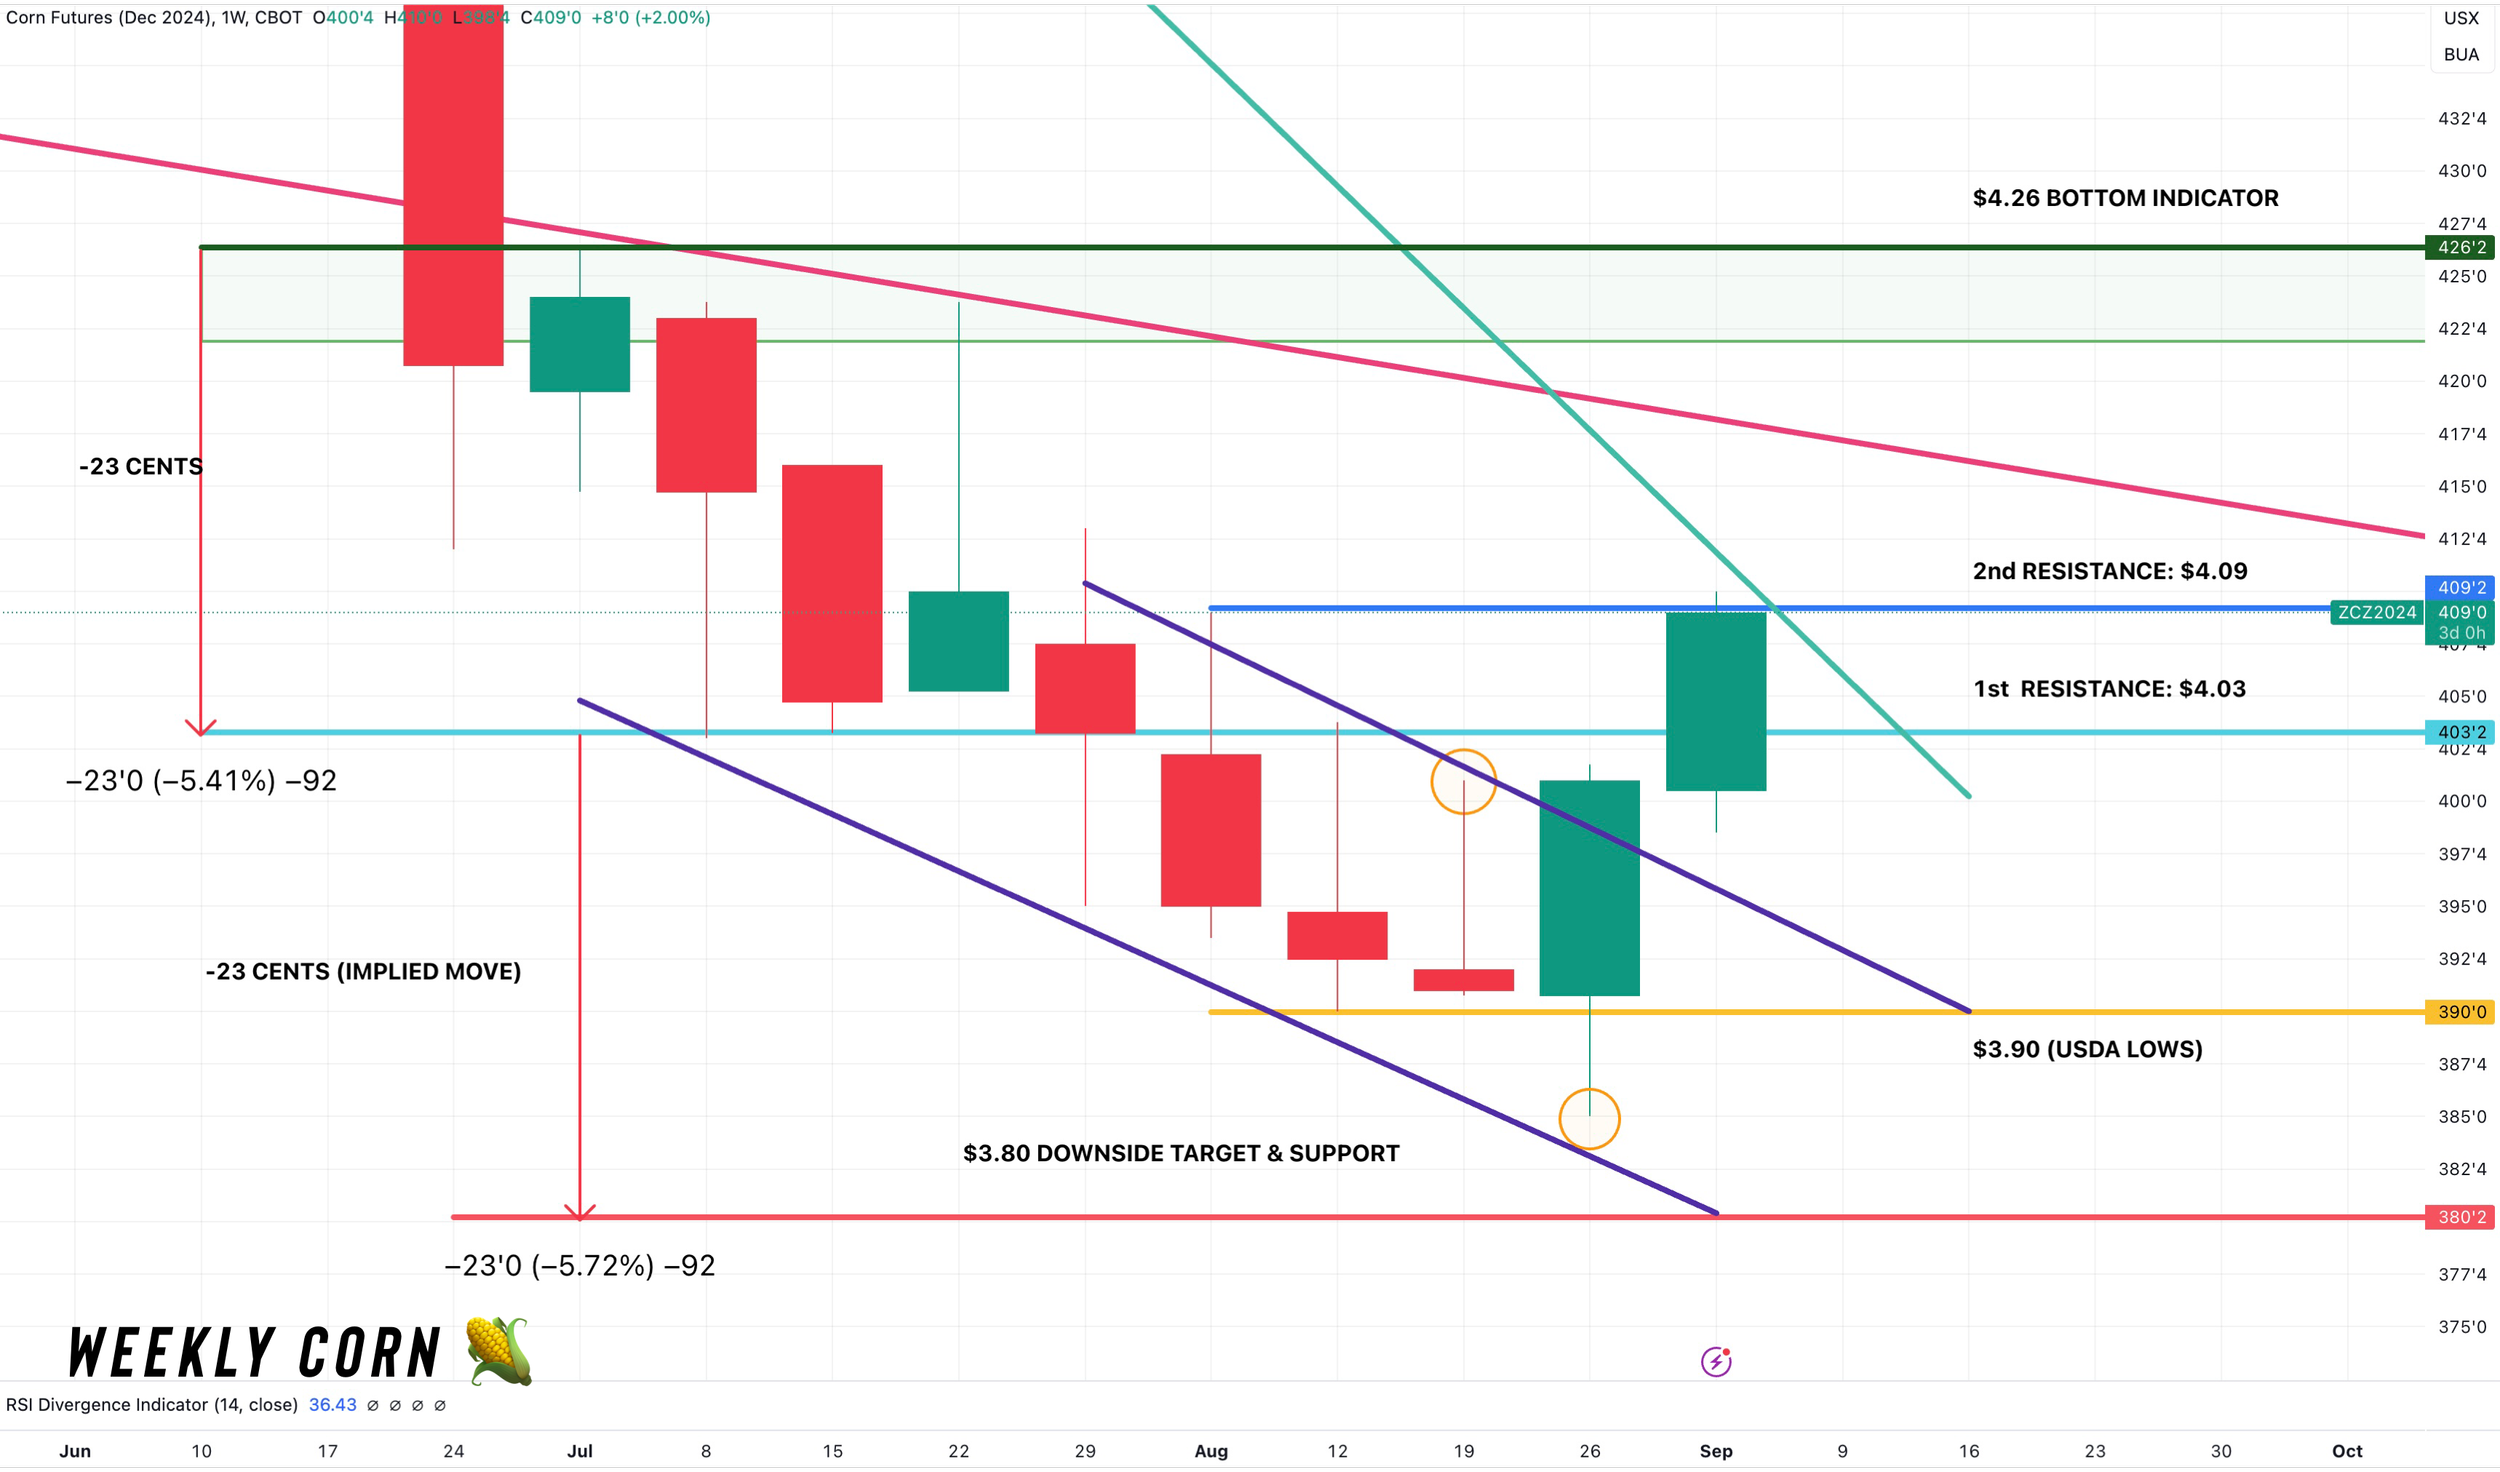
Weekly Dec Corn
We also got a reversal on the weekly chart and then followed it up, which is a very good sign.
Soybeans
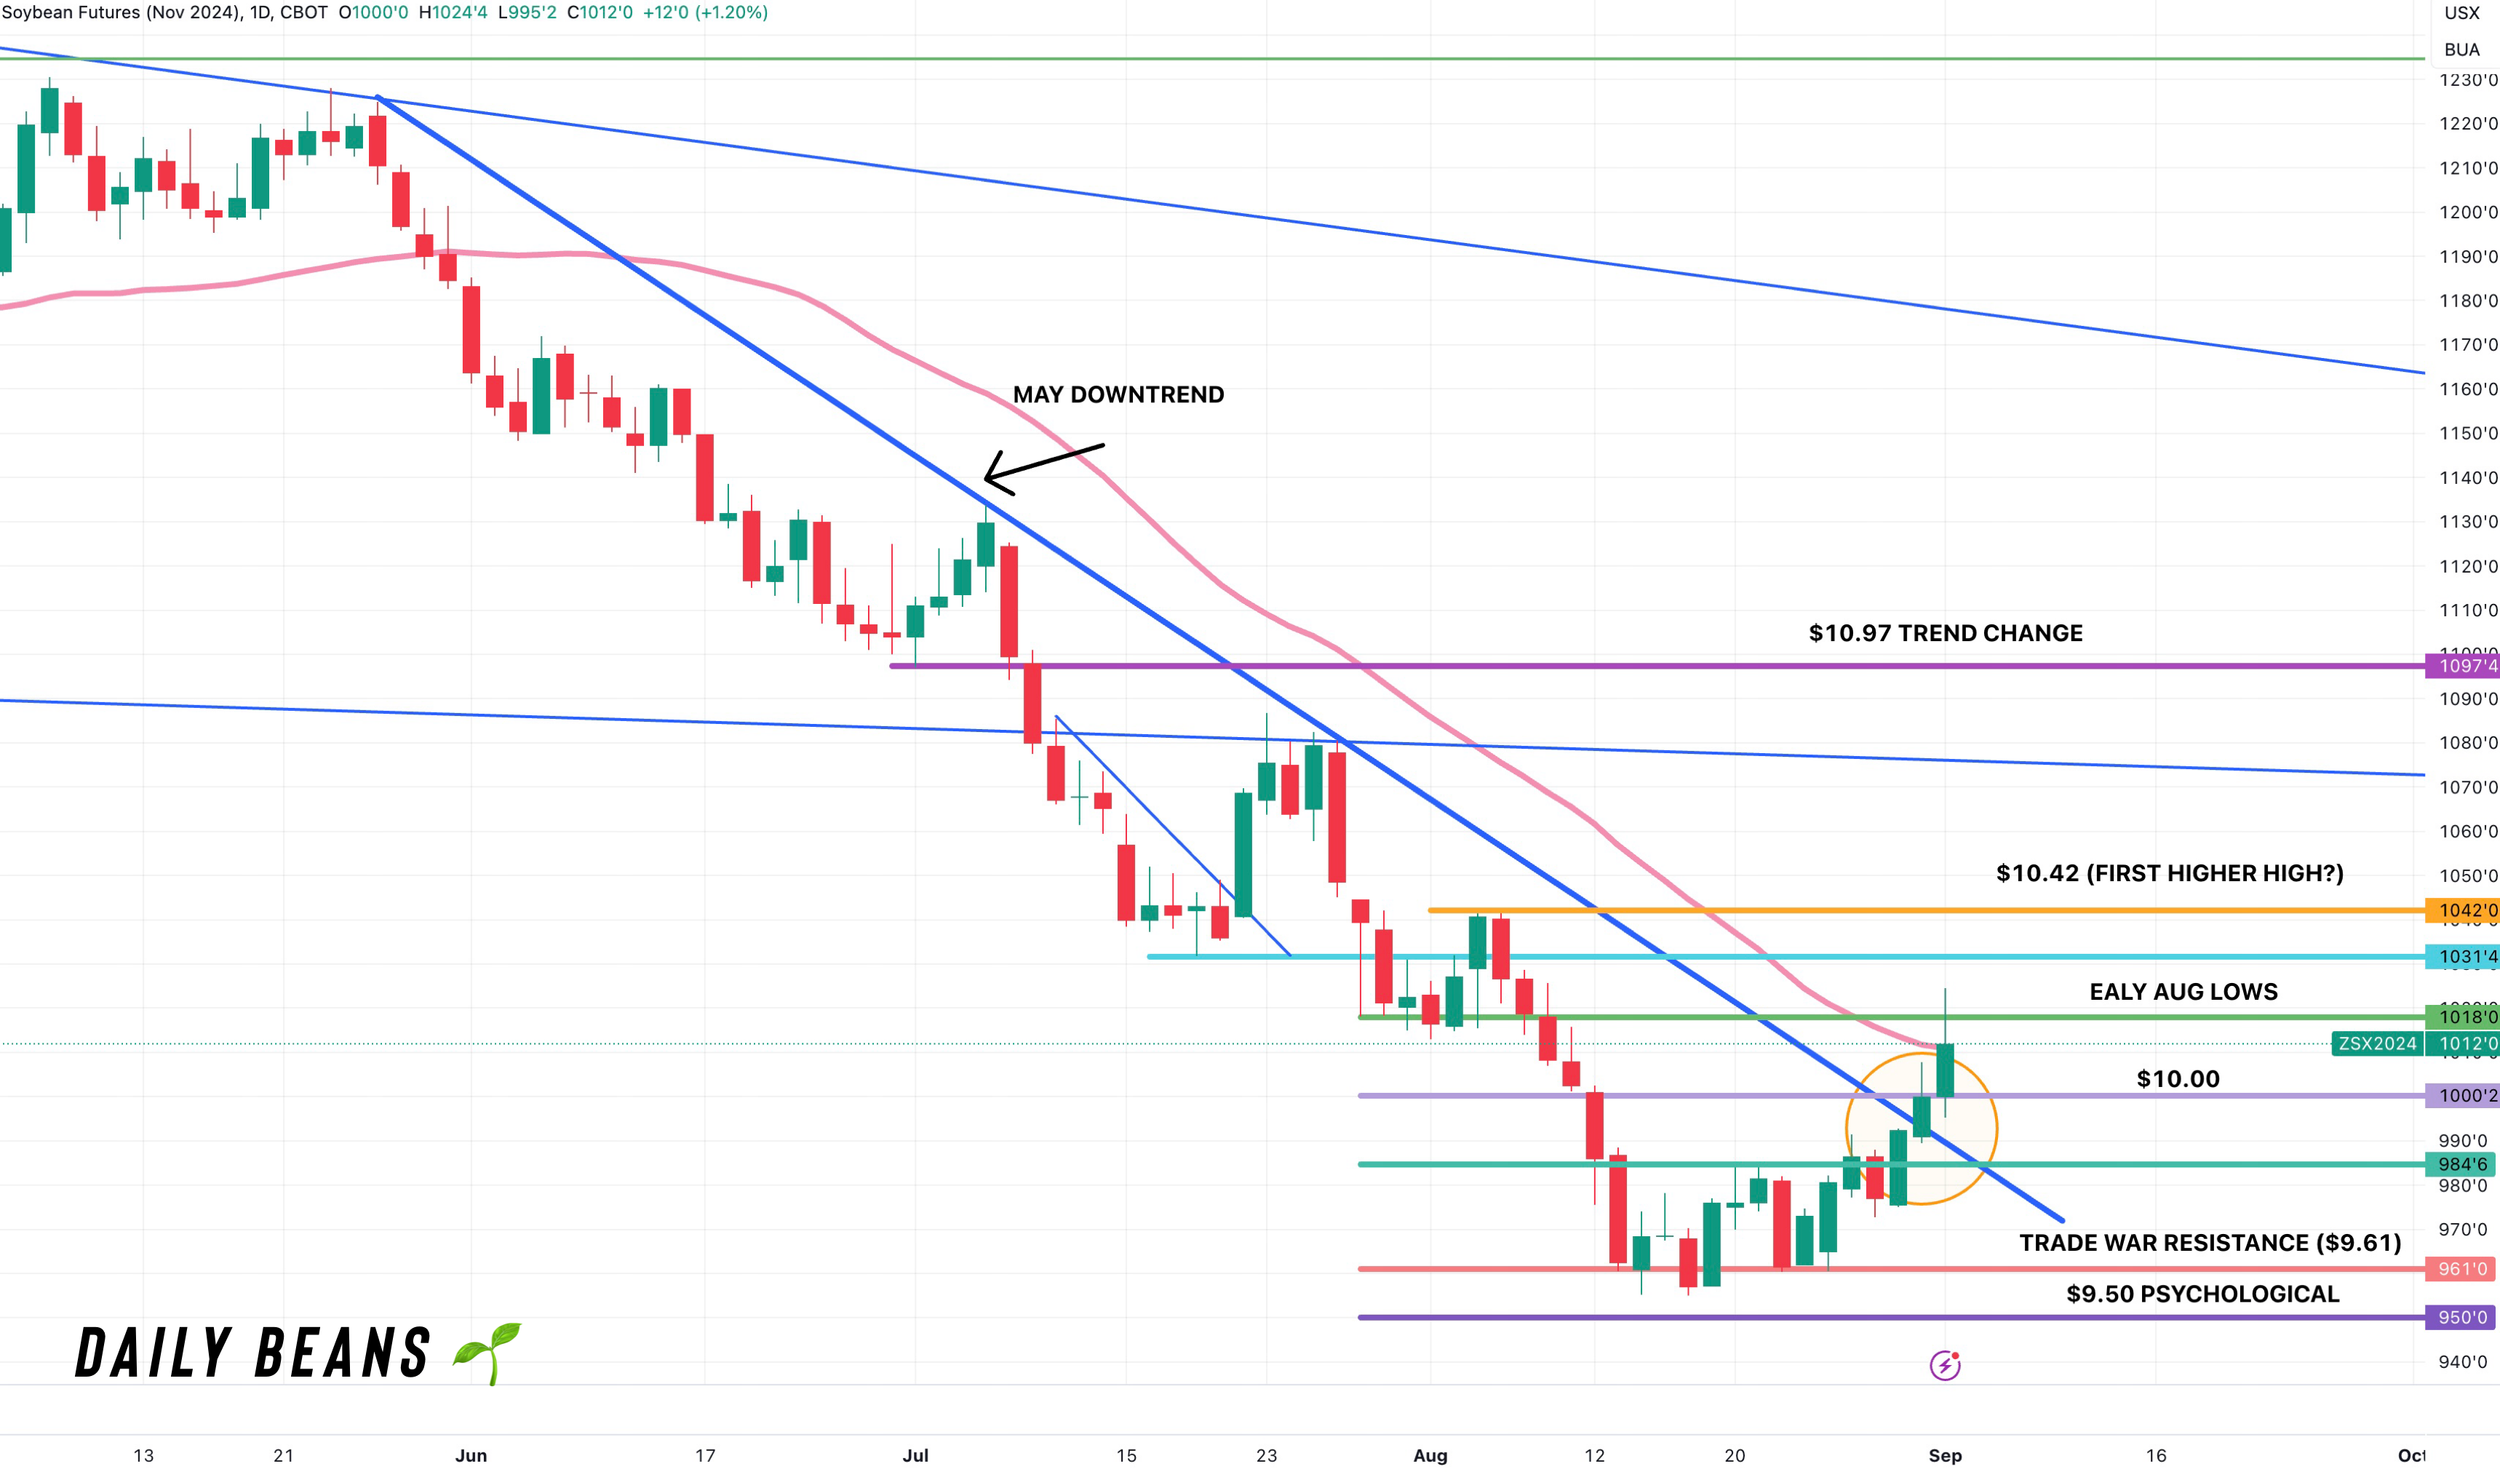
Soybeans very strong, altough we did close -12 cents off our highs.
I already went over the two main stories for beans in the overview which was China buying & Brazil drought. So the bean overview will be shorter.
But essentially there are 3 things that can push beans higher from here.
First would be if we get in the fields and the crop isn’t quite as big as everyone thinks. As this recent heat & dryness could’ve certainly taken a little bit of yield off. (Risk: If we do have a bumper 54 bpa crop then there is plenty of downside).
Second would be China. We have had great recent flash sales, but need more. (Risk: they don’t come in heavy & buy).
Third would the drought in Brazil to continue. (Risk: One good monsoon rain wipes away their drought problems).
If Brazil's drought continues, it will also cause China to buy more. If they are scared Brazil won’t have as many beans, they will turn to us.
It is too early, but last year's Brazil scare caused a massive rally even though they produced a bumper crop. All the market has to do is "believe" this will be a problem.
If we continue to see flash sales from China, and big ones, then beans could continue to pick up steam.
Personally, I think China will continue to buy.
Reasons Why:
They are underbought
Brazil doesn’t have beans until harvest. Their planting looks like it will be pushed back. Which gives us an extra month to pick up business as the main supplier
The drought is already causing logistic issues in Brazil as their river levels are very low
US soybeans off the Gulf are the cheapest in the entire world
Looking at the charts, we have had a very strong week or two.
We broke that May downtrend on Friday for the very first time.
We closed above the 35-day MA for the first time since May.
Looks very good here with room to run. But I do still want to see us make a higher high at $10.42 before calling a definite bottom.
Daily Nov Beans
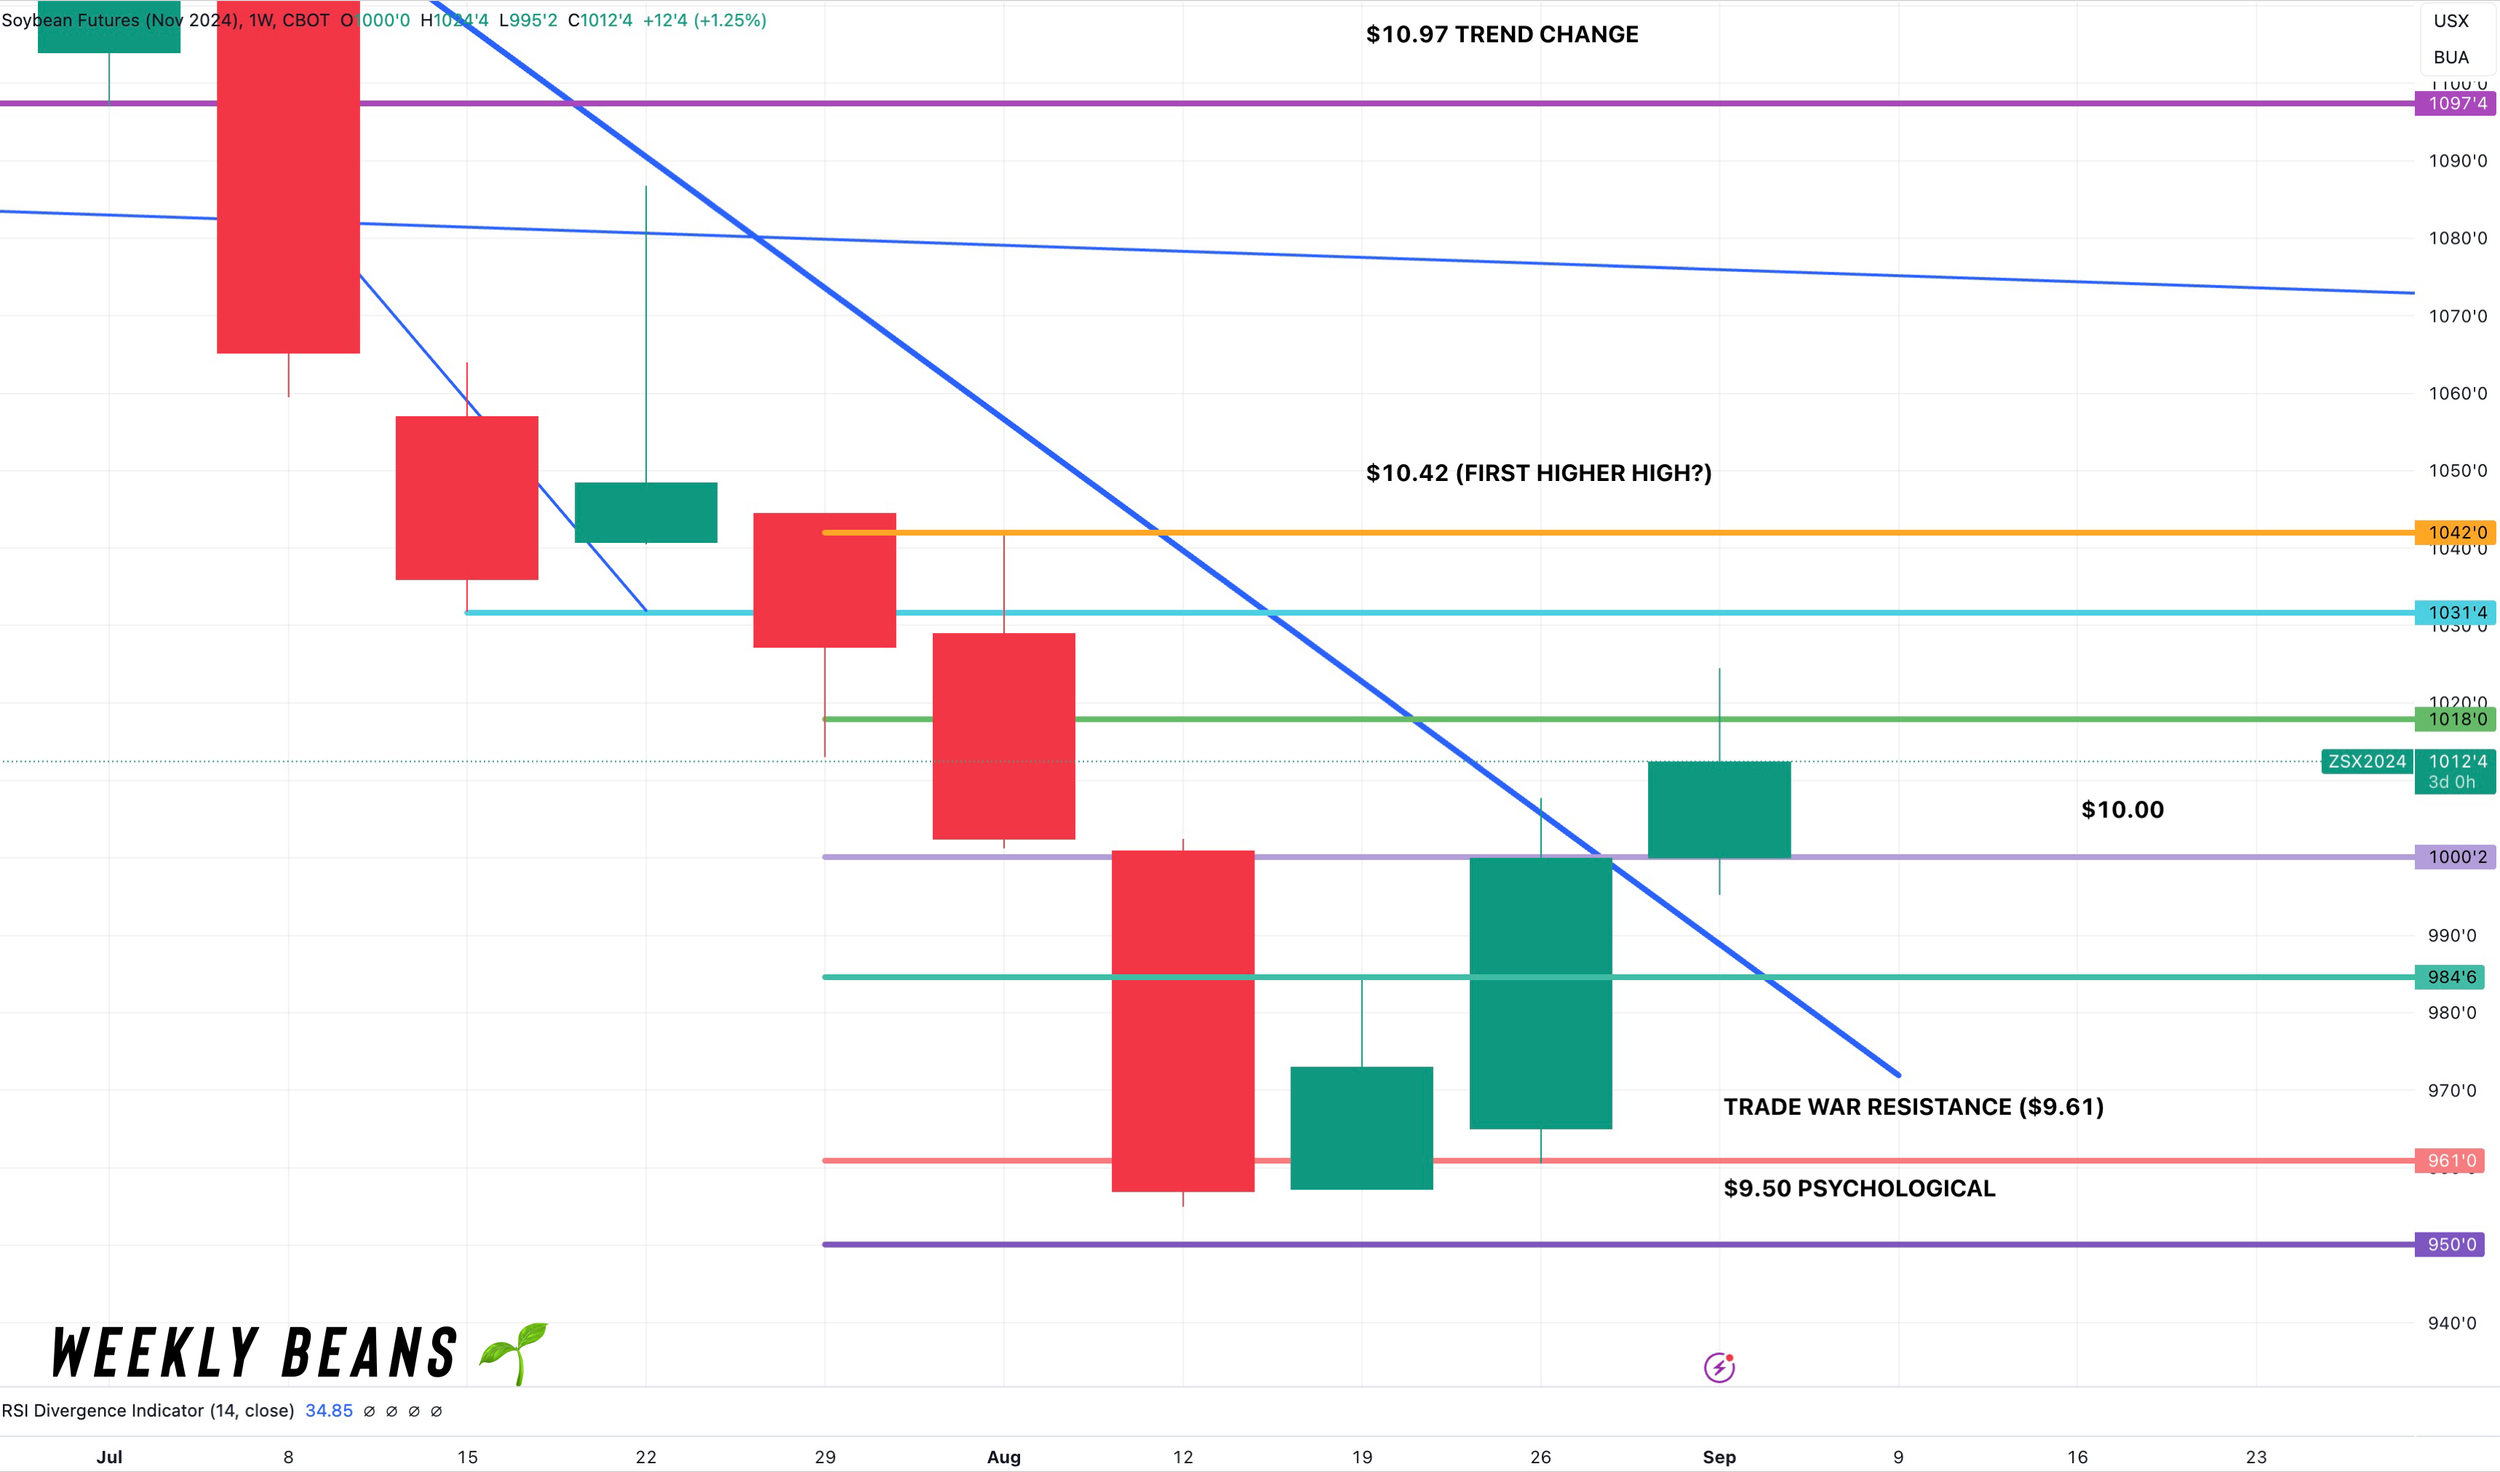
Weekly Nov Beans
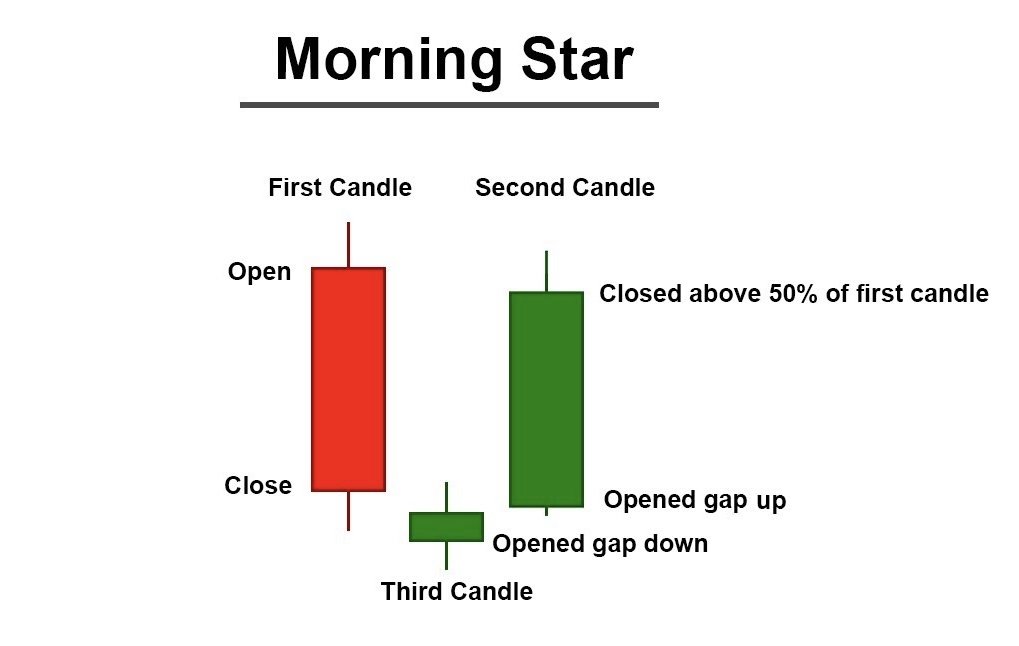
Looking at the weekly chart. We posted a Morning Star pattern. Which is known as a bullish formation.
(No we did not gap up or down like image states, but that is not needed for it to be a valid Morning Star).
What a Morning Star means: (From Investopedia)
It forms following a downward trend and indicates the start of an upward reversal. The morning pattern is a bullish pattern and signals a weakness in a downtrend that may result in a reversal. Generally, it is a very reliable pattern.
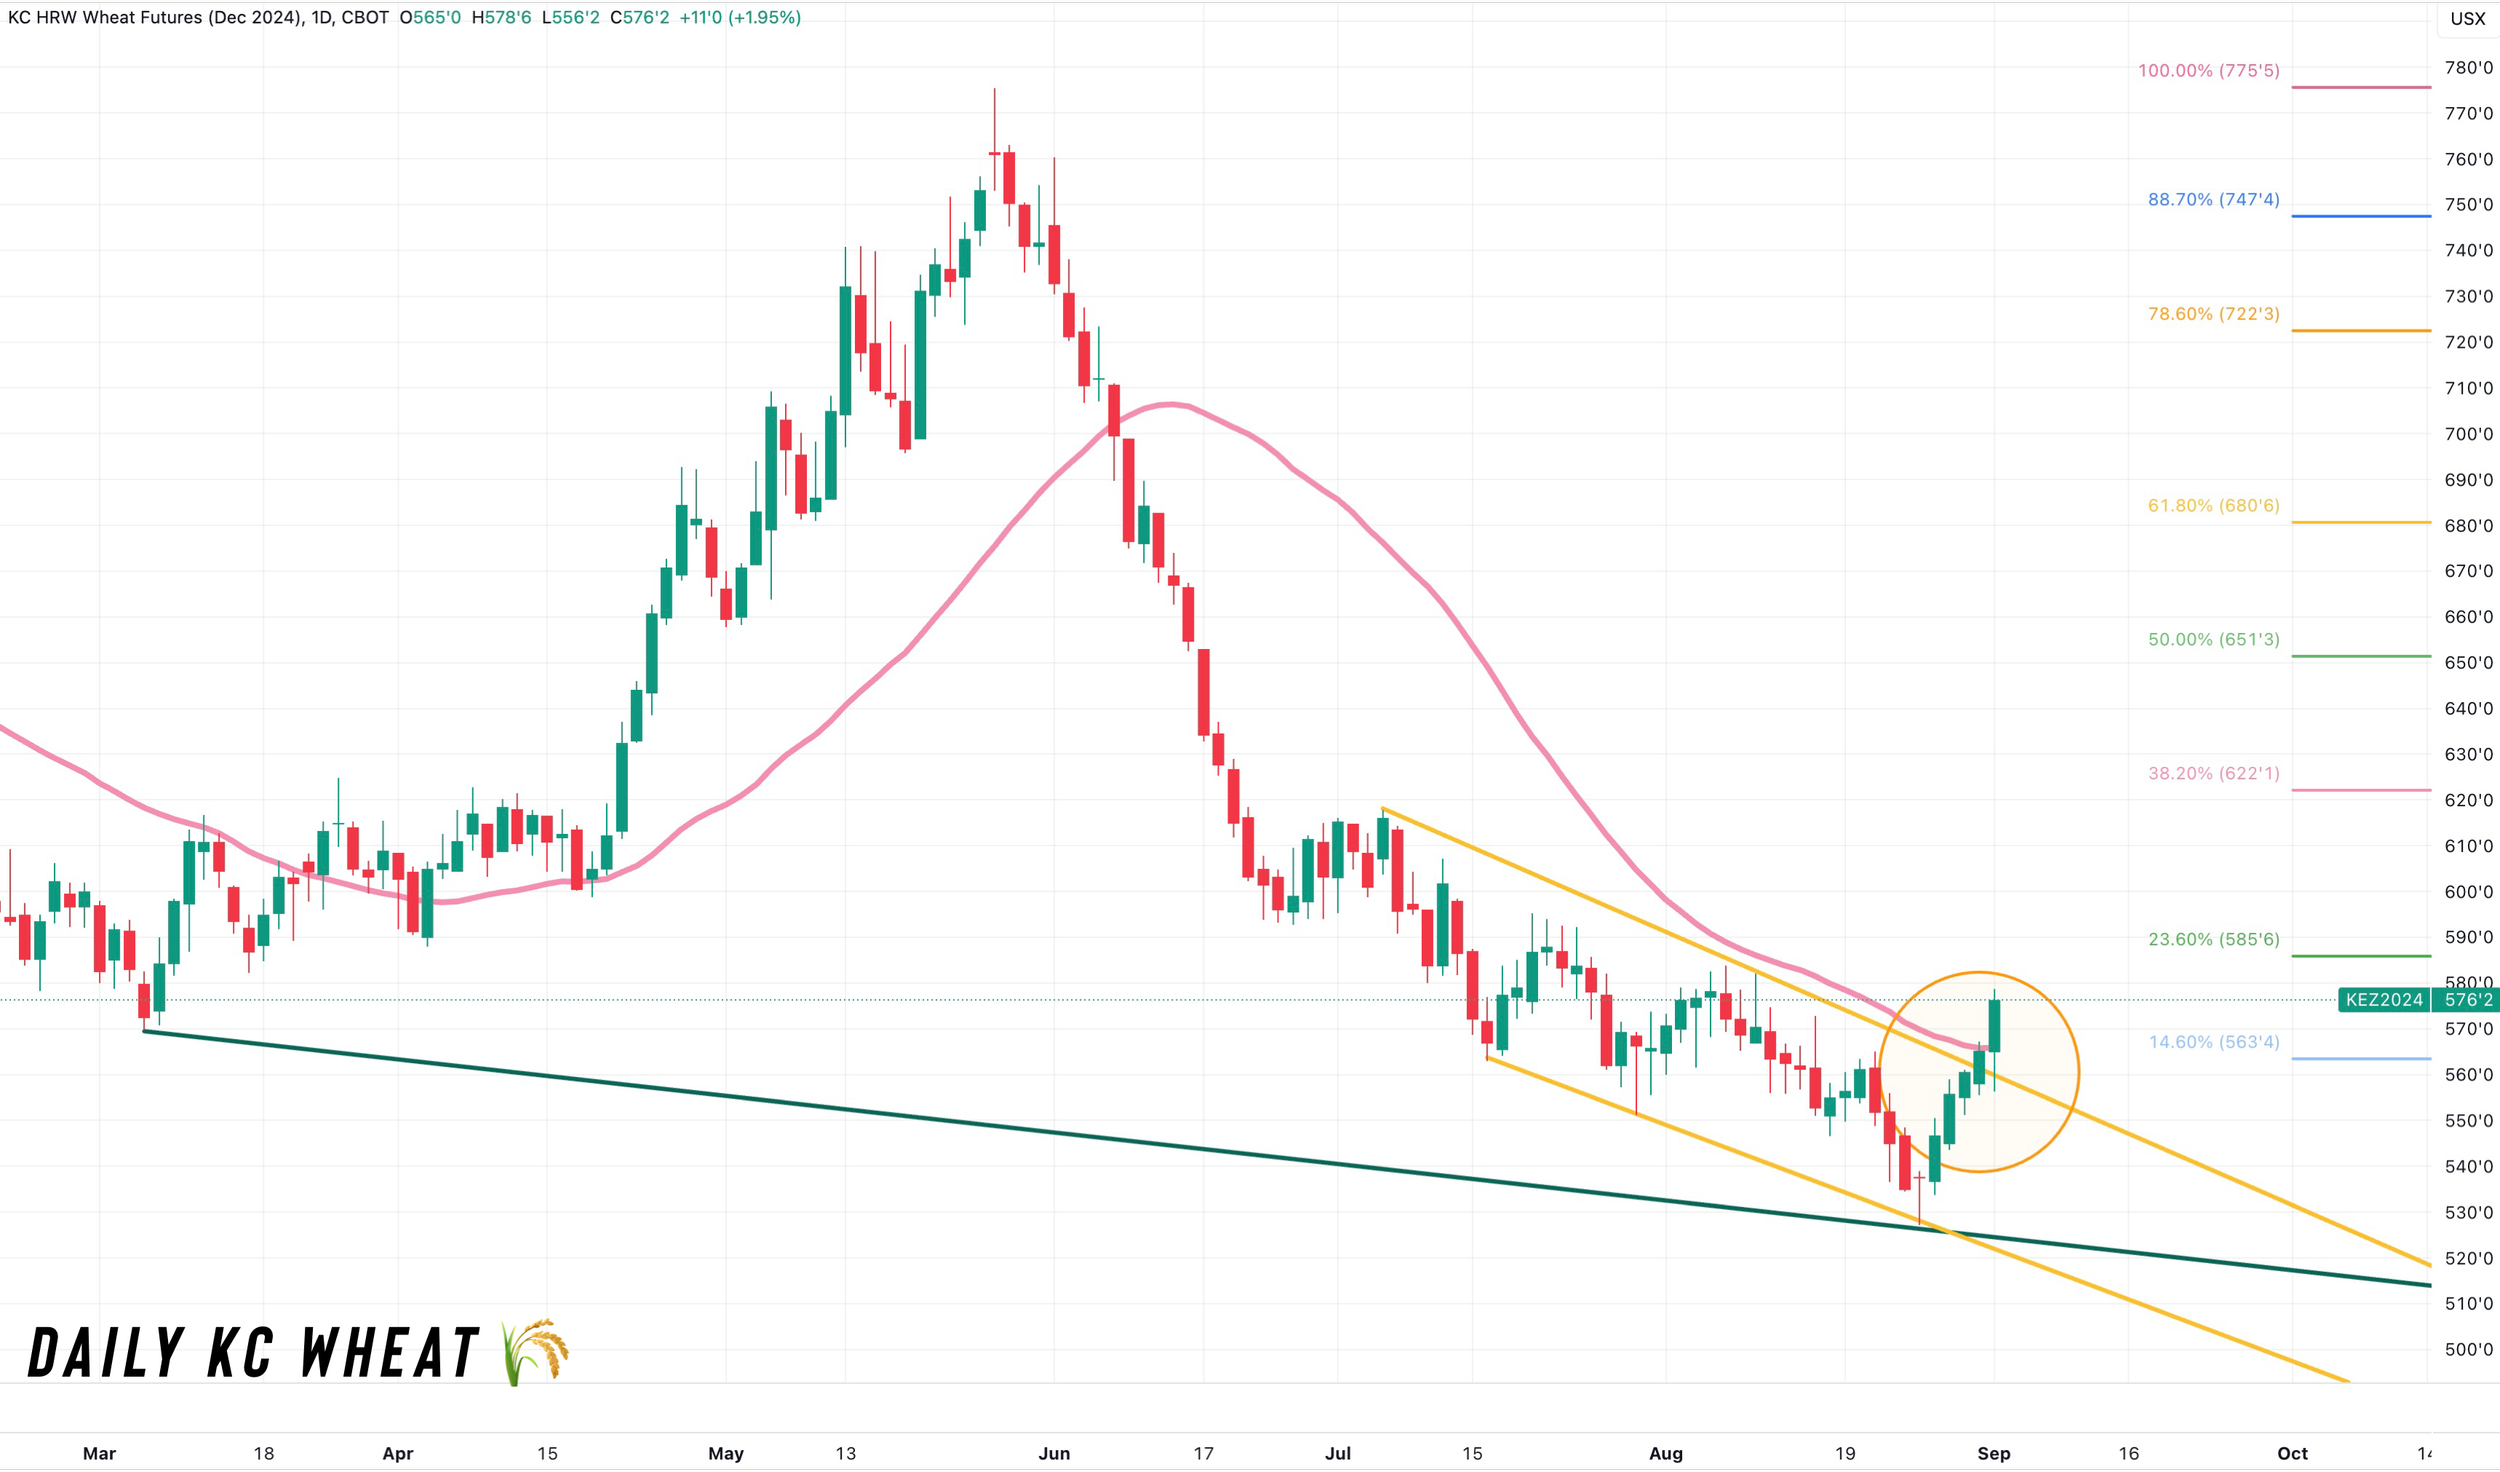
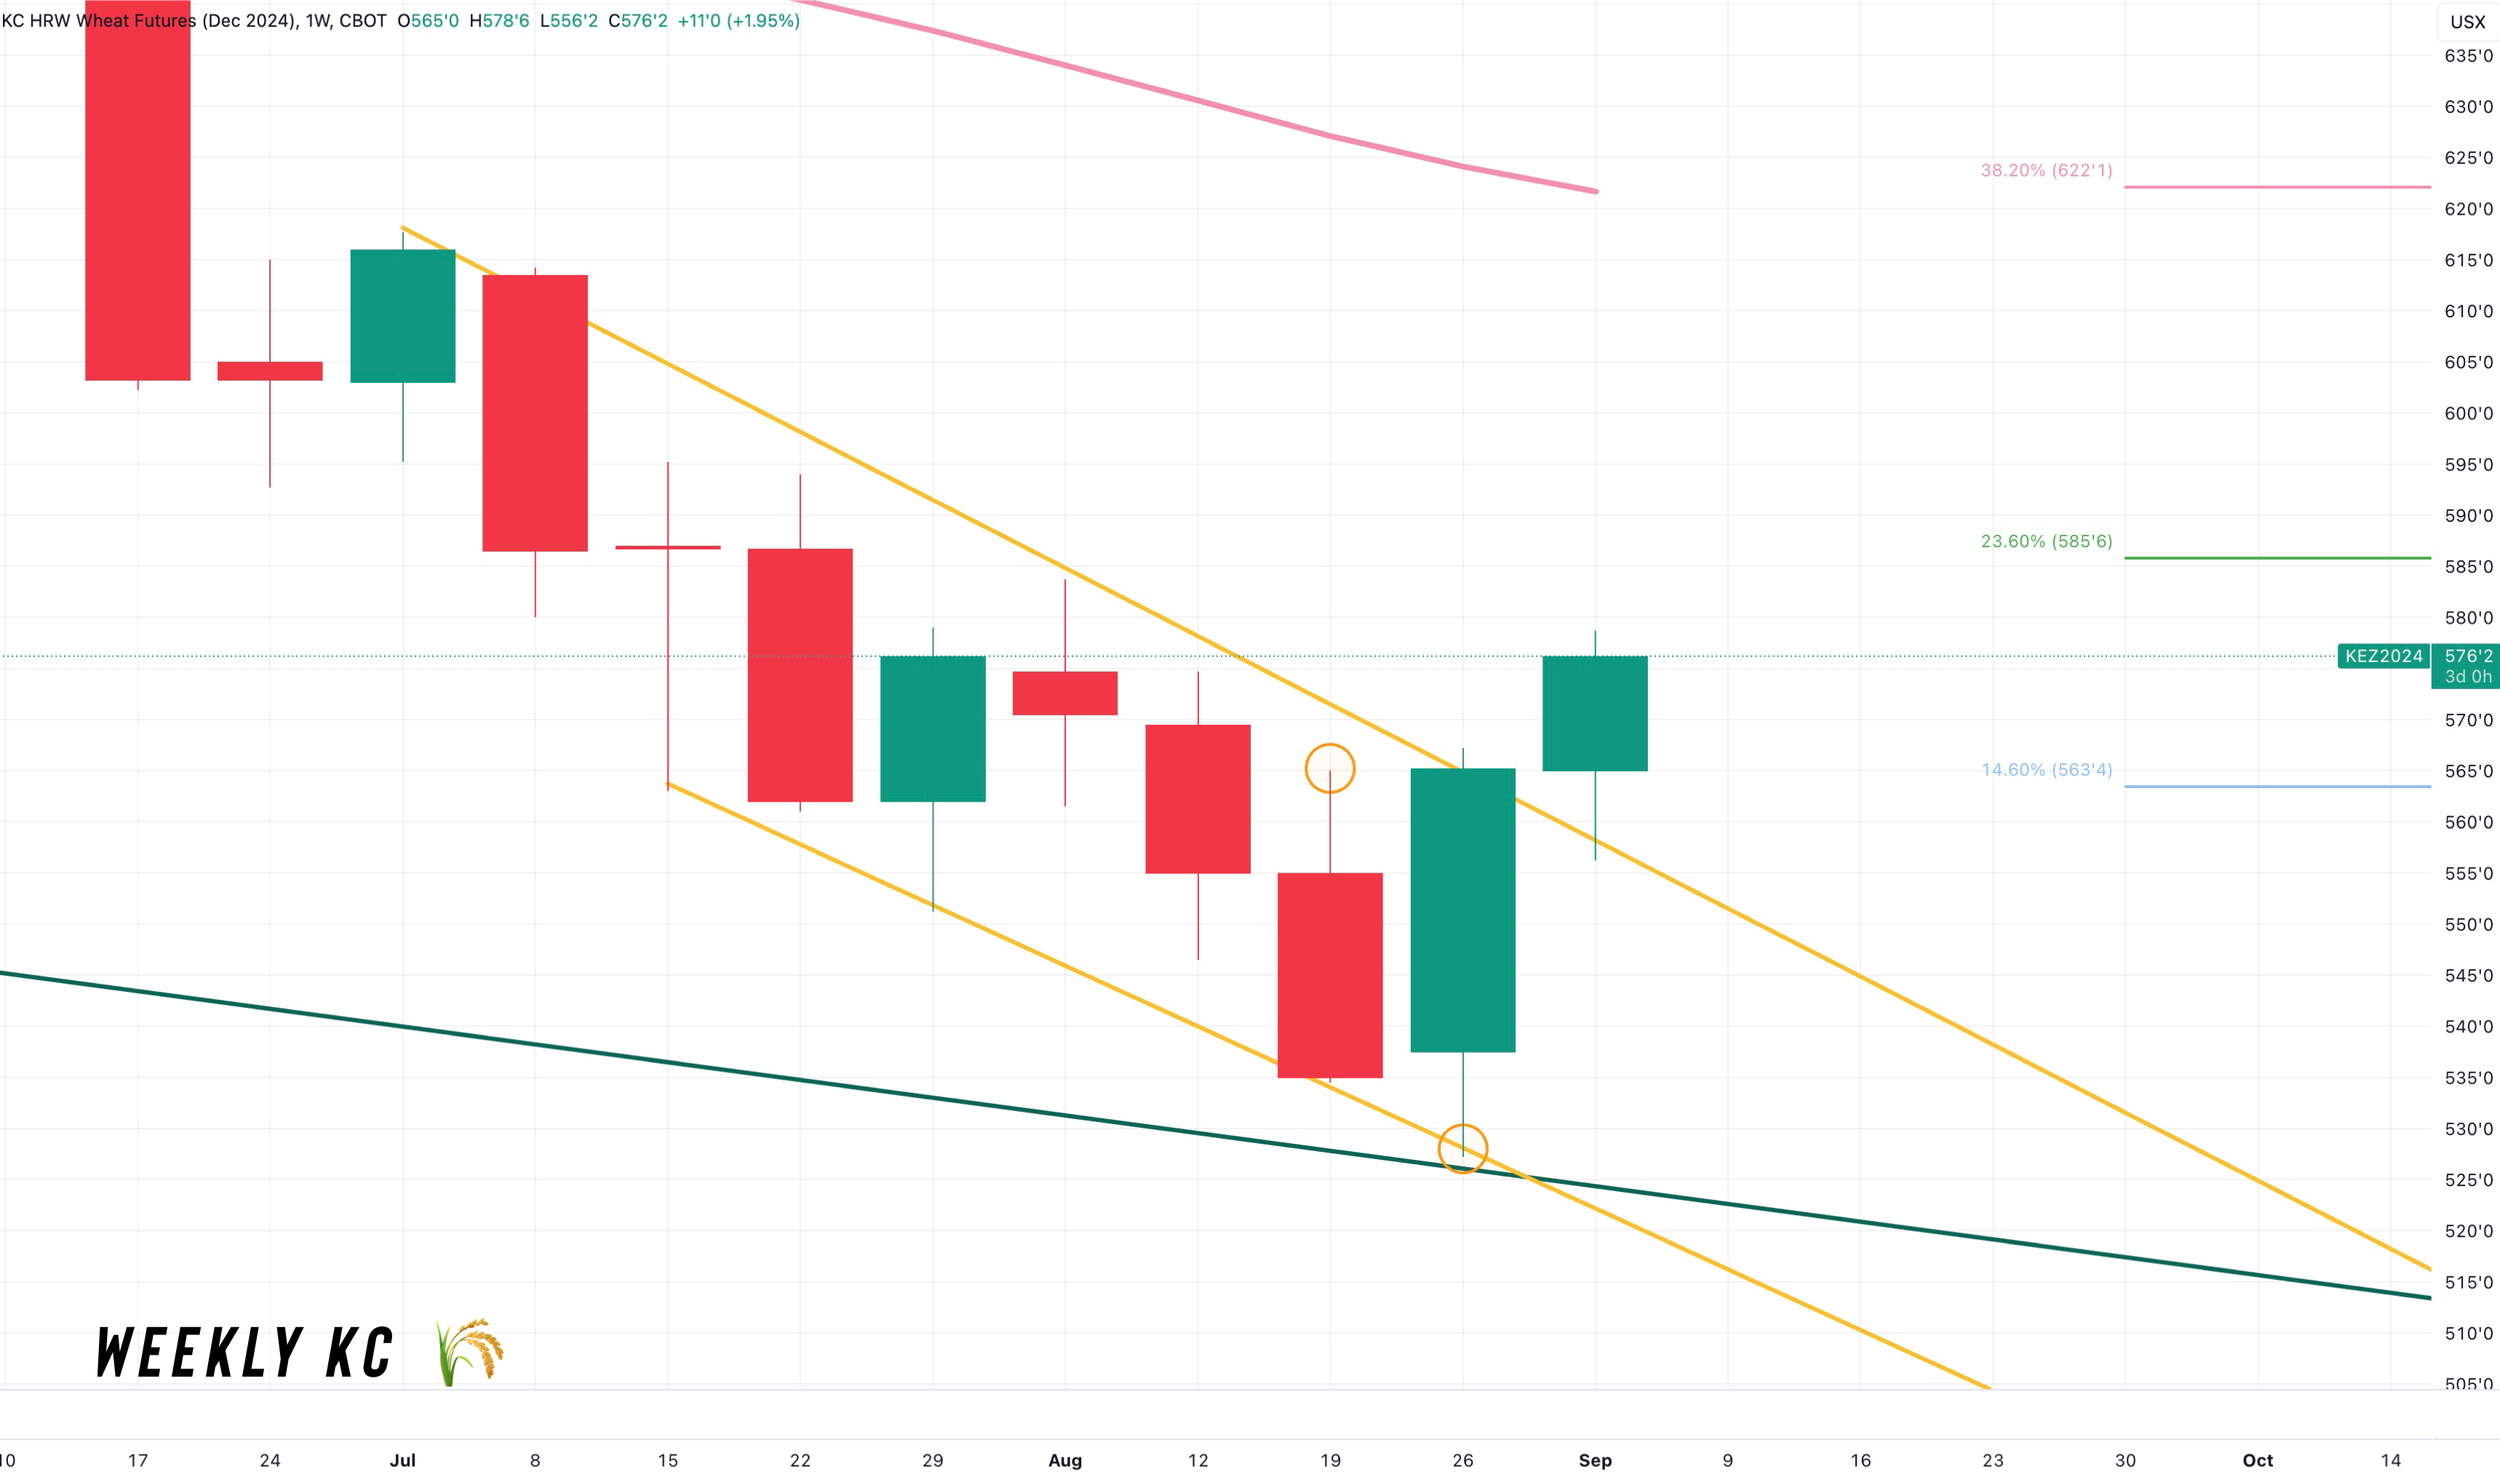
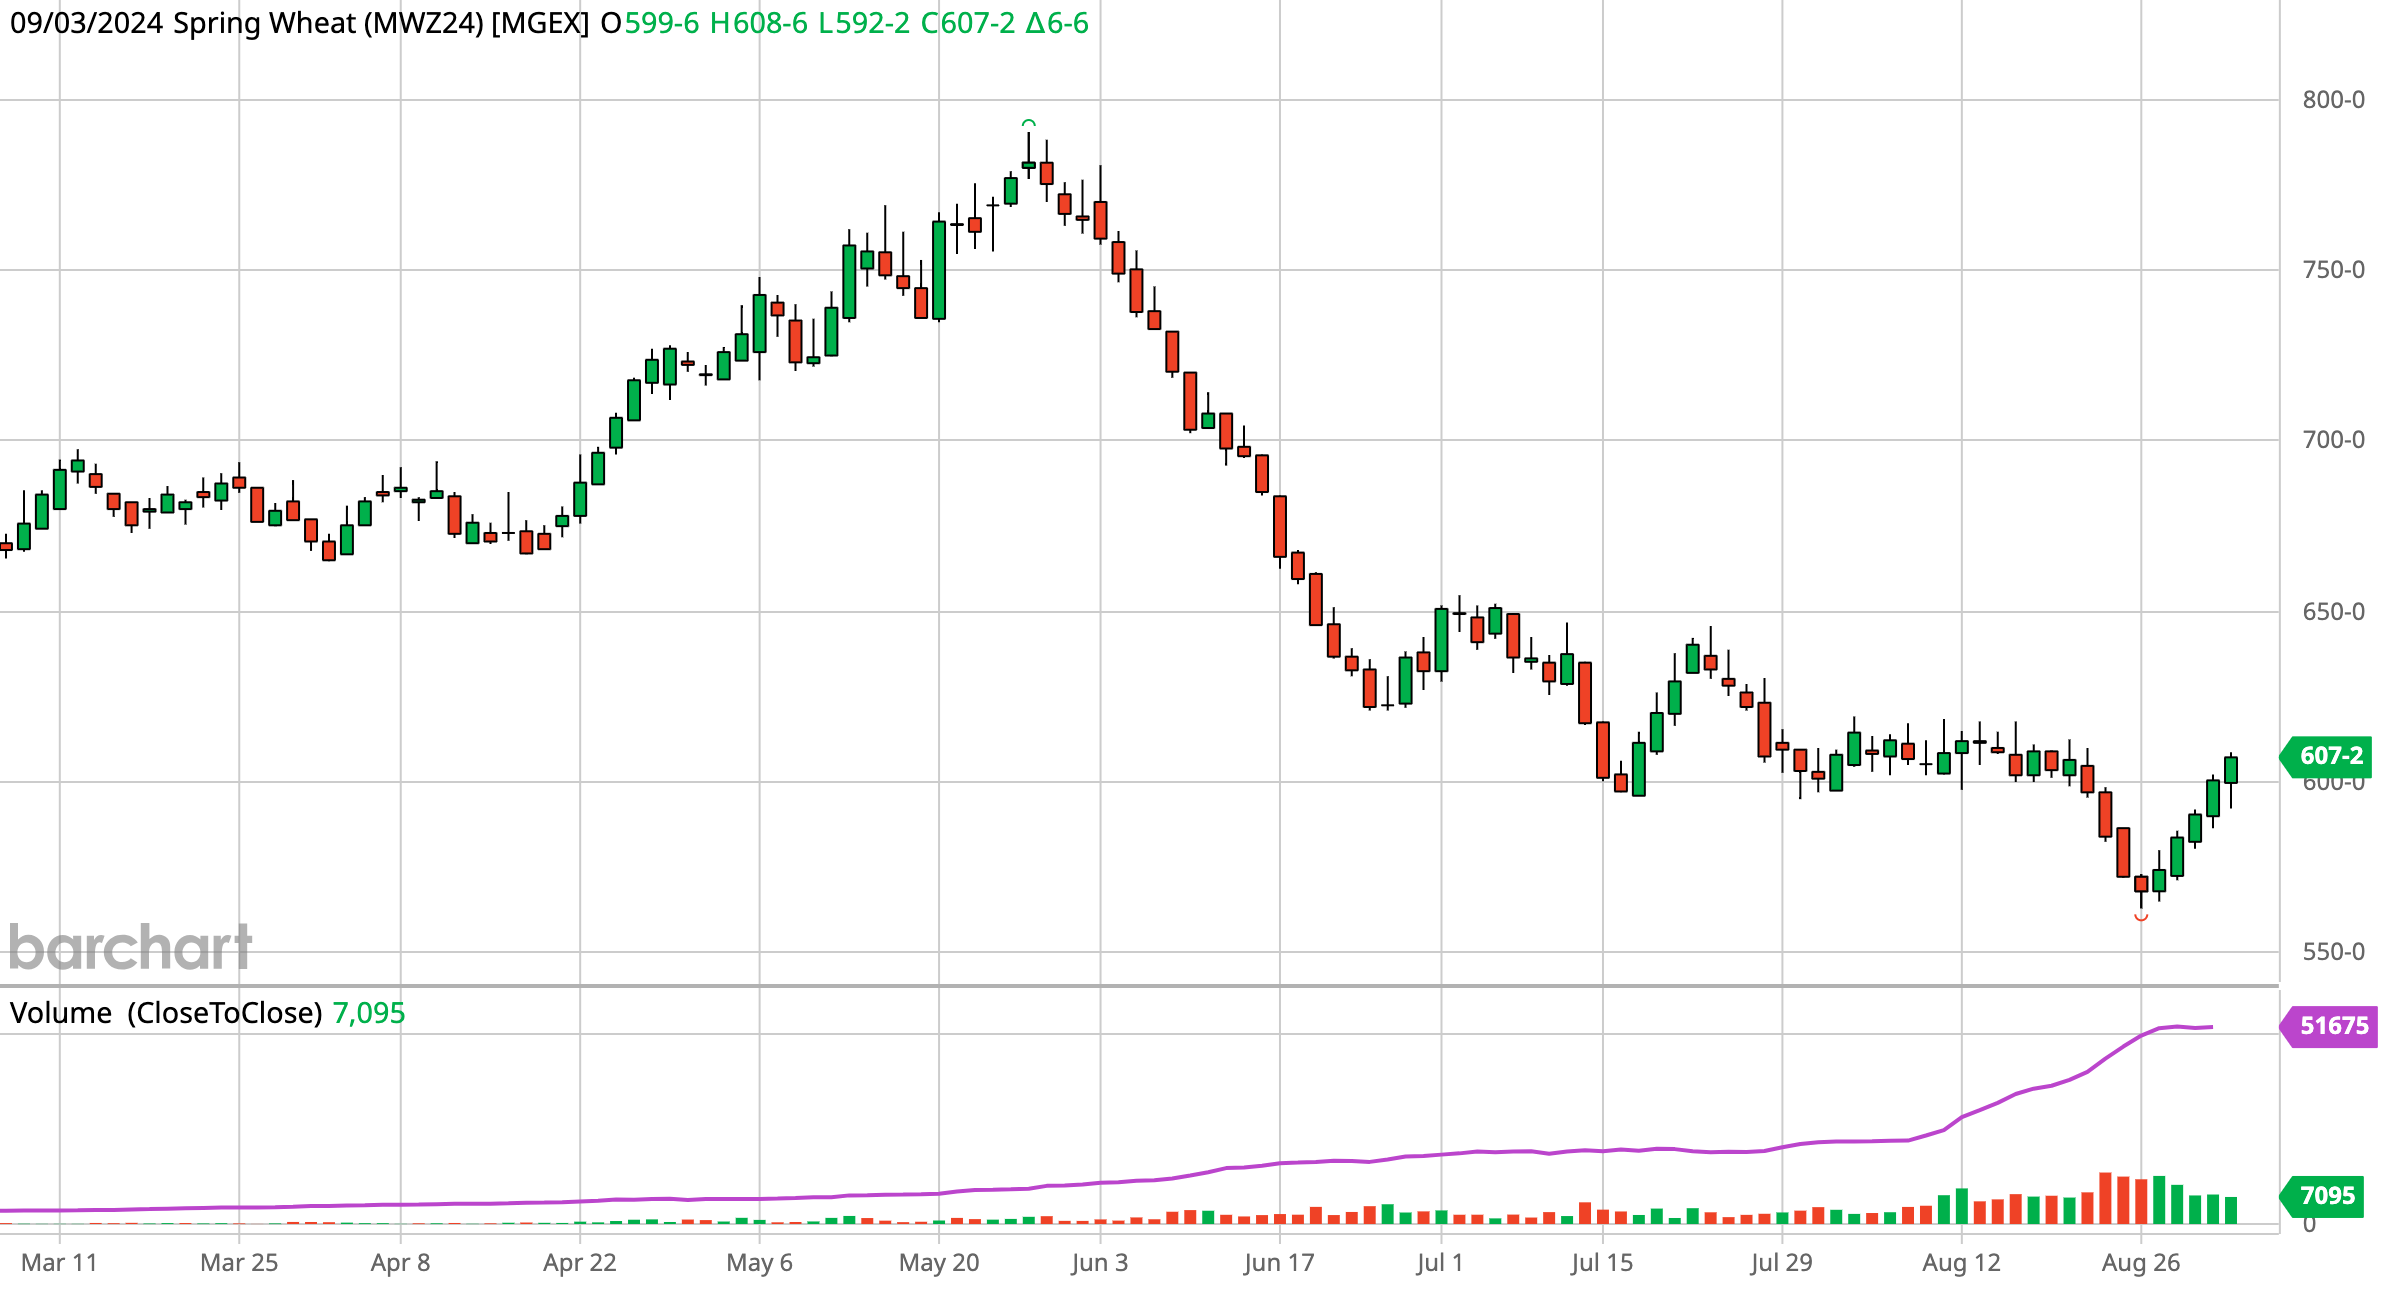
Wheat
Wheat continues to run off of it's lows. Now up nearly +50 cents in a week.
As I had been mentioning, I thought wheat would catch a bid here in the coming weeks to months. It looks like we have hopefully started that run.
Overall, we have plenty of issues globally. The European Commission lowered it's 2024 wheat production outlook by -4%. Russia has problems, Ukraine has problems, France has problems, Australia has problems.
Prices are at a point where there wheat is going to be looking at less acres here in the US.
Not much else today.
I still think we have room to run.
We got a clear breakout of that channel (yellow lines).
My first target is our July highs of $6.12 which is also our 38% retracement from our May highs. My next target is $6.40 (50% retracement).
Feeling pretty confident the bottom is probably in, but we all know just how fast wheat can turn around either direction. Would still like a break out of this range (green box) and over $5.80 to be completely certain.
Either way, the charts do look great and like clear break outs.
If you take a look at the weekly KC chart below, last week we posted a bullish key reversal higher. A good sign.
If you have unpriced grain still, this rally did make puts cheaper if you want to consider those even though I see us going higher.
Recommendation Last Wednesday:
"For those that sold off the combine, it might not be a bad idea to look to re-own here with futures/options. Call Jeremey for specific risk management & various strategies."
This recommendation still might be okay for some of you, but do not go out chasing. As this was 30 cents ago. This is heavily dependent on your situation and goals.
Daily Dec Chicago
Daily Dec KC
Weekly Dec KC
Daily Dec MPLS
MPLS wheat also breaking out.
This chart could easily see $6.50 in my opinion which was our July highs.
Want to Talk?
Our phones are open 24/7 for you guys if you ever need anything or want to discuss your operation.
Hedge Account
Interested in a hedge account? Use the link below to set up an account or shoot Jeremey a call at (605)295-3100.
Check Out Past Updates
8/30/24
ANOTHER STRONG DAY. GETTING MORE CONFIDENT BUT NO CONFIRMATION
8/29/24
CHANCE FOR A BOTTOM, BUT STILL CAUTIOUS. DIFFERENT MARKETING APPROACHES
8/28/24
WHEAT FOLLOW THROUGH WHILE CORN & BEANS GIVE BACK
8/27/24
DECENT PRICE ACTION. BASIS CONTRACTS. ROLLING VS FUTURES. NOT FALLING FOR BIG AG TRAP
8/26/24
FIRST NOTICE DAY PRESSURE & CROP TOUR RECAP
8/23/24
CROP TOUR SHOWS MASSIVE BEAN YIELD
8/22/24
UGLY DAY FOR WHEAT & BEANS, STILL RISK, CROP TOURS, CAPTURING CARRY
8/21/24
CROP TOUR DAY 3. NOT HUGE MOVEMENT
8/20/24
CROP TOUR SO FAR & COMPARISON TO USDA
8/19/24
CROP TOUR BOUNCE
8/16/24
RISK REMAINS LOWER. MANAGE YOUR RISK
8/15/24
DEMAND, BIG US CROPS & BRAZIL DROUGHT
8/14/24
DEAD CAT BOUNCE
8/13/24
POST USDA SELL OFF
8/12/24
USDA REPORT: BEARISH BEANS. SMALLER CORN CARRYOUT & RECORD YIELDS
8/9/24
USDA REPORT MONDAY
8/7/24
HUGE USDA REPORT MONDAY
8/6/24
WHEAT UNDERVALUED? CORN YIELD? WHAT TO DO WITH GRAIN OFF COMBINE
8/5/24
GRAINS STRONG WHILE WORLD PANICS
8/2/24
GRAINS RALLY, YIELD ESTIMATES, CHINA STARTS TO BUY
8/1/24