USDA GARBAGE ASSUMPTIONS
WEEKLY GRAIN NEWSLETTER
Here are some not so fearless comments for www.dailymarketminute.com
In honor of Mother's Day, I would like to begin this newsletter by extending my heartfelt wishes to my own mother, my wife, and all the incredible mothers out there. Today, we take a moment to express our gratitude and appreciation for the unwavering support provided by these extraordinary women. While we often acknowledge farmers as the backbone of America and the world, it is important to recognize that behind every farmer stands a mother and a wife, offering unparalleled encouragement and understanding. These remarkable women not only contribute to the noble cause of feeding the world but also embody the same level of commitment and devotion to their own families. Therefore, I would like to extend a special thank you to all the mothers and wives who stand beside the pillars of strength, making our world possible.
USDA Report
Friday the USDA gave plenty of information, most of which as Darin Newsom, the former advisor for DTN and present advisor for Barchart, has pointed out for years is simply garbage assumptions. I know every time I assume something both my mother and my wife are quick to remind me what assuming does.
If you look at history, one can easily remember that the USDA has a history of making an “ass” out of themselves. They have also done a good job of scaring farmers into making cheap grain sales, leaving them feeling, while you can assume what I mean.
All kidding and joking aside, the USDA report gave corn and bean bears plenty of new crop carryout to open the door to lower prices. But the reality is that they left the market with a big negative headline news that really doesn’t mean much.
The USDA didn’t update acres nor yields, and made all of these demand assumptions based on production. Which assumes a perfectly well behaved “Mother Nature”. She isn’t like the mom’s and wives I mentioned above. She is rather volatile as shown several times in several areas the past several years.
She can behave and act perfectly, but she is more likely to act like a Katy Perry song, being hot and then cold, yes and then no.
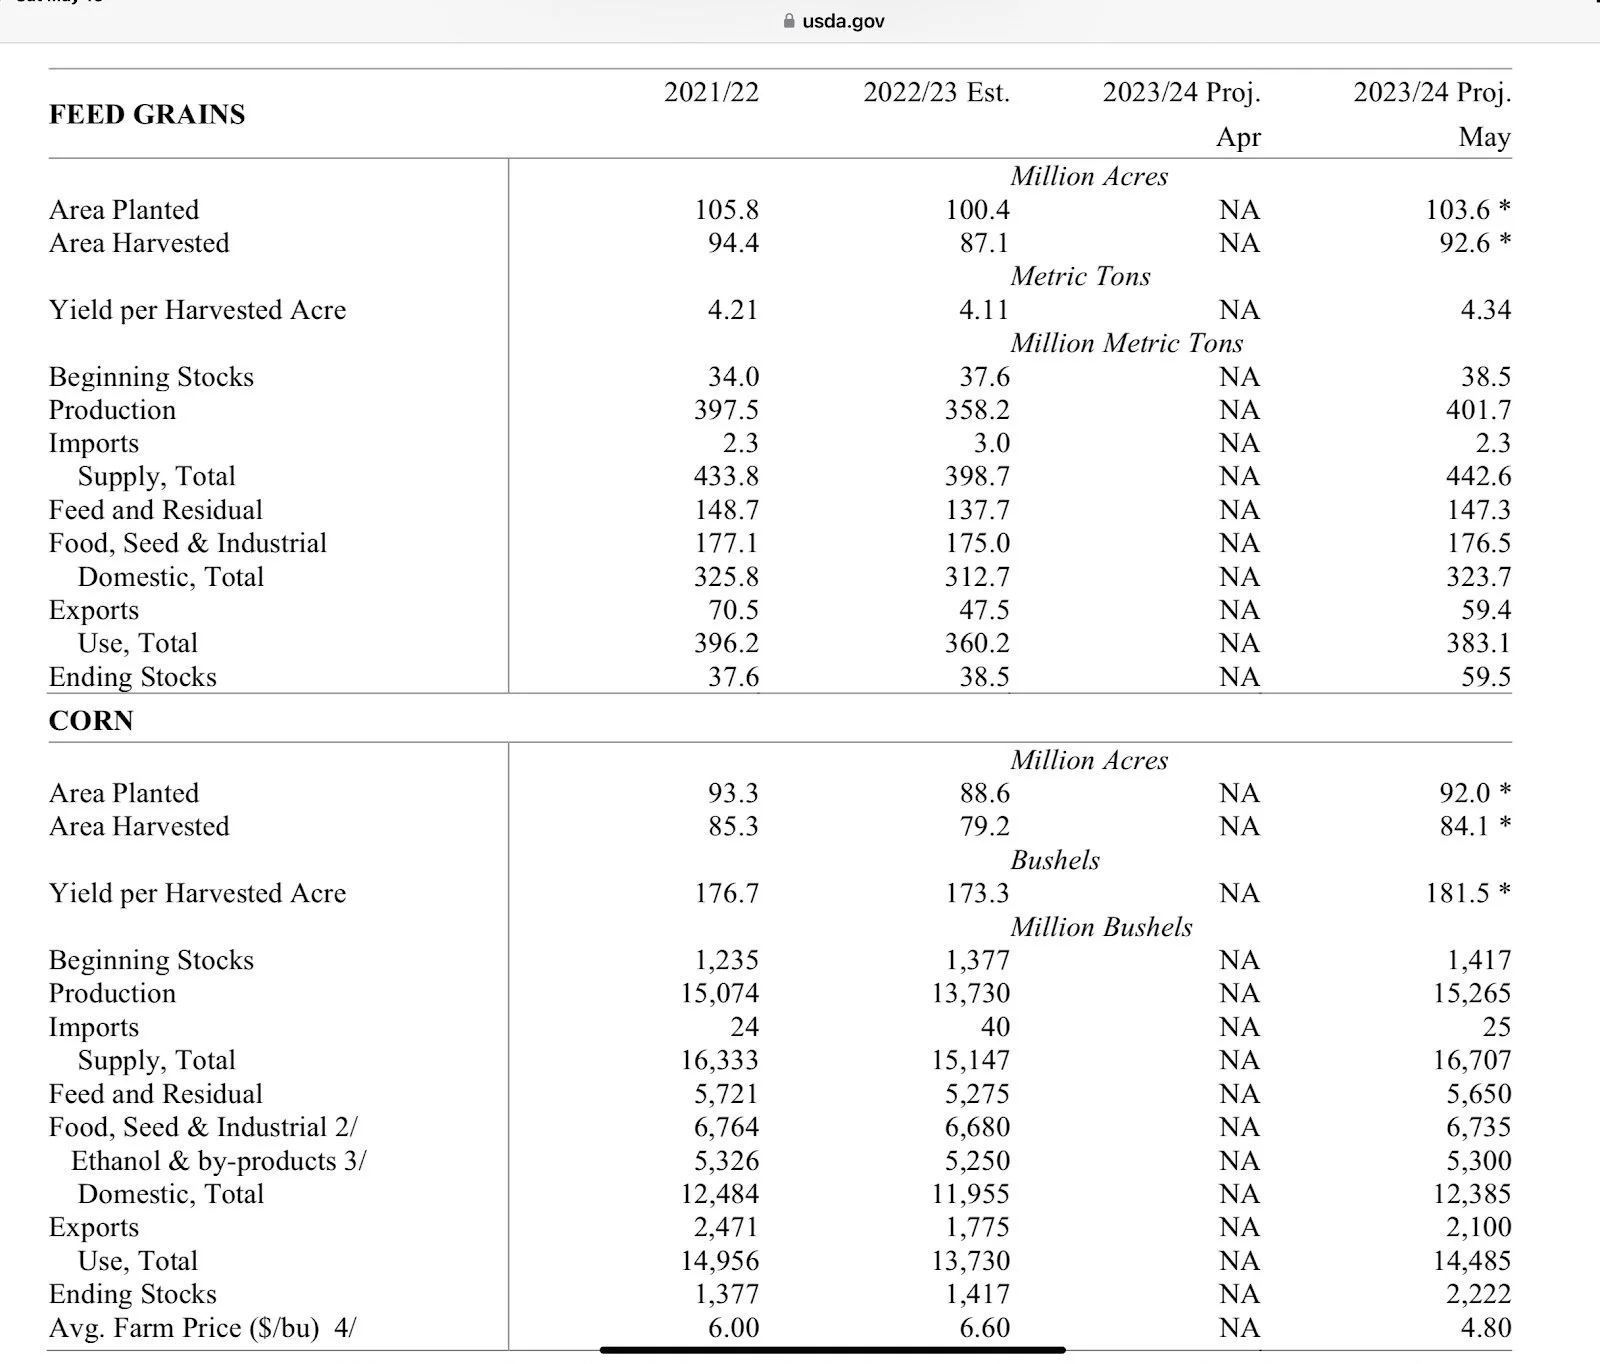
Below is the USDA corn breakdown. If you look under the corn section you will notice yields in 21 of 176.7, followed by a 173.3 this past year, and topping it off is the 181.5 record projection for the crop that;s about ⅔ or so planted.
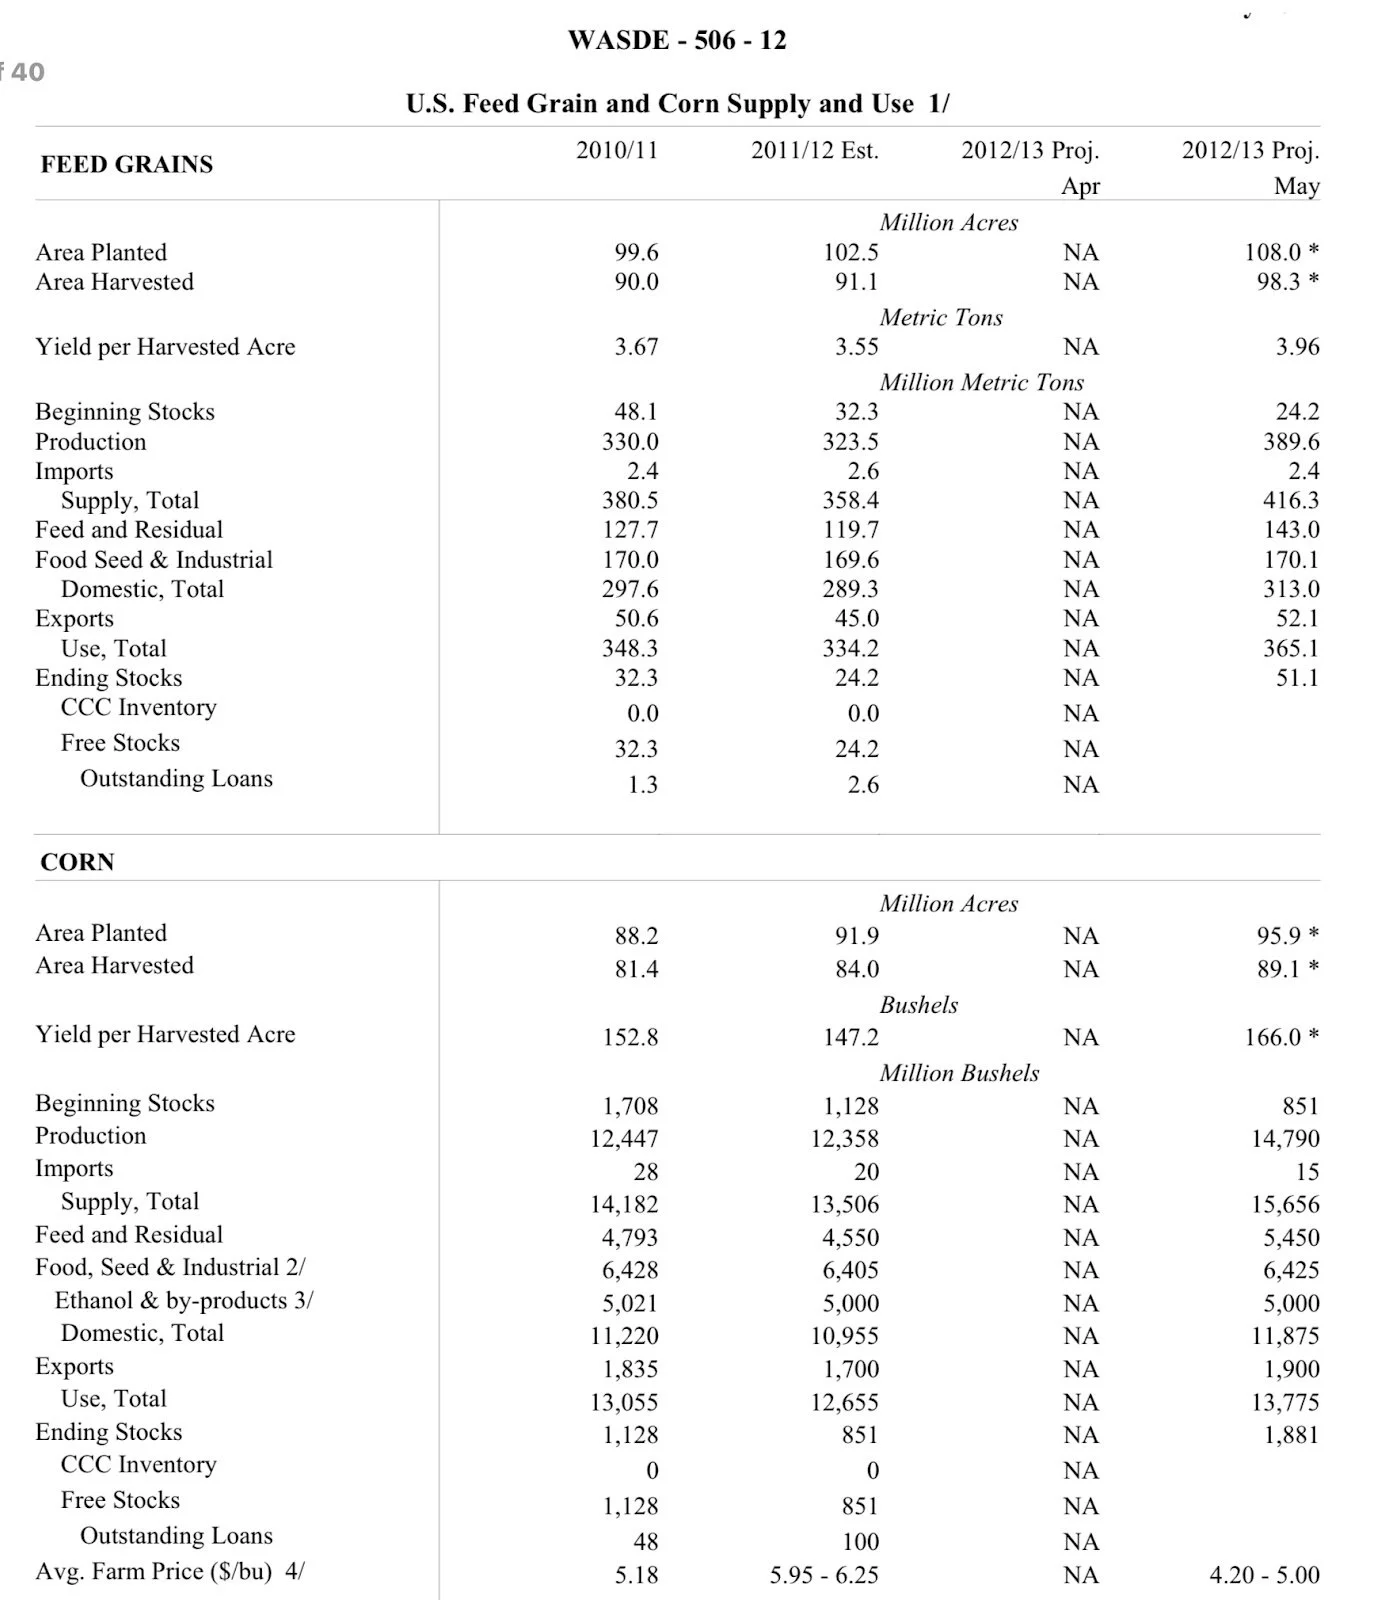
If you look at the second graph it is from the USDA Report in May of 2012. Notice the trend in yields with 2010 having a 152.8 followed by 5 bu or so less, while the USDA was assuming a record crop of 166. Most remember how that turned out, but for those that don’t it was a yield of 123.4.
I bring this up as it is very typical for the USDA to make assumptions that once in a while, (maybe most of the time) make them look like they have zero clue. They do have some clue, but they also have some motivation to help keep food costs and grain prices down. So naturally they have a bearish skew.
Take as example the May 2020 report, where the USDA printed a carryout of 3.3 billion bushels. It ended up at 1.235 billion bushel carryout, around 2 billion less than the first estimate. Part of the reasoning was COVID, part of the reasoning right now is the fear of a recession.
The point being that we should never take a May USDA projection for new crop production or carryout to be gospel. What we should do is realize that many traders and fund managers do consider these garbage headlines. But the reality is that these printed numbers don’t have much to stand on and sometimes lack reality and reason, they have a bias towards lower prices and are supported by Big Ag’s attempt to help buy cheap grain.
USDA Assumptions
Here are some visual aids as to why the USDA numbers are garbage assumptions.
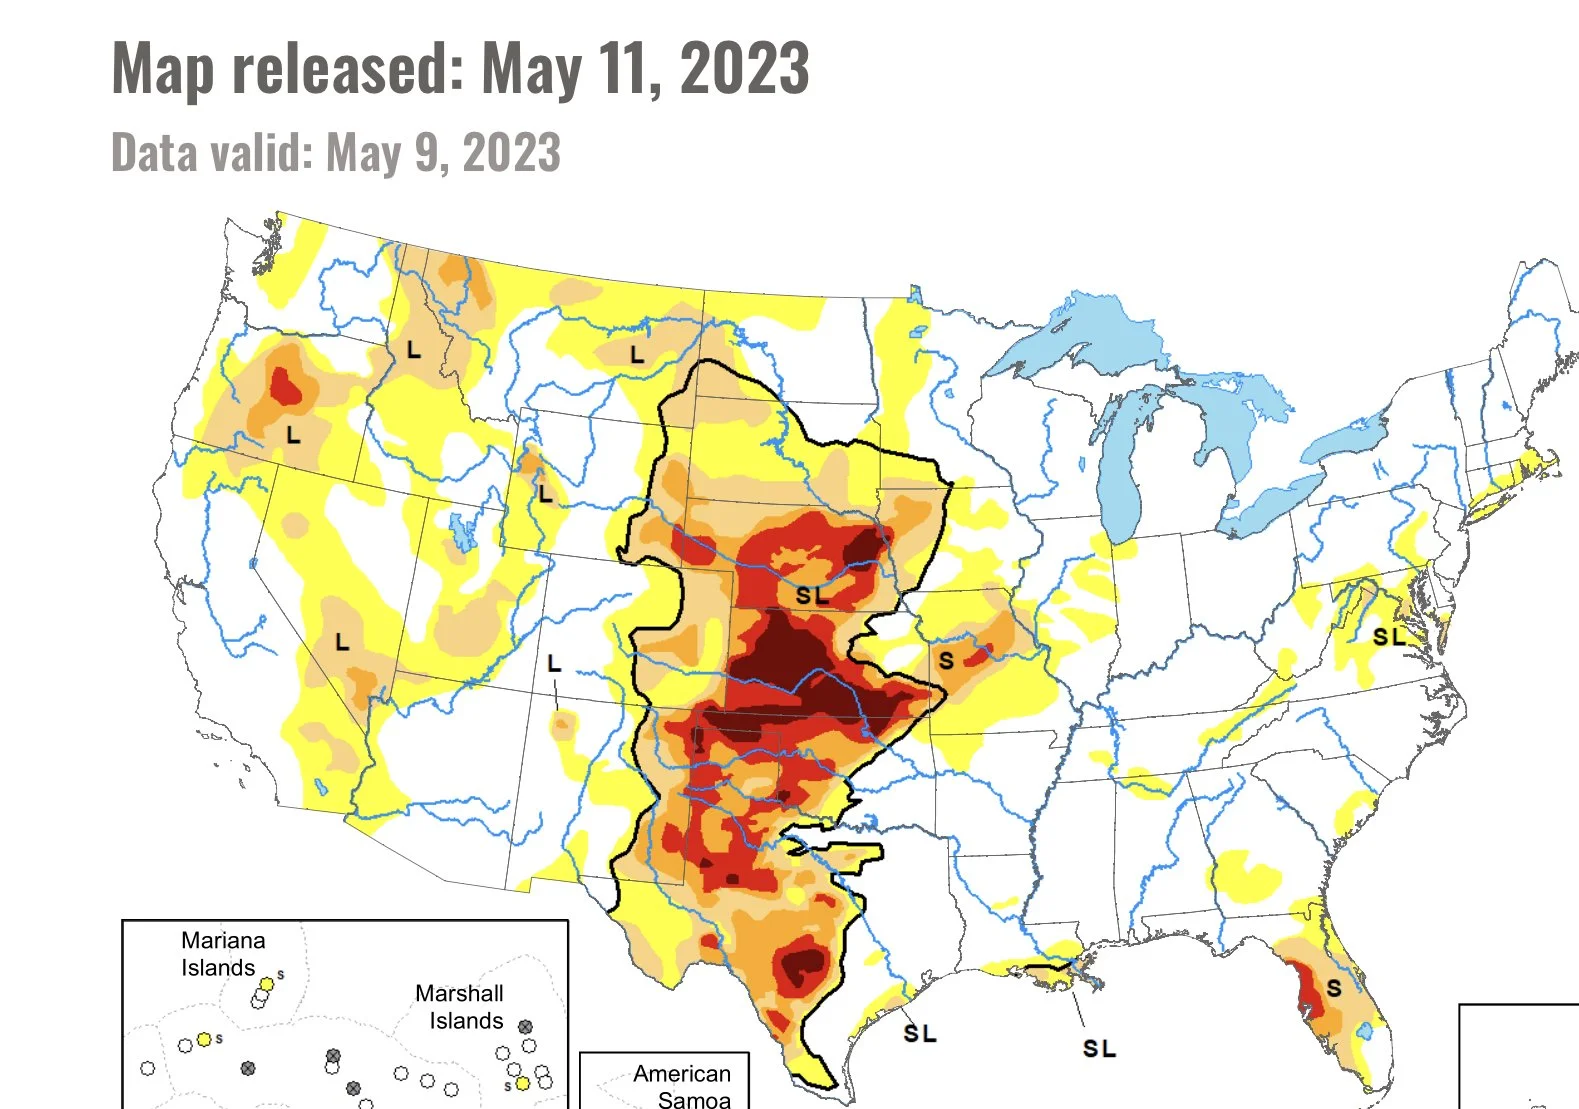
Here is USDA Present drought monitor.
Here is a 2012 from the same week, we are in a much worse situation than 11 years ago.
Notice the red in Iowa and how it has spread into Illinois.
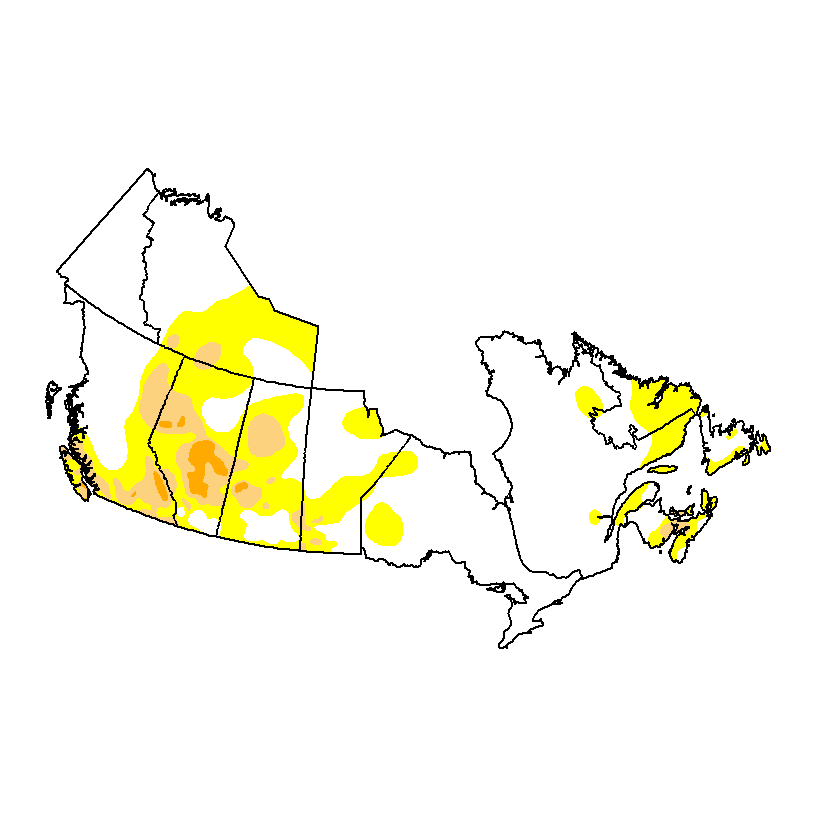
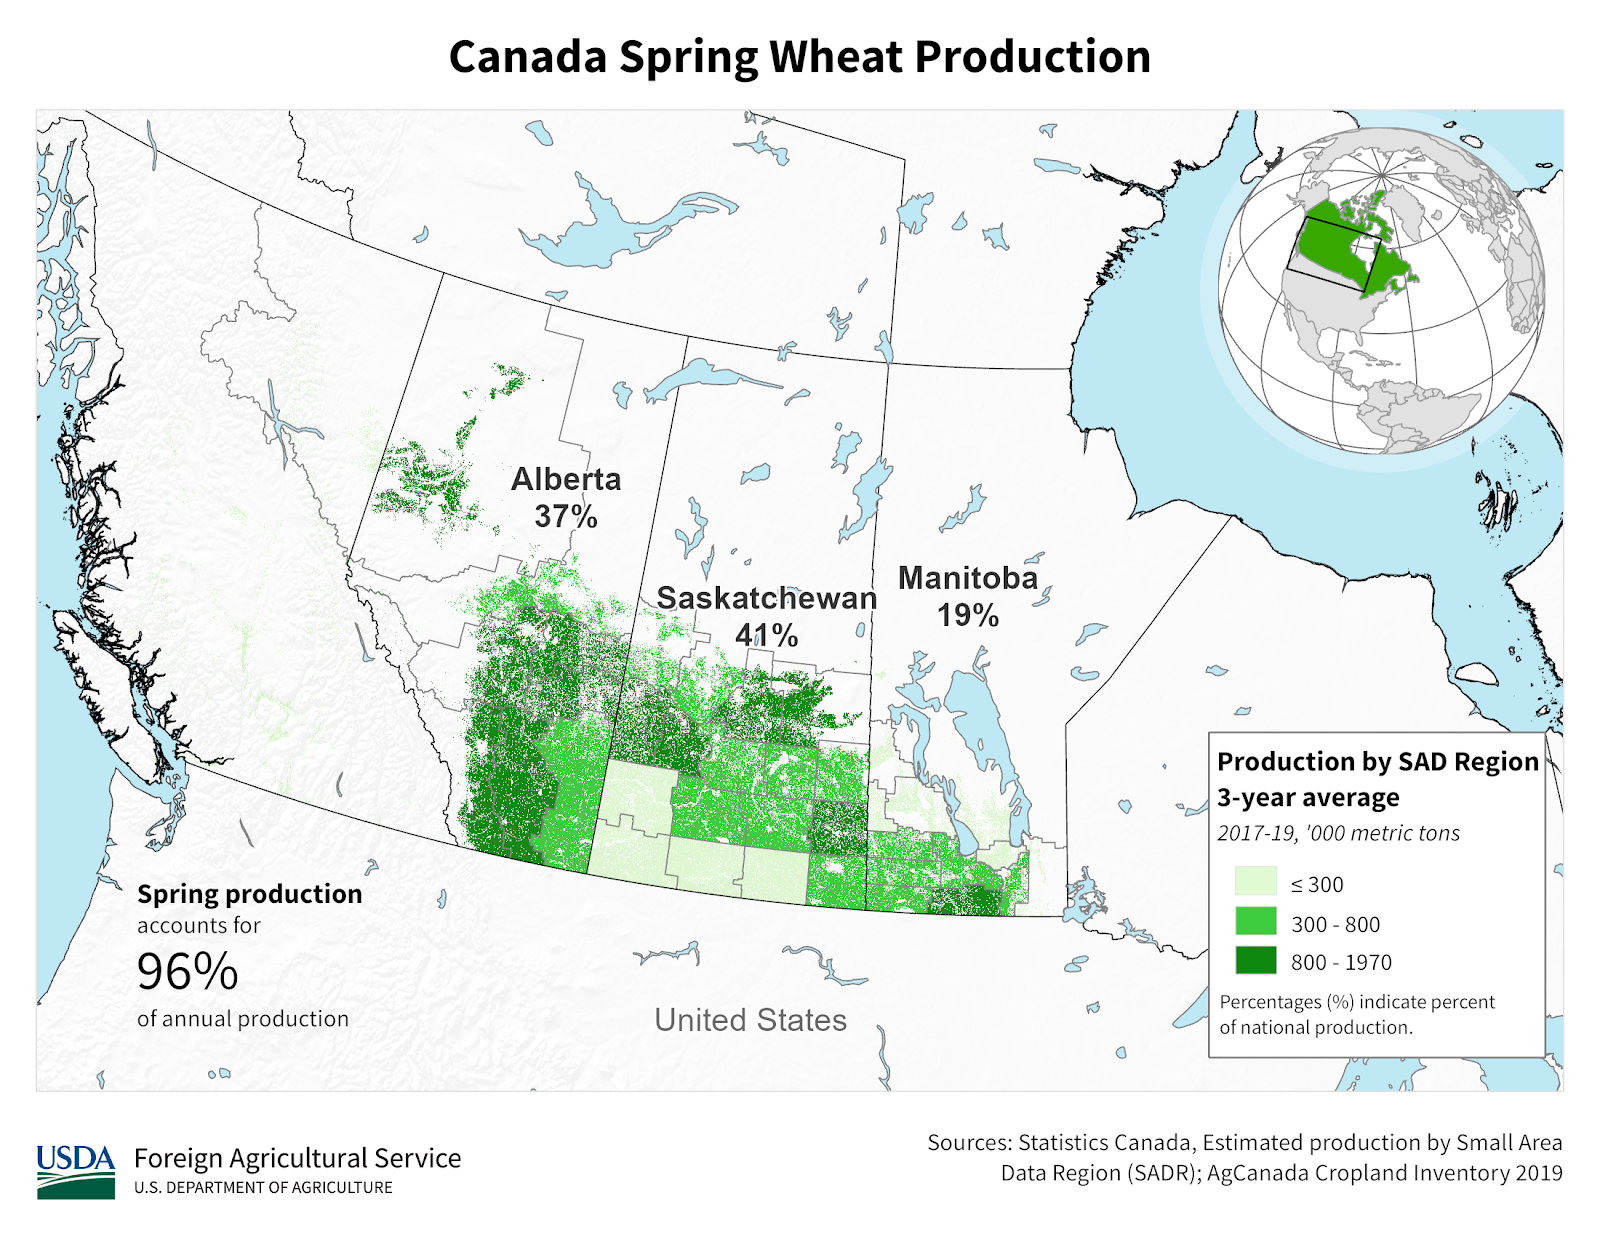
Something that is also a little early to be watching is Canada wheat production. Here is where it is produced and Canada drought monitor.
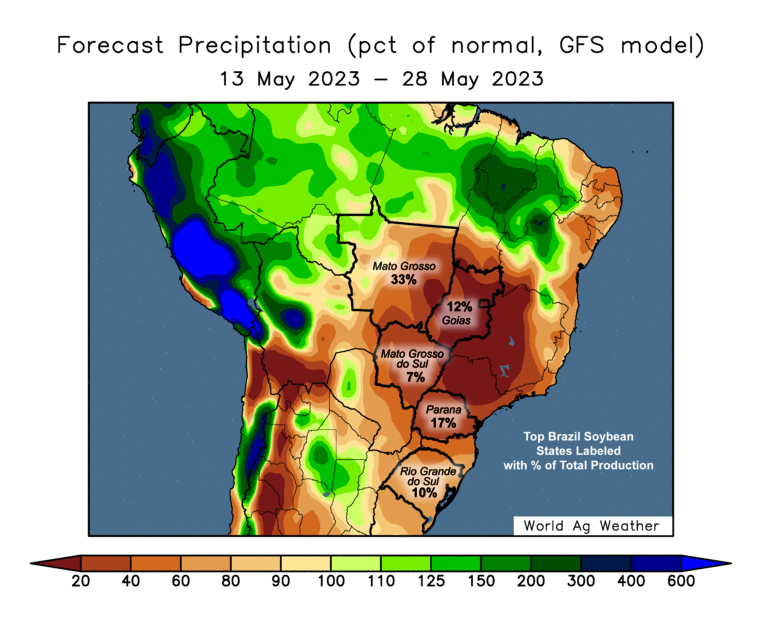
Here is the precipitation for the past 30 days in Brazil. Much of the second corn crop was planted late. You will notice some areas that have got some moisture. Keep in mind this is very sandy soil.
Here is the 15 day forecast. That doesn’t help finish a crop out. The USDA did increase Brazil production yesterday. I think they jumped the gun here too. So has China when canceling corn from the US. They might get burned if we get dry and Brazil stays dry.
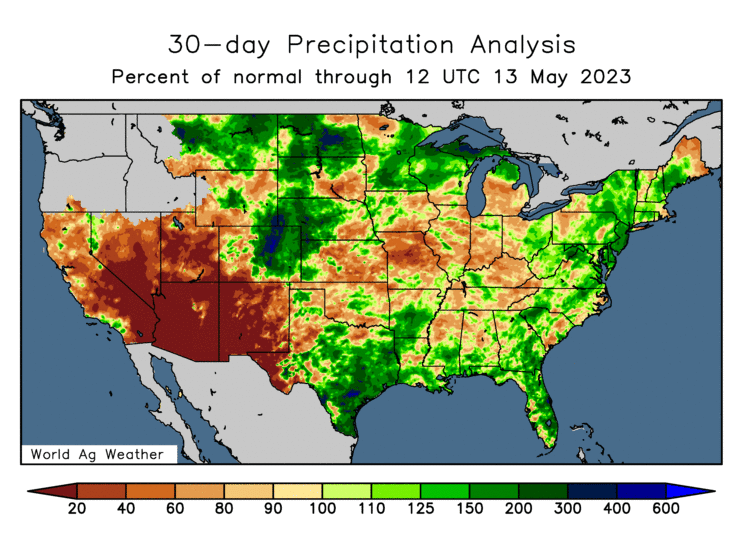
Here are the past 30 days of precipitation in the US. It helps tell the story of why we are behind planting in the Northern plains, and tells why we are ahead in the I states.
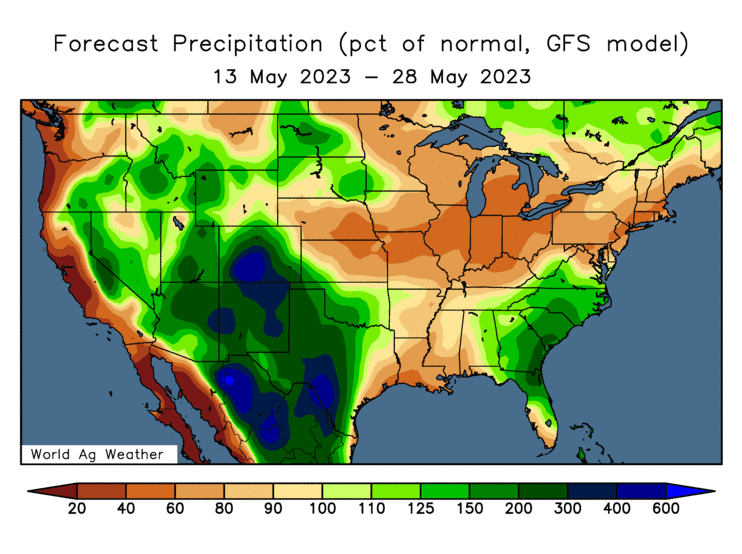
Here is a 15 day forecast, just notice the I states.
Here is 7 day precip forecast.
Notice Canada
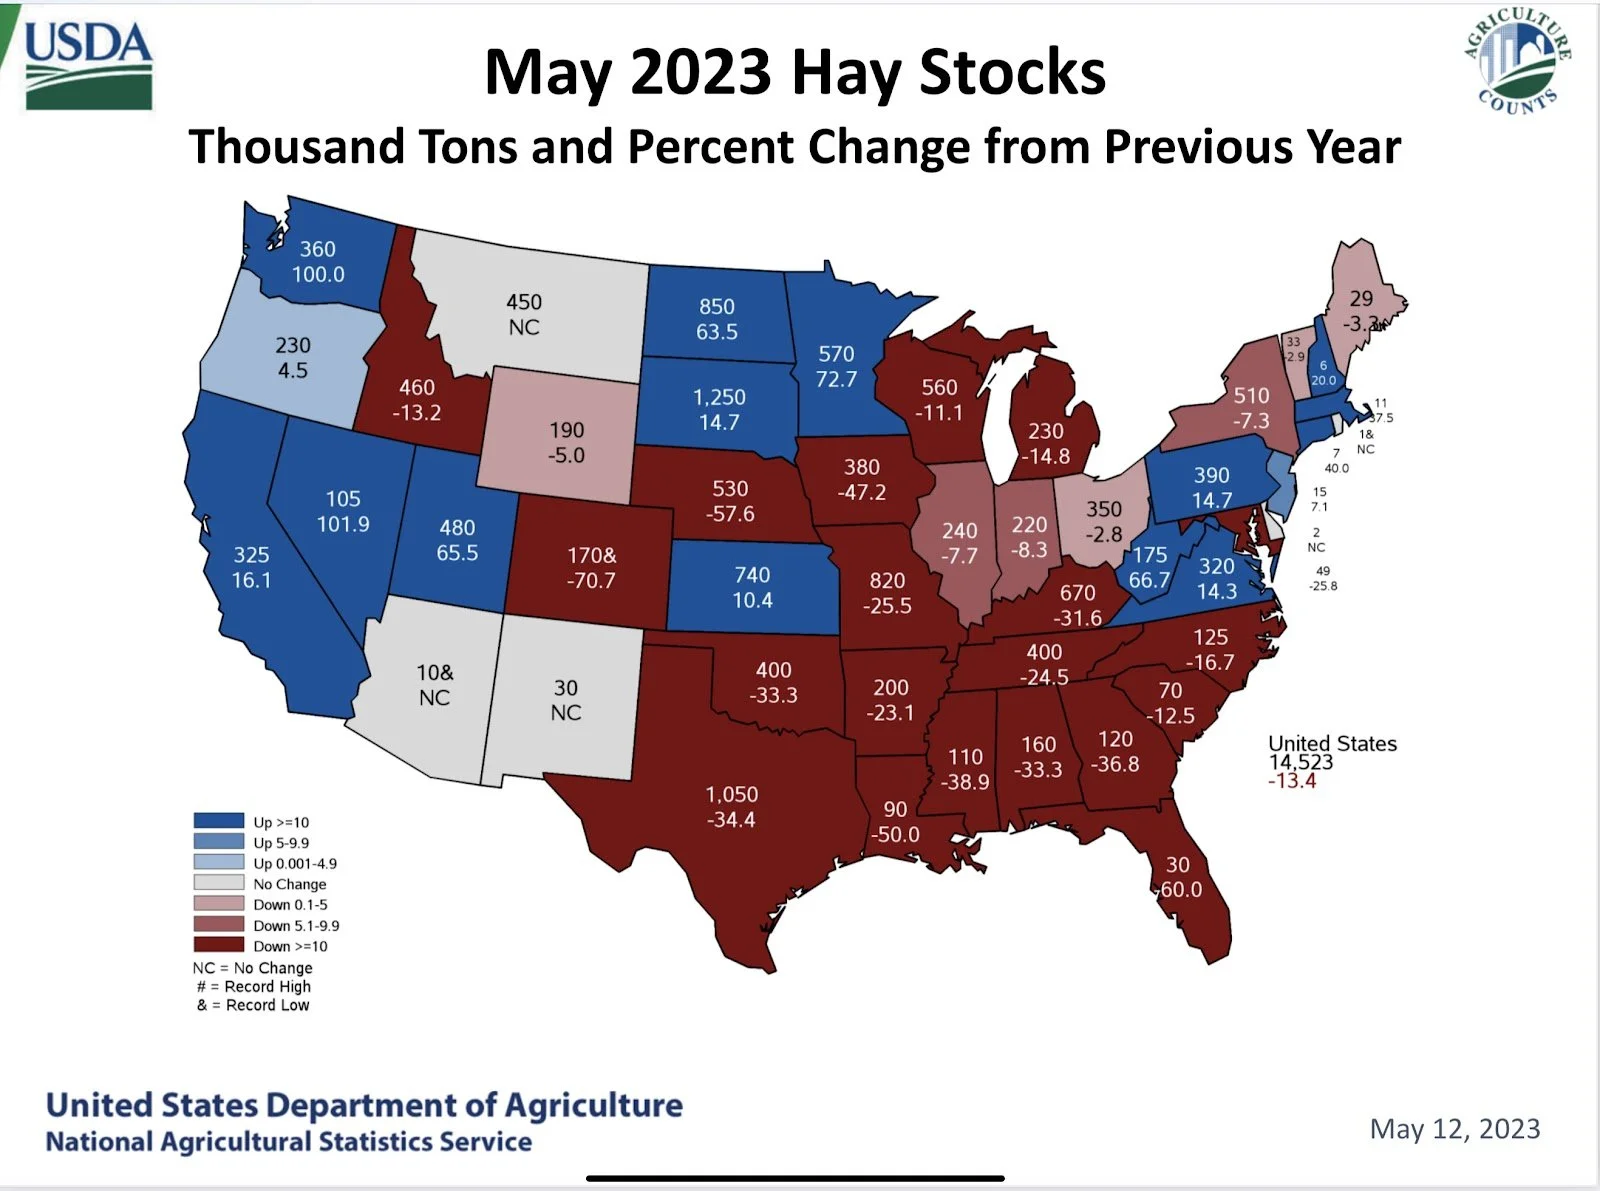
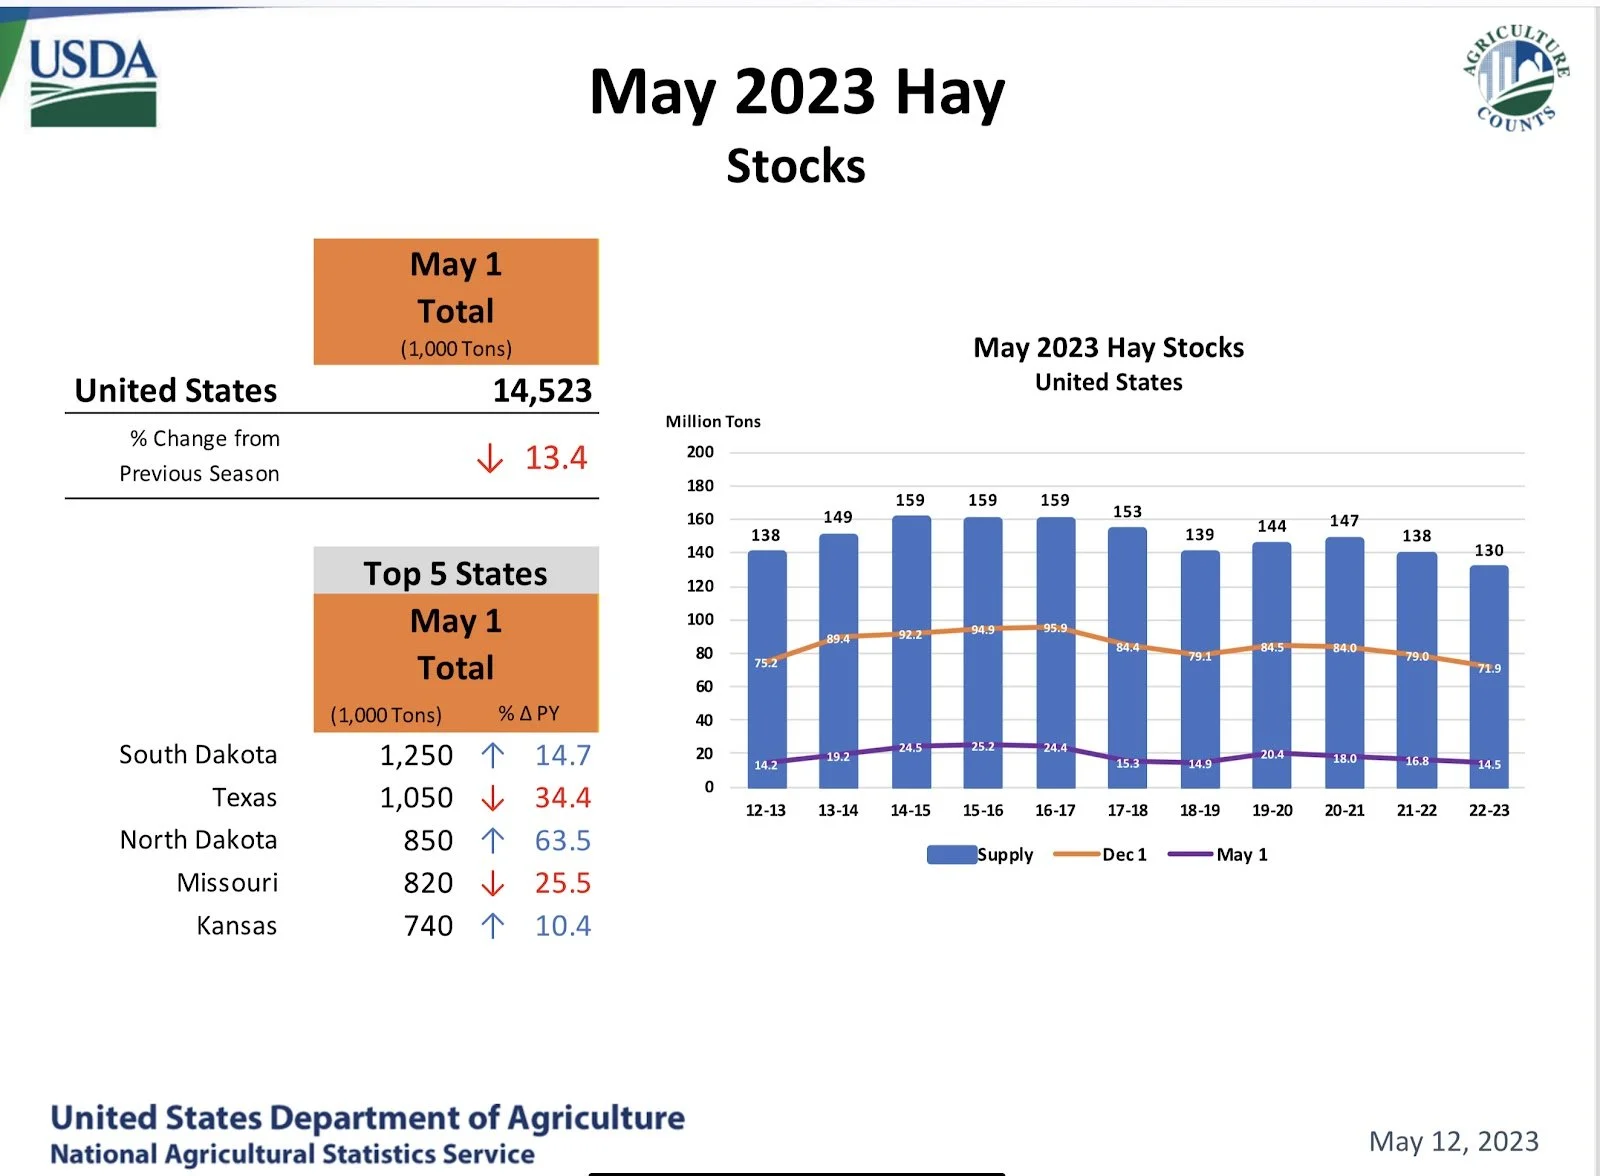
This is Hay stocks, notice the percentage change that many areas have year over year. A lack of hay could lead to more demand.
Here is May hay stocks, lowest on this chart.
Here is wheat production versus estimates.
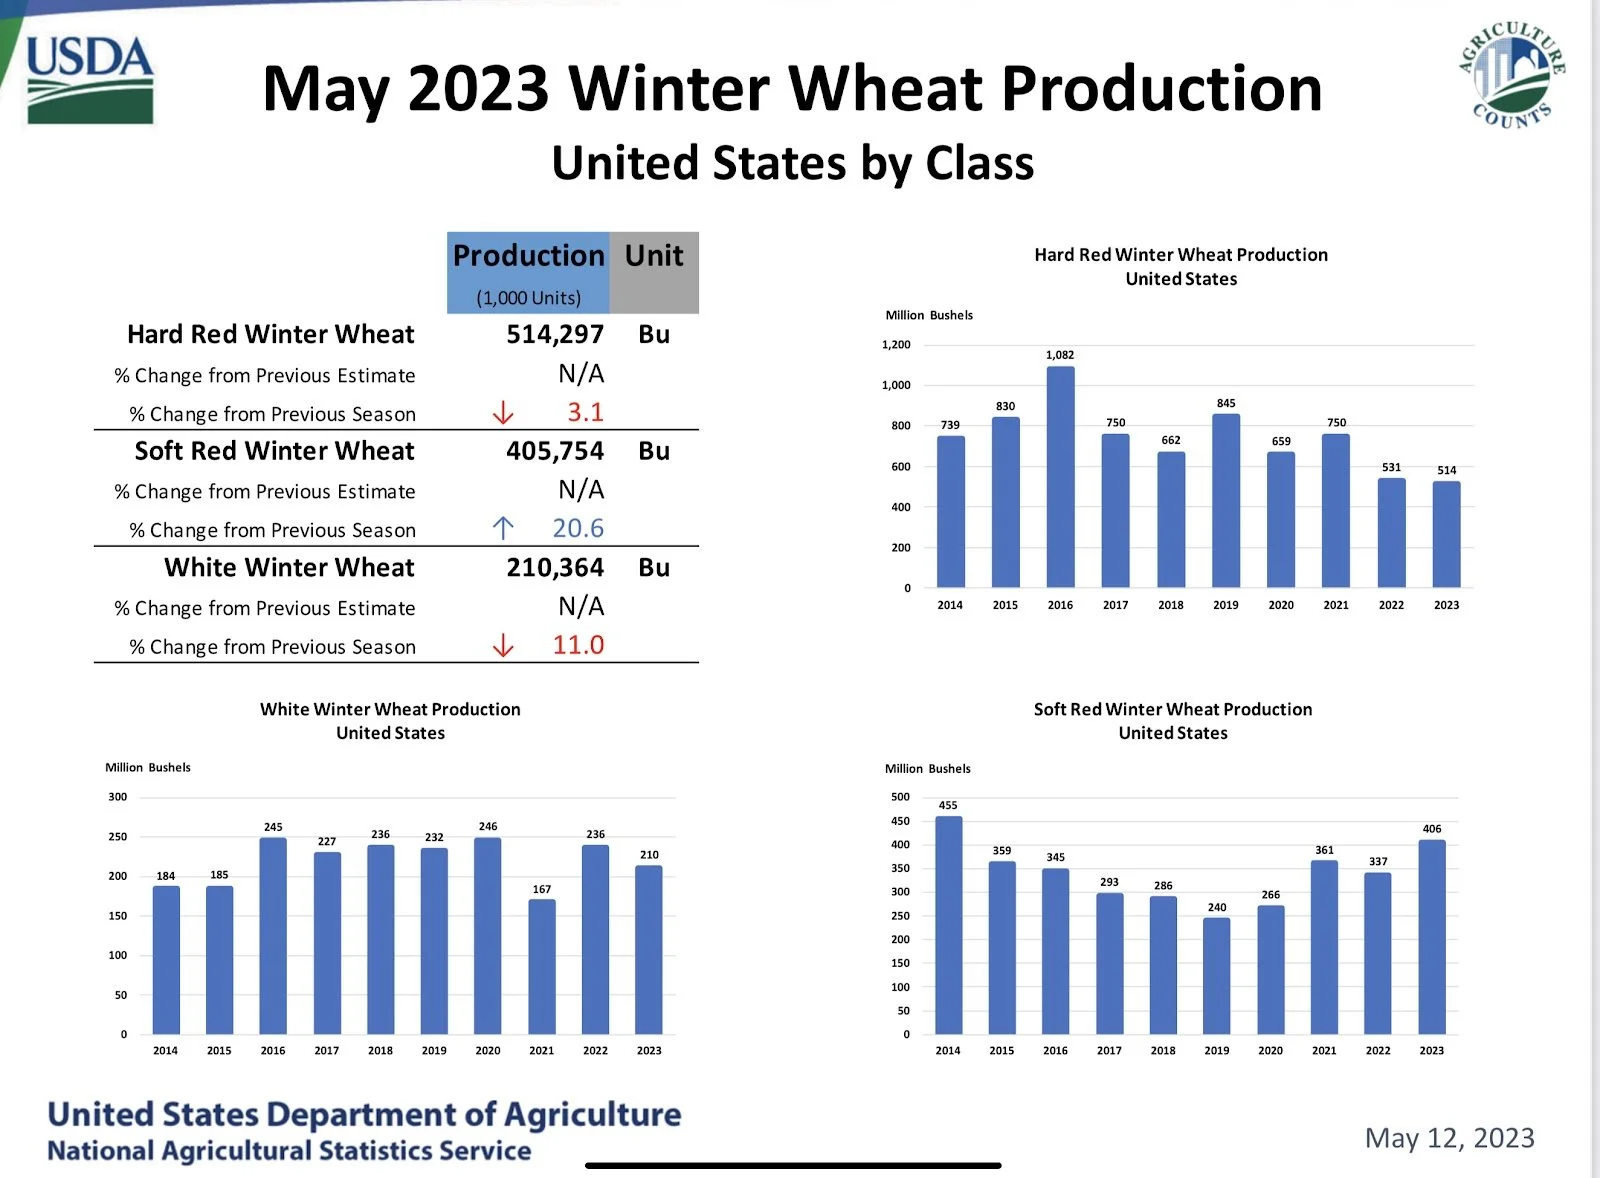
Here is winter wheat production. Notice the HRW decrease with the SRW increase. Hence why we have a huge spread between CBOT and KCBT. How far can the spread go with the funds short is the real question.
Below is a state breakdown of expected winter wheat yield. Hard to imagine that NE is up year over year with the drought.
Below is a comparison chart, it shows 3 years, 2012, 2013, and 2023 December corn. The dark blue is 2023, you will notice that we have the stages set we could follow 2013, but I am betting that we follow 2012 the green line, as I mention below.
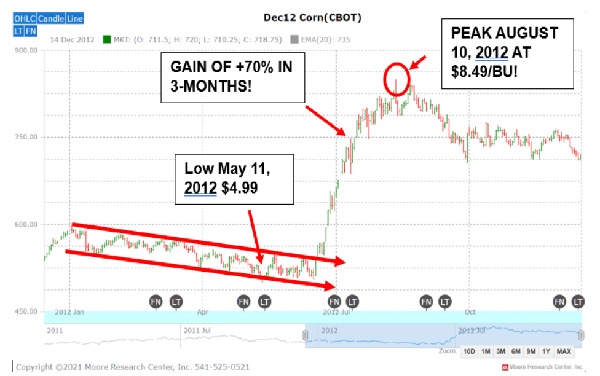
This is a 2012 chart, can history repeat itself. Did we make our lows on the report we had on Friday, can we rally 70% or 3.50 a bushel like we did then? If we get hit with the same type of drought we could rally much more is this advisor's opinion.
Below is from Wright on the Market. It shows another perspective of what the future could hold from another year. Take a look at this comparison from 2019 to 2023.
“Four years ago today, July 2019 and December 2019 corn futures gapped higher on the opening after making contract lows the previous day at $3.43 on the July and $3.63 on December corn. Five weeks later, July corn traded to $4.64 and December corn to $4.73. The two contracts rallied an average of 32% in five weeks.
Market action in the first part of 2019 was similar to this year, down, down, and then down some more. What was different in 2019 is rain started in mid-April and continued into the third week in May. The market’s attitude was rain makes grain, even though the crops were not planted. Just 30% of the corn and 9% of the beans were planted by this date in 2019. A third of the 2019 corn crop and two-thirds of the bean crop were planted in June.
In early December 2018, Alan Bonifas, now one of our two full service consultants, told Roger bean and corn futures would make the lows on a specific day in May. He missed it by one day! Alan also said in December 2018 corn and beans would have a terrific rally from the May lows, which they did.
All through this past winter, Alan said he did not know if the 2023 high or low would be in the spring, but one of them would be in the spring.
In the first half of April, Alan said the low would be made in May, possibly the last half of May and the May lows would be lower than the March banking crisis lows. Corn, the three wheats and beans have all made new 2023 lows in May except July beans and they came within 1¾¢ of it Thursday.
Alan said all along that, if the high was made after the spring low, it would be higher than it would have been if the high was made in the spring. That makes sense because low prices discourage production and increase demand.
Corn and bean basis continues to firm in most areas.
If corn rallies 32% this year like it did in 2019, that would put July corn at $7.73 and December corn at $6.71. If beans rally 16% this year like they did in 2019, that will take July beans to $16.19 and November beans to $14.25.
What is different this year from 2019?
Planting progress is ahead of the normal pace instead of way behind.
More Corn Belt acres are in a certified drought this May than any May since 1988.
Until May 2024, Argentina has no beans or corn to export; they are importing both from Brazil.
Brazil harvested their largest soybean crop ever in 2023, which is normal.
Nationwide basis is much firmer this year even though futures are much higher. Basis is expected to be weaker when futures are high priced. Compared to this week in May 2019, July corn is $2.34 higher & July beans are $5.81 higher.
The war in the “Bread Basket of the World” is in its second crop year.
In May 2019:
The domestic old crop corn carryout was a 53 day supply; this year is 38.
The world old crop corn carryout was a 105 day supply; this year is 94.
The domestic new crop corn carryout was a 62 day supply; this year is 56.
The world new crop corn carryout was a 100 day supply; this year is 95.
The domestic old crop bean carryout was a 91 day supply; this year is 18.
The world old crop bean carryout was a 119 day supply; this year is 101.
The domestic new crop bean carryout was an 84 day supply; this year is 28.
The world new crop bean carryout was a 116 day supply; this year is 116.
Cargill Dayton corn basis was even with July futures; this week it is +38 July.
Cargill Sidney soybean basis was 45 under the July futures; now it is 35 over July.
Make your marketing decisions from a historical perspective based on the facts”


