GRAINS STORM BACK POST TRADE WAR FEAR
MARKET UPDATE
You can still scroll to read the usual update as well. As the written version is the exact same as the video.
(Corn Charts at 3:22) (Bean Charts at 8:07)
Election Sale Ends Midnight
Lock in this offer before your trial expires. Comes with our updates, signals & 1 on 1 tailored market plans.
Want to talk? (605)295-3100
Futures Prices Close
Overview
Massive day for the grains, corn & soybeans specifically.
Overnight, all grains were getting hammered as Trumps odds to win start skyrocketing.
At one point beans were down -20 cents, corn was down -5, and wheat was down -10.
However, we then closed today higher across the board. Erasing all of those early losses. With corn posting it's best day since September.
This Morning vs Afternoon Close
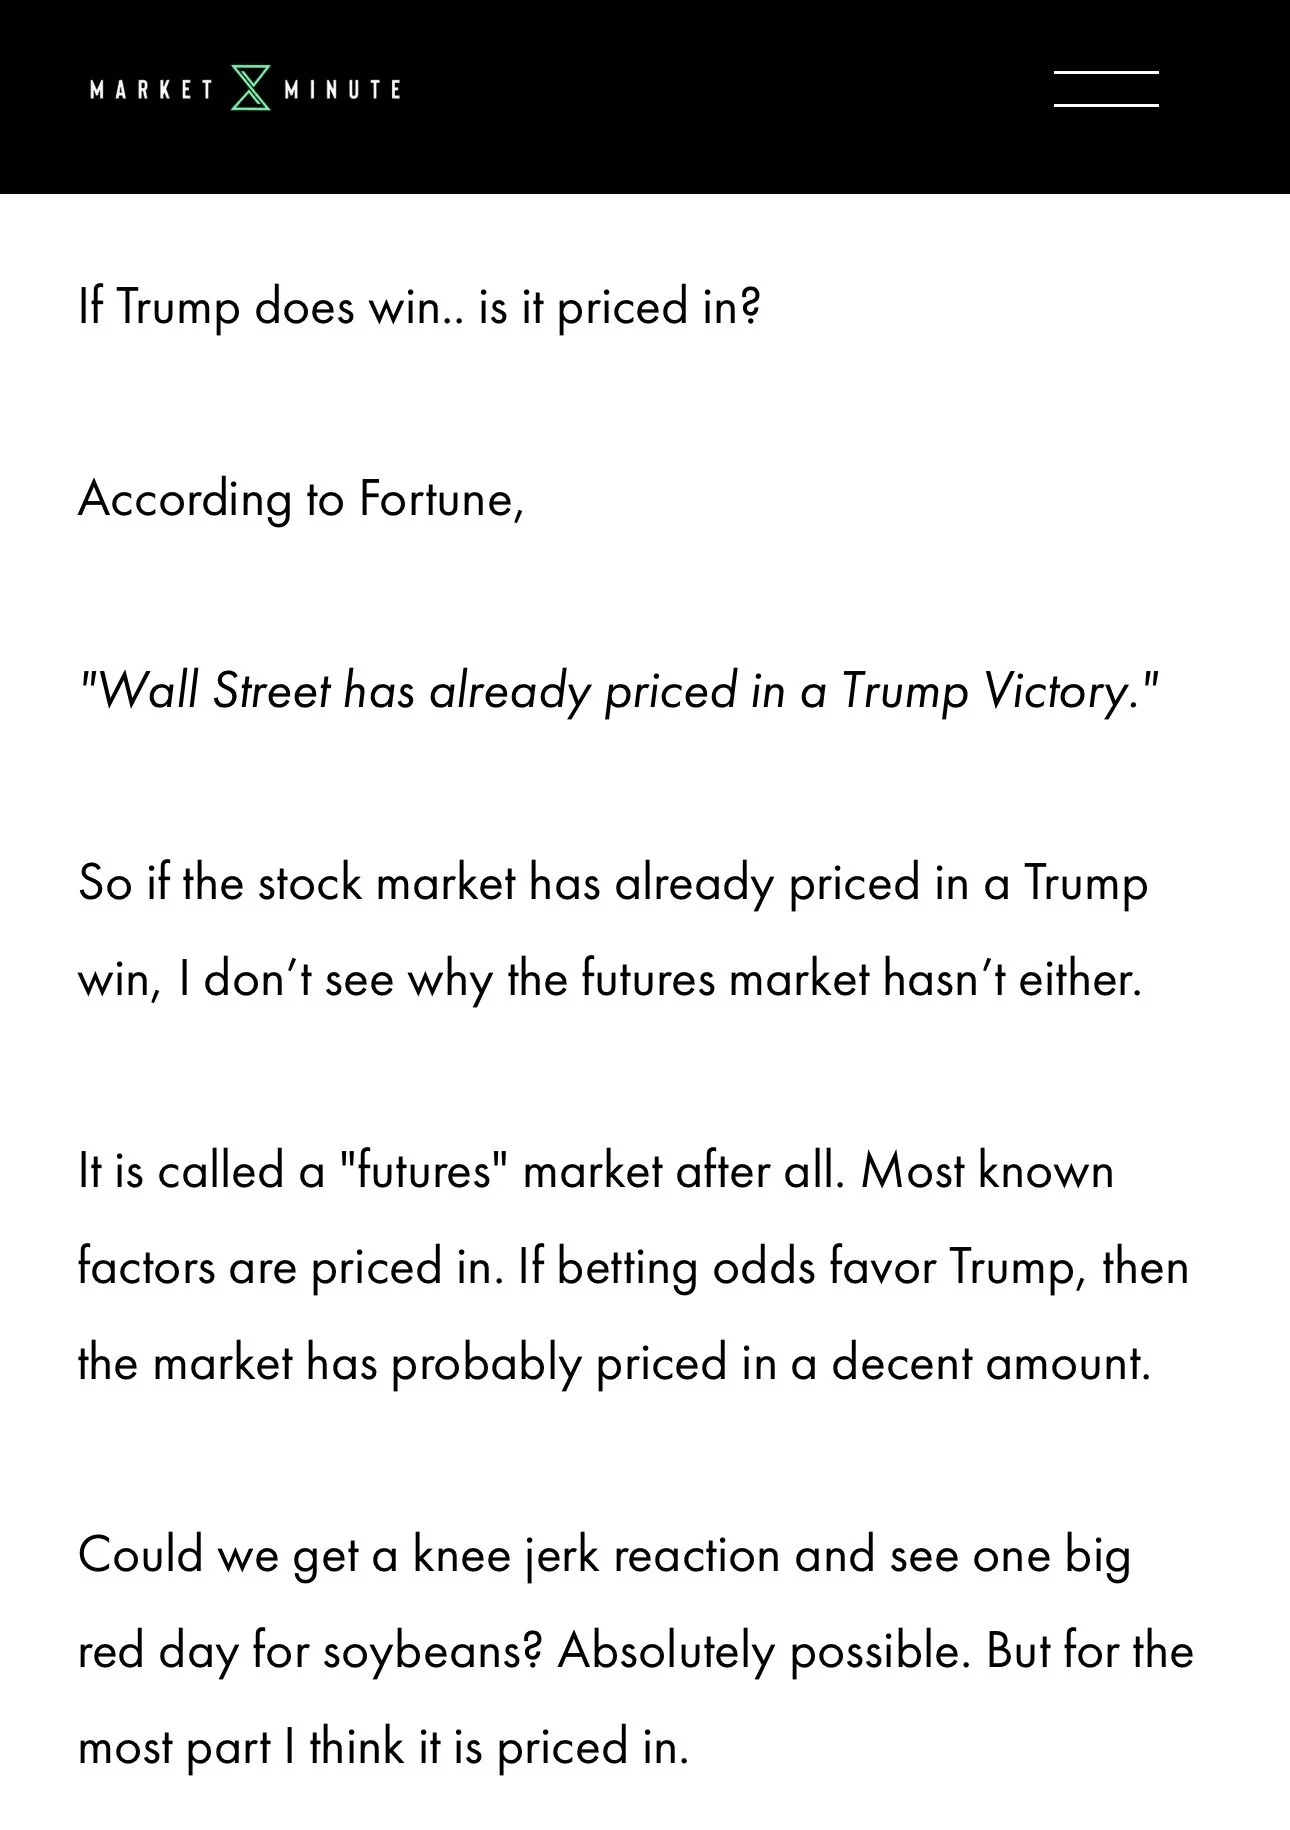
Just like I mentioned the past two days, a Trump win was mostly priced in.
We got a sell the rumor, buy the fact event.
When his odds starting rising, grains took a beating. When he actually won, grains bounced right back.
From Monday's Update:
Make it stand out
Whatever it is, the way you tell your story online can make all the difference.
Trumps win led to the stock market hitting new ATH's overnight. Bitcoin hit new ATH's overnight.
The dollar rallied to it's highest prices since July.
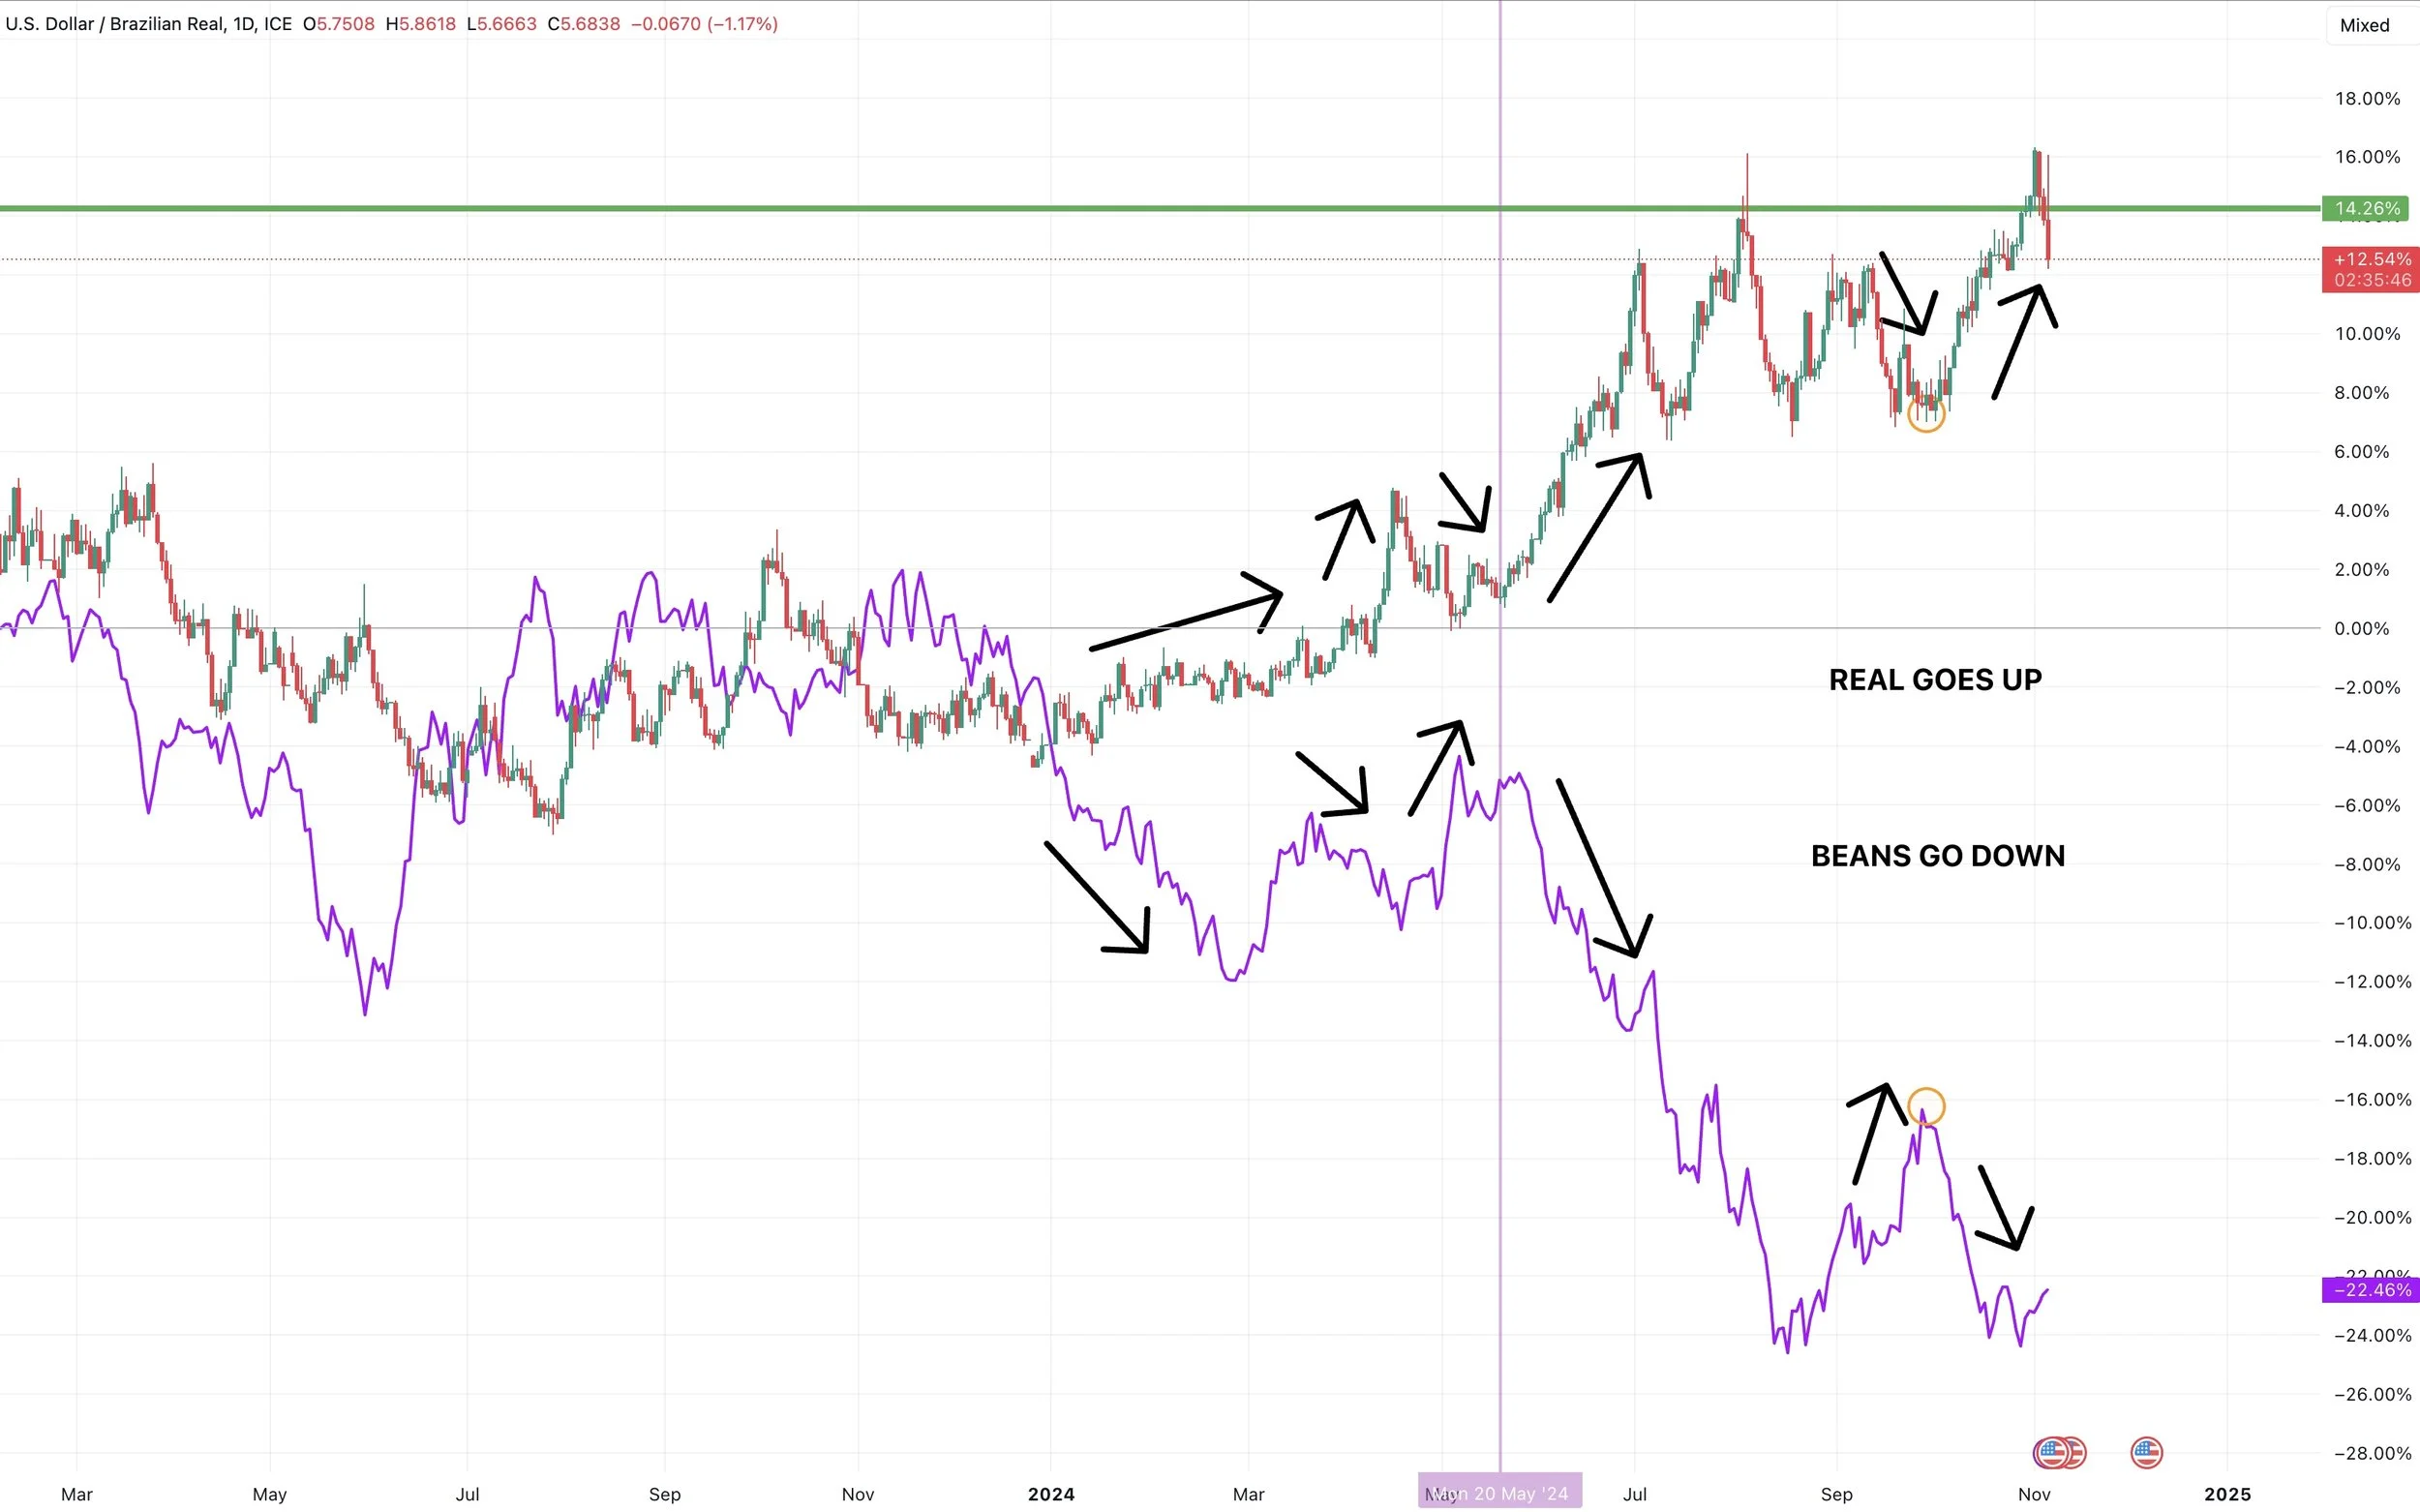
The Brazilian Real fell fell hard.
I mentioned this the past few weeks that the Brazilian Real was one potentially friendly factor for soybeans.
Soybeans & the Real are "almost" identically inversely correlated to one another sometimes.
The Real is once again finding resistance at these multi-year resistance levels.
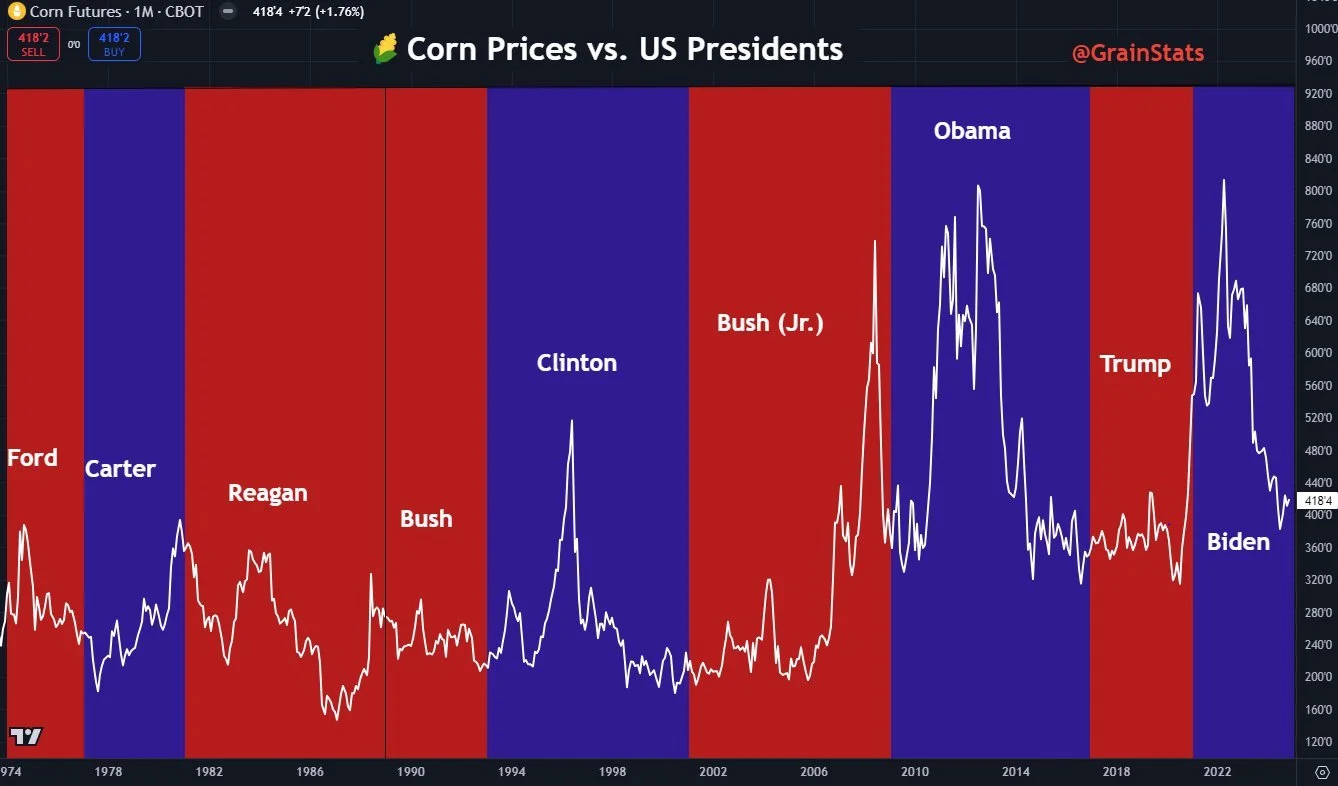
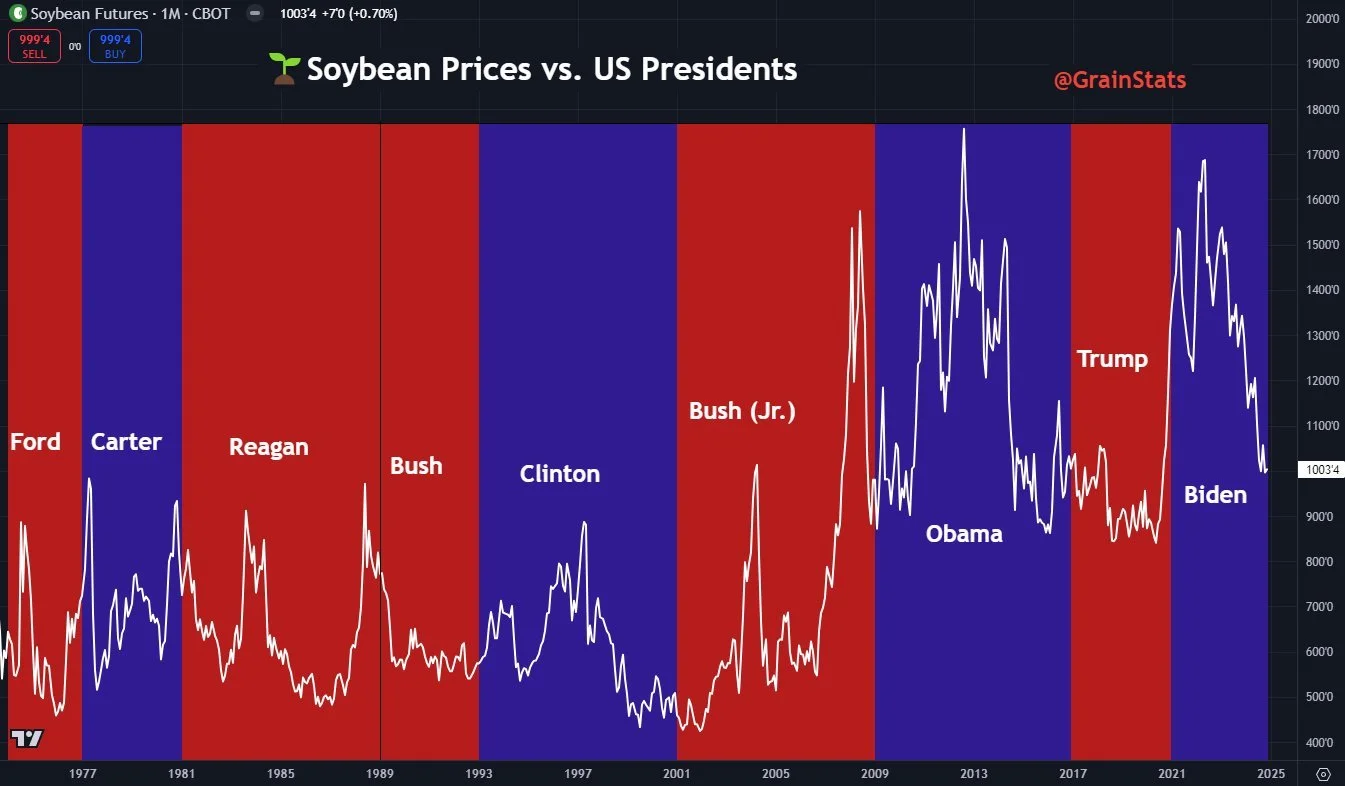
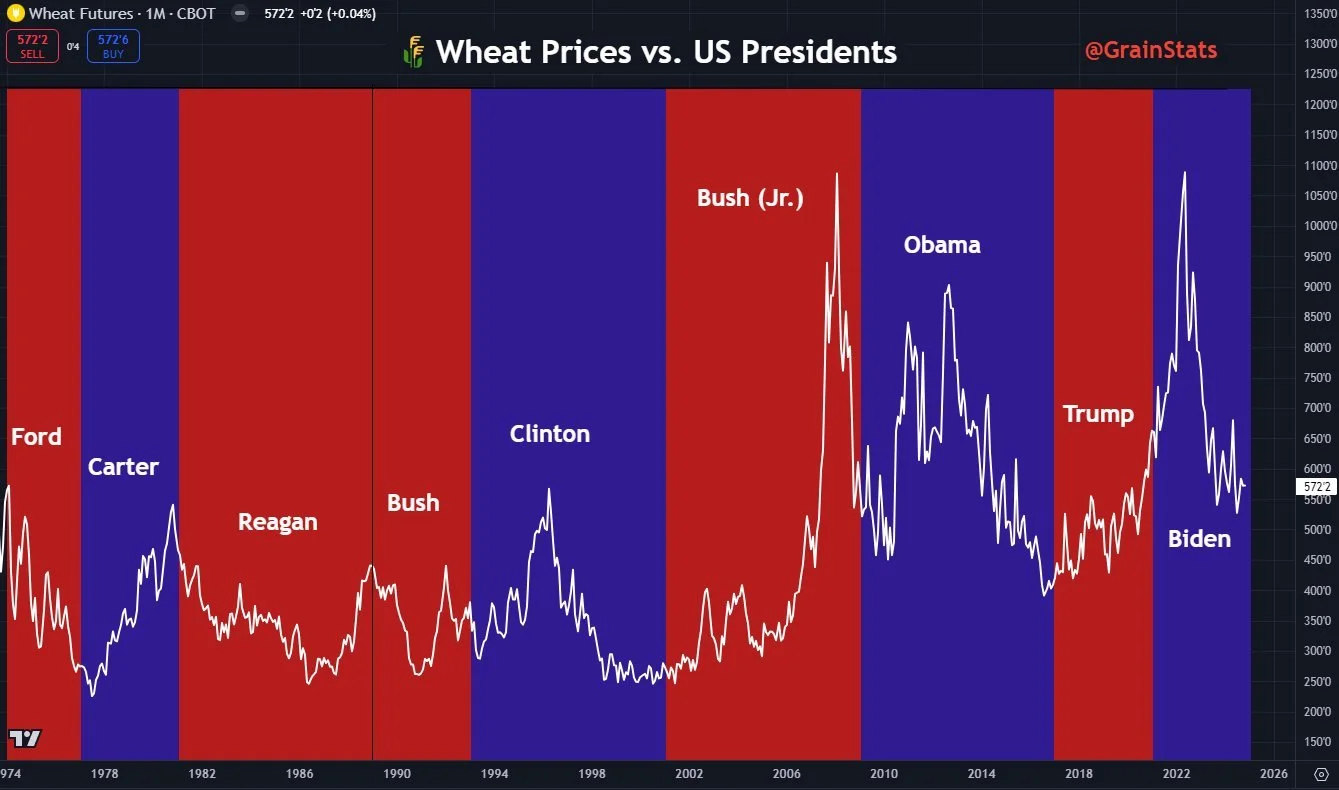
Do Presidents Matter to Markets?
I wanted to show these nice charts from GrainStats.
As you can see, what party the President is really has no effect or correlation to prices whatsoever.
(Yes, a trade war could obviously turn out to be very negative. But we will touch on this later).
From GrainStats on X
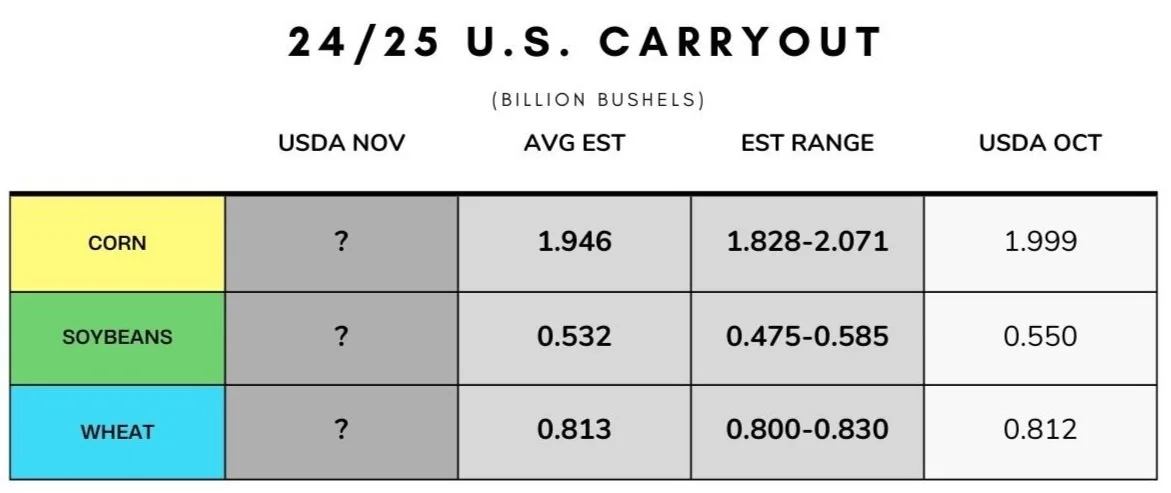
USDA Report
Here are the estimates.
Yield is expected to come down just slightly for beans, and basically unchanged for corn. Which I would have to agree with.
Both of these yields are still records, however if soybeans were to come in at the bottom of the trade range (52.1) they would be close to previous record of 51.9 in 2016.
*Fun Fact: Bean yield has fallen below the trade range in the past 3/6 November reports.
Overall I don’t expect any huge changes.
If I had to pick two surprises they would be:
A slight bump in corn exports due to the strong demand, or a cut to bean yield.
Today's Main Takeaways
Corn
My long term view on corn has not changed.
I still believe demand will lead us higher.
We also have a technical breakout on the chart short term.
So demand is solid. Funds are no longer betting we are going lower, holding their smallest shorts in over a year nearing net long.
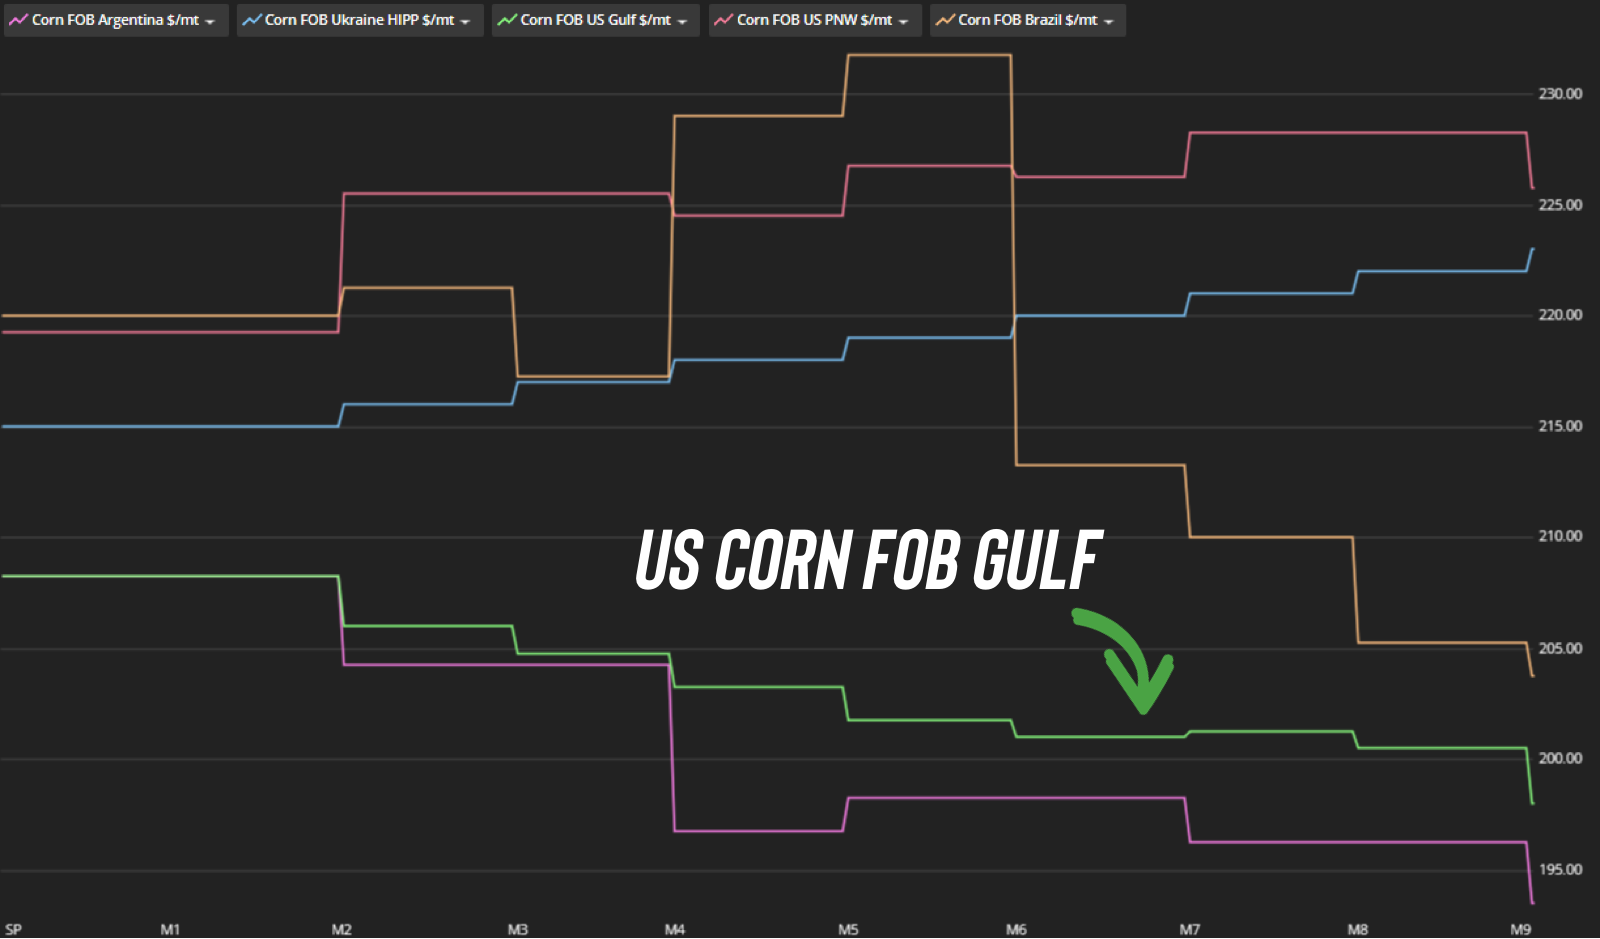
We have a breakout with good momentum. We also have the US FOB prices really cheap.
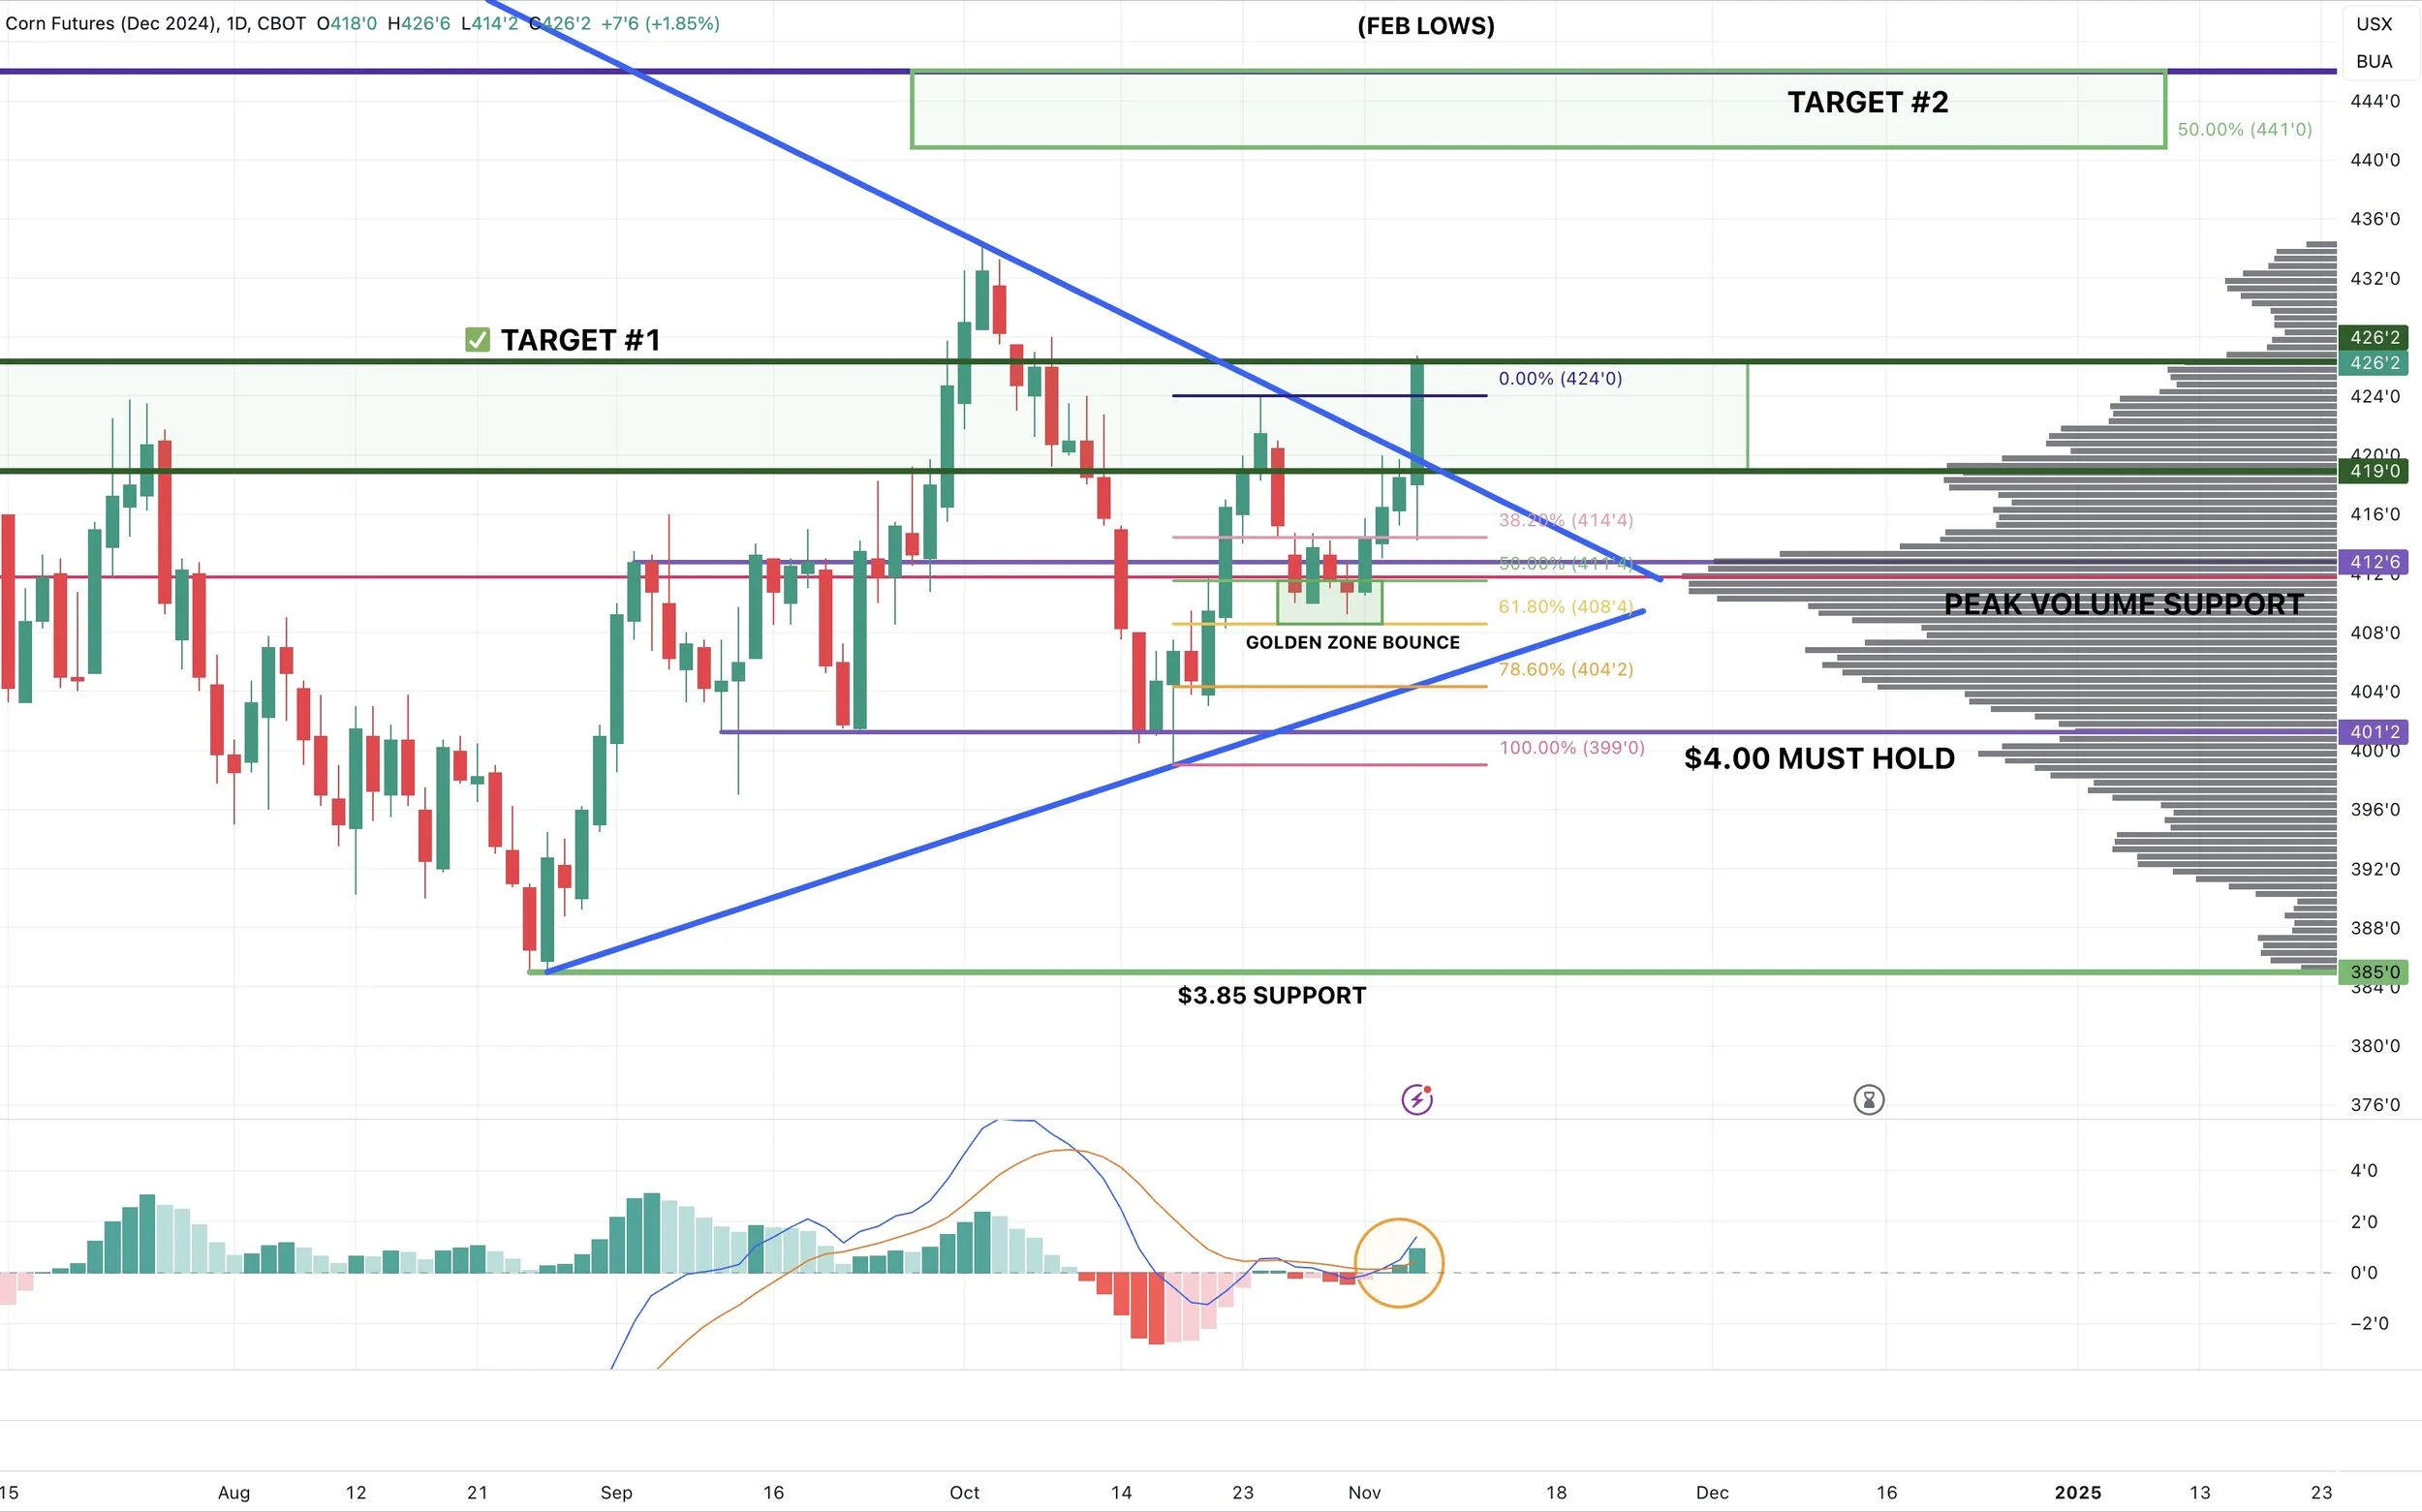
Let's look at the chart now.
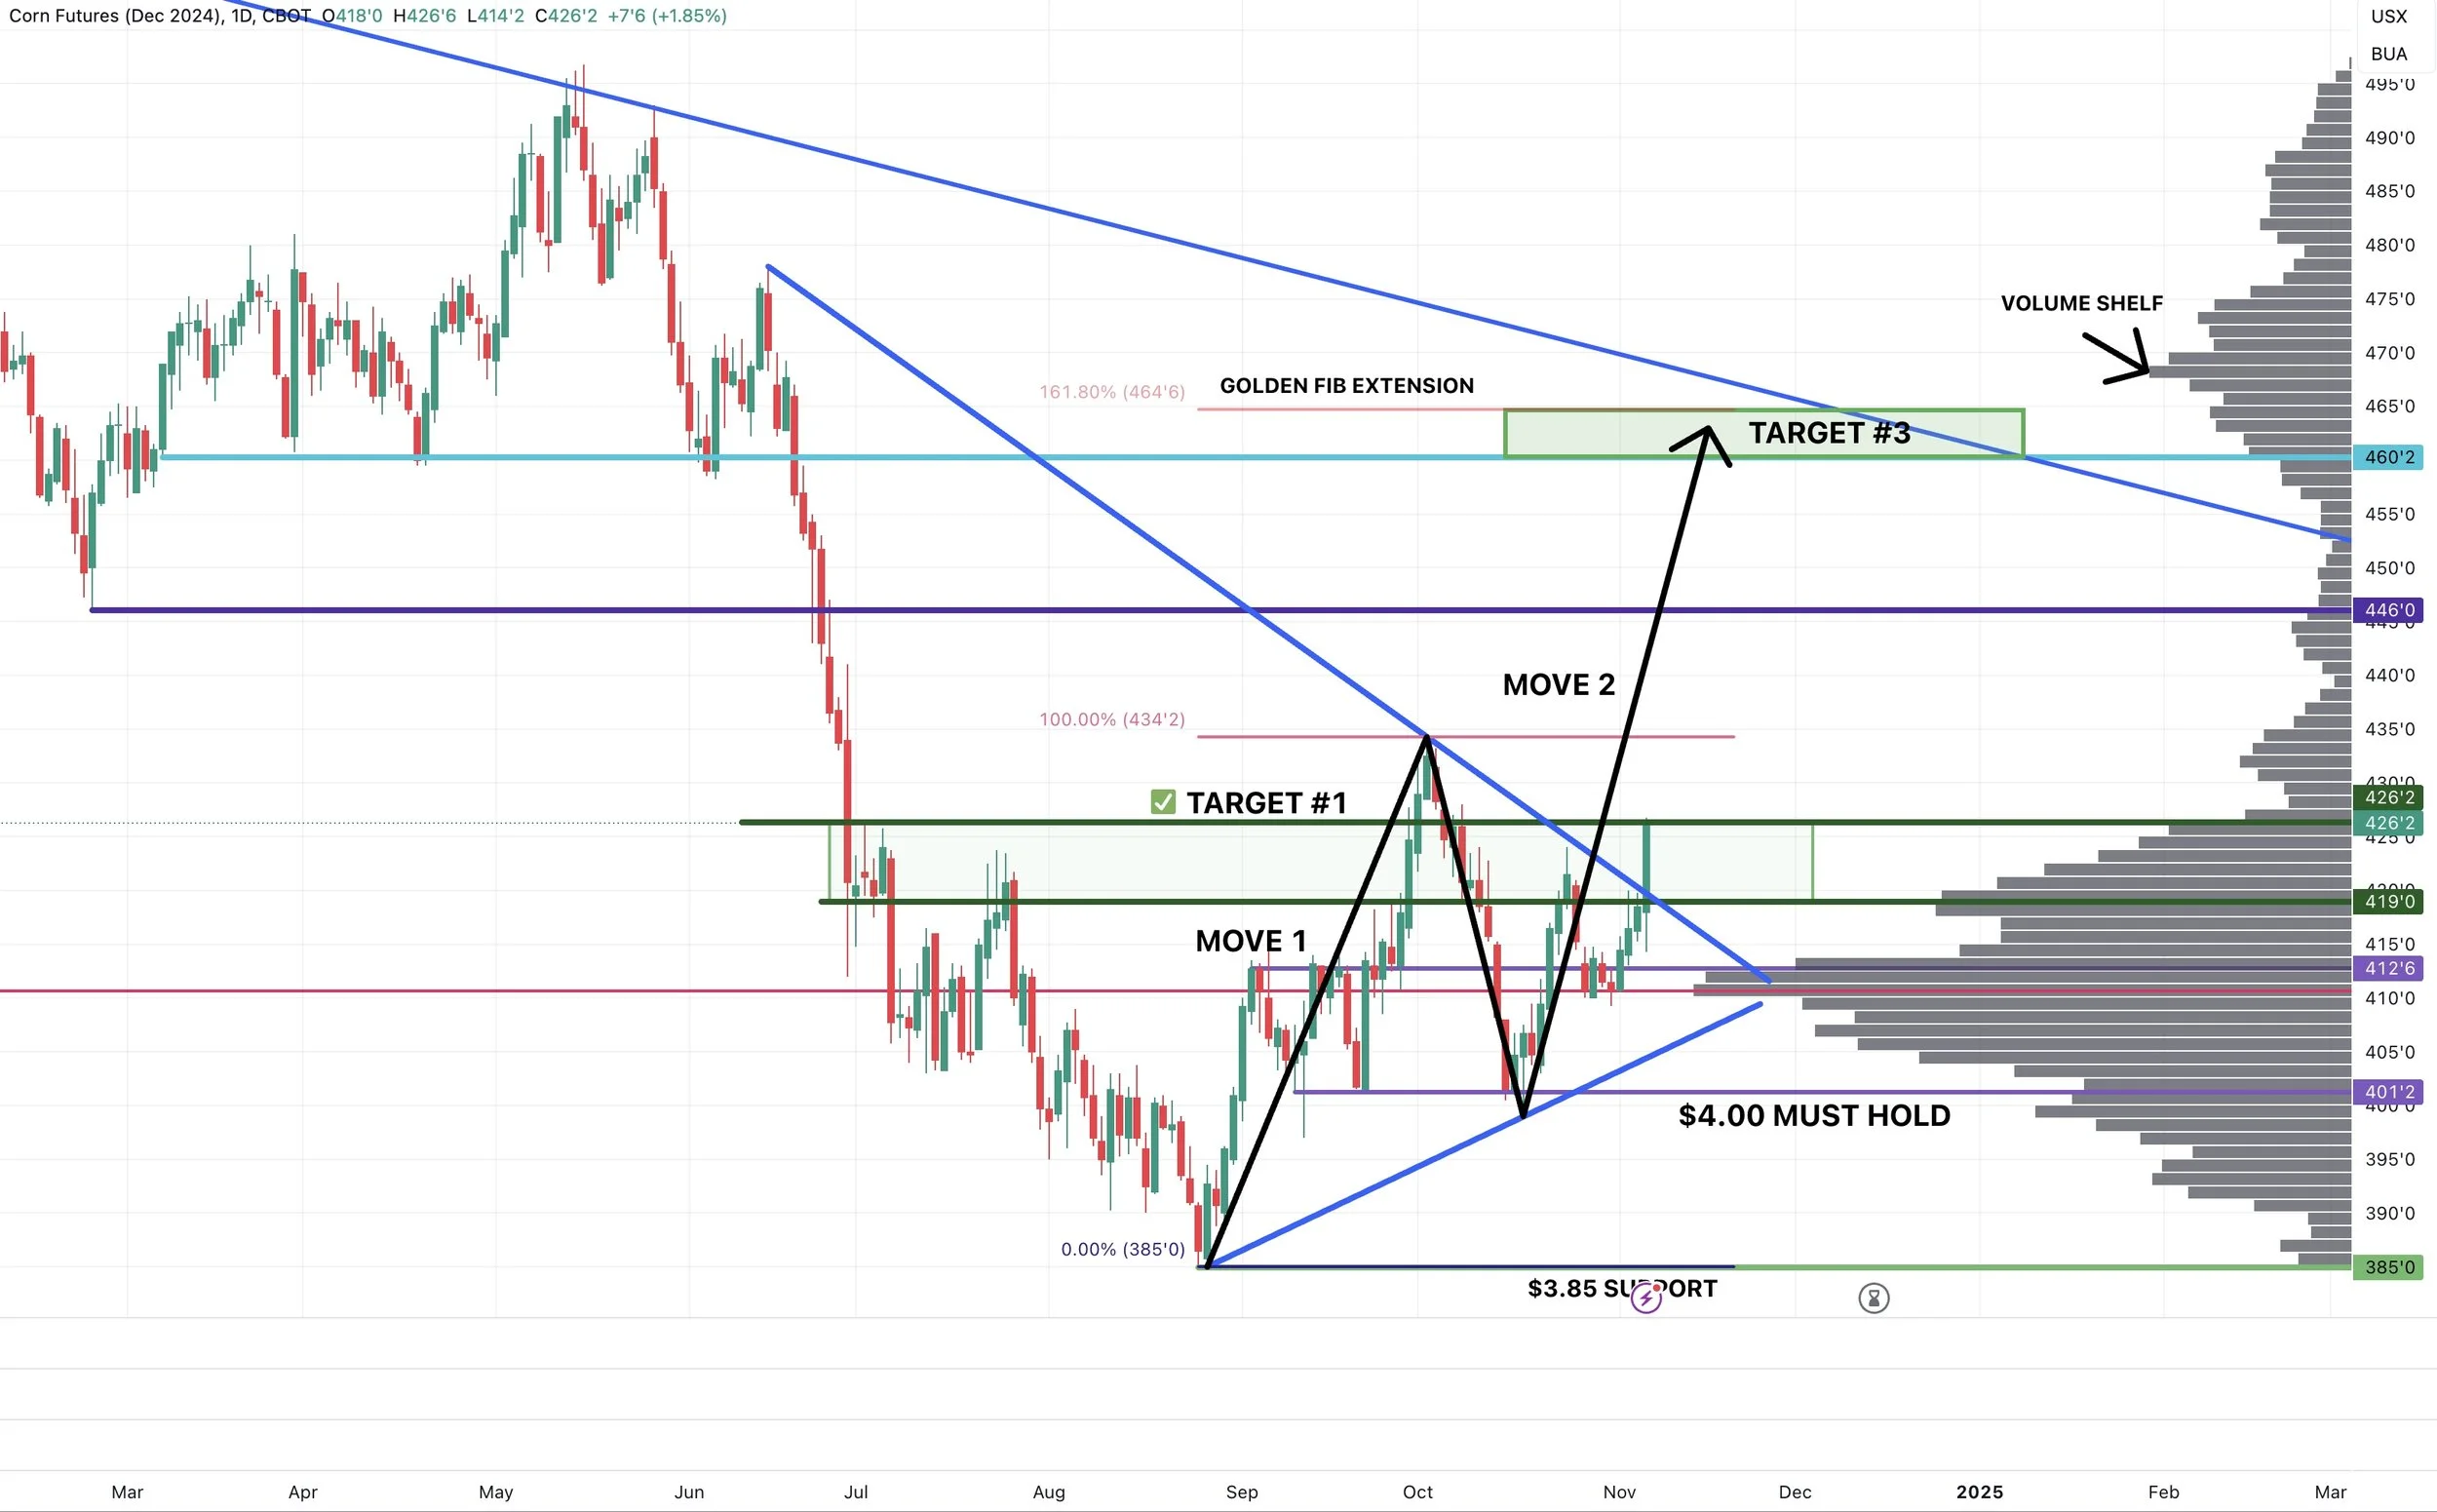
We have a very clean looking breakout of those downward trend. (Blue line).
We also have the MACD crossing over bullish again.
Now let's look at some targets.
First target is $4.39 to $4.46 (green box).
$4.39 is our 161.8% golden fib extension from that mid October rally (black lines).
The golden fib means that this 2nd move should be 161.8% of the 1st move.
The 161.8% is very well known and considered the most reliable fib extension.
$4.41 is also our 50% retracment to those May highs and $4.46 is our February lows.
So that is my first target.
Now my second possible much longer term target is $4.60 to $4.65
Reason #1 is that $4.65 is the 161.8% golden fib extension of that entire September rally from $3.85 to $4.34
Again, this means that the 2nd move should be equal to 161.8% of the first move.
$4.60 is also the level where we consolidated and found support at for several months in the past. (Light blue line)
We also have a volume gap up to those levels if we can clear those recent $4.34 highs.
Soybeans
It appears that Trump winning was mostly priced in for now.
This is great news for the bean market.
A Trump win might mean trade war, but what is also means is that China might go full bazooka mode on their stimulus.
Potential friendly factor if they do so. And 1 of only 3 things that can save the bean market along with China buying or a Brazil scare.
Remember, most of that recent September rally was due to the news about the China stimulus.
How bearish would a trade war be?
In all honesty, I think a bumper crop out of South America is a bigger risk than the trade war.
Here is some thoughts from Angie Setzer. You can read her full article HERE.
She goes over what would happen if we saw another trade war, and how it might look.
From what I could gather, it doesn’t look quite as negative as the last one.
Some key points she talked about:
A.) Many forget that the added help in limiting demand was China had received an outbreak of African Swine Fever. This destroyed hog & feed demand and dropped China's bean imports by 300 million.
B.) Phase 1 of the trade war was signed in Janurary 2020. This basically makes China required to purchase a certain number of ag products over the next 2 years.
C.) Initally people thought the Phase 1 would not work. However, whether it was due to our markets hitting multi-year lows in 2020 due to COVID, China missing much of their supply, or the actual Phase 1 agreement. It led to grain purchases from China soaring in the fall of 2020 and setting records.
D.) While a Trump win probably leads to talk of more trade war, its important to remember that Biden has not rolled back Trump's tariffs, having added a bunch of their own the last 4 years. Harris planned to follow many of the trade policies started by Trump and kept by Biden.
E.) If the trade war did happen again, there are a few different points that may be important to consider before you start counting a zero for soybean.
The trade war never ended. Neither party has been good for Chinese relations. The difference between the two parties is that Trump already negotiated a resolution for Phase 1.
Secondly, the global balance sheets look very different from then. We have made a lot of relationships with other countries looking to expand their imports as global crush capacity grows. World bean consumption has grown 20 MMT since 2018. Domestic demand in the US alone has grown 370 million bushels since 2018. The uptick in demand for fuel and food is not just a US thing.
She finished by saying a Trump trade war would look very different now. While yes there is the risk we could lose a chunk of China bean buying again, there are several factors at play that would likely limit a reduction in Chinese buying.
I highly recommend checking out here full article as I only went over a few parts I found valuable. Angie knows her stuff.
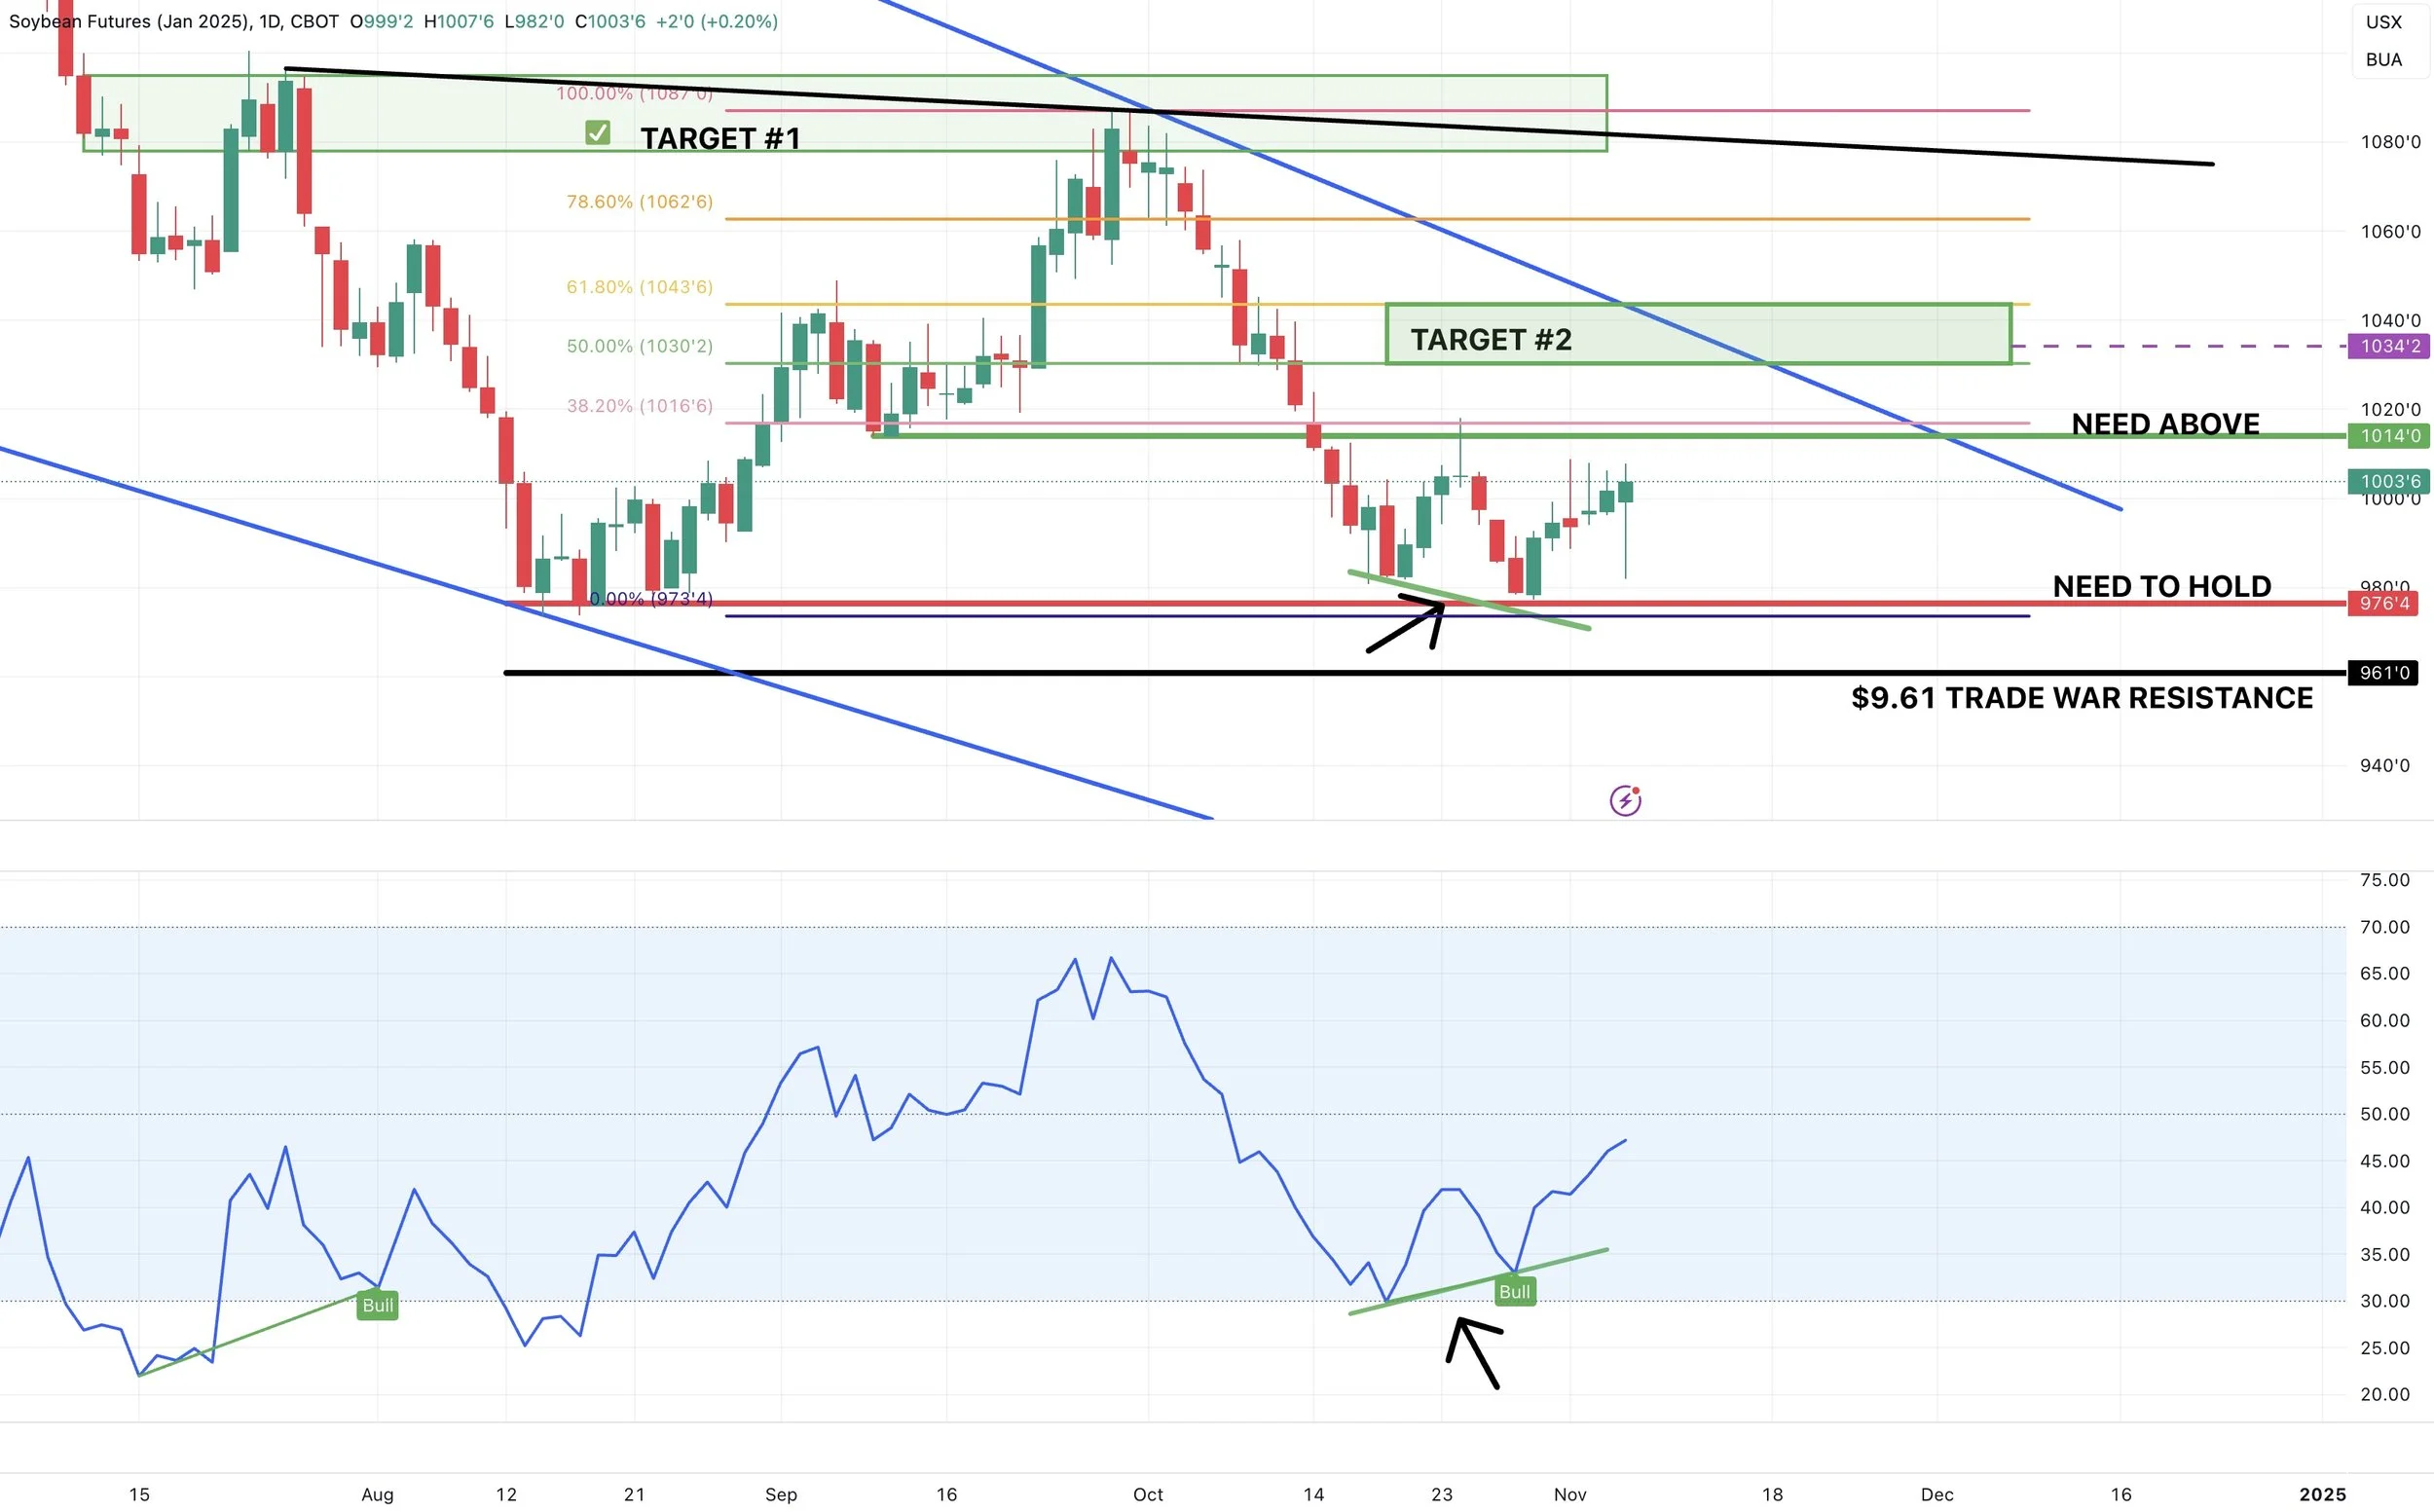
Taking a look at the charts, like I had mentioned the past few days it looked like soybeans were ready for a bounce.
We have several indicators suggesting we should go higher from here short term.
First is the MACD. This has been very accurate recently on beans.
When the blue line crosses above the yellow it is bullish. When yellow crosses below blue it is bearish.
It has crossed bullish once again. The last time it did so was that late August rally.
The last time it crossed bearish we sold off and gave back that entire rally.
(I circled all 3 instances).
The second is the RSI.
We have formed bullish divergence (the RSI forms an uptrend while prices format downtrend).
This often times signals a reversal higher.
If we do get a rally and you want to take risk off the table, my current first target is $10.30 to $10.44 (green box).
If you look at the left, we have a volume shelf gap from $10.08 to $10.34. So if we can get above $10.08, we could move fast. (Prices often slice through low volume areas like butter).
Our retracment levels to those September highs are $10.43 for the 61.8% and $10.30 for the 50%.
Final Thoughts for Beans:
Short term, the charts look friendly and due for a pop.
We also no longer have first notice day selling or farmer selling.
Long term, I am still very cautious. Because if Brazil raises a bumper crop we easily have another $1.00 possible downside. But Brazil is simply an unknown but their forecasts look ideal for now.
If the USDA does lower yield Friday by -1 bpa. It will go hand in hand with the possible short term bounce. But won’t be enough to create a massive rally all by itself.
The other unknowns are whether China decides to pump more stimmy or not.
Wheat
Not a ton on the wheat market today.
I still think wheat has plenty of potential upside, but it doesn't have to happen as fast as one would like.
The world balance sheets are still friendly, with major exporters having the lowest stocks to use ratio since 2008.
Looking at the chart, we are poking our head out of this downward channel, but no breakout confirmed out.
Another pop and it would look good.
This $5.65 level should offer great support.
It is our peak volume shelf, and we have bounced there SEVERAL times.
We have actually bounced there 9 times in the past 2 weeks. 6 straight sessions in a row.
My bias leans higher UNLESS we strongly break below $5.65.
Pretty much the same for KC wheat, expect the chart doesn’t look quiet as friendly as Chicago.
We did not close above this downward channel. But we are getting close.
$5.61 is the level to hold.
Past Sell or Protection Signals
We recently incorporated these. Here are our past signals.
Oct 2nd: 🌾
Wheat sell signal at $6.12 target
Sep 30th: 🌽
Corn protection signal at $4.23-26
Sep 27th: 🌱
Soybean sell & protection signal at $10.65
Sep 13th: 🌾
Wheat sell signal at $5.98
May 22nd: 🌾
Wheat sell signal when wheat traded +$7.00
Want to Talk?
Our phones are open 24/7 for you guys if you ever need anything or want to discuss your operation.
Hedge Account
Interested in a hedge account? Use the link below to set up an account or shoot Jeremey a call at (605)295-3100.
Check Out Past Updates
11/5/24
ALL ABOUT THE ELECTION & VIDEO CHART UDPATE
11/1/24
GRAINS WAITING ON NEWS
10/31/24
ELECTION & USDA NEXT WEEK
10/30/24
SEASONALS, CORN DEMAND, BRAZIL REAL & MORE
10/29/24
WHAT’S NEXT AFTER HARVEST?
10/25/24
POOR PRICE ACTION & SPREADS WEAKEN
10/24/24
BIG BUYERS WANT CORN?
10/23/24
6TH STRAIGHT DAY OF CORN SALES
10/22/24
STRONG DEMAND & TECHNICAL BUYING FOR GRAINS
10/21/24
SPREADS, BASIS CONTRACTS, STRONG CORN, BIG SALES
10/18/24
BEANS & WHEAT HAMMERED
10/17/24
OPTIMISTIC PRICE ACTION IN GRAINS
10/16/24
BEANS CONTINUE DOWNFALL. CORN & WHEAT FIND SUPPORT
10/15/24
MORE PAIN FOR GRAINS
10/14/24
GRAINS SMACKED. BEANS BREAK $10.00
10/10/24
USDA TOMORROW
10/9/24
MARKETING STYLES, USDA RISK, & FEED NEEDS
10/8/24
BEANS FALL APART
10/7/24
FLOORS, RISKS, & POTENTIAL UPSIDE
10/4/24
HEDGE PRESSURE
10/3/24
GRAINS TAKE A STEP BACK
10/2/24
CORN & WHEAT CONTINUE RUN
10/1/24
CORN & WHEAT POST MULTI-MONTH HIGHS
9/30/24


