MANAGING THESE VOLATILE MARKETS
WEEKLY GRAIN NEWSLETTER
Here are some not so fearless comments for www.dailymarketminute.com
We had another kick the can down the road USDA report this week that was full of unrealistic assumptions. Anytime the USDA dishes out garbage or unrealistic assumptions it also serves on a very ice chilled plate buying or re-ownership opportunities.
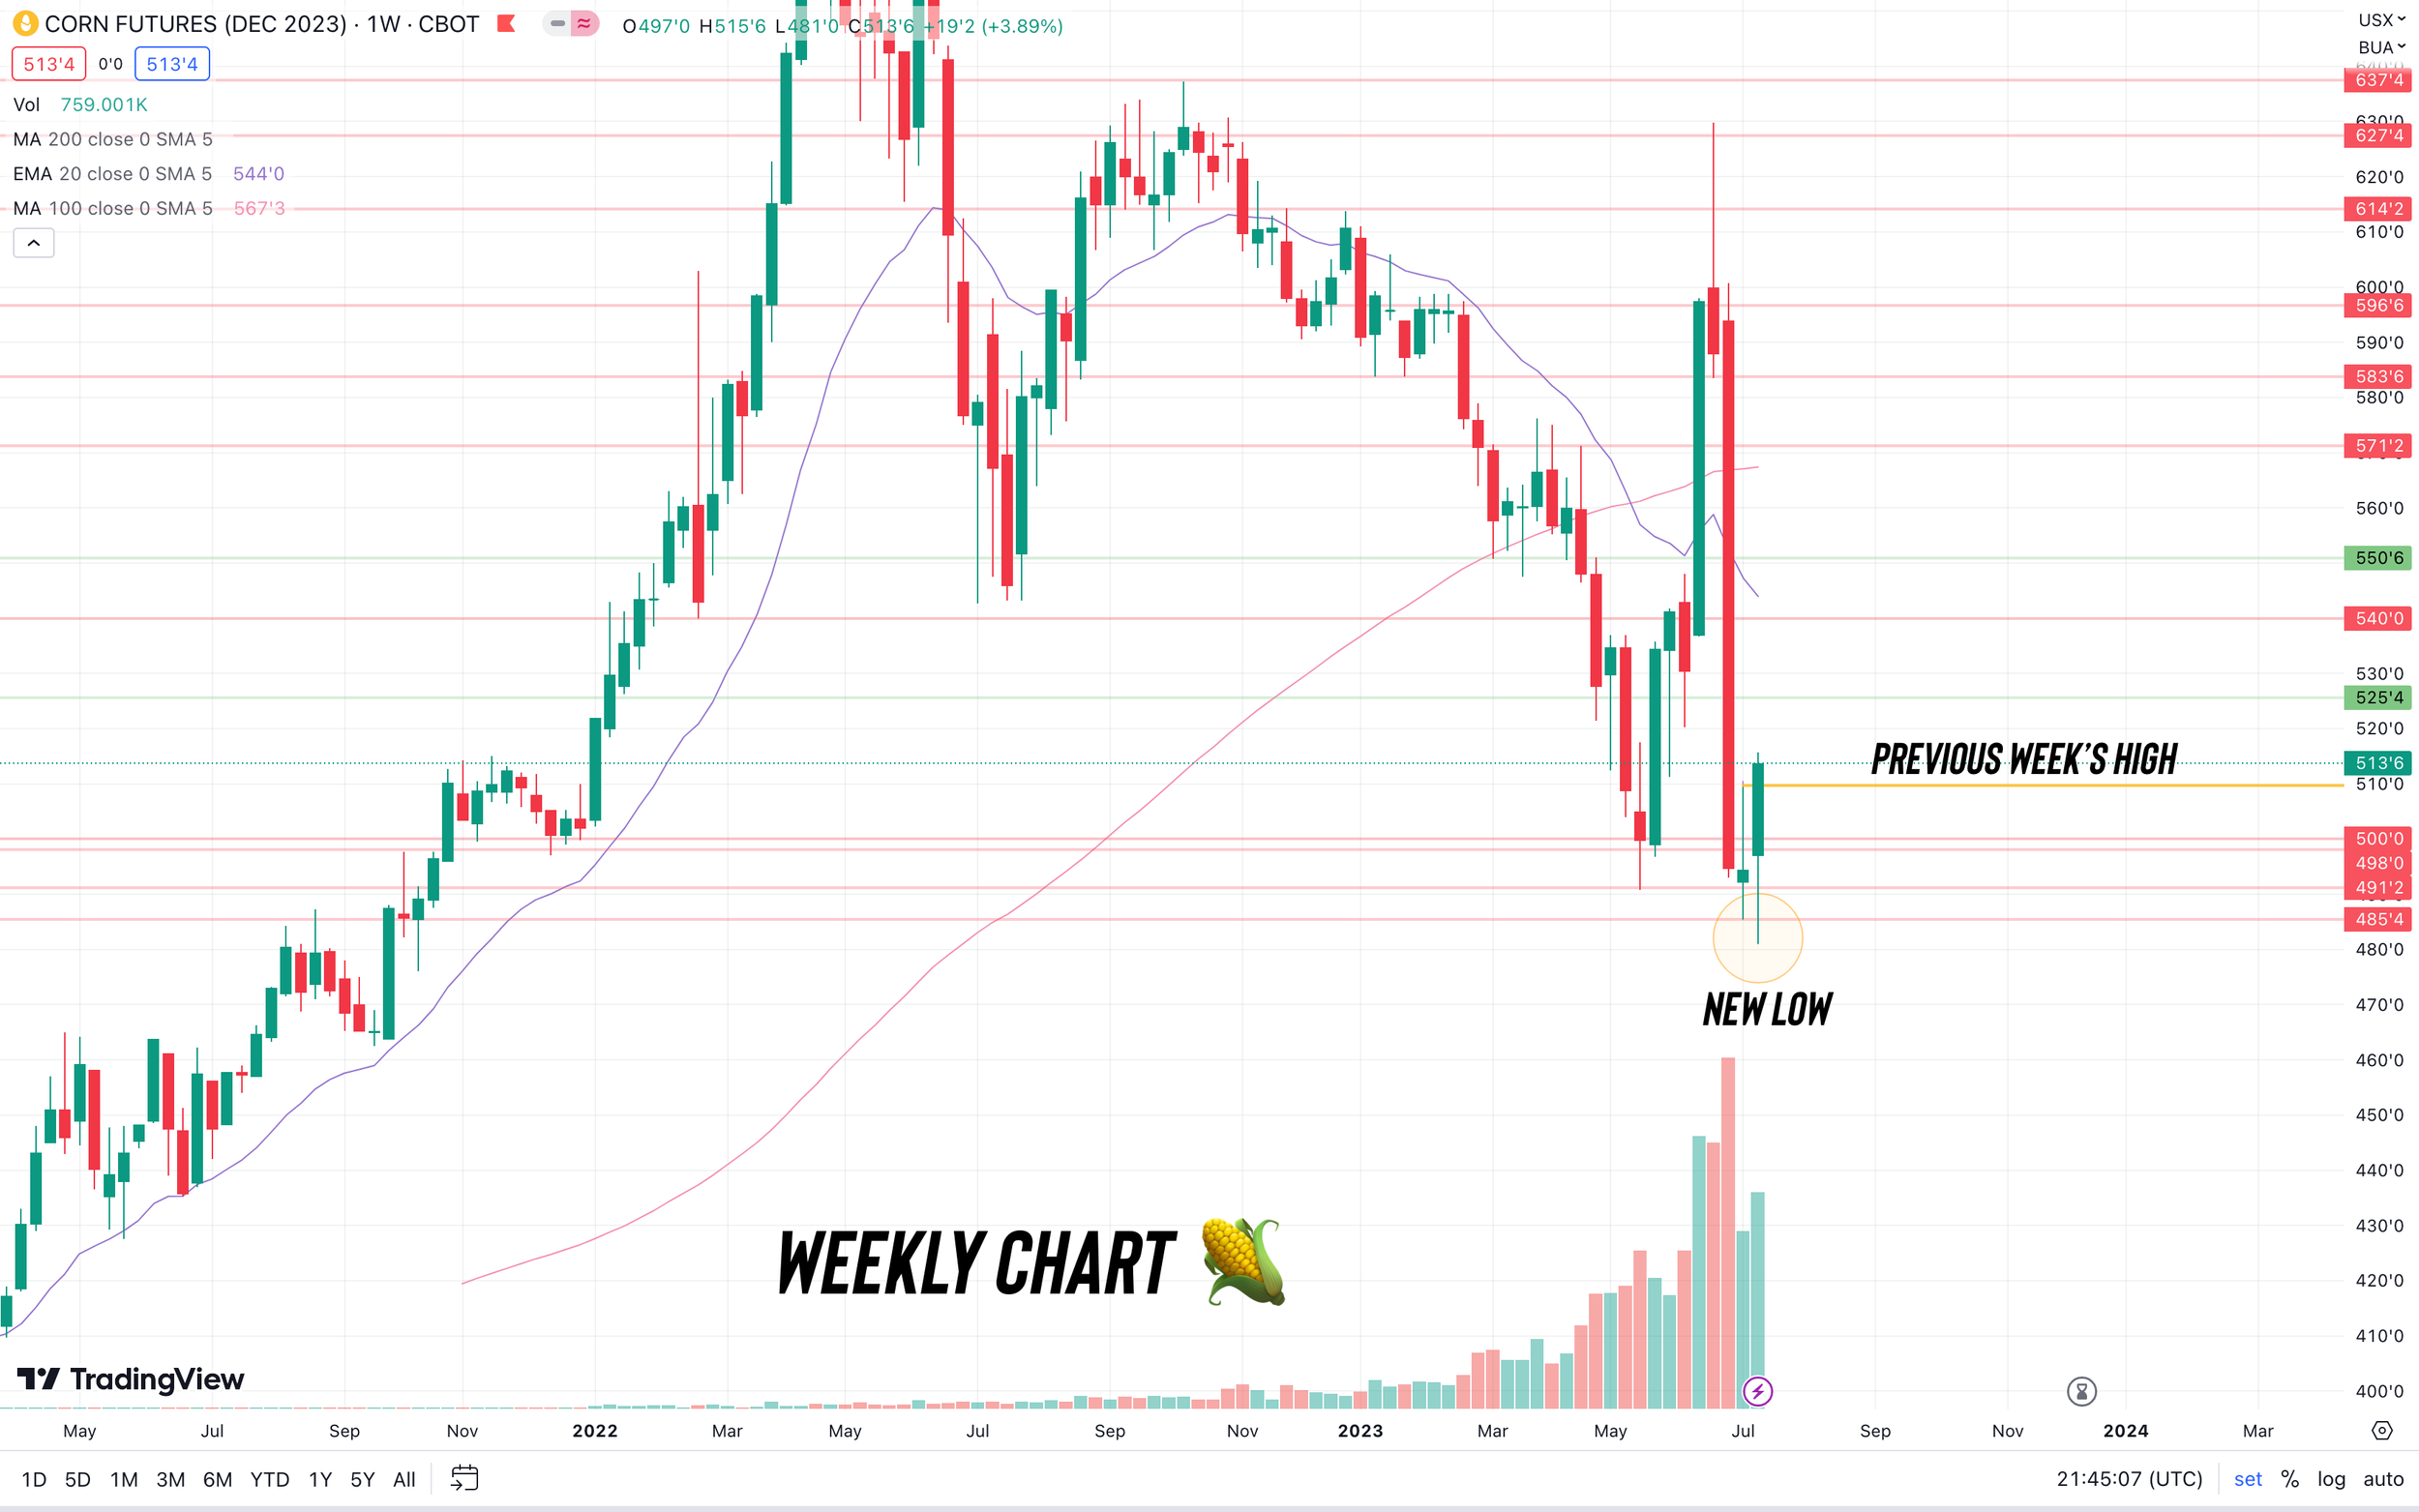
On the USDA report we see some neutral to bearish numbers printed. For corn we did see the yield dropped,but it was still an all time record. Despite the meltdown on the day of the report we managed to leave bullish reversals on the weekly charts. If we can follow up next week with some strength I think the corn market opens the door to plenty of upside in a hurry.
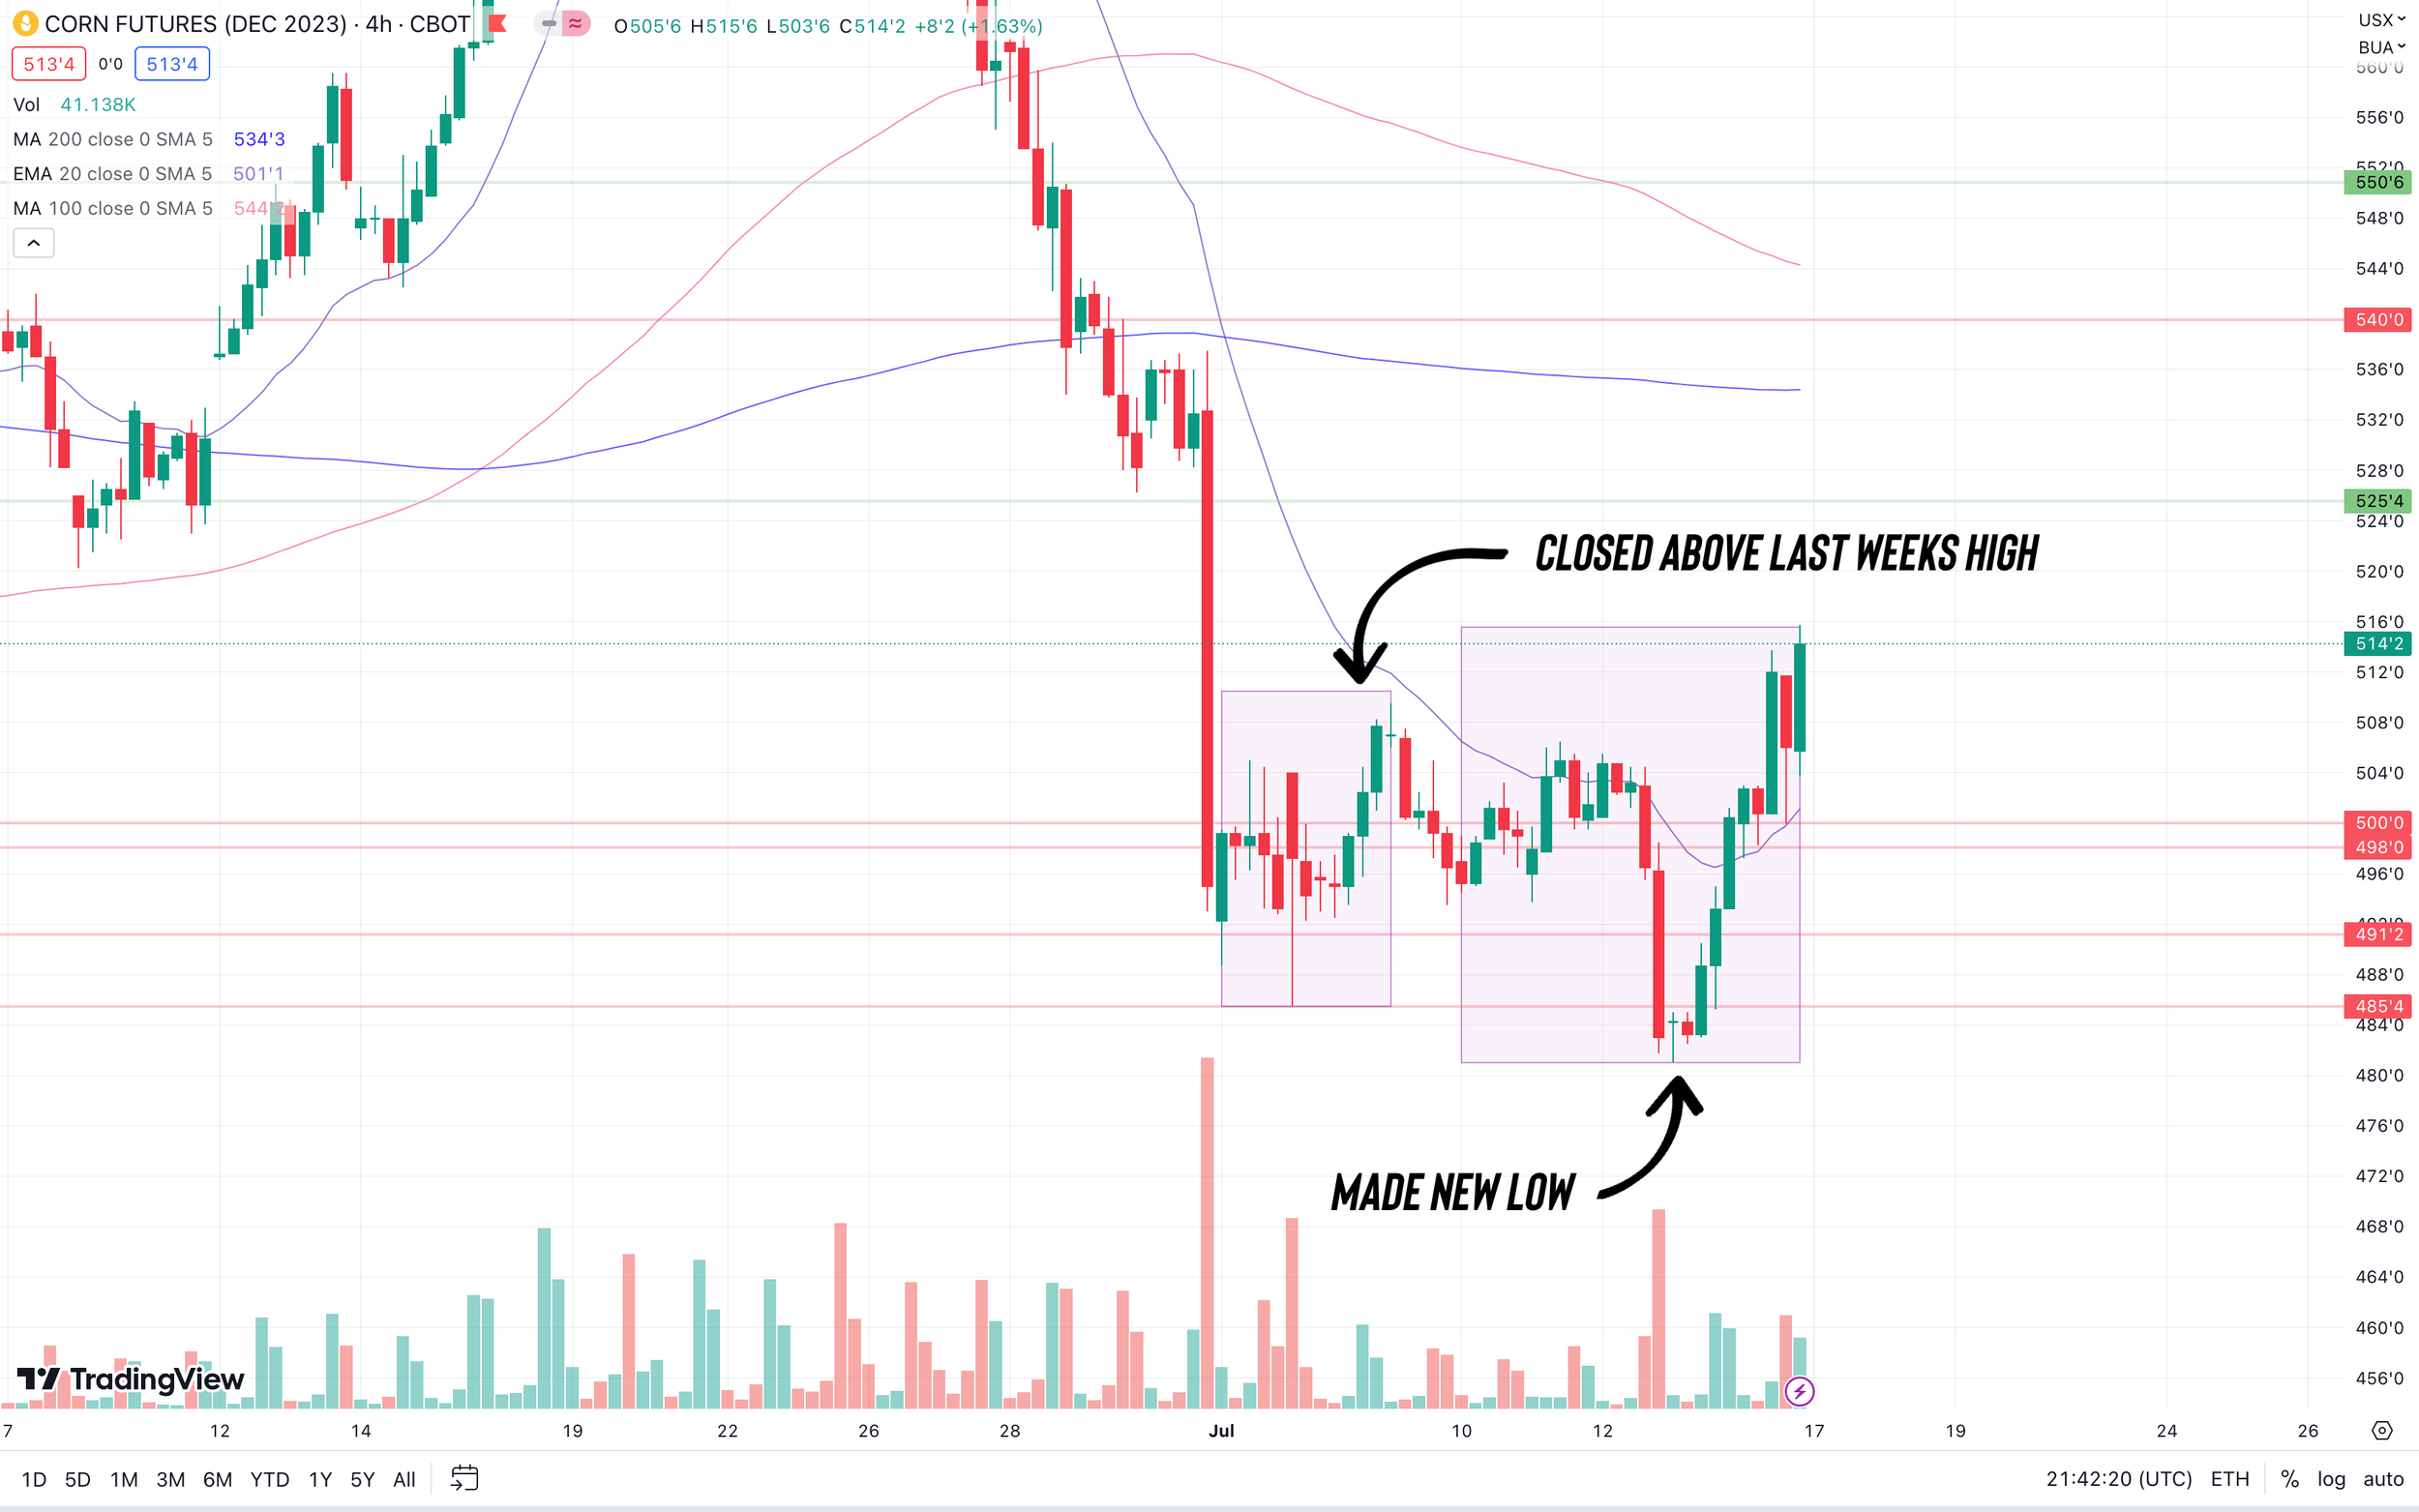
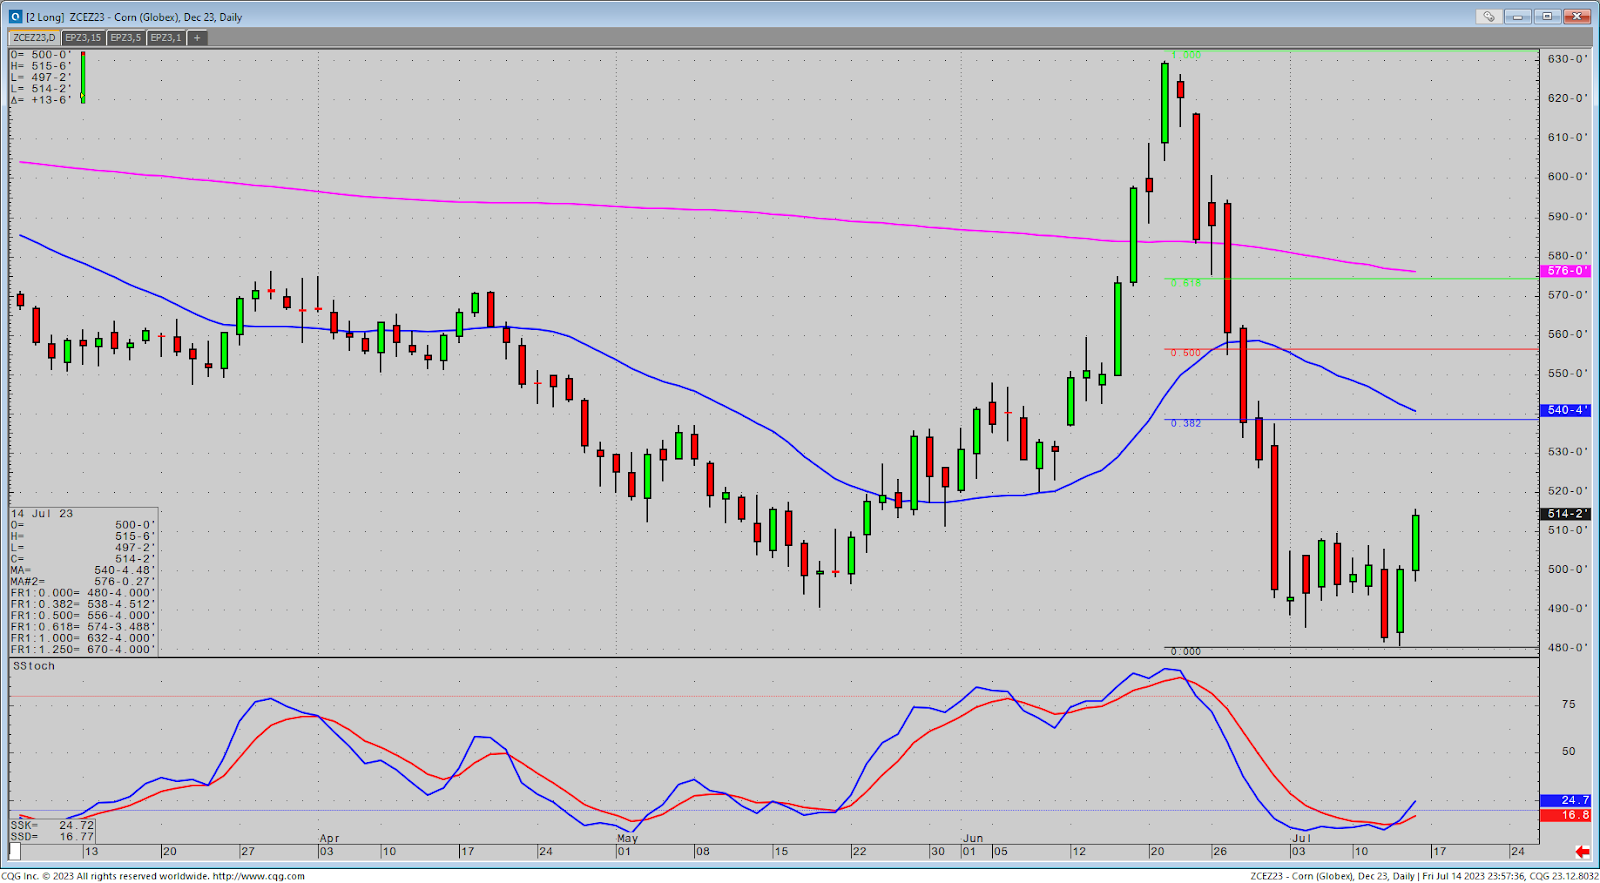
The markets really showed some volatility this week with having made a new low for Dec corn on Thursday, only to leave the weekly bullish key reversal. As we made a new low, we then followed that up Friday by closing above the previous week's high. This move is known as a very bullish indicator. Check out the charts.
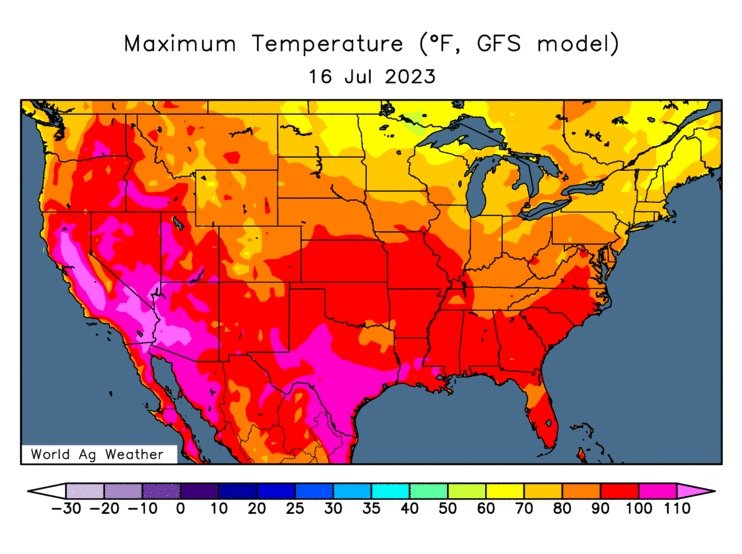
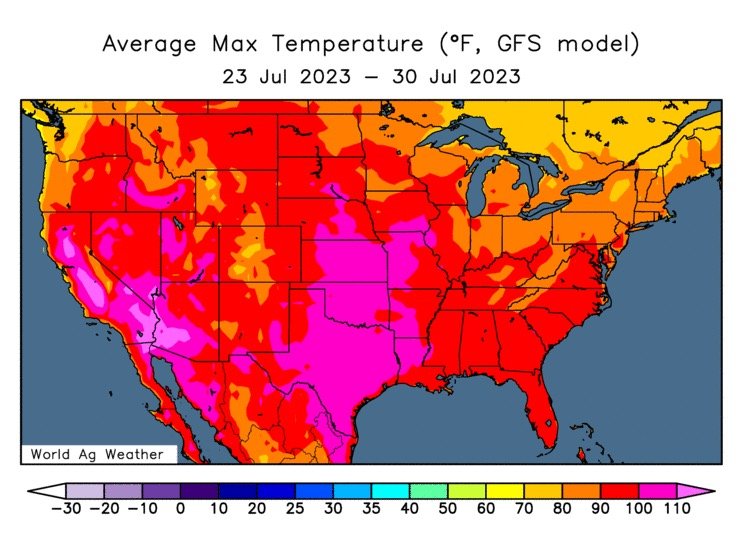
It appears that our bounce came from a couple different factors. First off is the fact that the market doesn’t appear to exactly believe the USDA forecast. Next is some of the hot weather that has started to enter the forecasts. Add the fact that we have seen some rumors regarding Chinese buying.
Technically the close was very strong and it tells me that I probably don’t want to have many target orders in unless they are near a resistance level. Which are 30-70 cents above Friday’s close. So my preference in terms of grain marketing would be to wait for the market to give me a sell signal in some fashion.
Presently I like owning call options, selling puts,bull spreading futures, and or buying futures. When the market gives a signal that it has exhausted the move then I want to be ready to take profits on any long position such as above and I want to make grain sales, sell futures, sell calls, buy puts, and or bear spread futures.
To be aggressive in grain marketing it is strongly recommended that one has a hedge account and utilizes it in a manner that helps par risk exposure while increasing profits. Over the years the farmers that have done the best and had the highest prices net for grain have done a couple key things.
The first thing that they have done is separate future prices and cash prices via becoming basis traders. So you need to know your basis, follow your local basis, and have an opinion on the direction of it. Next is that they tend to buy low and sell high. So when futures prices are low they are constantly buying calls, buying futures, selling puts, and bull spreading futures. Next is when they “Texas Hedge” and own courage calls, or have some position that makes money when the markets go up, they make sure to add to their bottom line via locking in profits on those types of positions.
Lastly when we rally they wait for a clear market sell signal and aggressively sell futures , sell calls, bear spread futures, and buy puts.
Depending on the strength of the sell signal and market outlook sometimes you will see them doing this on 100% or more of production.
When they do this they also like to ring the cash register so to speak and lock in profits that add to their bottom line.
WIth all of the tools that are out there it doesn’t take much luck to do better than the highest prices we get all year long. Take new crop December corn, there are several farmers that I work with that made over a dollar on the way up, made another dollar on the way back down, and presently are hoping to add another 40-70 cents on the present mini rally we have. The one thing that all have in common is a hedge account and they have exit plans or follow up plans should market bais change or they are at risk of taking from the bottom line.
We have a few that we work with that over the years have done a good job via just waiting for the sell signals and then making sales or buying puts and making money on the way down. This is very similar to the put program that Wright on the Market does.
Any hedging program that consistently adds to one's bottom line is a program that opens the door to consistently getting better than the highest prices traded.
If you are constantly losing money hedging then you might want to reconsider you grain marketing plan and find methodology that will keep you consistent instead of chasing what you might have missed.
To open a hedge account please give Wade a call at 605-870-0091 or give Jeremey a call at 605-295-3100
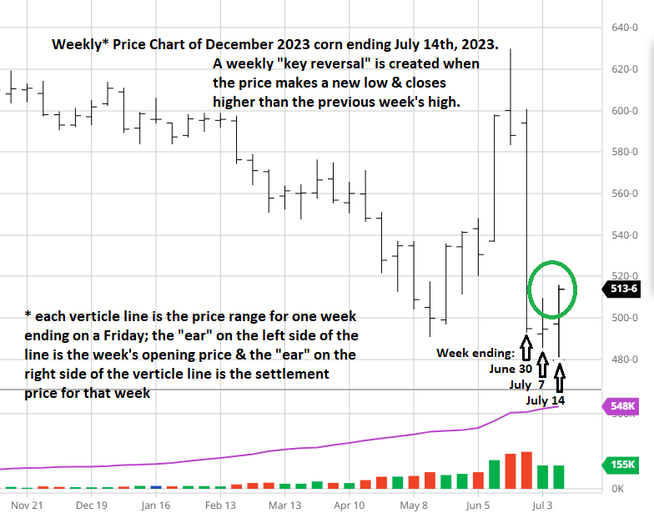
Here is another view of the key reversal that corn left. This is from Wright on the Market.
From Wright on the Market,
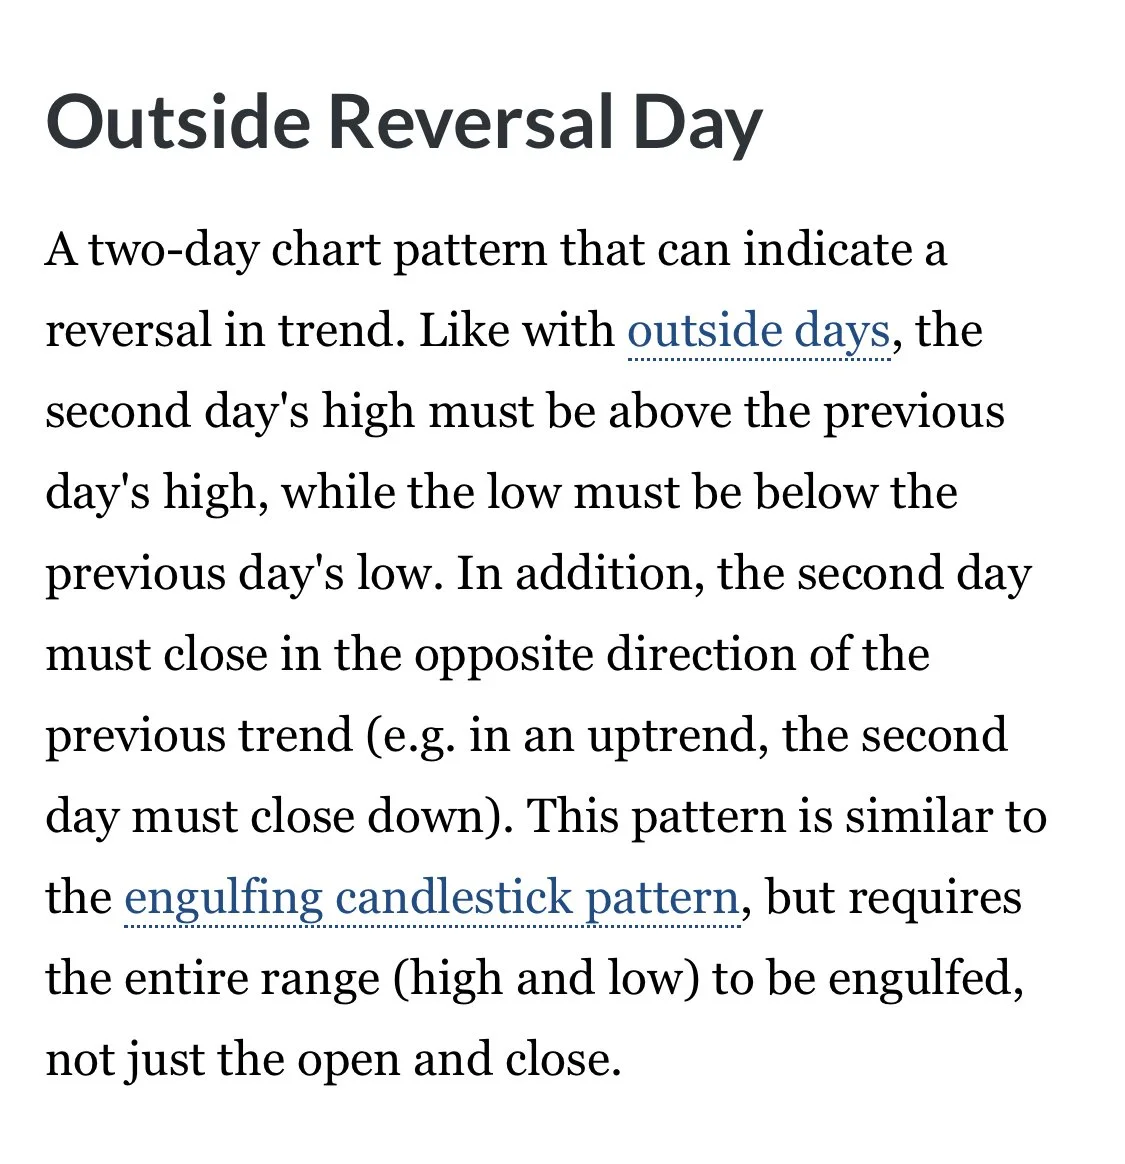
A daily “key reversal” higher is created when a price makes a new low for the move and then closes higher than the previous day’s high. It is a very bullish technical indicator. If the day’s opening trade price is higher than the previous day’s settlement before making the new low that day, it is even more bullish.
A weekly “key reversal” higher is created when a price makes a new low for the move and then closes higher than the previous week’s high. If the week’s opening trade price is higher than the previous week’s settlement before making a new low for the week, it is even more bullish.
Weekly chart action is a more reliable predictor of market action than the daily chart action. It makes sense since any weekly performance is a better indicator for everything than daily action.
Nothing is 100% in this business, but December corn, on its weekly chart, had a key reversal higher this week. Take a look at the weekly price chart.
What's an Outside Reversal Day?
Here is it definition of an outside reversal day and what we just saw in corn.
SAVE $450 BEFORE YOUR TRIAL EXPIRES
Limited time only. Take advantage of this massive discount.
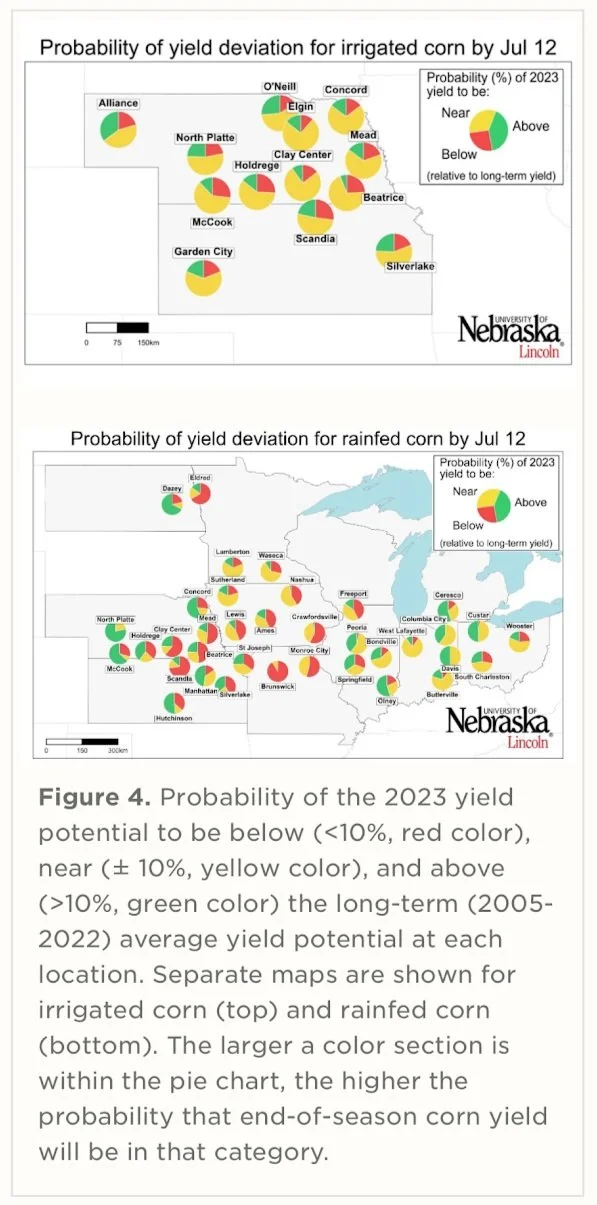
Look at the below from University of Lincoln Nebraska. It shows the probability of yield deviation for irrigated corn by July 12th.
Here is info on the Soybean Meal Put Program that was mentioned earlier from Wright on the Market.
September Soybean Meal Put Update
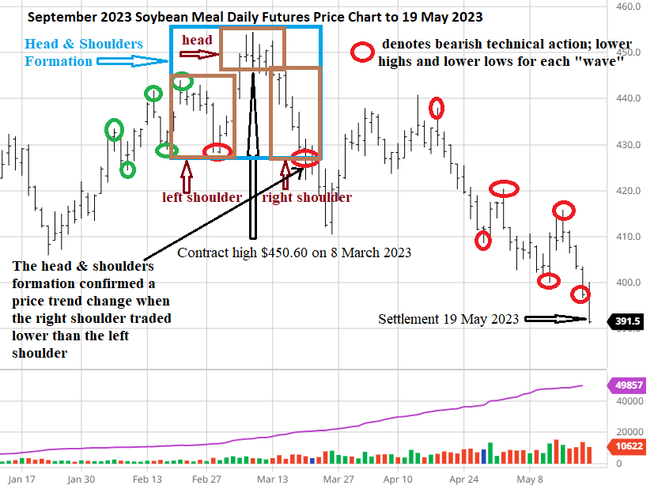
September soybean meal settled Friday at $391.50 per short ton, down $5.90. Each option is for 100 short (2,000 lbs.) tons. Participants in our put training exercise paid $5 a ton for the five strike price puts listed below. Listed is the current value (premium) of each of the five puts and the change for Friday:
How long do we recommend you keep your puts?
If one was looking to double his investment, there it is. If you did that every six months for a couple years, you would have your picture on the cover of Forbes Magazine.
Roger’s opinion is to keep the puts at least as long as the price trend is making lower highs and lower lows on each “wave” and then expect the market action to be choppy (sideways for a month or two) and pick a day when futures are near the low of the sideways trading range to sell the puts or sell the puts on expiration day (August 25), whichever comes first.
When the big spec funds start unwinding (liquidating) their bean oil/bean meal spreads (bought bean oil and sold bean meal; the buy side is always stated first), Roger thinks September bean meal futures will easily reach $340 and $300 is probably closer to the low than $340 will be. Last year, the day July soybean futures made the high for the year at $17.84 on June 9th, July soybean meal traded at $413. July 2023 beans settled Friday at $13.07. Yep, soybean meal has a lot of down-side potential and meal can and will go down while beans are going higher because bean oil will be the price leader.
Note the price action since January:
For more information about head and shoulders formation, go to:
https://www.wrightonthemarket.com/post/head-and-shoulders-formations
Background
In January, we recommended participating or following the put program, as we wanted our clients to use this same put program when we or you think corn, beans and wheat has topped or the downside risk needs to be eliminated. We had done the same exercise on soft red winter wheat beginning 14 April 2022 with September 2022 wheat puts. It was very profitable.
The put program enables one to capture the extra profit of a higher futures price even after 100% of the crop has been priced. For the soybean meal example, there was no contracting of meal, simply using the meal puts to demonstrate how puts can be a valuable marketing tool for you.
Buying puts for a fixed price per put, but progressively higher strike prices will automatically pick the top of the market, no matter how high it is. The key to success is not to get emotional and do not run out of money. This put program is a marathon and cash is the oxygen to keep it going. You need to analyze the cash resources you and your merchandiser have and spend an amount on each put that will allow you to buy multiple puts as the futures market goes higher. The last put purchased will make the most money and we do not want you to miss it. There will never be a margin call for a purchased option. The risk of buying a put (or a call option) is limited to what is paid for the option.
For this educational put program, we selected soybean meal because the nearby meal futures contract had already moved $100 per ton higher by January from its July lows to the $480 range and was still in an uptrend. The all-time high for meal futures was $554 in 2012. We did not expect meal futures to take out $554 by any significant amount.
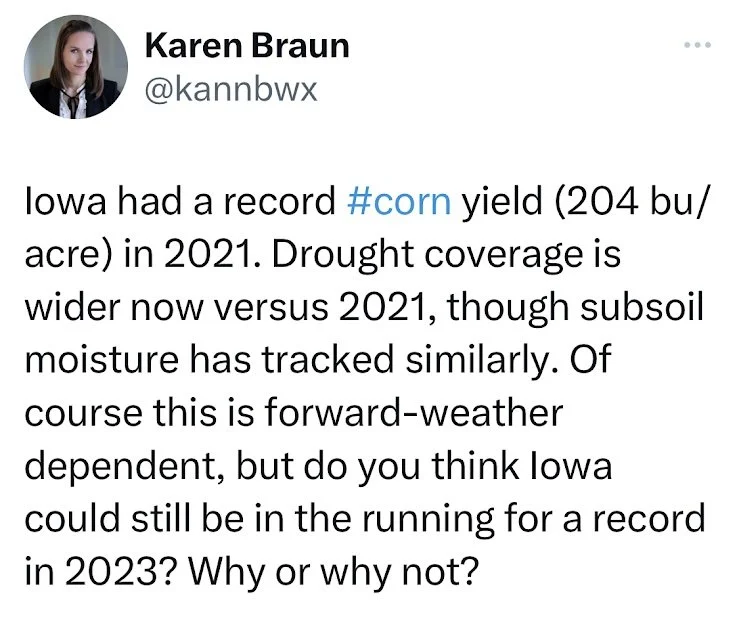
Does drought hurt all areas?
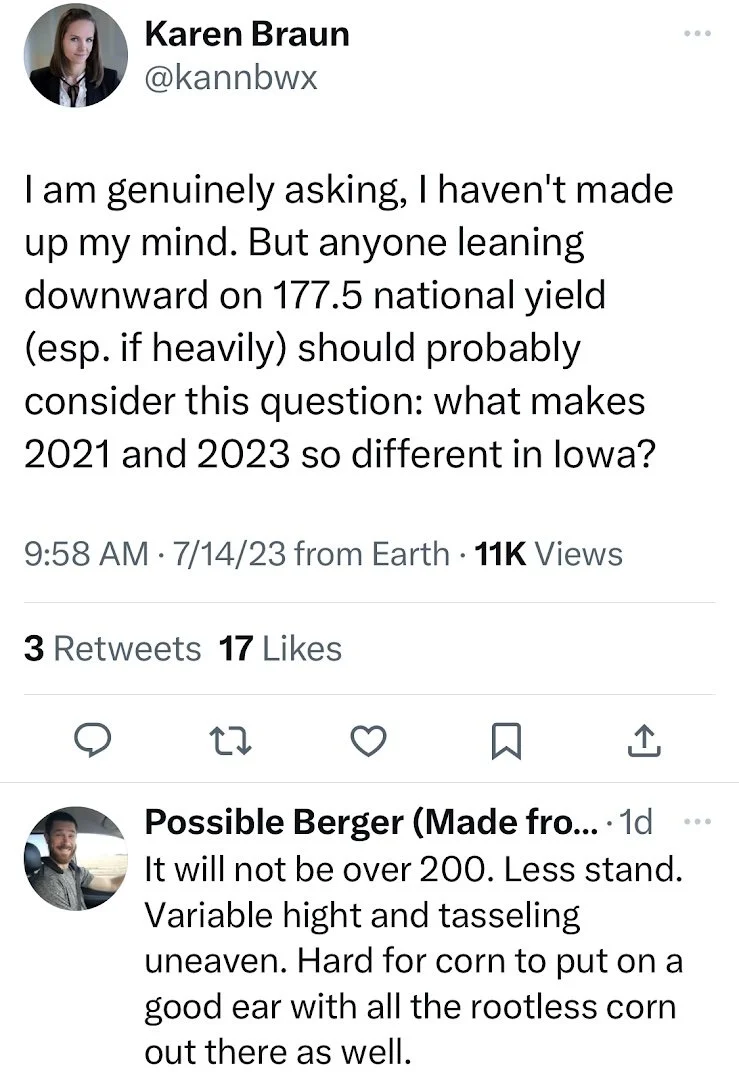
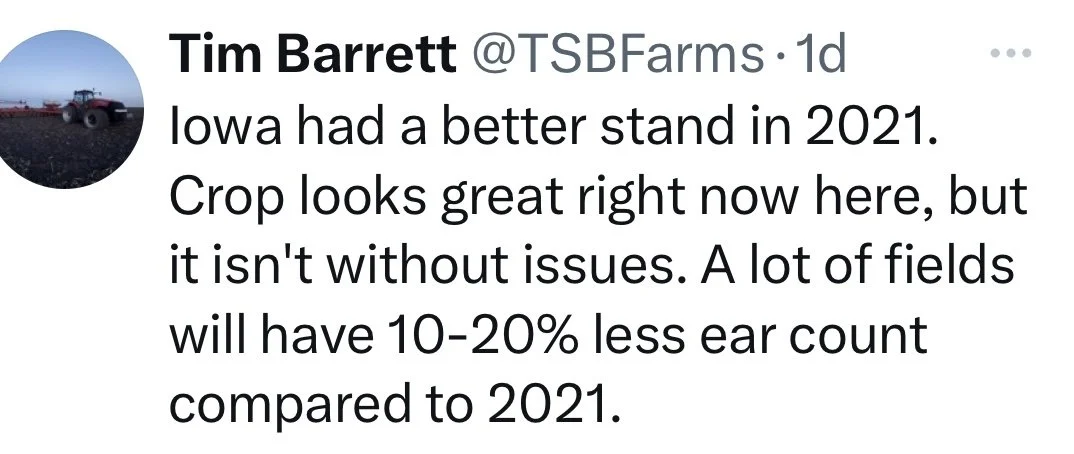
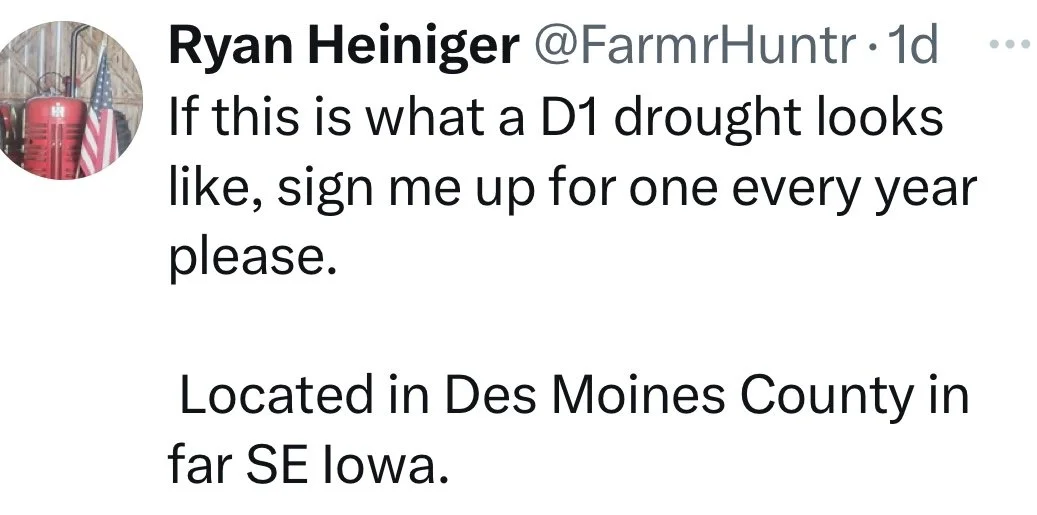
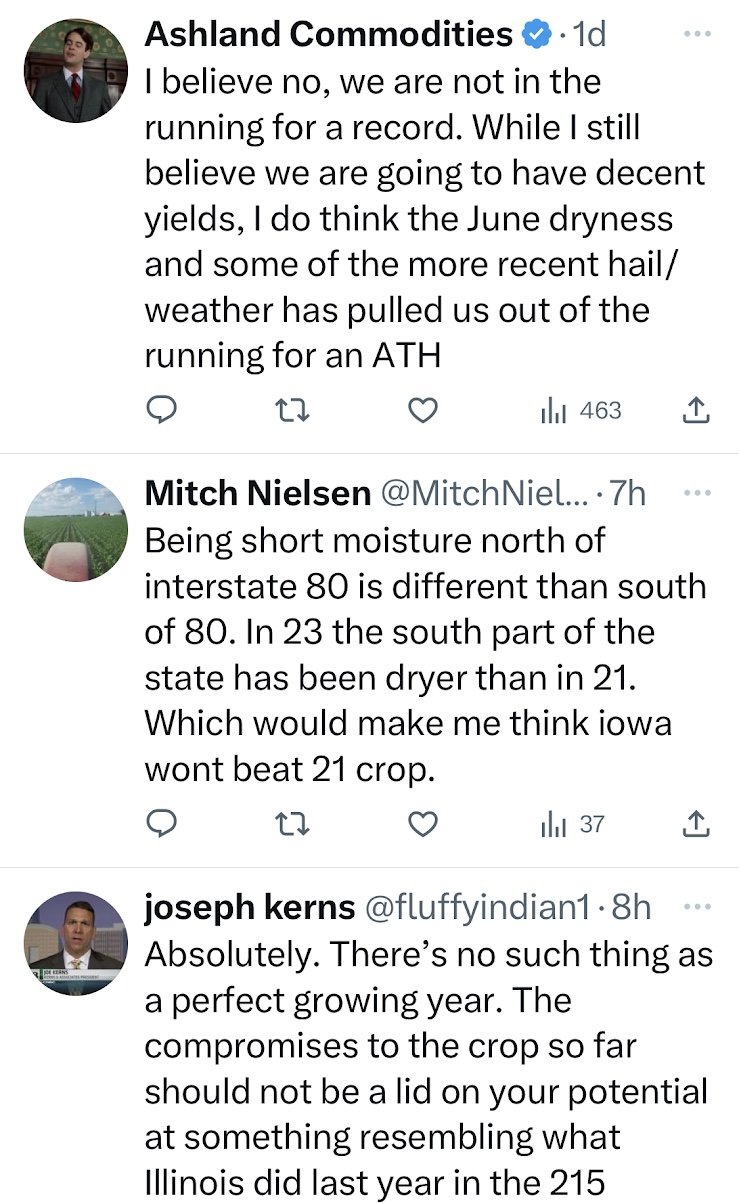
Take a look at this twitter post and some of the replies to it.
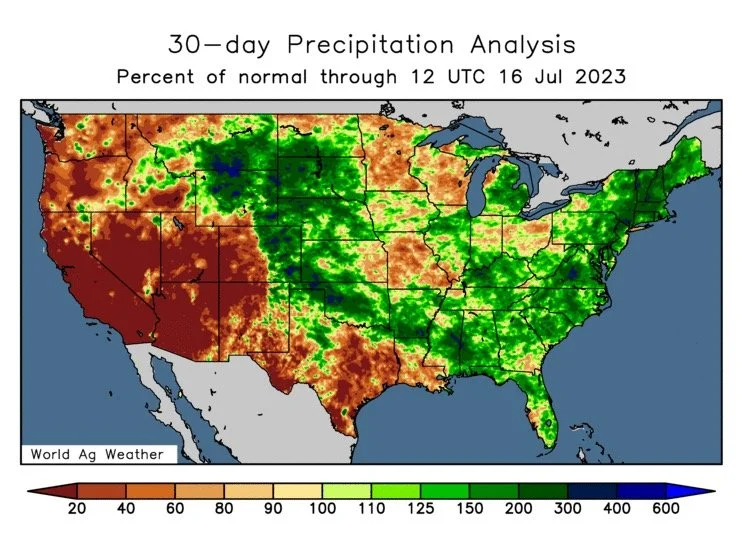
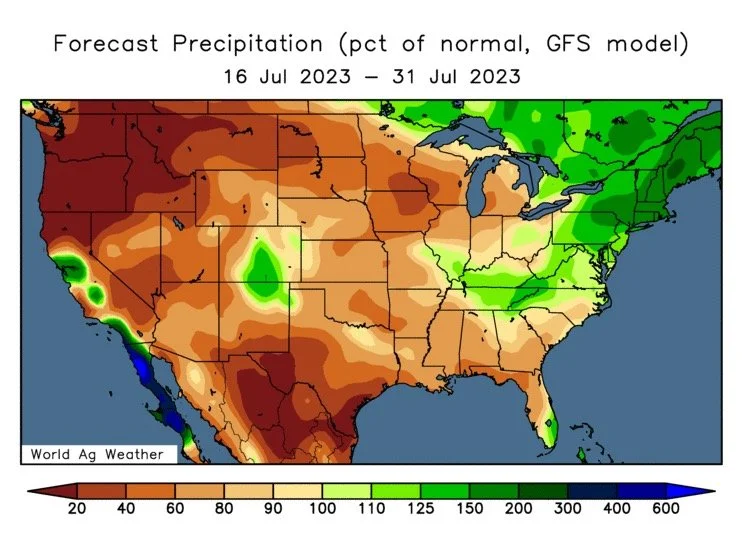
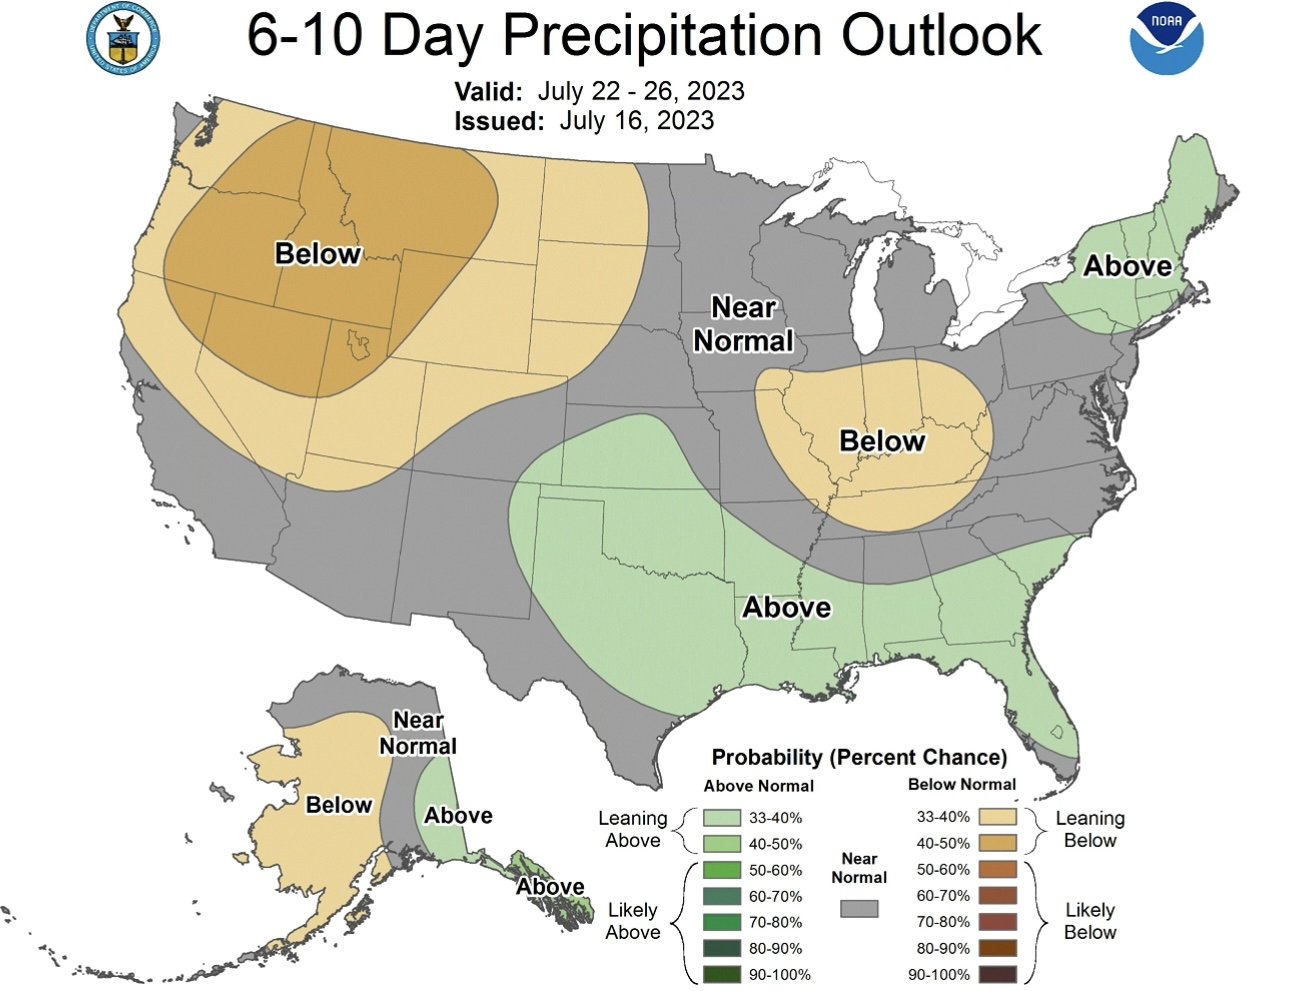
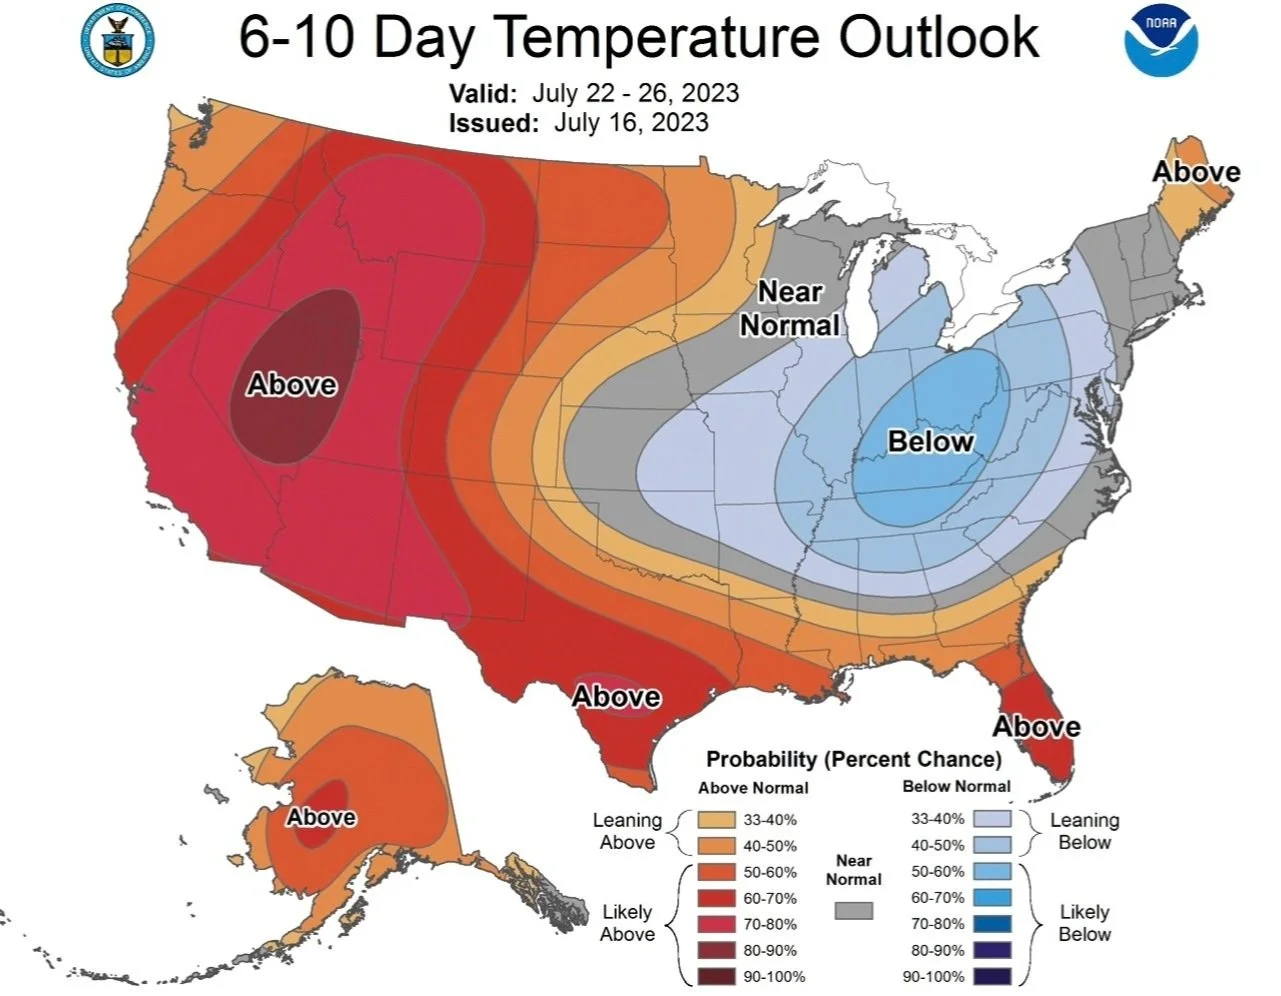
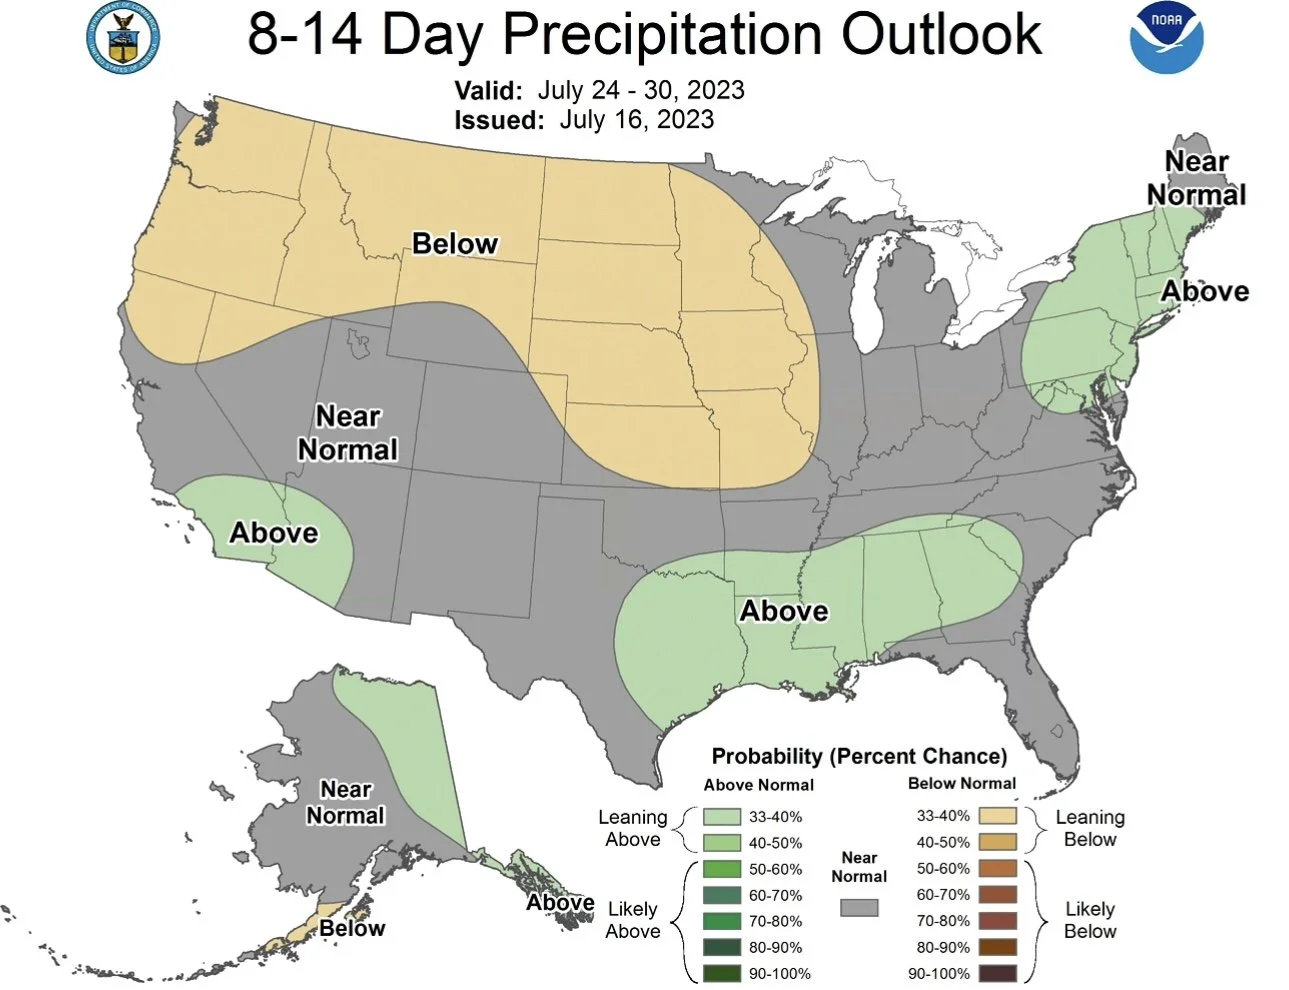
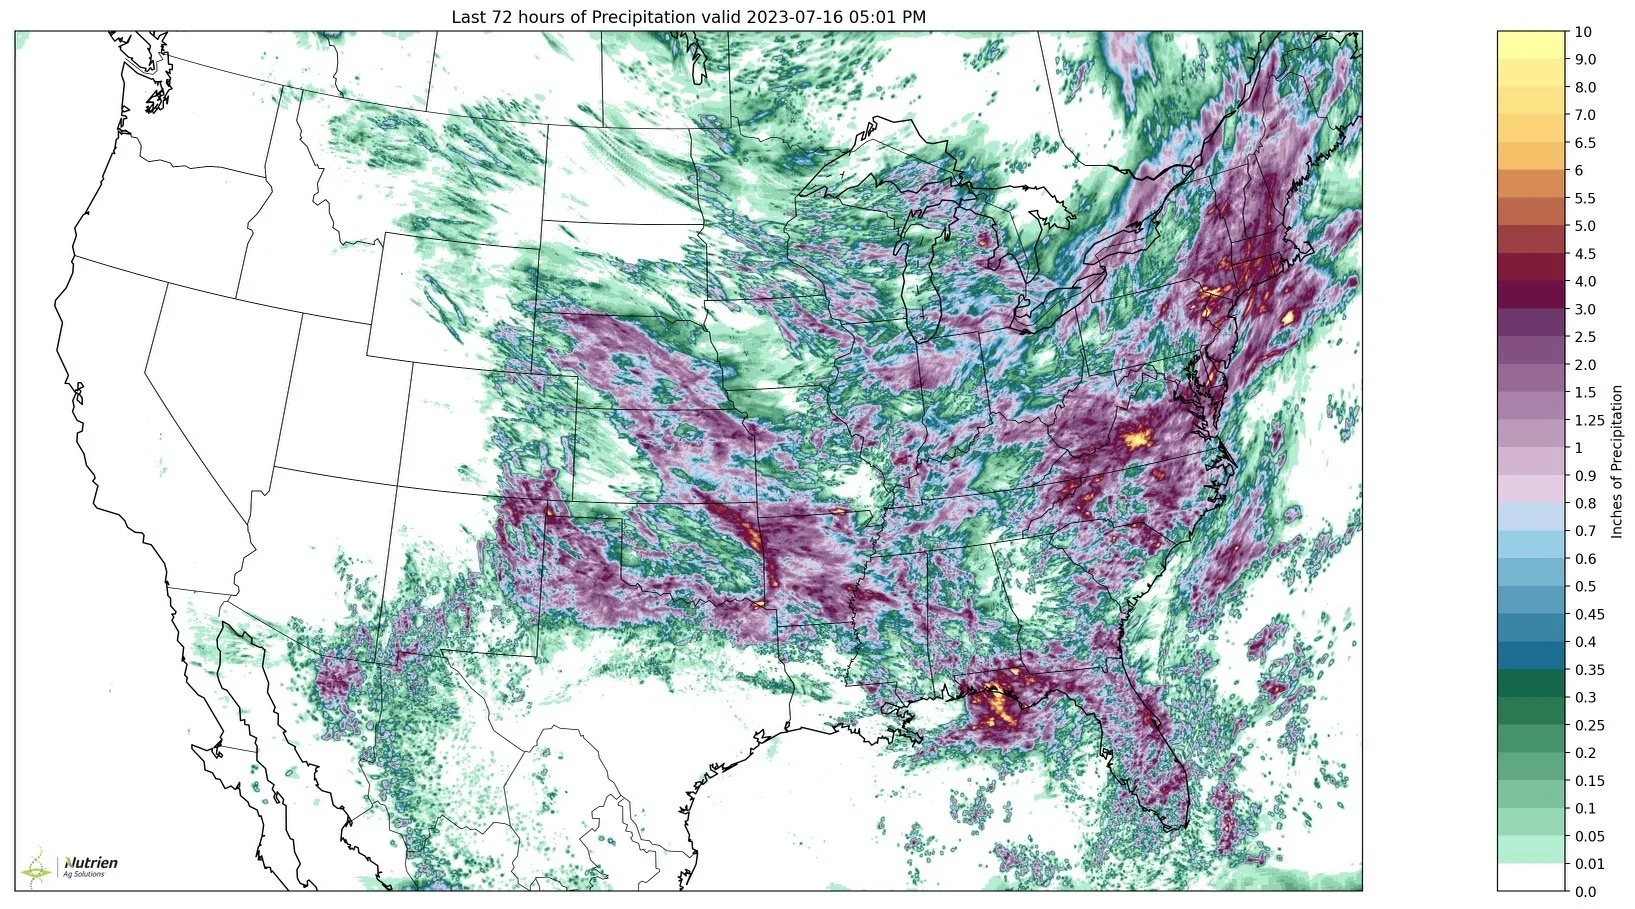
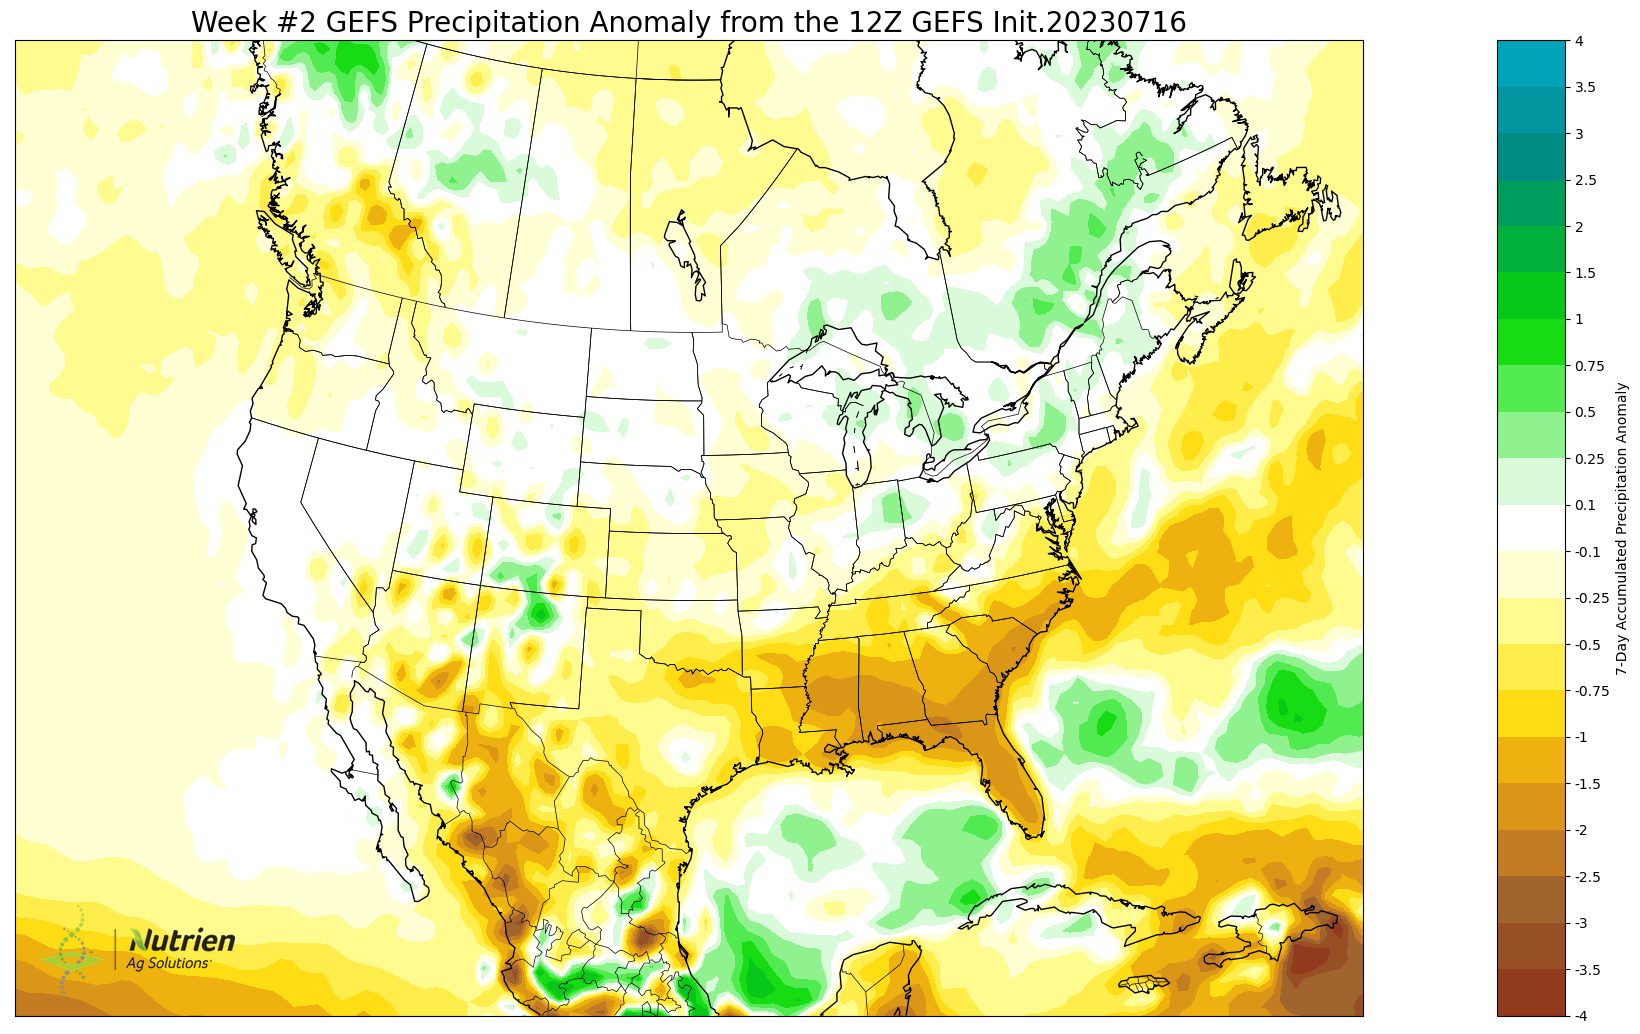
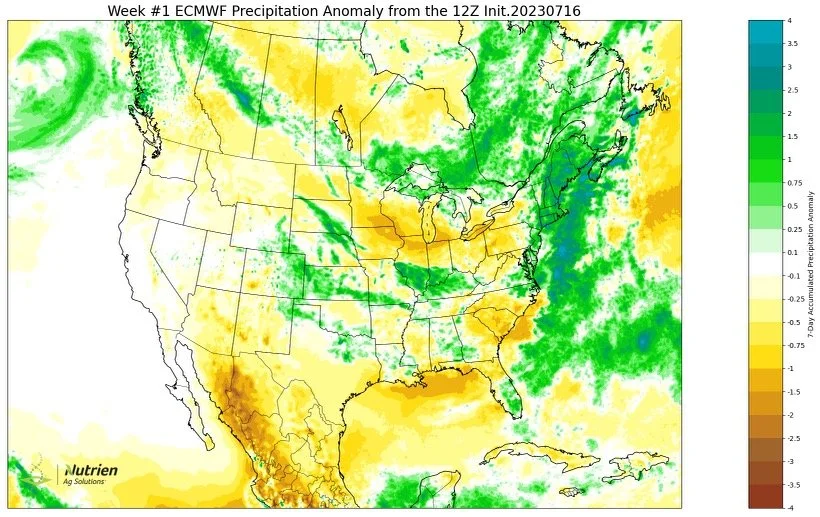
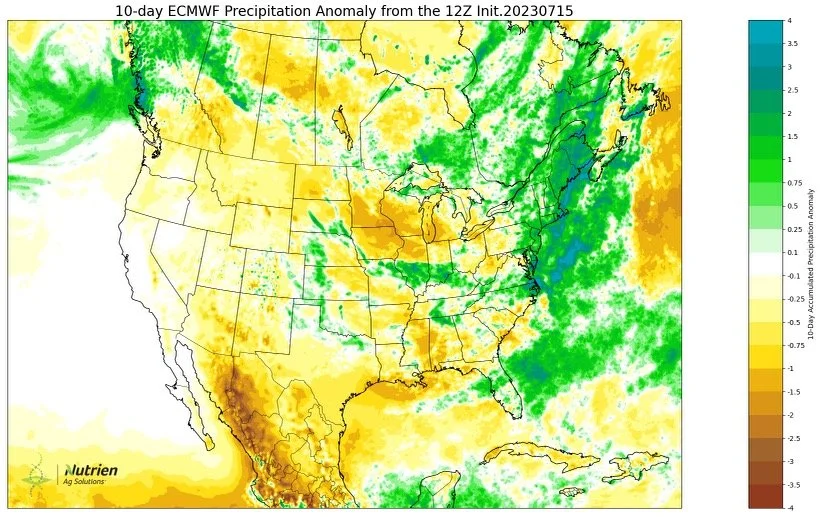
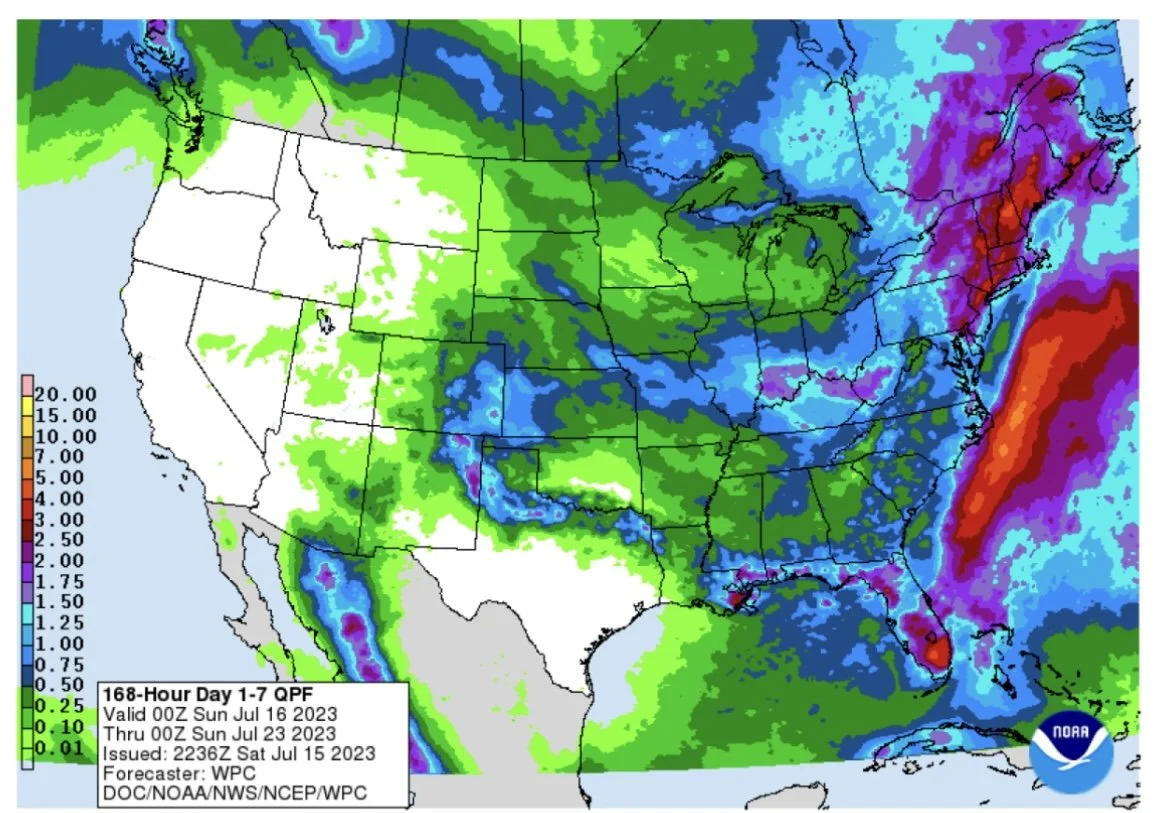
Here are some weather maps.
