
GLOBAL GRAIN SITUATION, ACRE TALK, CHARTS & MORE
MARKET UPDATE
You can scroll to read the usual update as well. As the written version is the exact same as the video.
Timestamps for video:
USDA & Corn Export Story: 0:00min
World Grain Situation: 2:50min
Acre Talk: 4:10min
Corn: 6:00min
Soybeans: 9:20min
Wheat: 11:40min
Want to talk or put together a market plan?
(605)295-3100
Enjoying your free trial?
Here is 50% off before it expires: Click Here
Futures Prices Close

Overview
Corn leads the way higher today while the rest of the markets especially soybeans bleed.
Yesterday's report was far from bearish, in fact most would have considered it somewhat bullish.
So why did the markets trade lower?
Well for starters, corn was example was trading higher before the report. Then the report came out and traders saw that the USDA did not bump exports higher. Many thought there was a chance they would, so traders got disappointed and sold despite the report not actually being bearish.
It also could’ve simply been a "buy the rumor sell the fact report" where the trade buys on hope the report will be friendly, then sells when they get confirmation.
Let's dive into the numbers.
First for the US balance sheets, there was virtually zero changes made aside from a small bump in wheat demand.
A non-event there.
Yesterday's post report audio: CLICK HERE
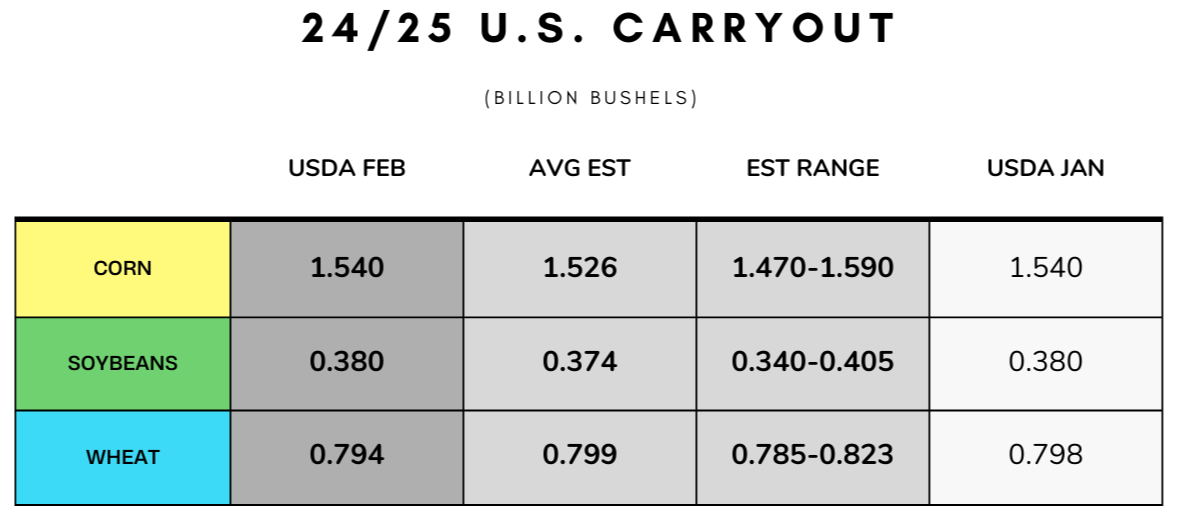
Looking at corn exports, they were left unchanged at 2.450 billion.
I personally think exports will "eventually" be raised, but keep in mind that last month the USDA actually lowered exports. So it did not make much sense for them to lower exports last month then raise them this month.
Moving forward, there is a real argument to be made that exports need to be bumped higher.
I talked about this Monday as well, how exports "could" lead to corn seeing a sub 10% stocks to use ratio (which is bullish).
Exports are ON PACE to be +385 million bushels above last year.
From Brock Report
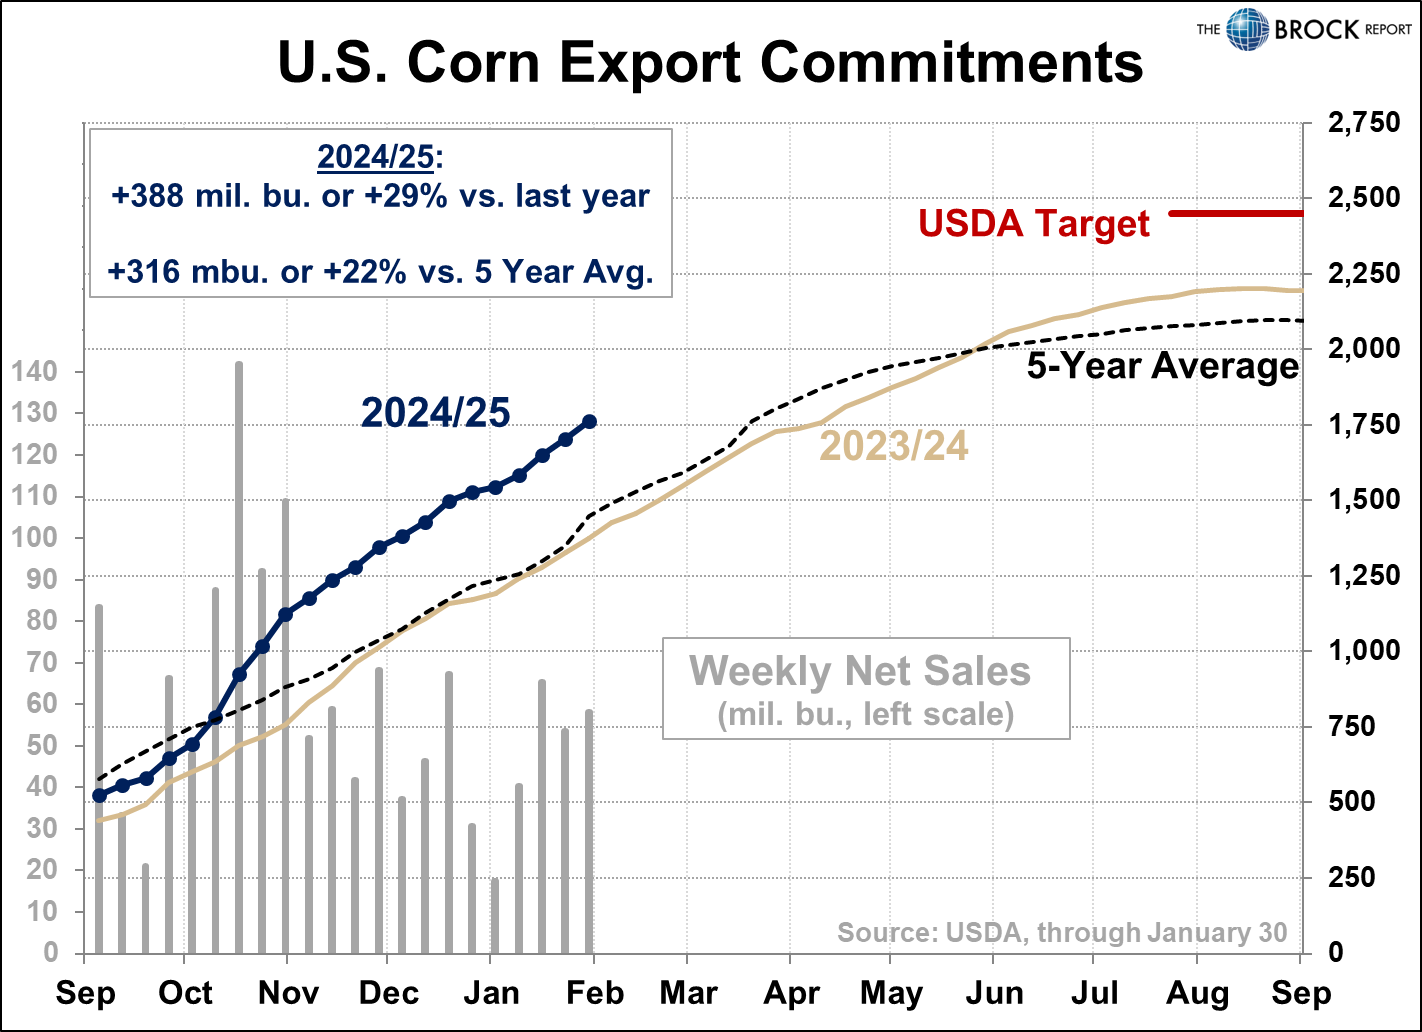
IF exports continued at this pace, that would mean exports should be at 2.650 billion this year.
The Math:
Last Year Exports: 2.300 billion
Above Pace vs Last Year: 385 million
2.300 billion + 385 million = 2.650 billion
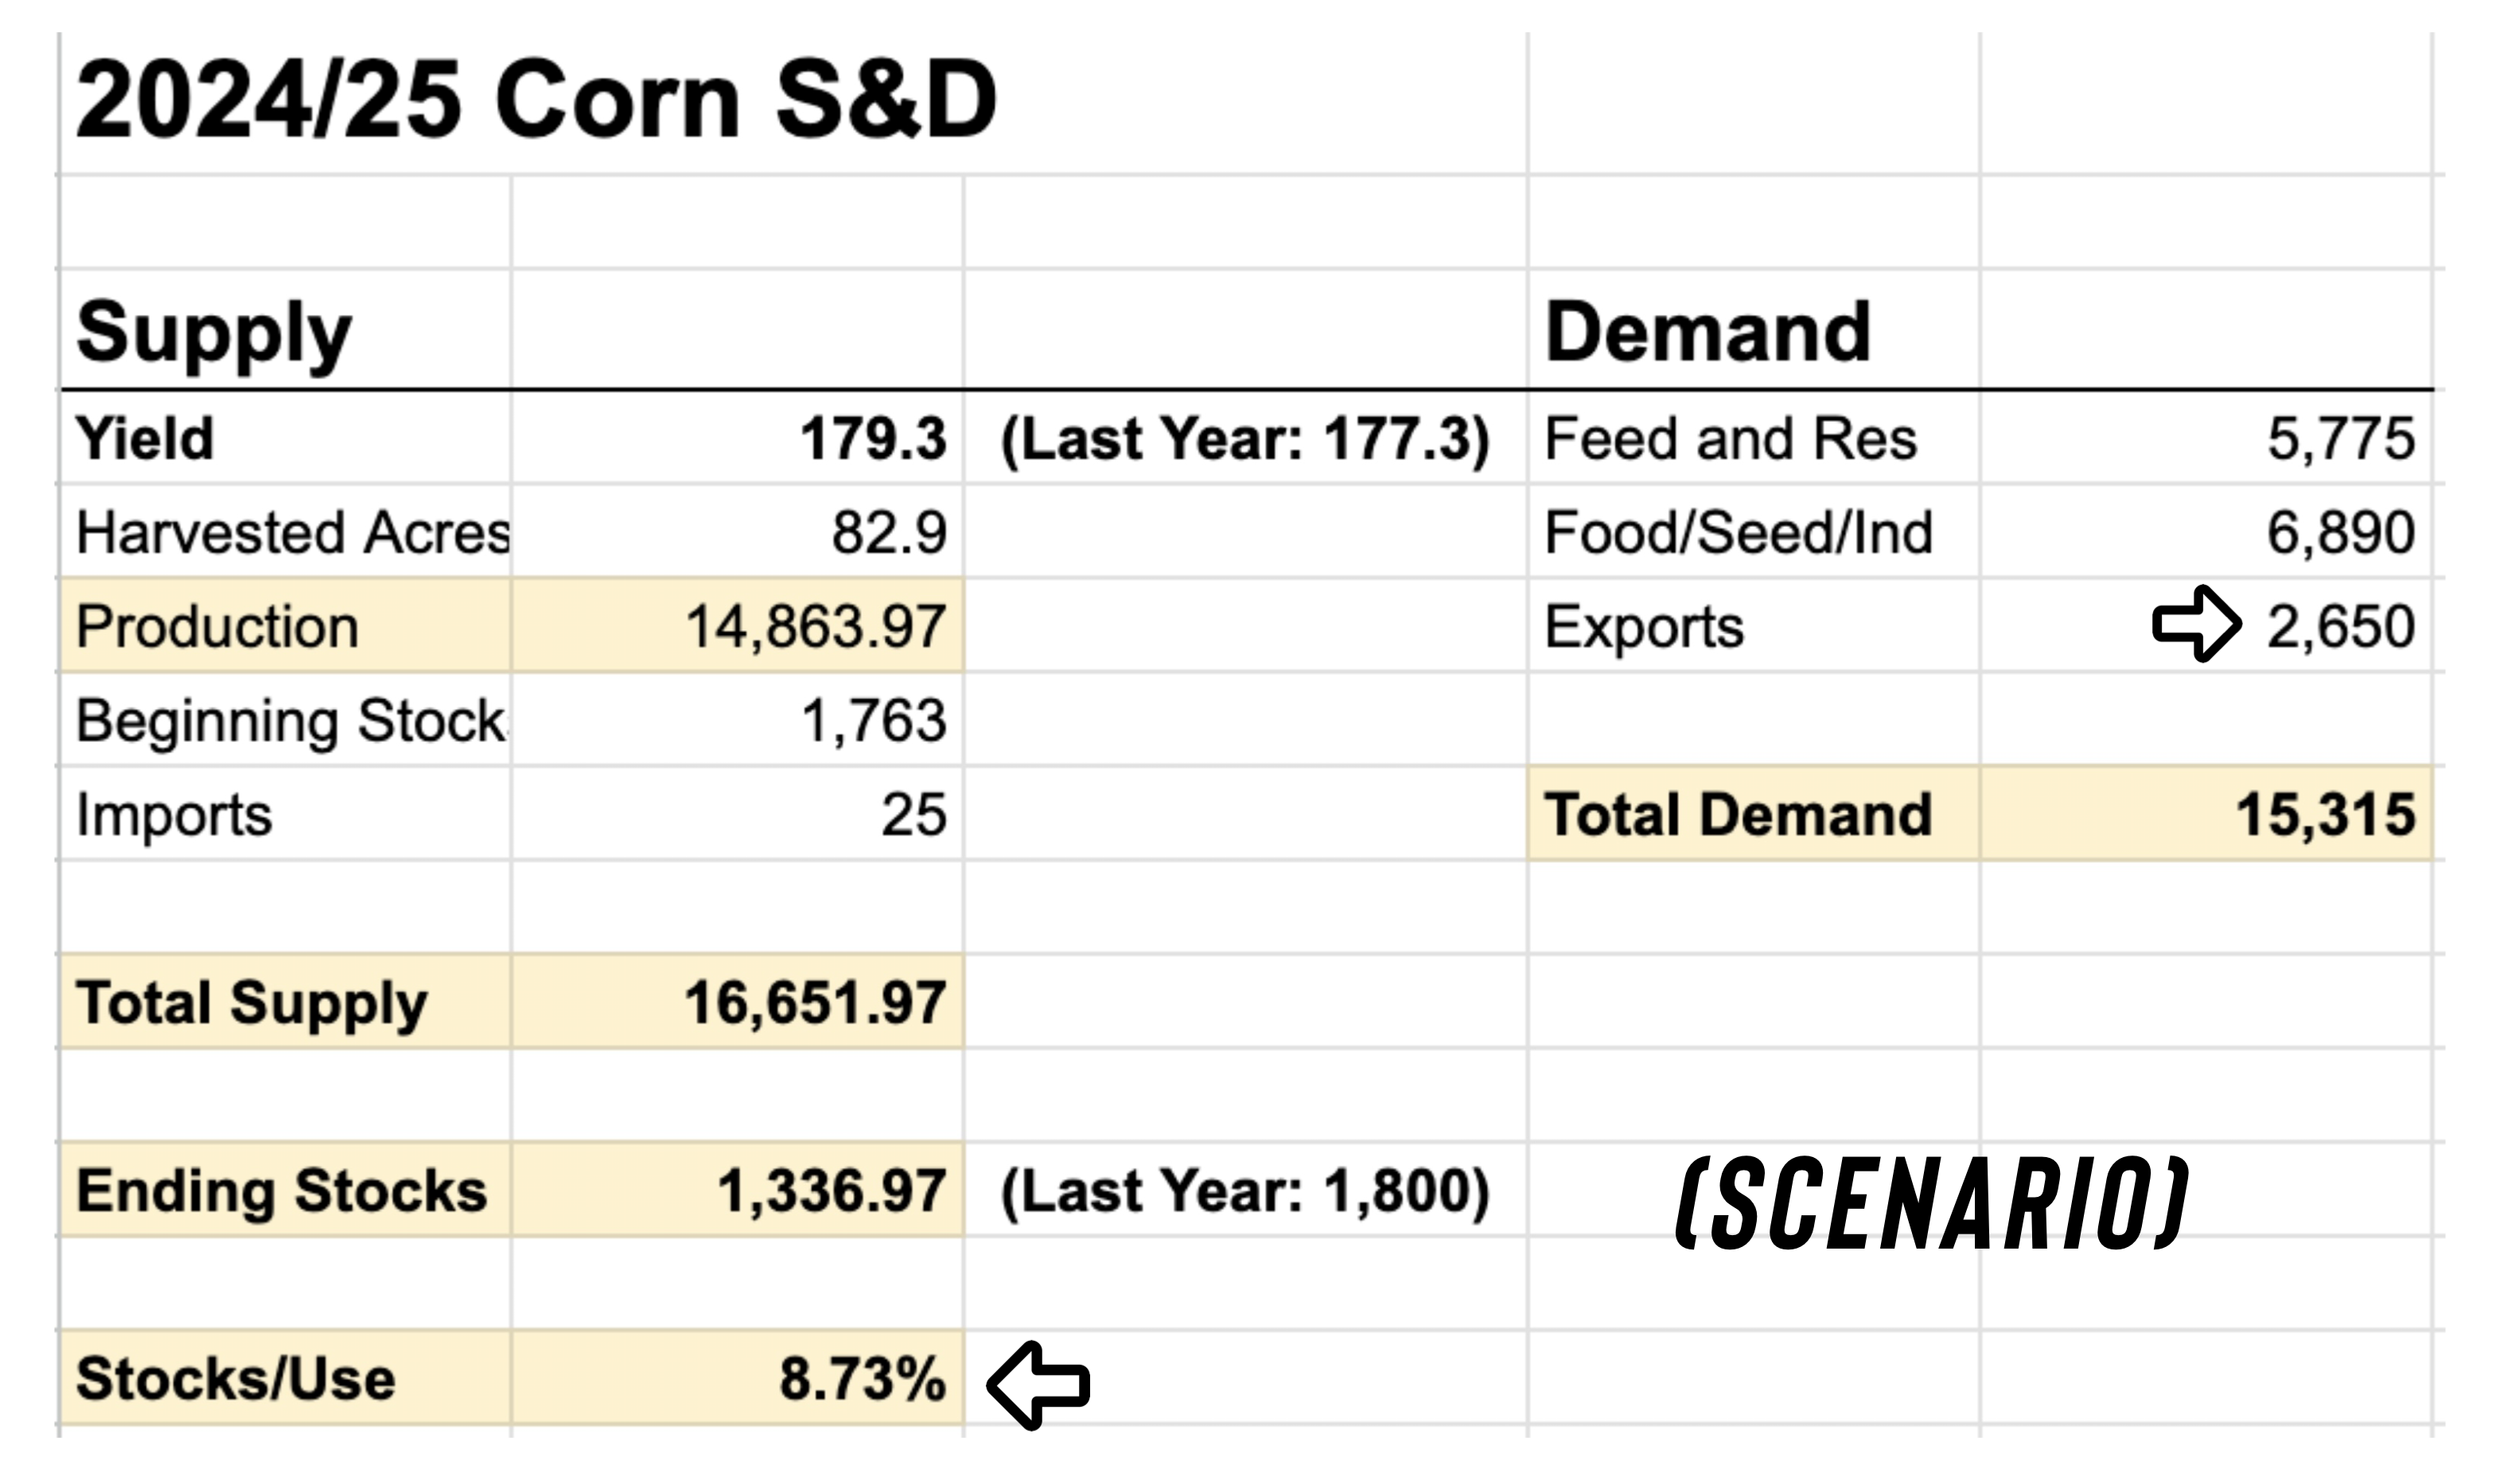
Here is how the balance sheet would change IF exports were raised another +200 million from here to 2.650 billion vs the USDA's current projection of 2.450 billion.
(This is without any other changes made to the balance sheet. Only exports. There will of course be plenty of other factors.)
It would drop carryout to 1.30 billion and drop the stocks to use ratio below 9%.
Of course, this is far from a given.. but the possibility for this is definitely there.
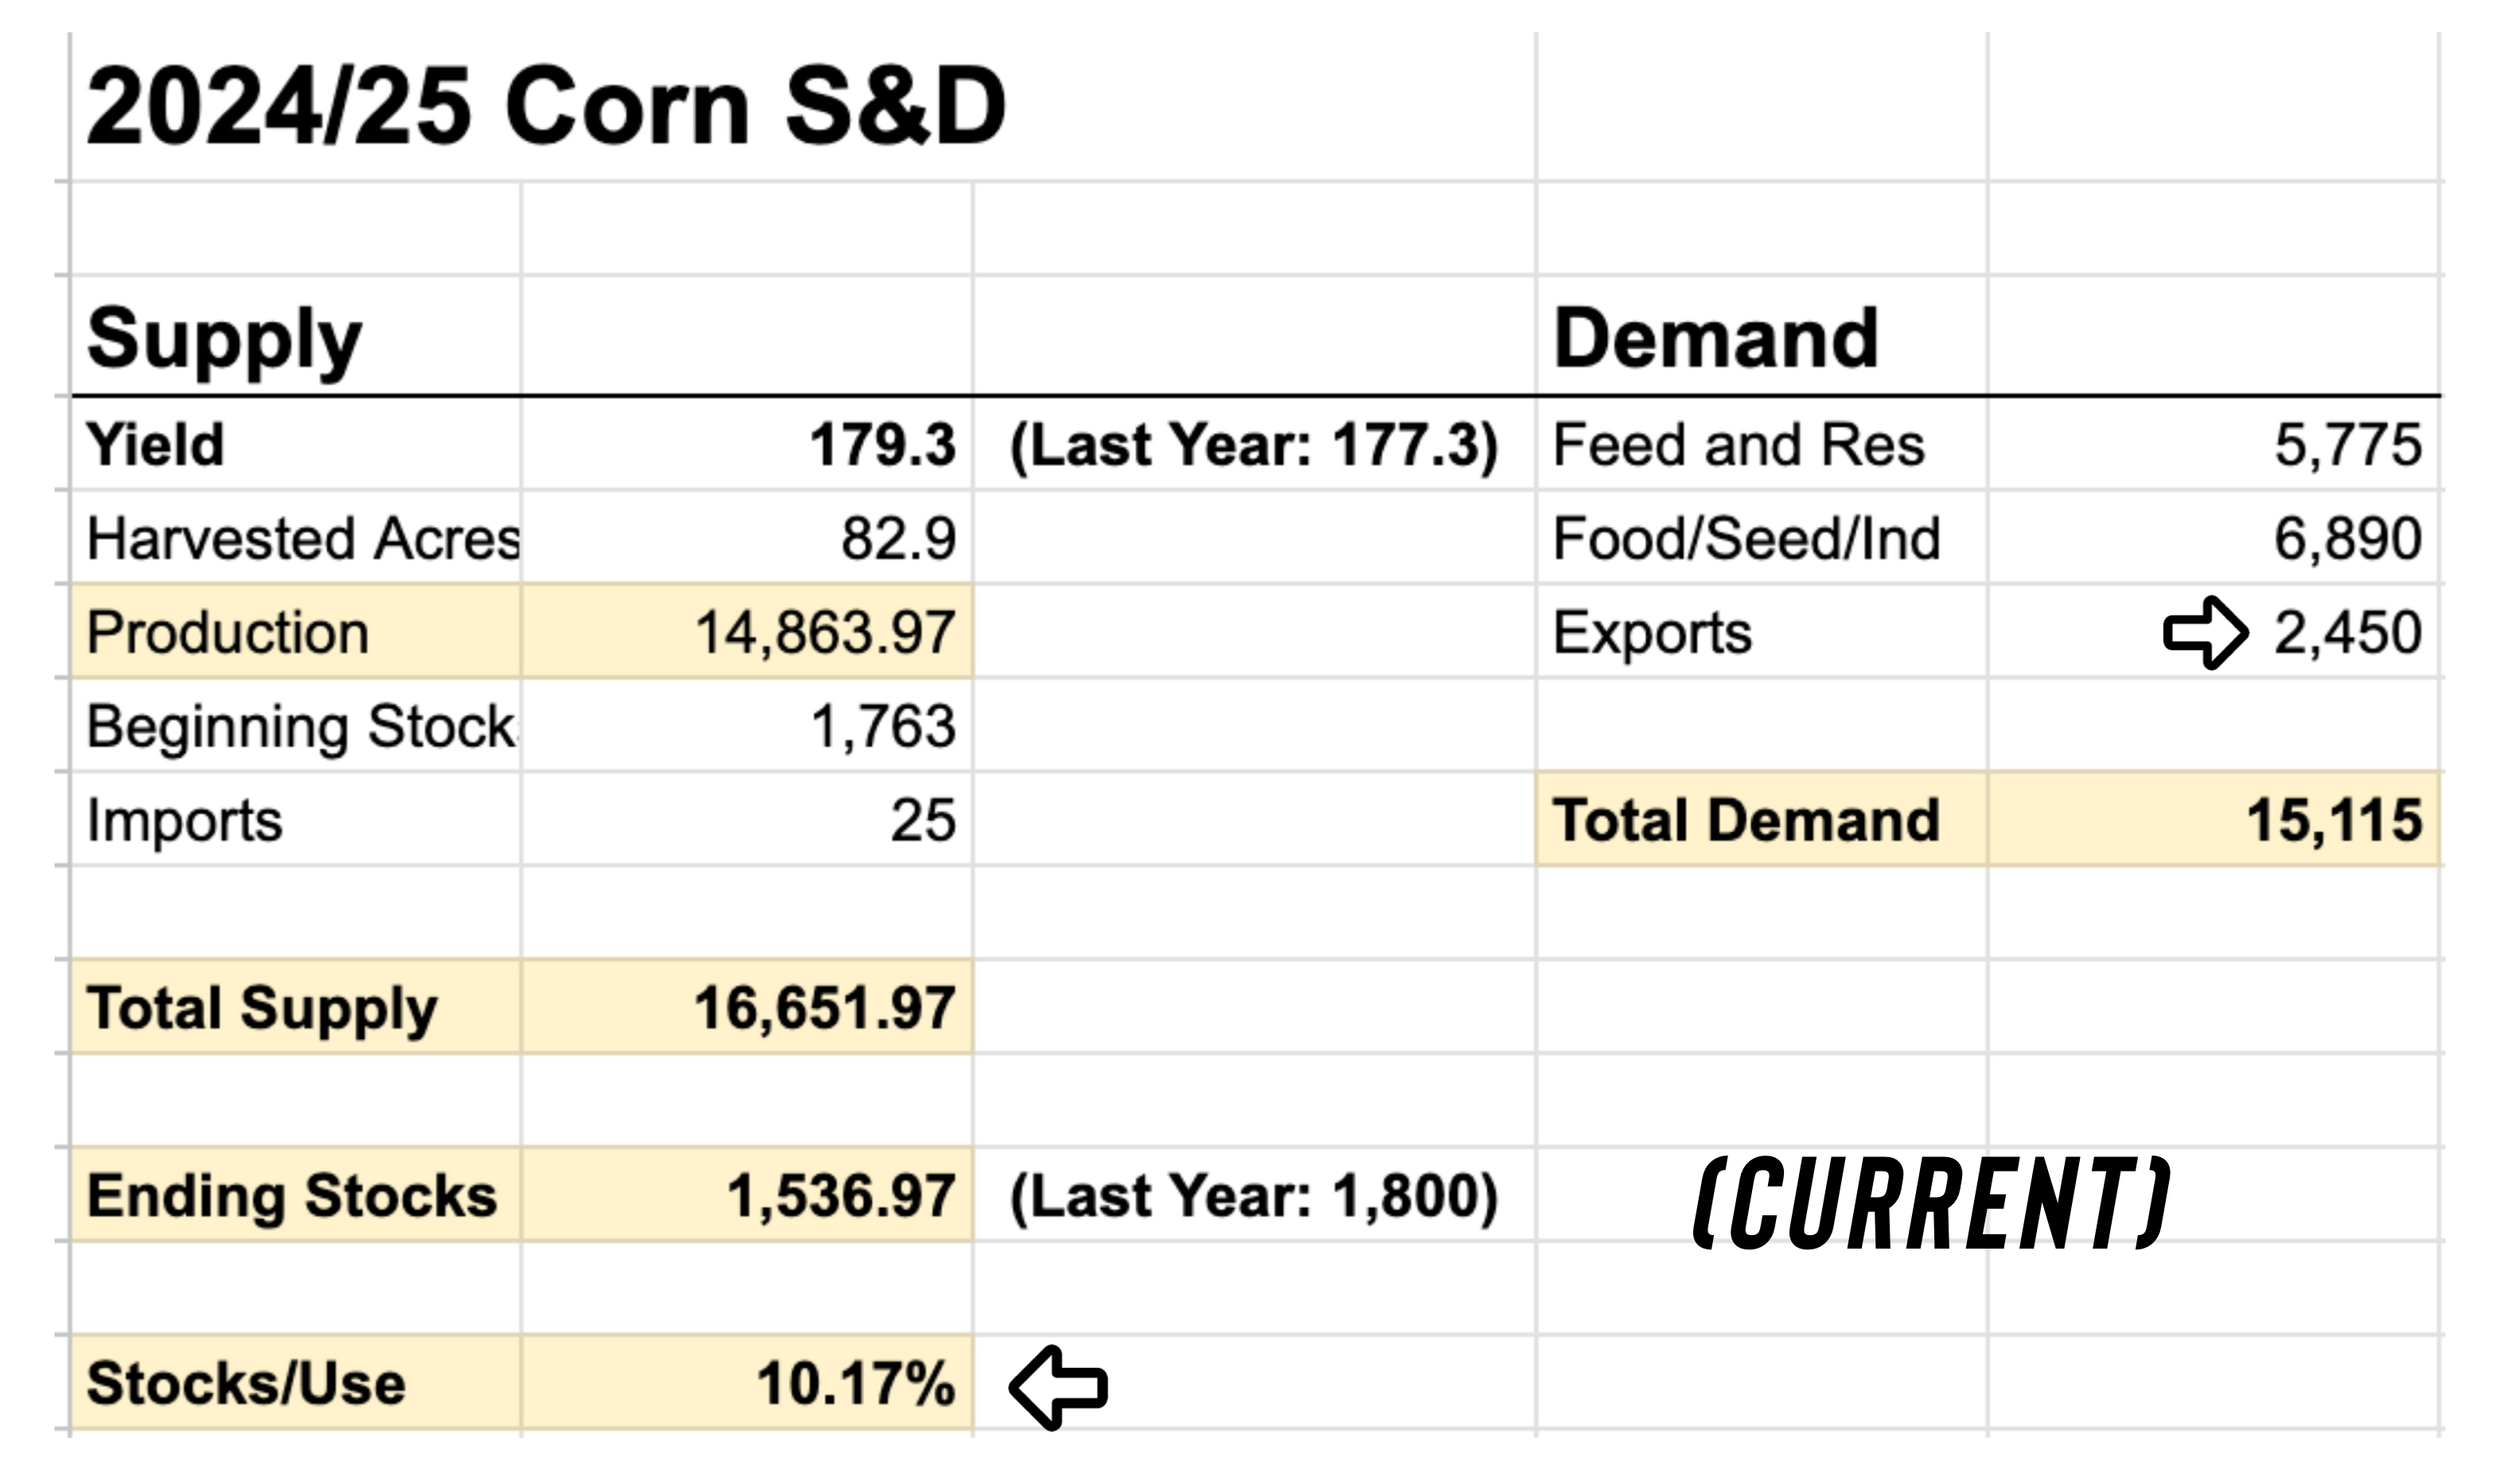
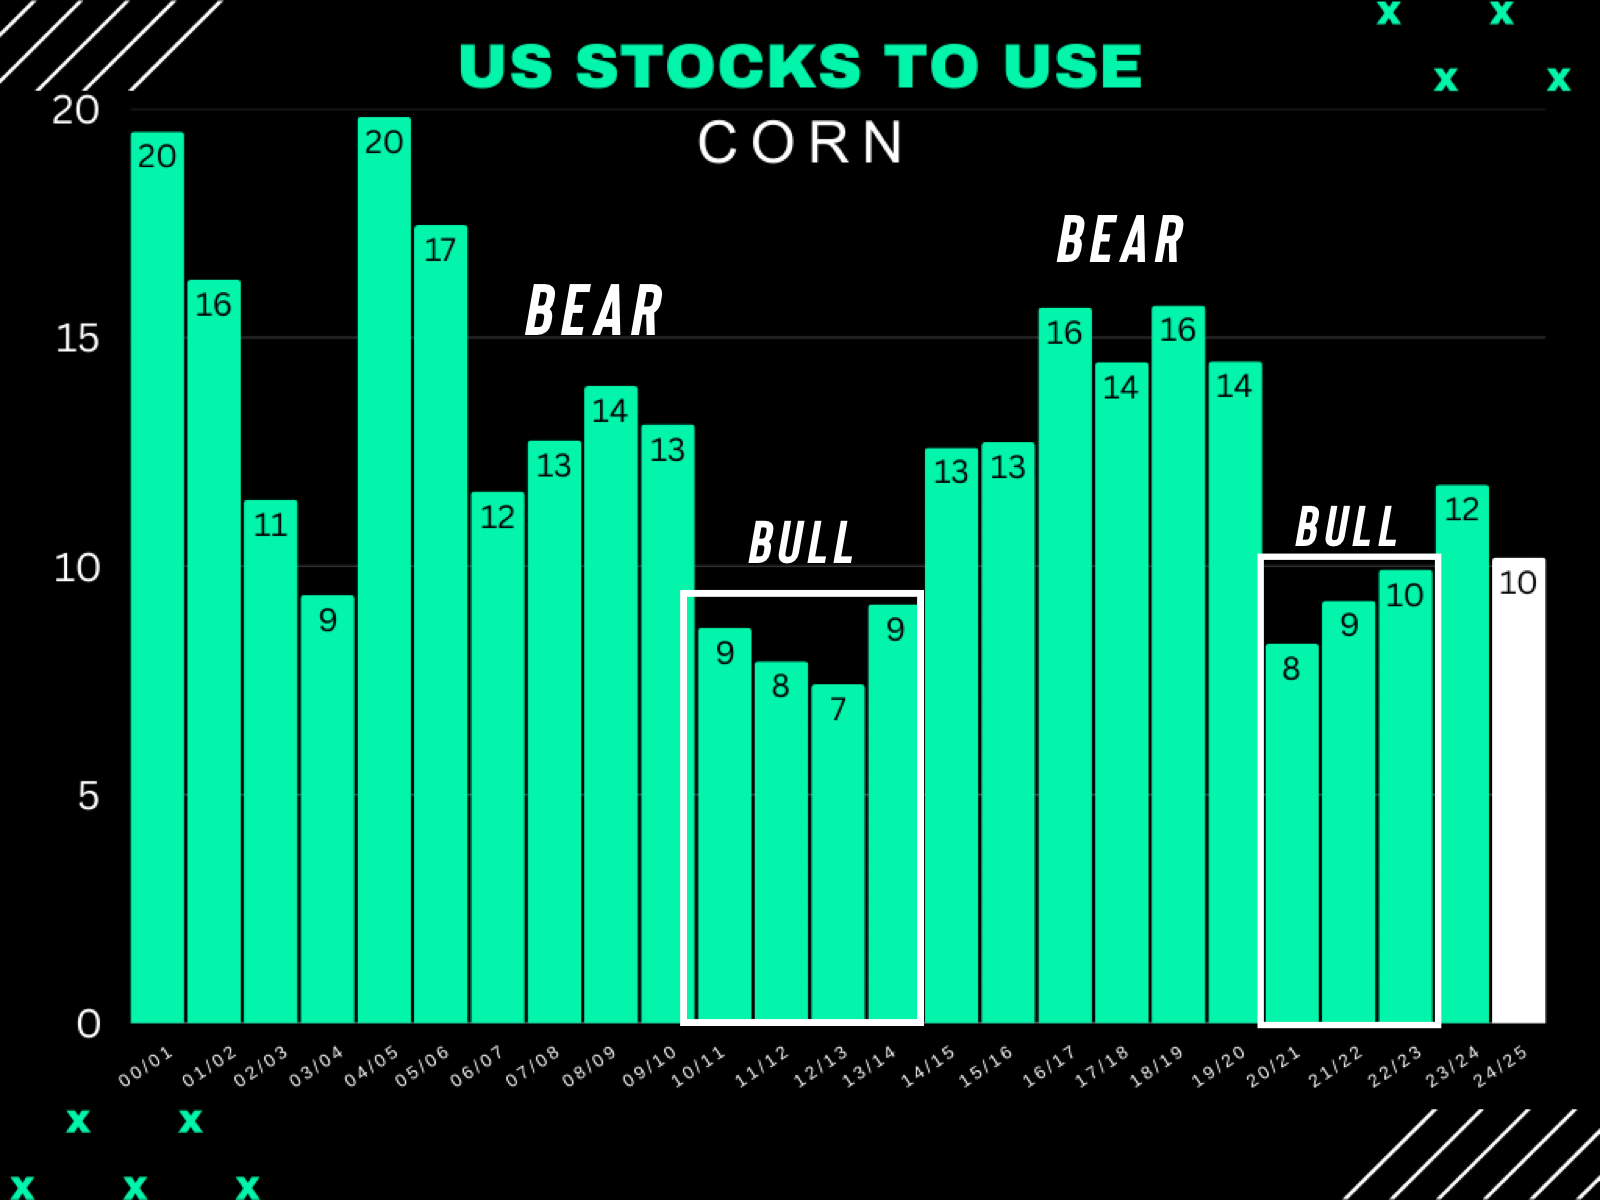
A stocks to use ratio below 10% for corn would essentially bring it to bull market territory.
Currently we are somewhat inbetween a bull market & bear market.
Far from the bear market years, but not quiet as tight as the true bull market years.
Current Stocks to Use: 10.20%
Bull Market: Under 10%
Bear Market: +13-14%
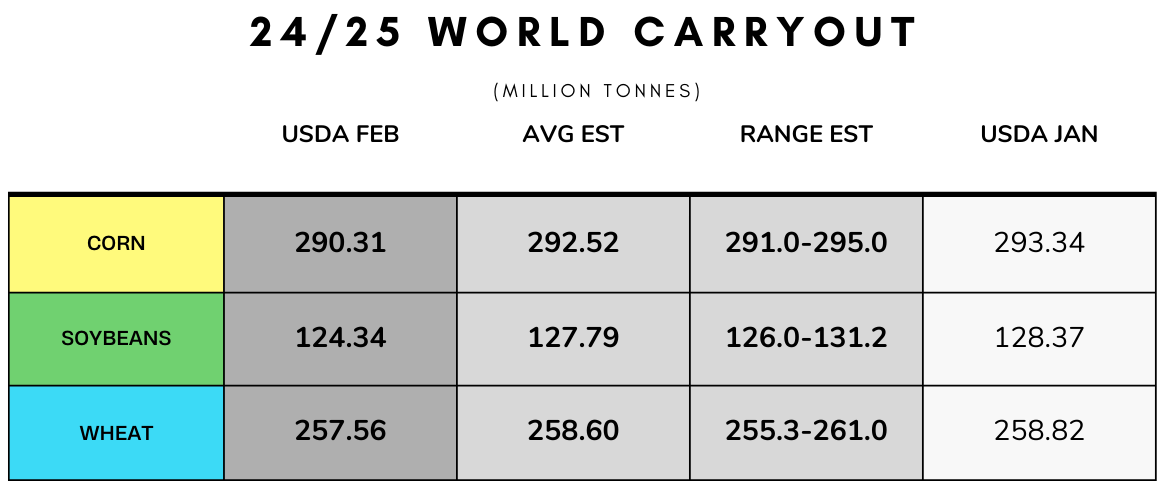
The World Numbers
The world numbers in yesterday's report was actually very friendly across the board, especially for corn & wheat.
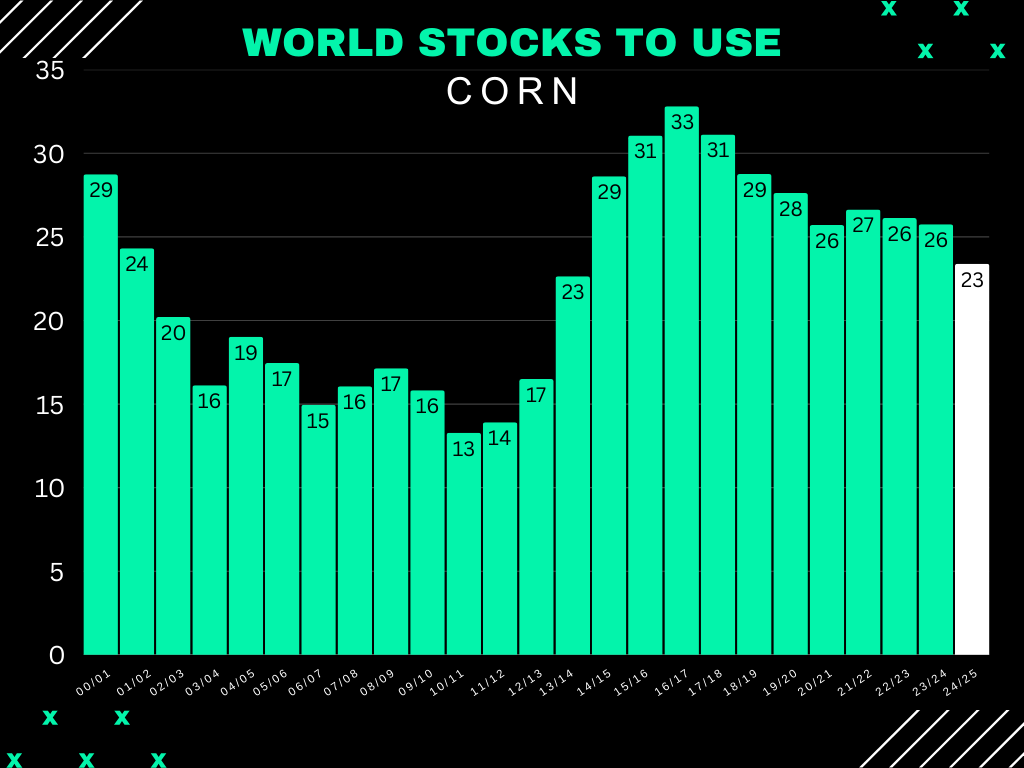
First for corn, they confirmed that the world situation is the tightest in a decade.
This is very far from being bearish.
Now what happens to this balance sheet if the US has a crop issue or if Brazil's 2nd corn crop runs into issues?
It would get even tighter.
Next for wheat, the world stocks to use is also the tightest in a decade.
This number probably also shrinks on the 25/26 balance sheets given how poor the Russian winter wheat crop is.
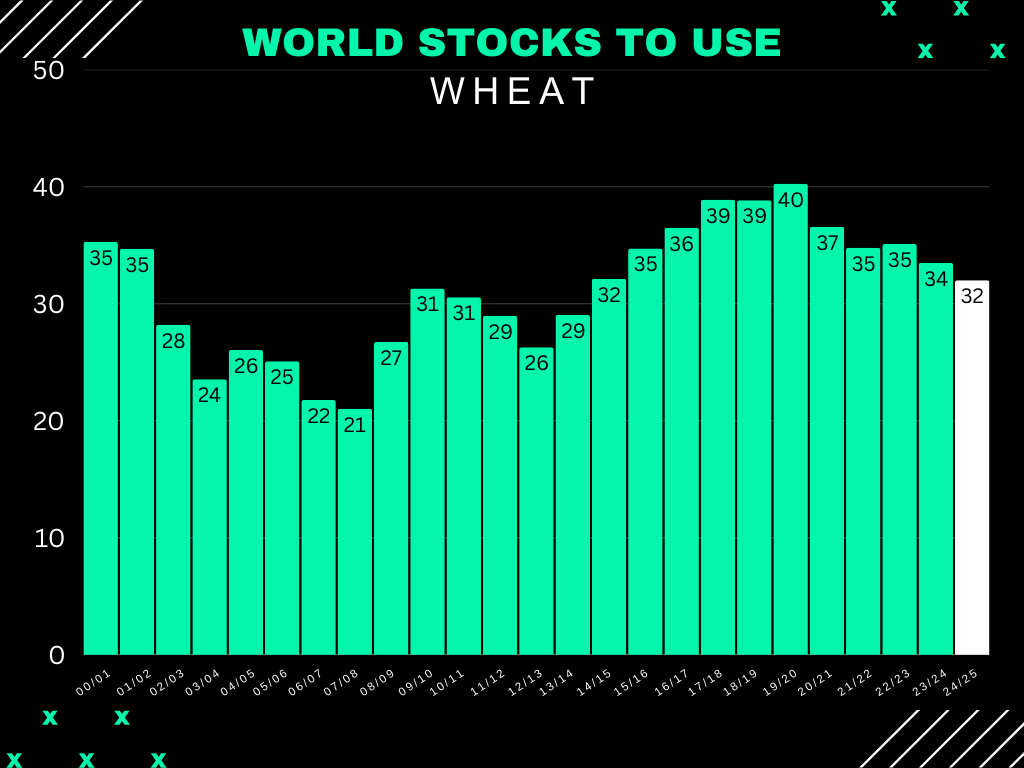
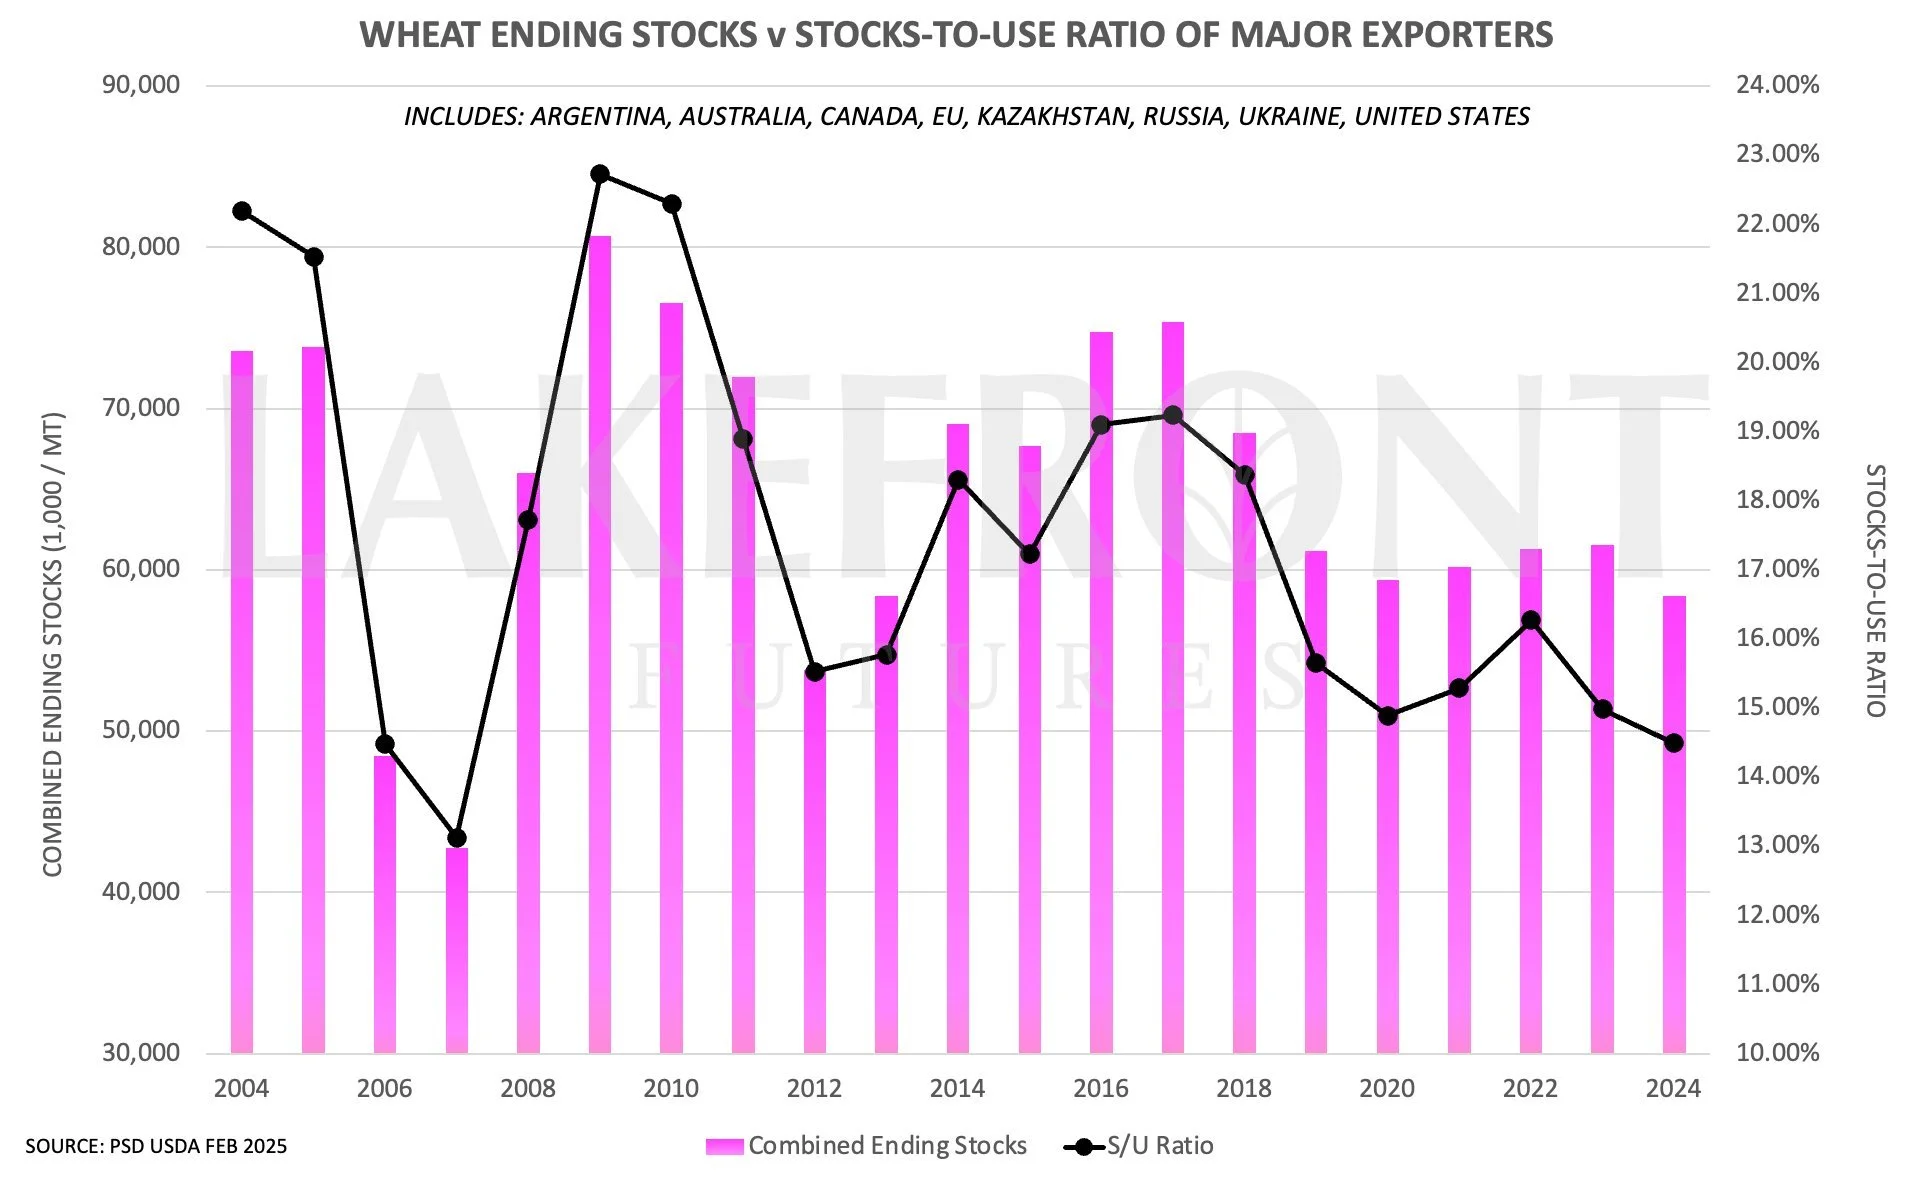
What is even more friendly about the world wheat situation?
The stocks to use ratio for major global exporters.
It is the lowest since 2007.
If the worlds biggest sellers of wheat have less wheat to sell, it should result in wheat becoming valuable.
Chart from Lake Front Futures
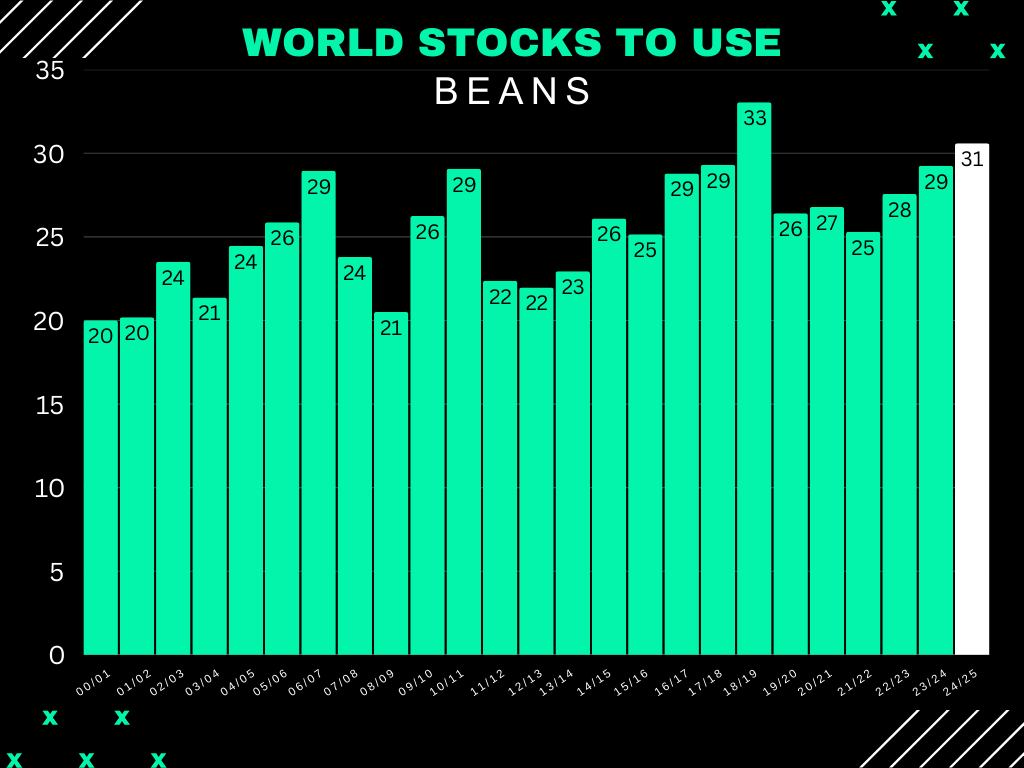
Lastly soybeans.. the world situation got tighter like corn & wheat.
However, it is still sitting at historically bearish levels.
It is not quiet as bearish as the trade war but is still the 2nd largest of all time.
It has been nice to see this number creep lower, as it was at 33% not too long ago. It is now at 30.60%. So it could’ve been worse, but this is still a pretty bearish figure.
Acre Debate
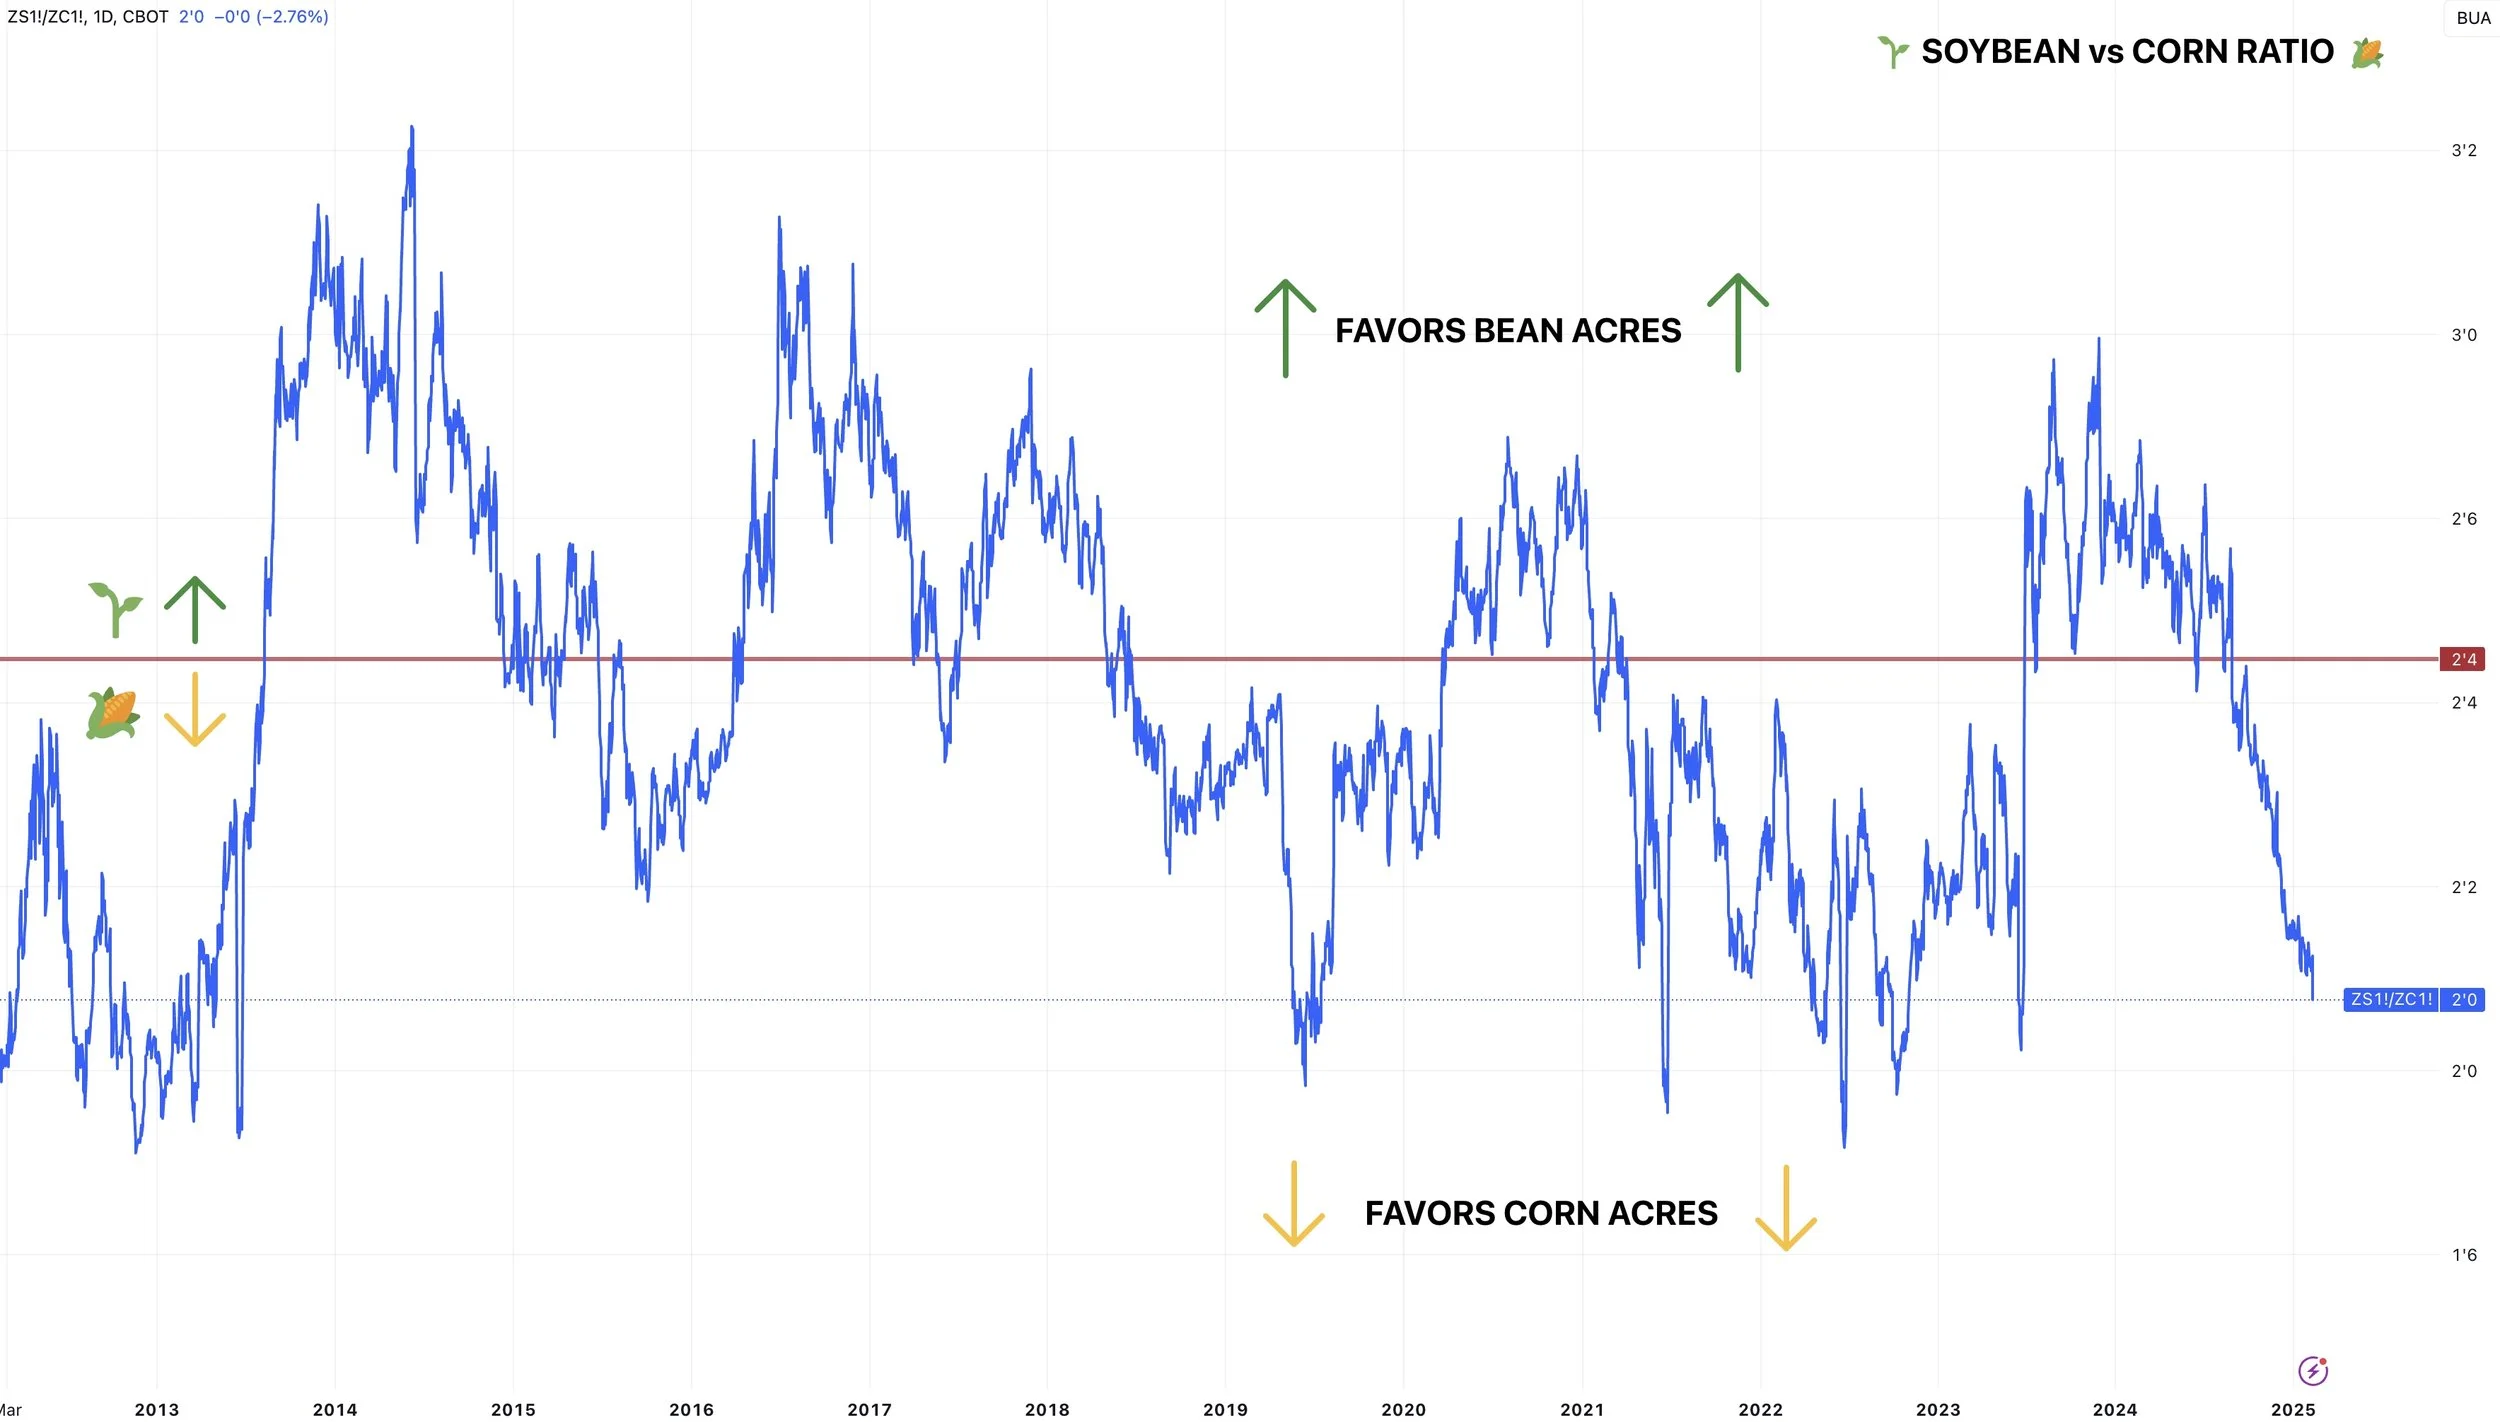
Of course one of the biggest potential bearish factors for corn is going to be higher acres.
The corn to soybean ratio is approaching historically low levels.
This is the lowest the ratio has ever been for February.
In the past, the ratio being this low hasn’t lasted super long.
The longest in recent memory was back in 2019, where it stayed around this level from May until August (Only 3 months).
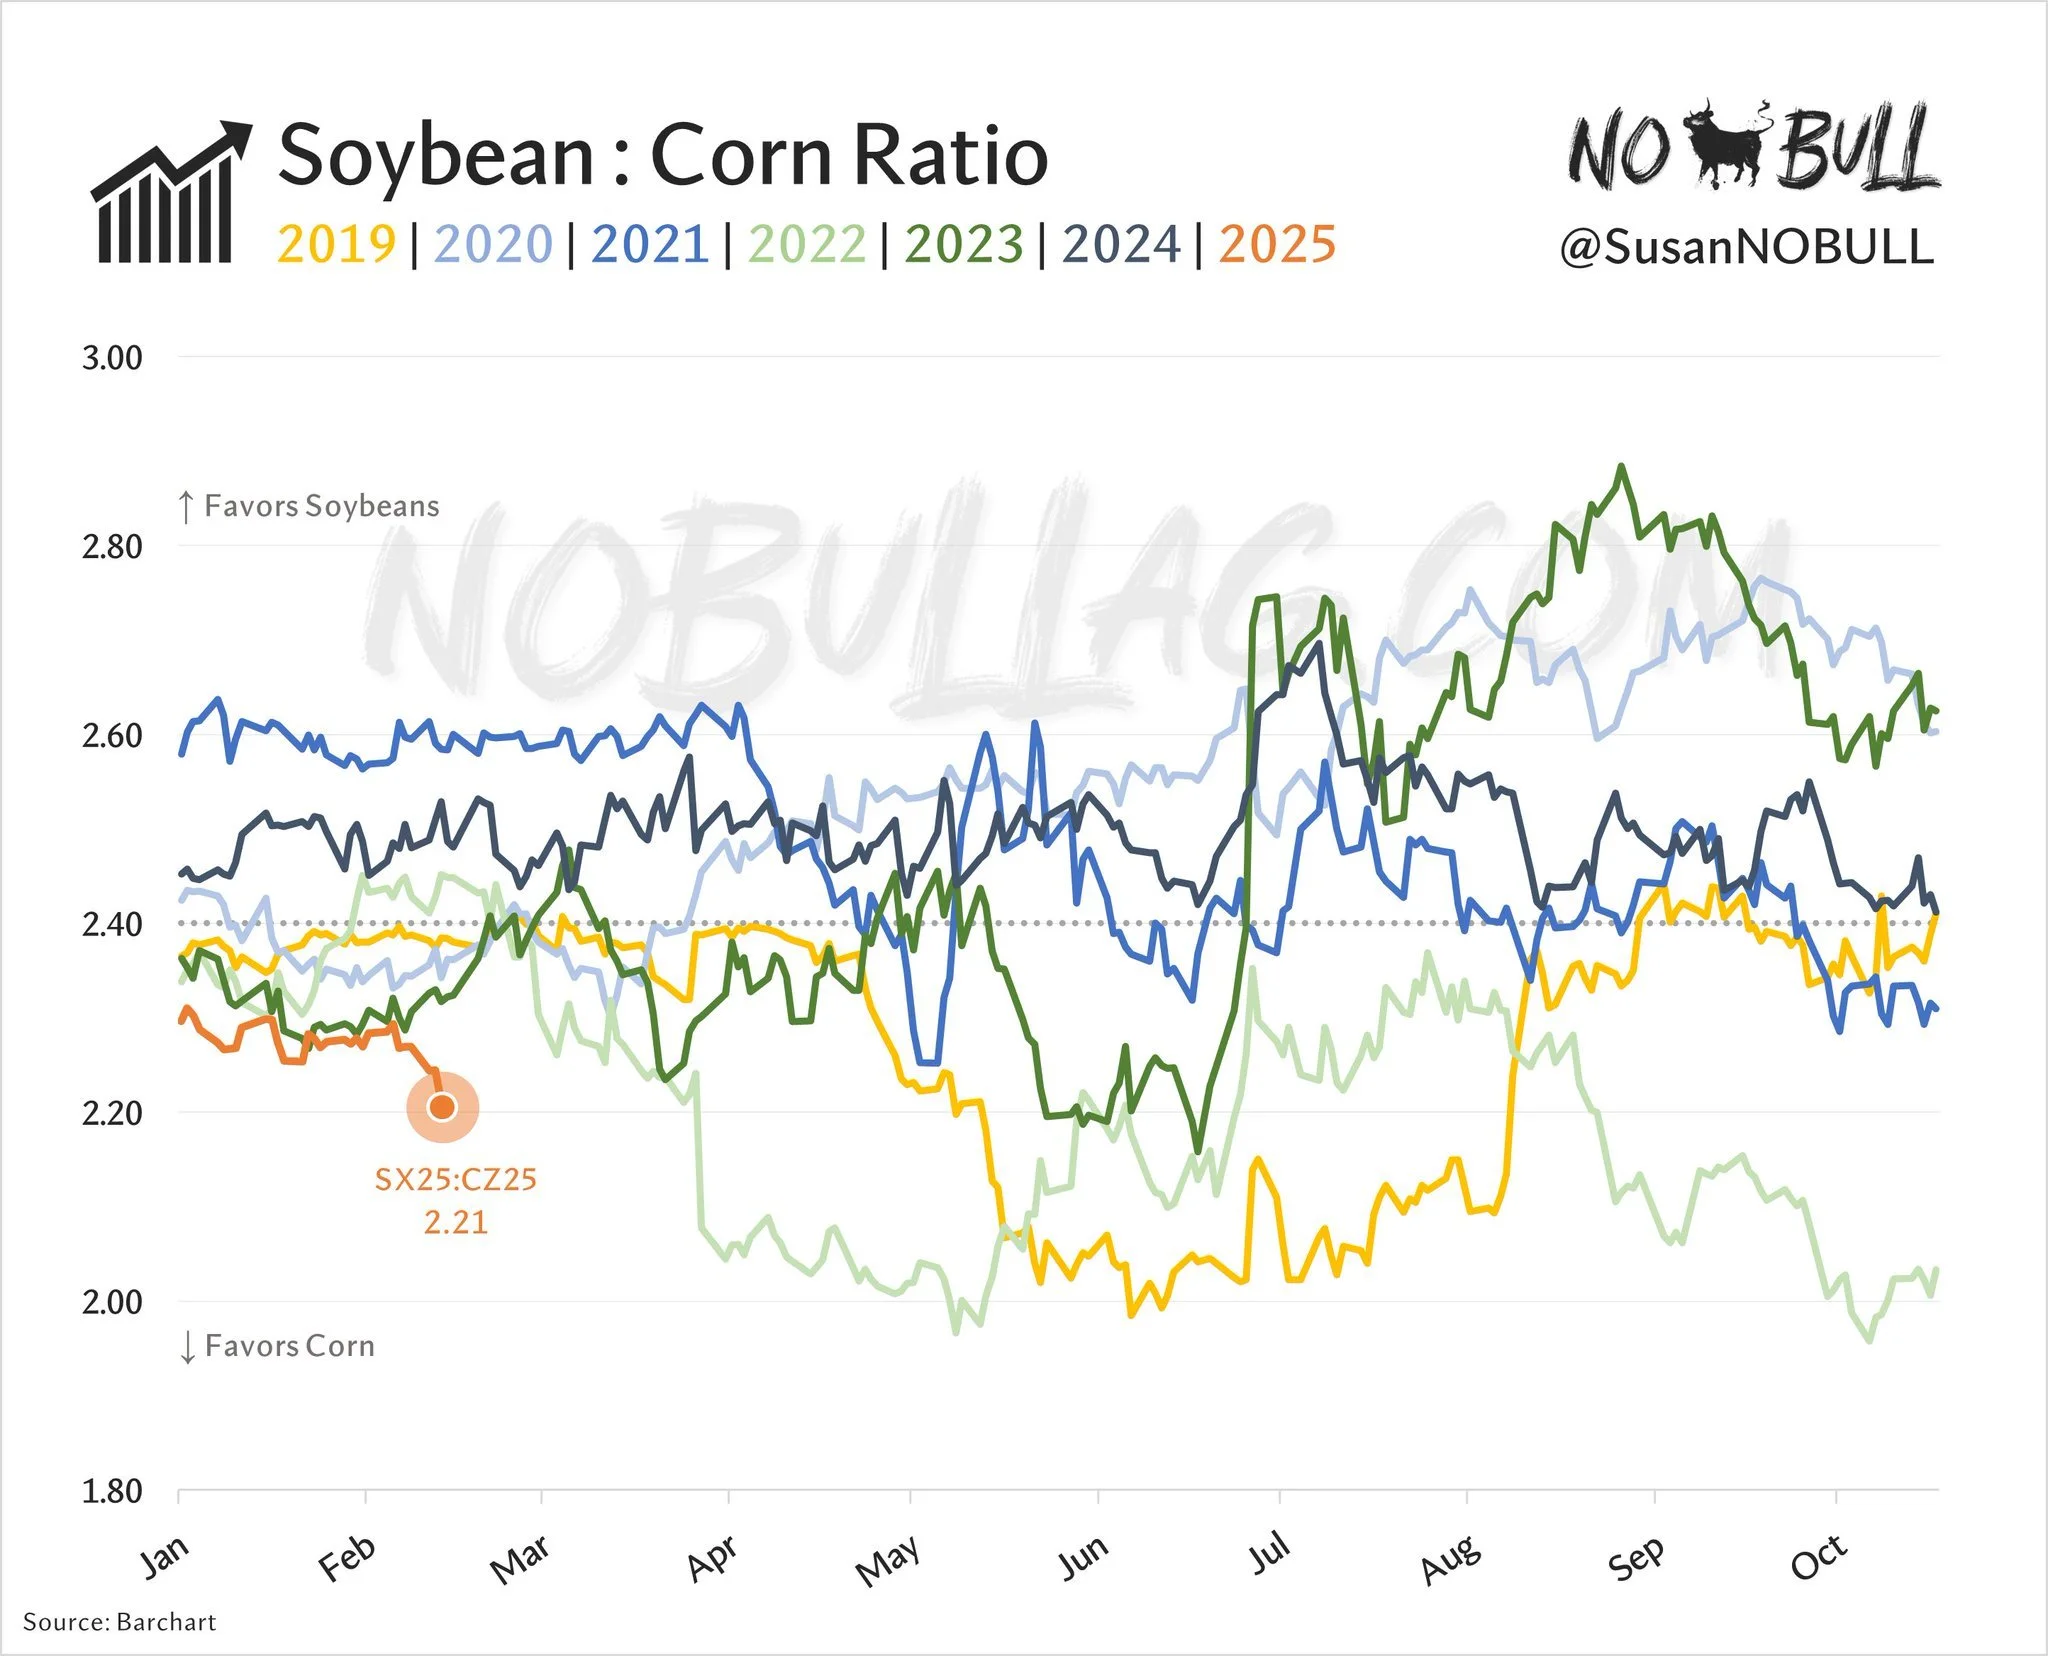
Here is a great chart from Susan of No Bull Ag (@SusanNOBULL on X) that breaks this ratio down year by year.
2025 is in a realm of it's own right now.
Now here is the price performance comparison for the past 365 days.
Corn & soybeans have been complete opposites.
Corn is up +14%
Soybeans are down -14%
Wheat is down -4%

Now yes, the price differences do suggest more corn acres.
But we have to also keep in mind the cost of production differences between the two.
High price of corn = more acres
But a high cost of production also = less acres
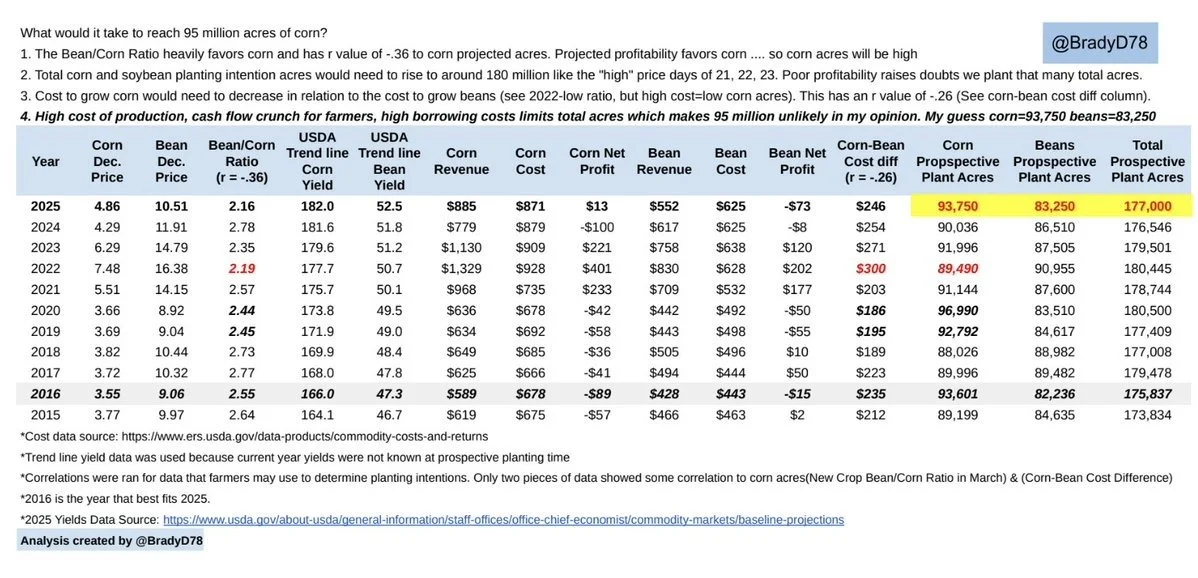
Here is a great chart from Brady (@BradyD78 on X) that complies actual math and data to figure out acres.
His math suggests 93.750 corn acres and 83.250 bean acres. Which is pretty on par with 2016.
He thinks 95 million corn acres is unlikely due to the high cost of production, cash flow crunch, and high borrowing costs etc.
Today's Main Takeaways
Corn
Both the world & global situations for corn are friendly.
Yes the funds are nearing record long, which means they cannot add here and are pretty much "max long".
But do you really think the funds went from record short to near record long in the span of 6 months for no reason?
The funds will not give up this big of a position very easily.
Just like they needed a reason to get long corn, they will need a reason to sell.
They are not going to simply puke out of this position just because they are "max long". They will need to see a viable reason to sell.
Eventually there will be a reason, but I do not see that reason as of today.
I think they are probably waiting to see how the US growing season shapes up and how Brazil's 2nd corn crop turns out.
Because if either of them have an issue, the world balance sheet can’t afford a loss. The funds are well aware of this.
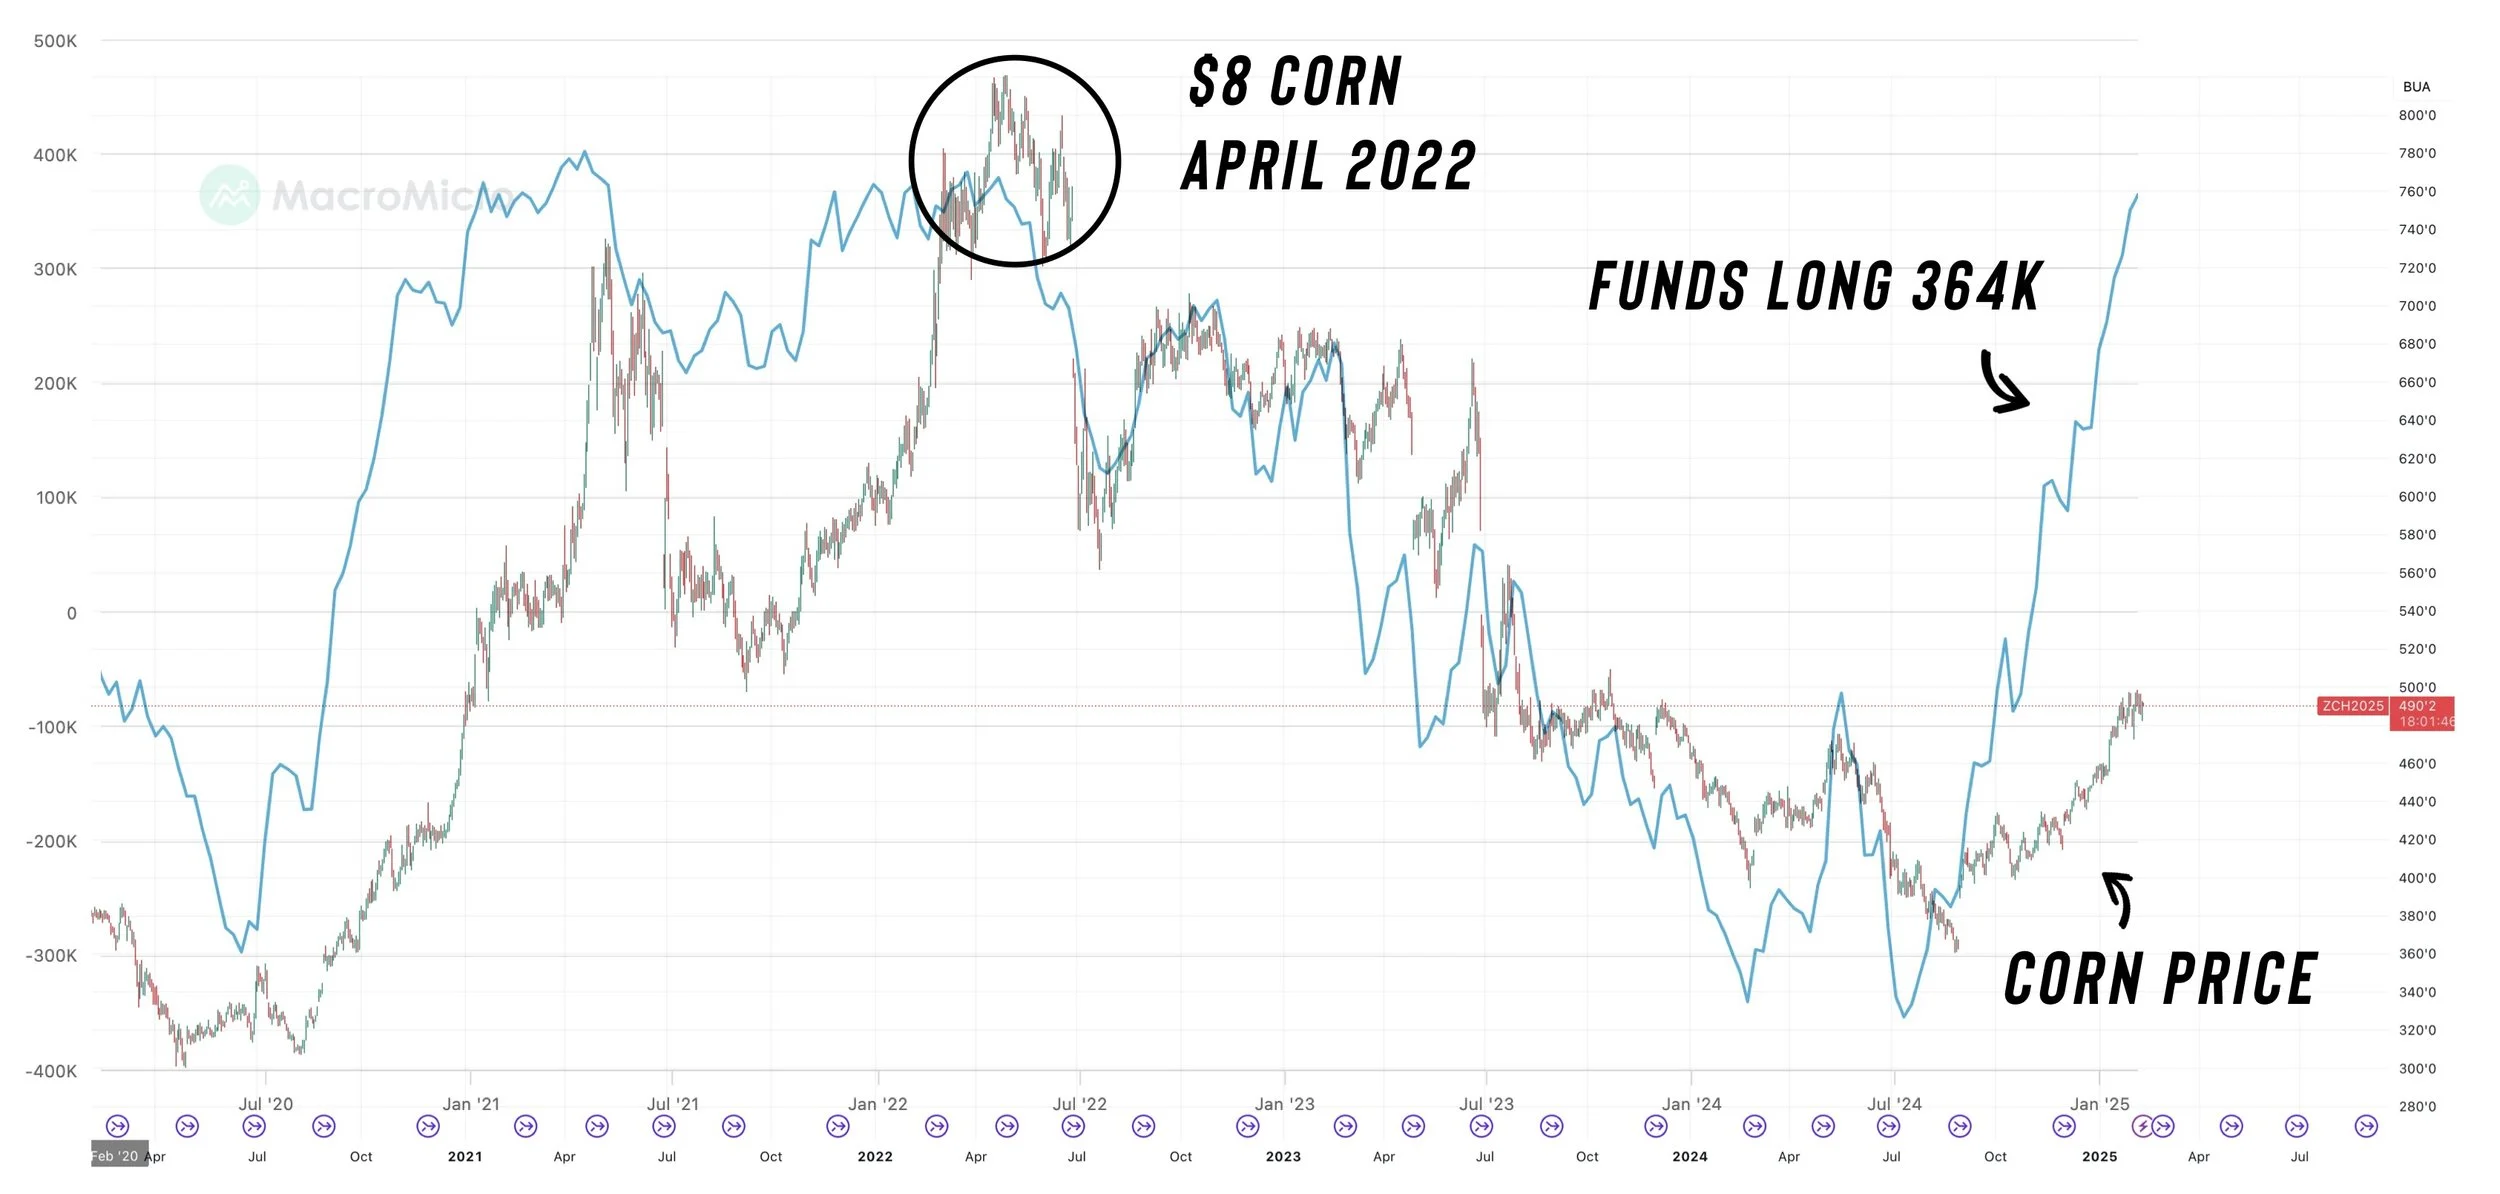
Here is the funds positon overlayed on top of the corn price chart. The last time the funds were this long was back in April 2022 when corn was +$8.00
Lastly, the funds can stay long for a while. Last time they were long +350k they held that long from November 2021 until April 2022. A solid 5 months.
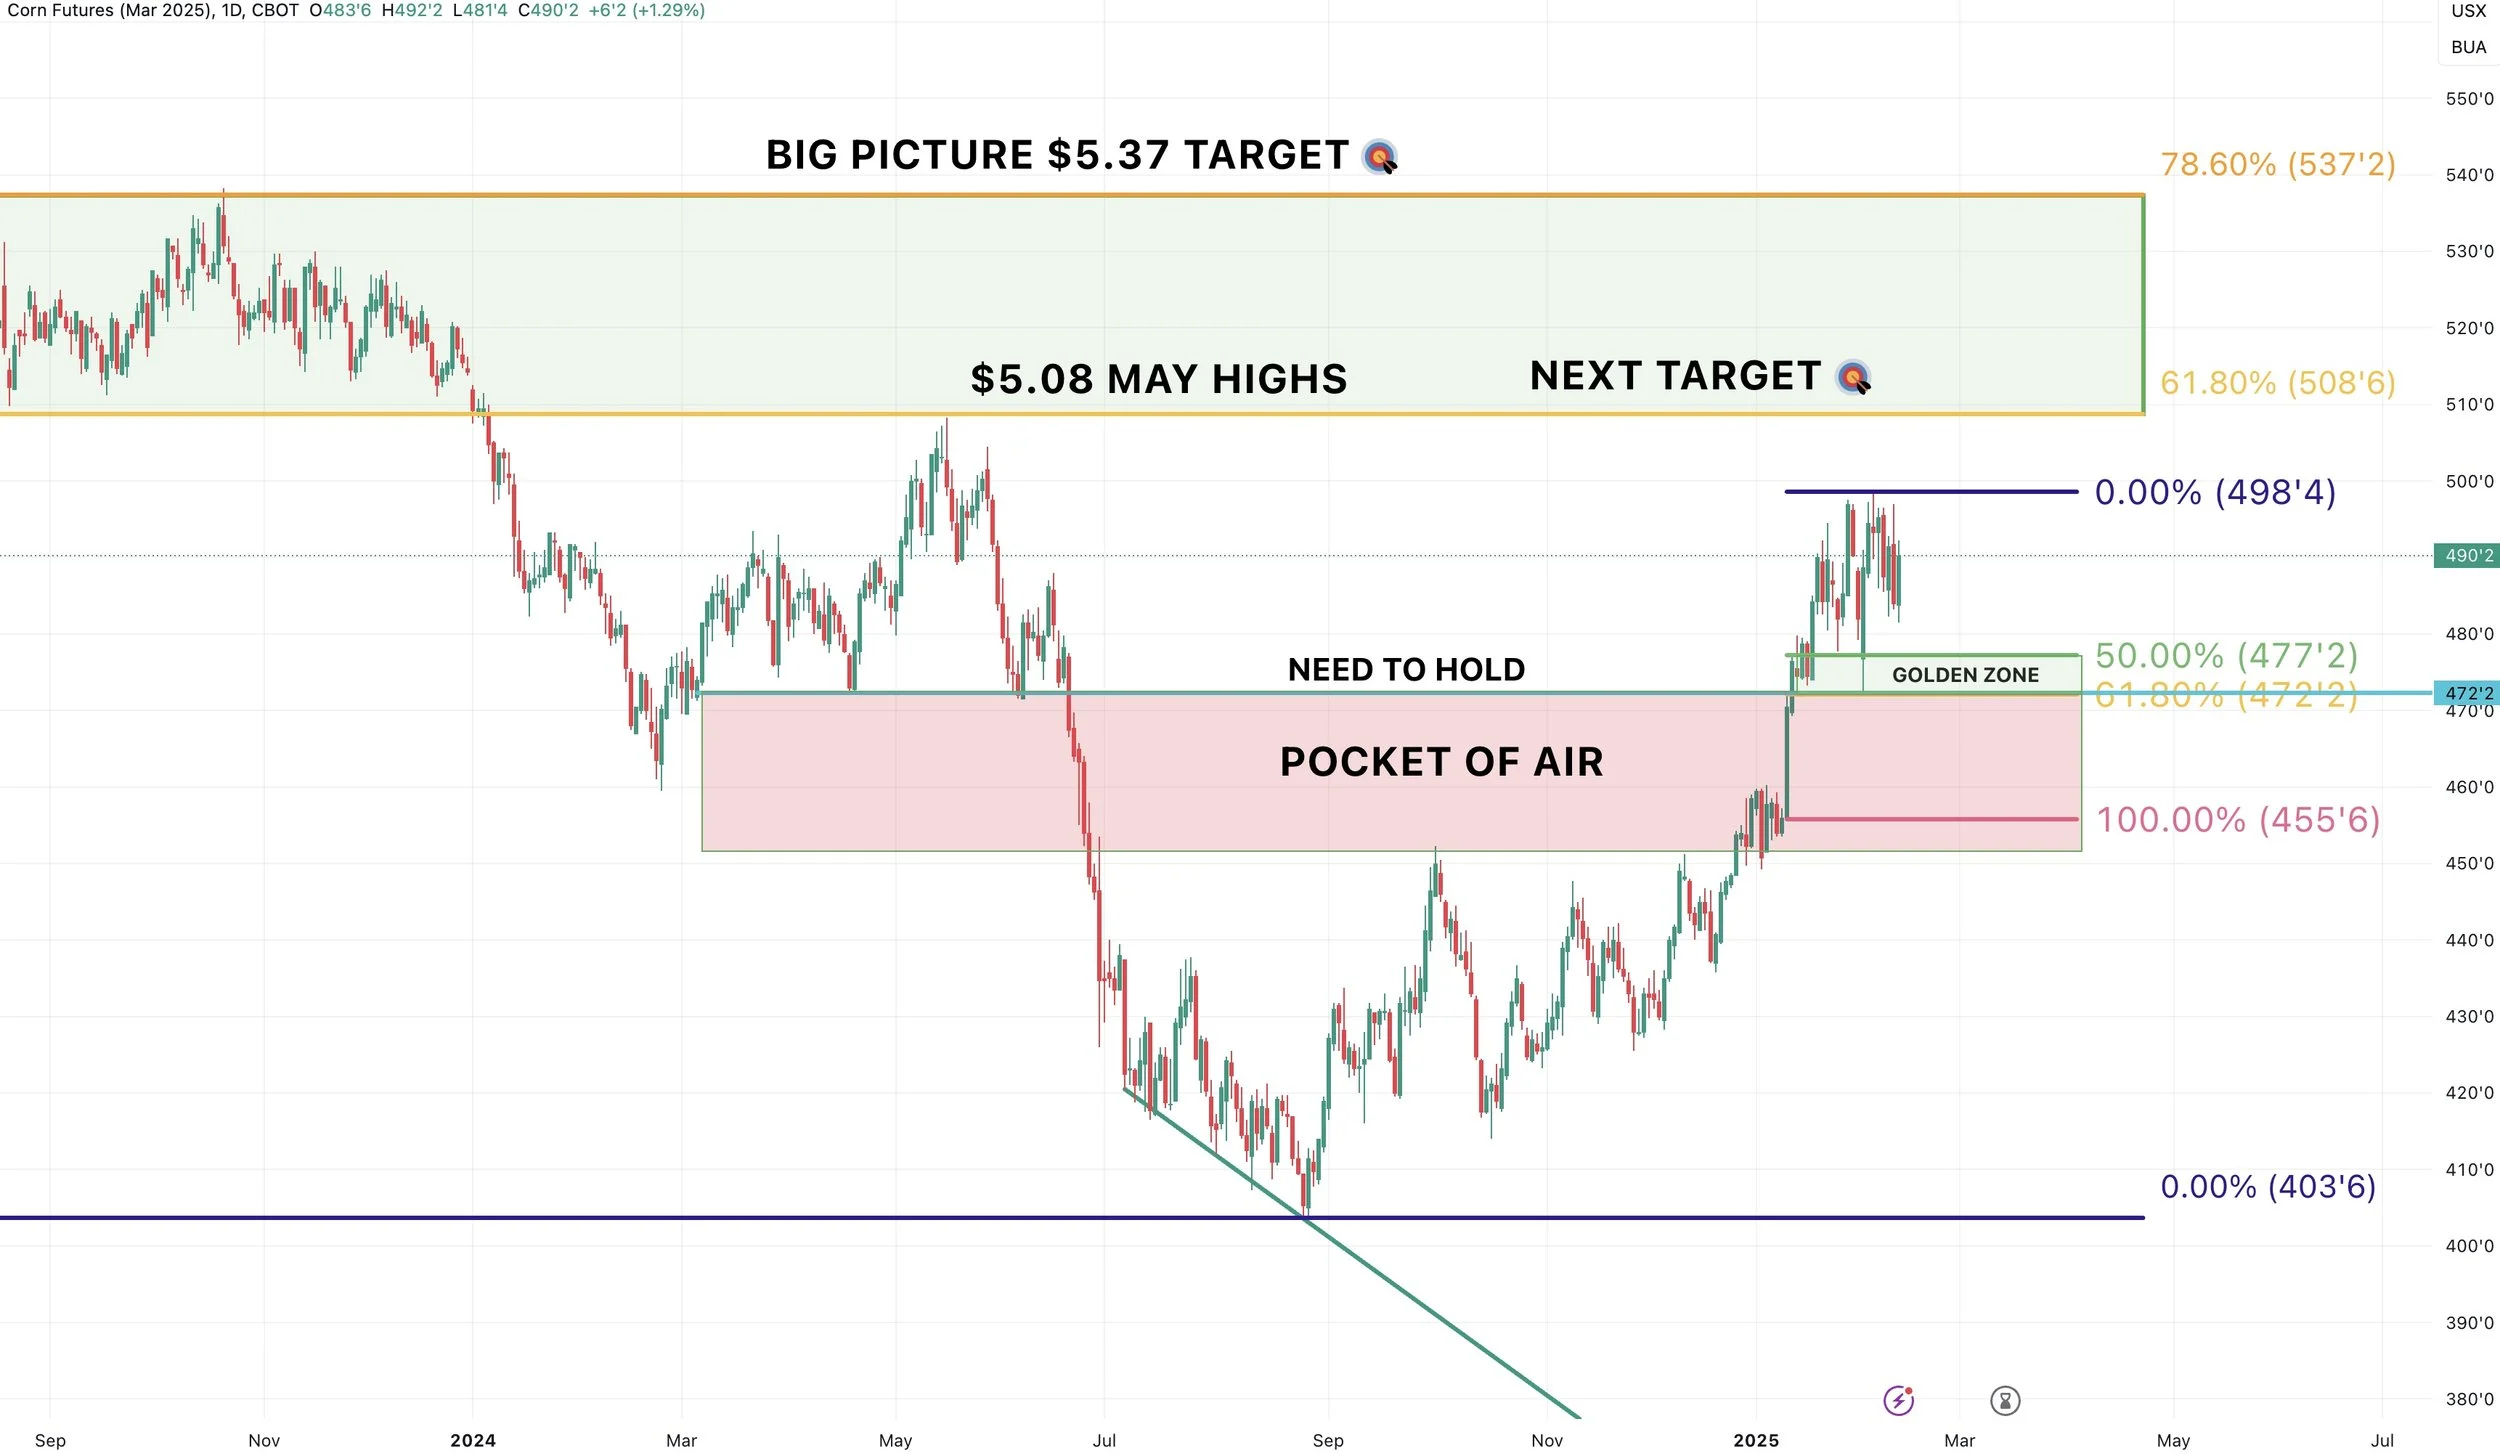
I made some slight changes to my March corn chart.
If we get a correction, bulls want to hold the $4.77 to $4.72 area. (Green box and 50-61.8% retracement from Jan USDA)
If we do not hold that box, there is a pocket of air down to the $4.50's (Red box)
(Everytime we moved through this area, we moved through it fast. Meaning there is no support).
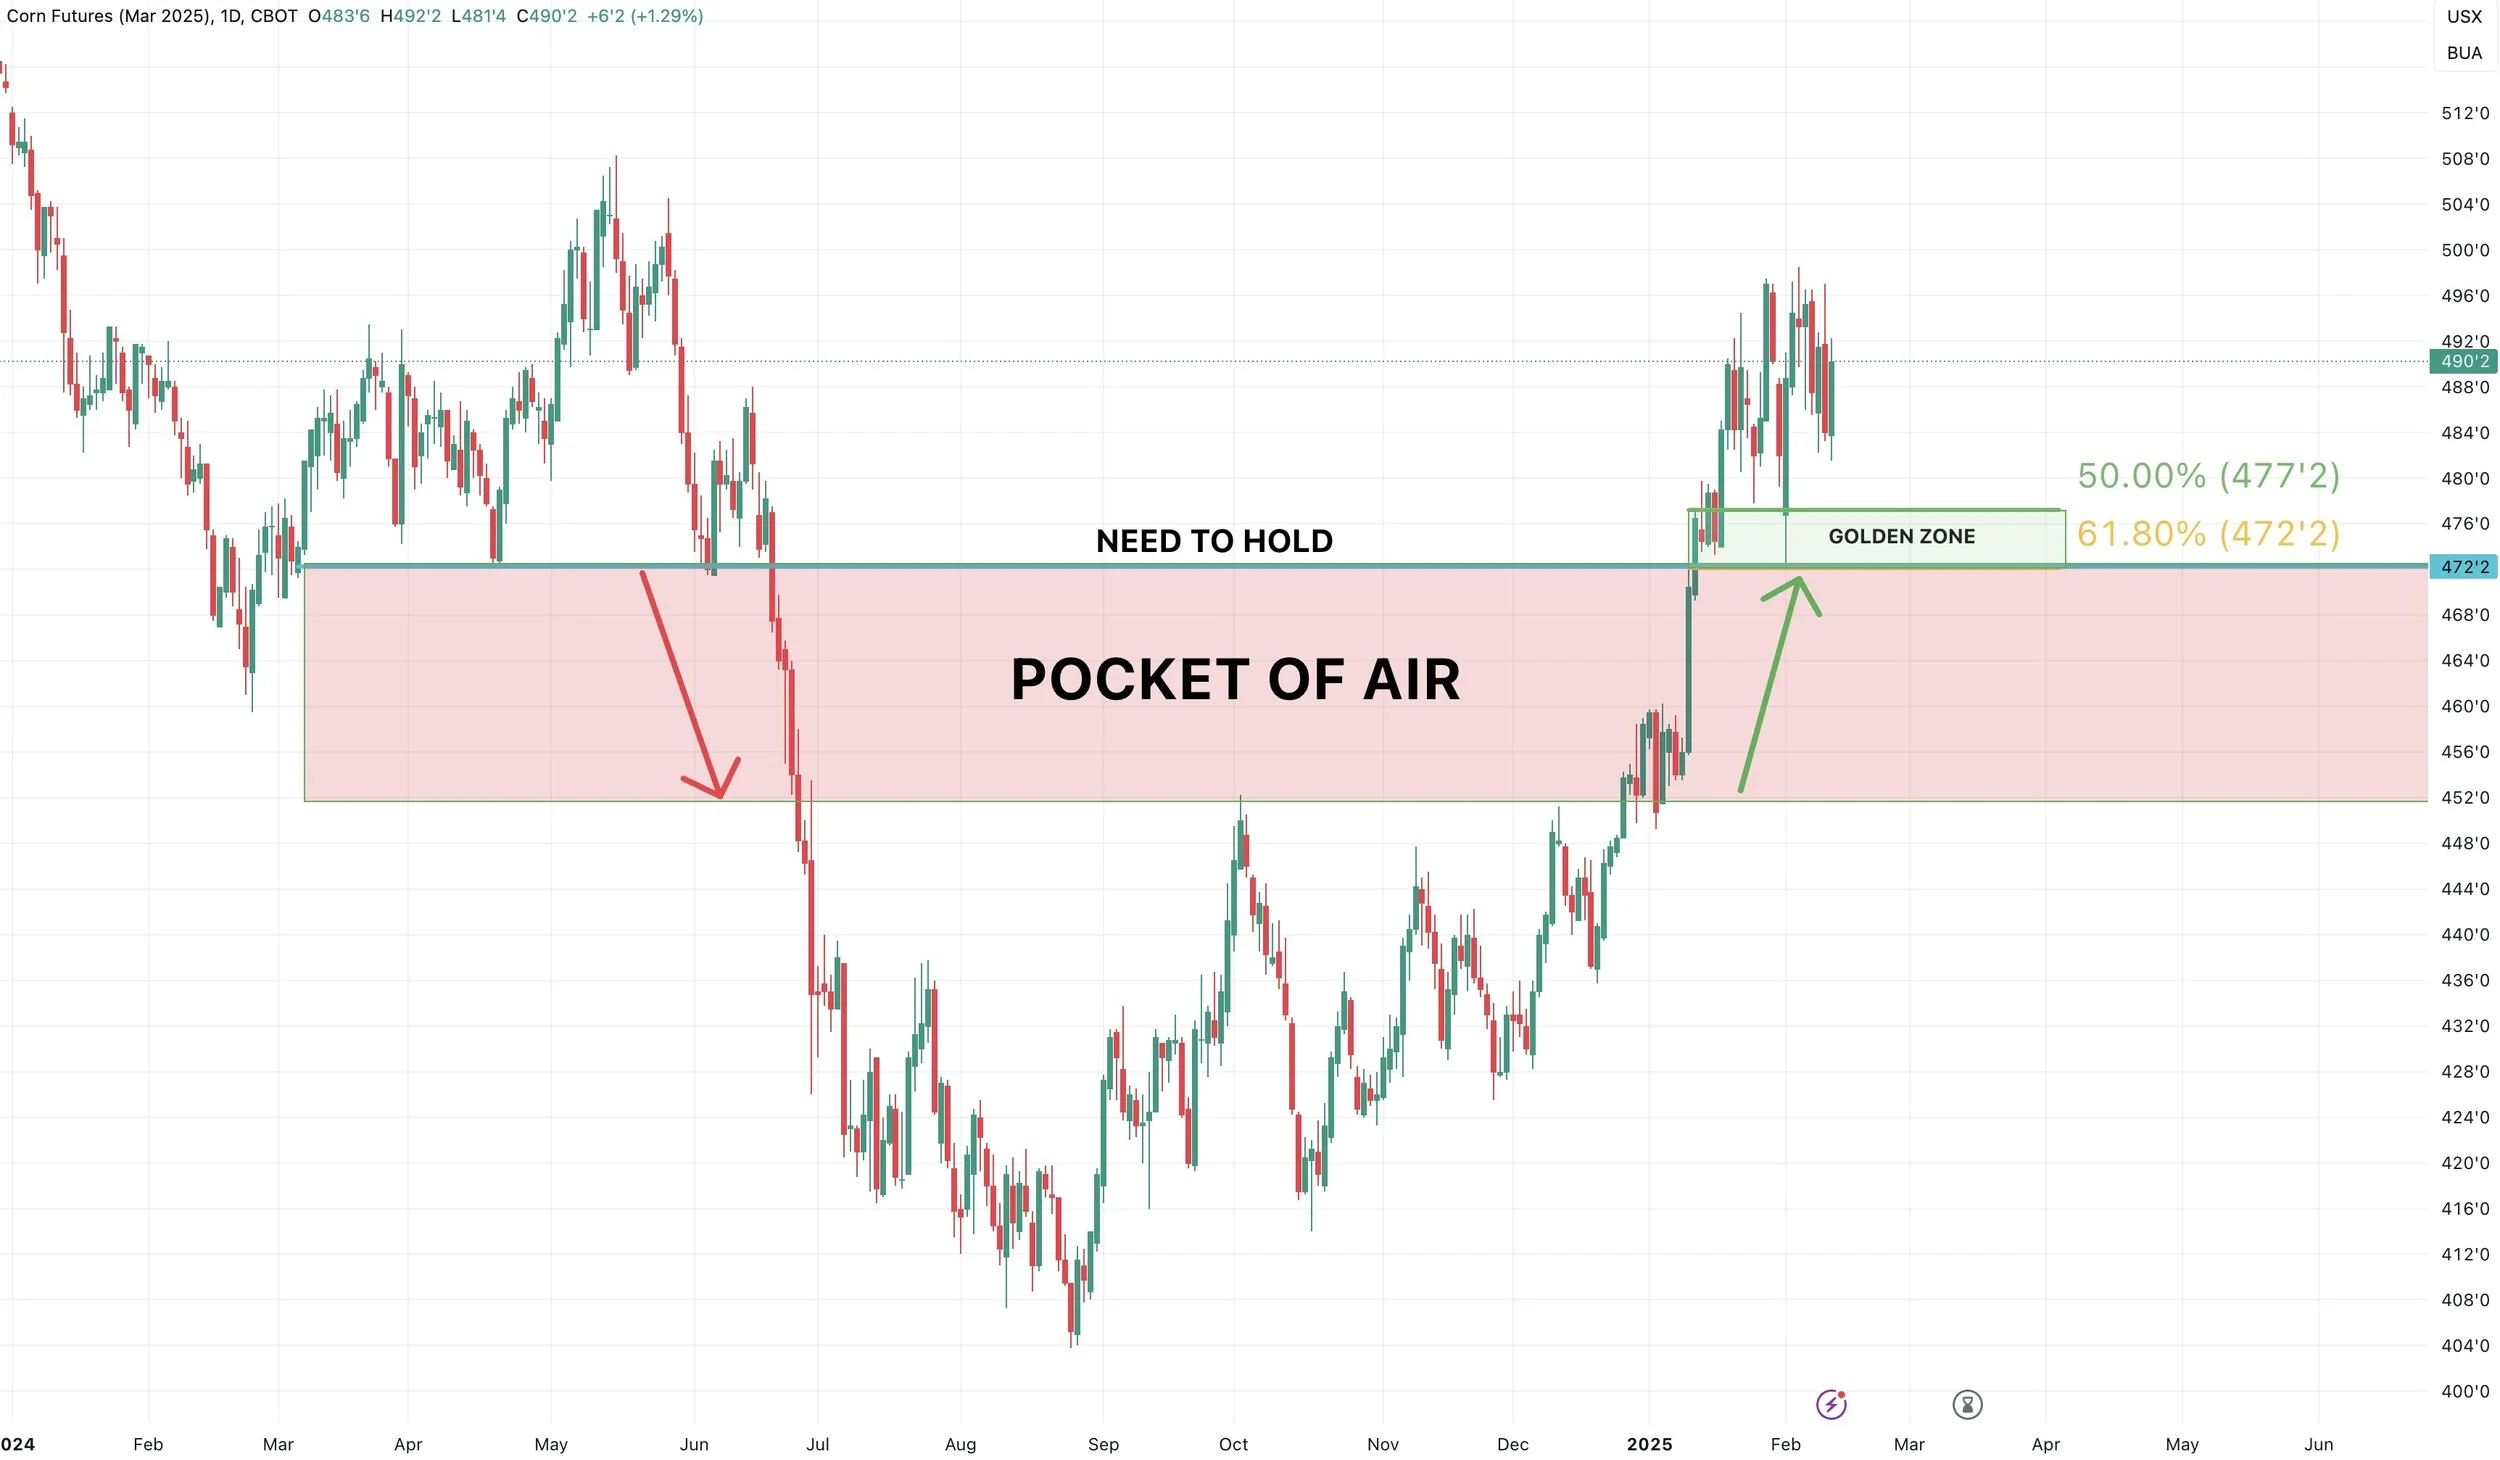
So ideally, corn continues to hold those recent $4.72 lows from last week. As long as we do that, nothing to worry about.
Here is a closer look.
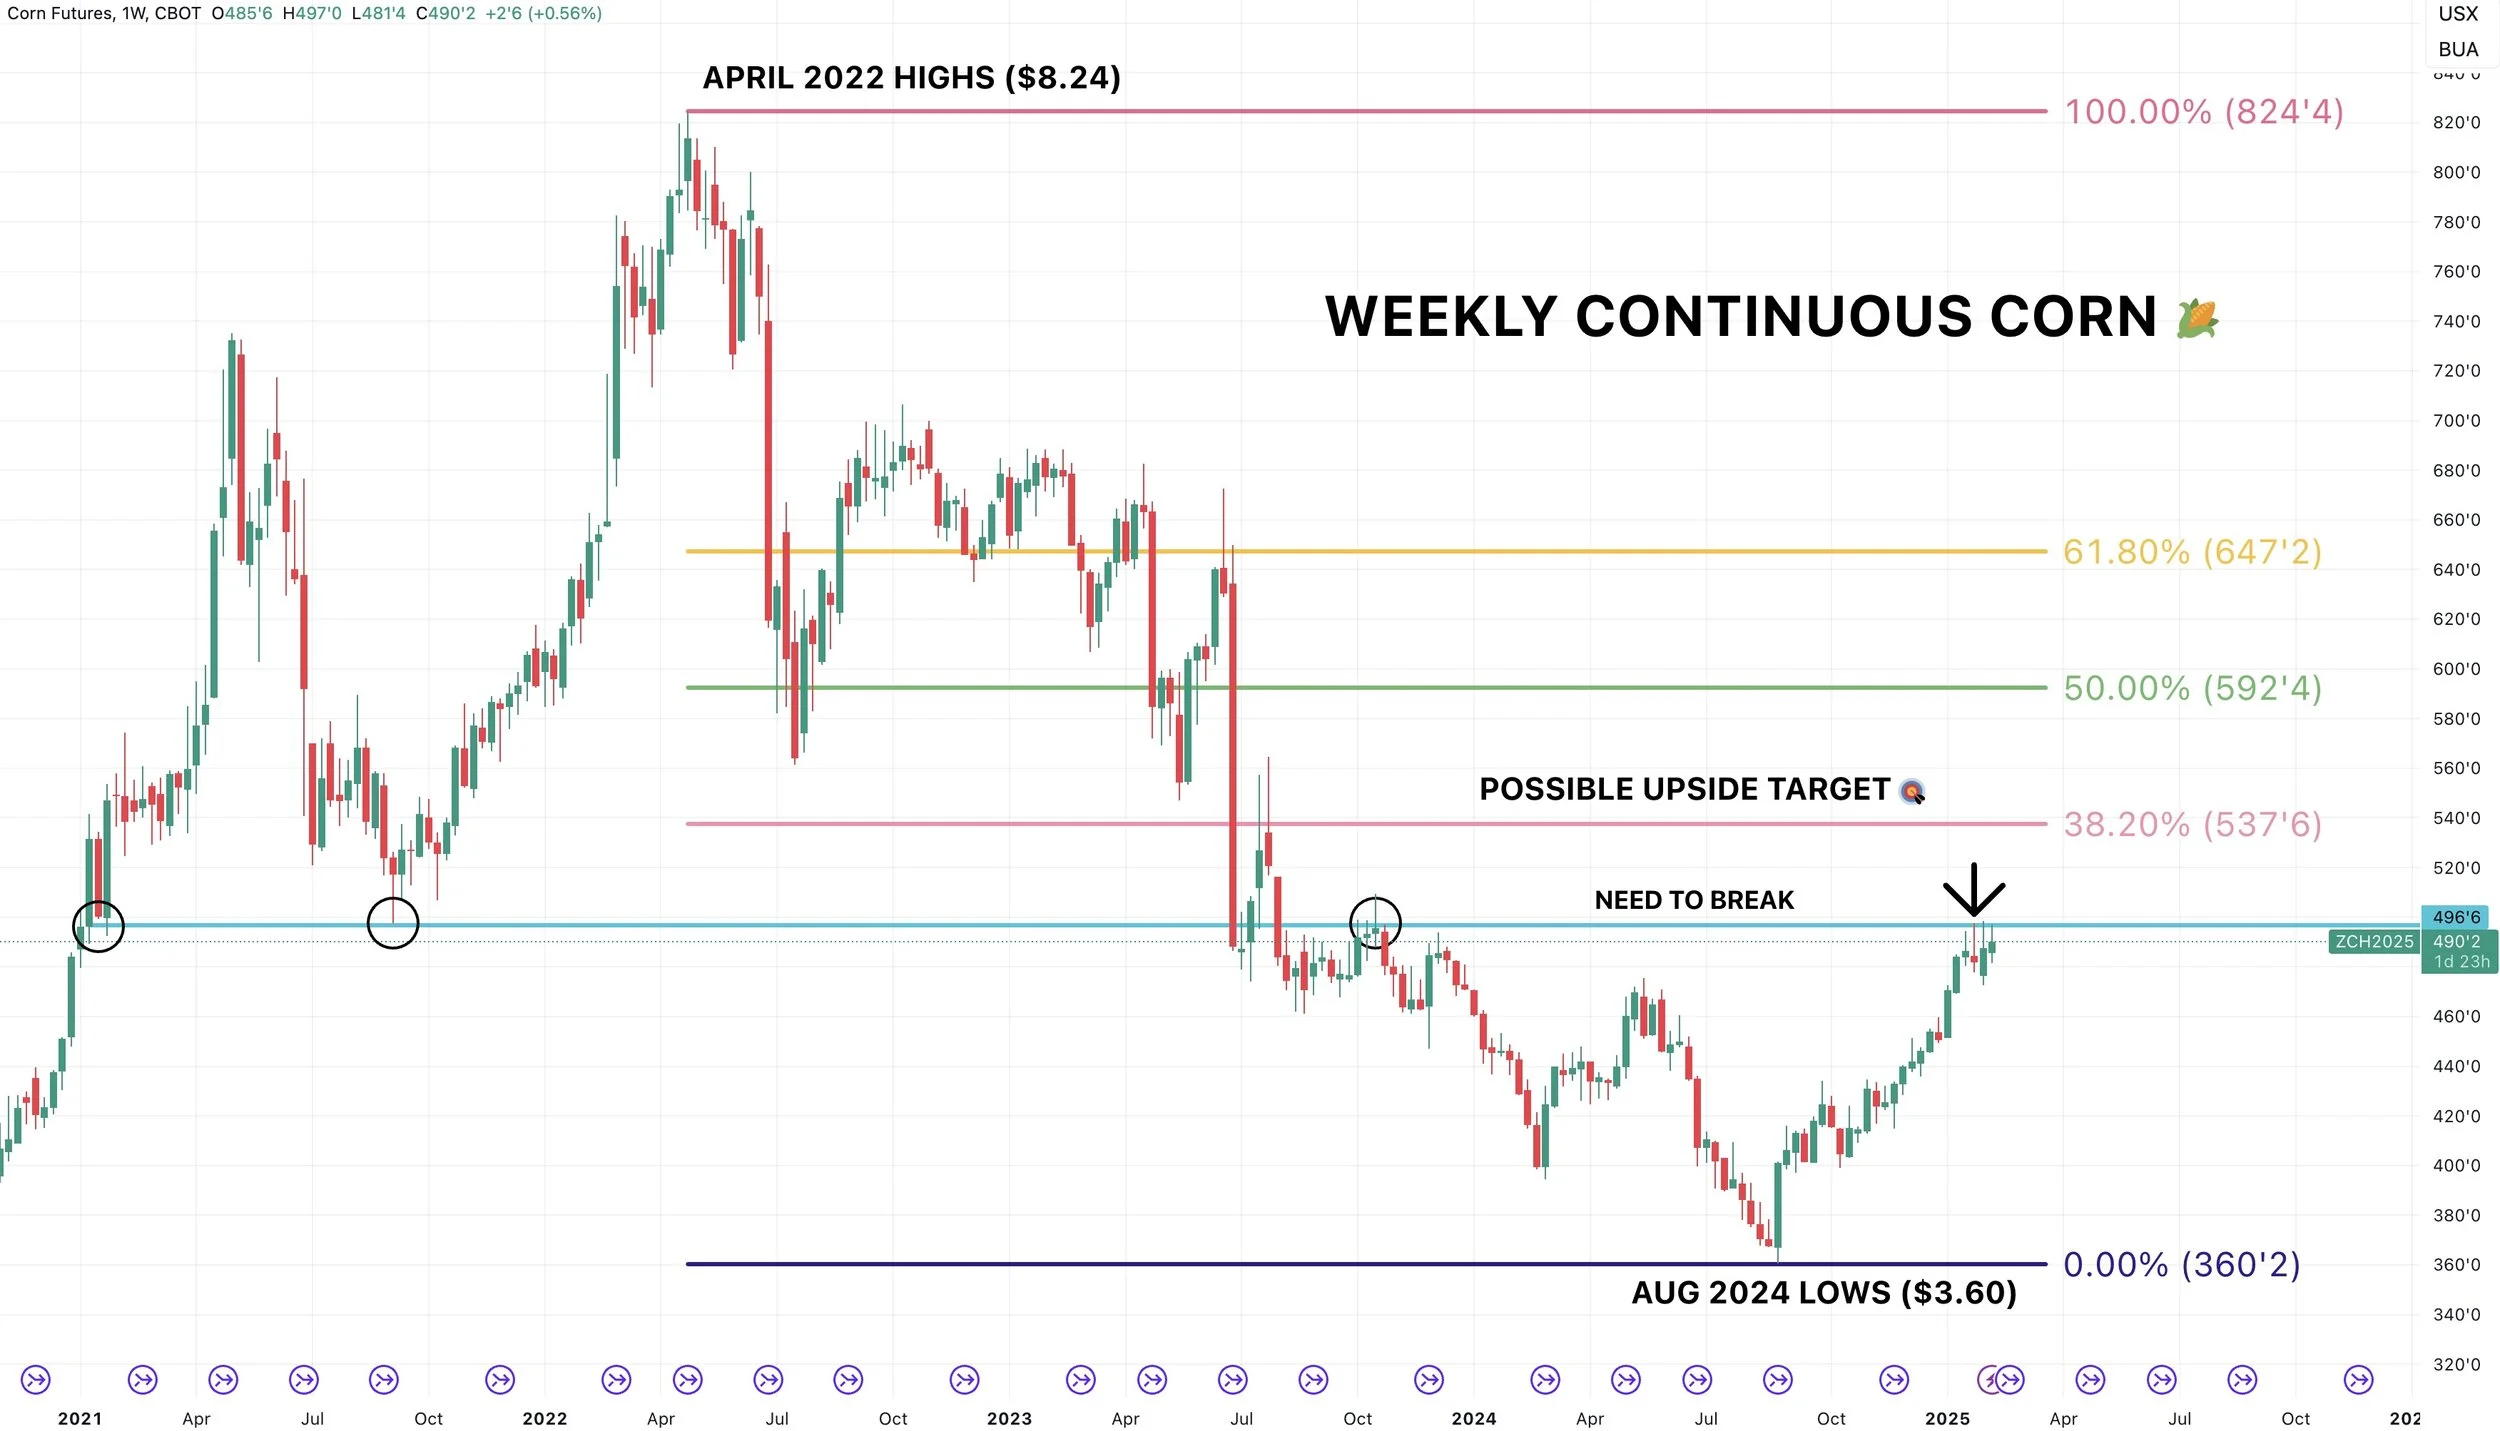
Looking at weekly corn, I still think that if we break this recent highs it is going to easily open the door to higher prices. (Need to break above blue line)
I still have the $5.37 area as my major long term point of interest. (38.2% of the April $8.24 highs).
But this area is a major level for bulls to win.
It was our lows back in 2021 and has acted as big support or resistance several times. So it makes sense that we could struggle right here.
We have rejected here for 4 straight weeks in a row.
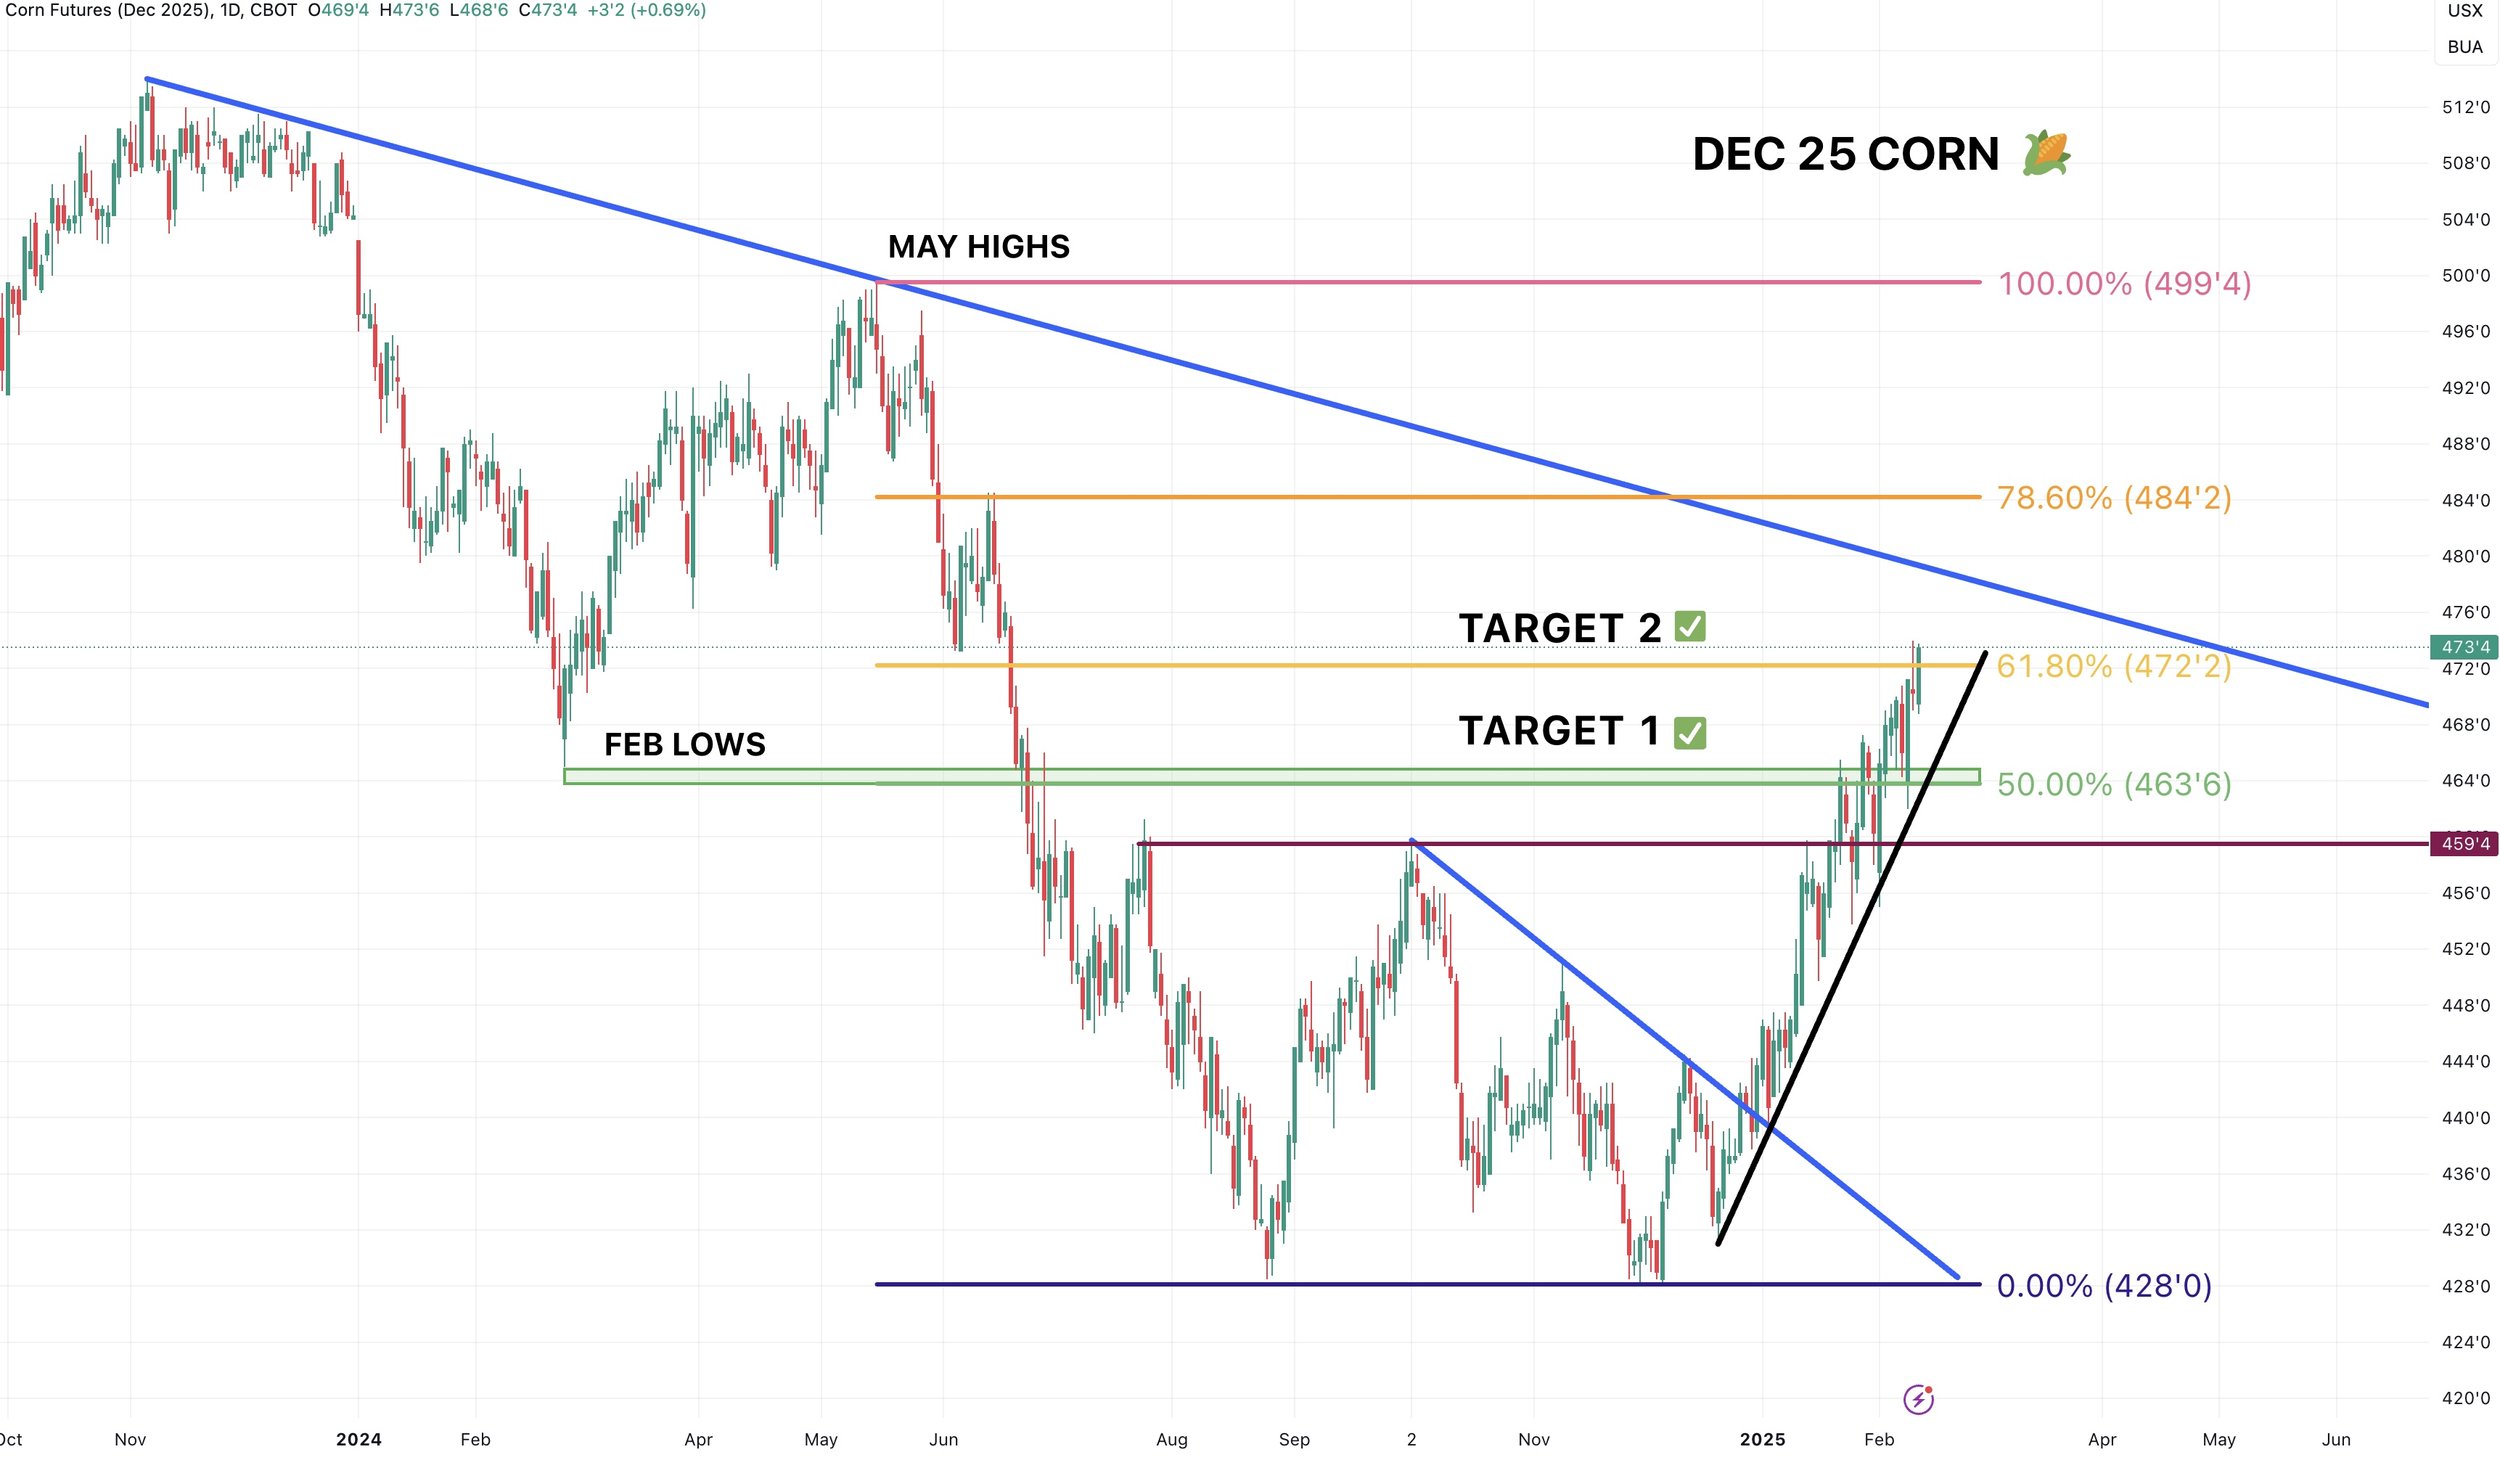
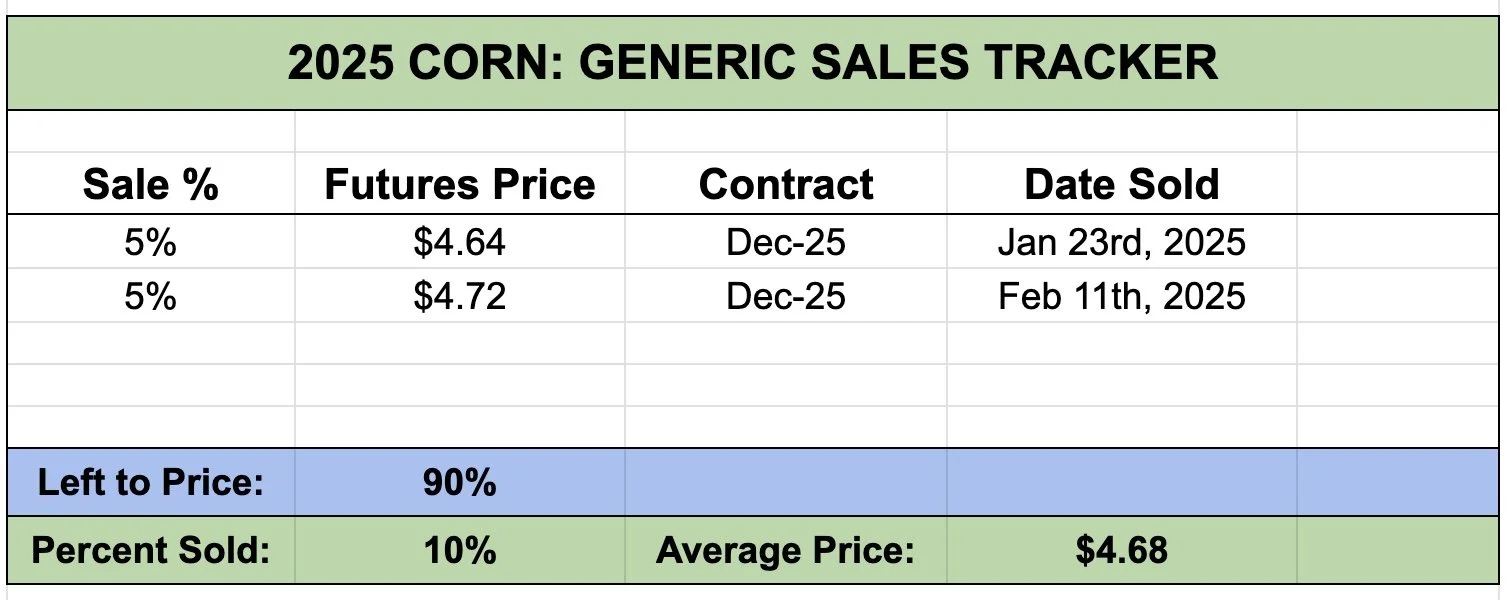
Looking at Dec-25 corn.
We hit my 2nd target of $4.72
So on my generic sales tracker I did make a small 5% sale. Bringing my total to 10% sold.
I probably won’t be making anymore unless we climb into the $4.80's or so.
(Ideally I'd rather utilize old crop puts for my new crop rather than flat out sales as we have talked about several times the past few weeks. If you have questions on it shoot us a text or call: (605)295-3100)

Looking at the chart, it looks great.
We have a solid uptrend in place.
Next big resistance might be the trendline resistance from back in 2023. (Big blue line)
Soybeans
The Bearish Argument:
South America beans are $40 cheaper than US on the export market. Brazil harvest should be reaching normal pace here soon. The ideal export window for beans is closing. Seasonally Brazil's harvest should pressure beans. We still have a bearish global balance sheet. If we get China tariffs, it'll be bad.
The Bullish Argument:
If soybeans were going to $9 they would’ve already been there. A lot of these bearish factors such as a monster crop in Brazil are somewhat priced in. An increase in US crush might not be priced in. We are likely going to see less acres this year. If China & Trump agree to a trade deal, it'll be friendly. The funds are long and on board.
-
So there is both sides to the story.
Personally, I still can’t get super bullish on beans. As the world & US fundamentals don’t scream higher prices. At the same time, I don’t see us getting substantially cheaper.
But that doesn’t mean we can’t get some pricing opportunities especially this spring/summer.
I'd say our absolute ceiling right now given these exact fundamentals is in the realm of $12.00, unless something changes.
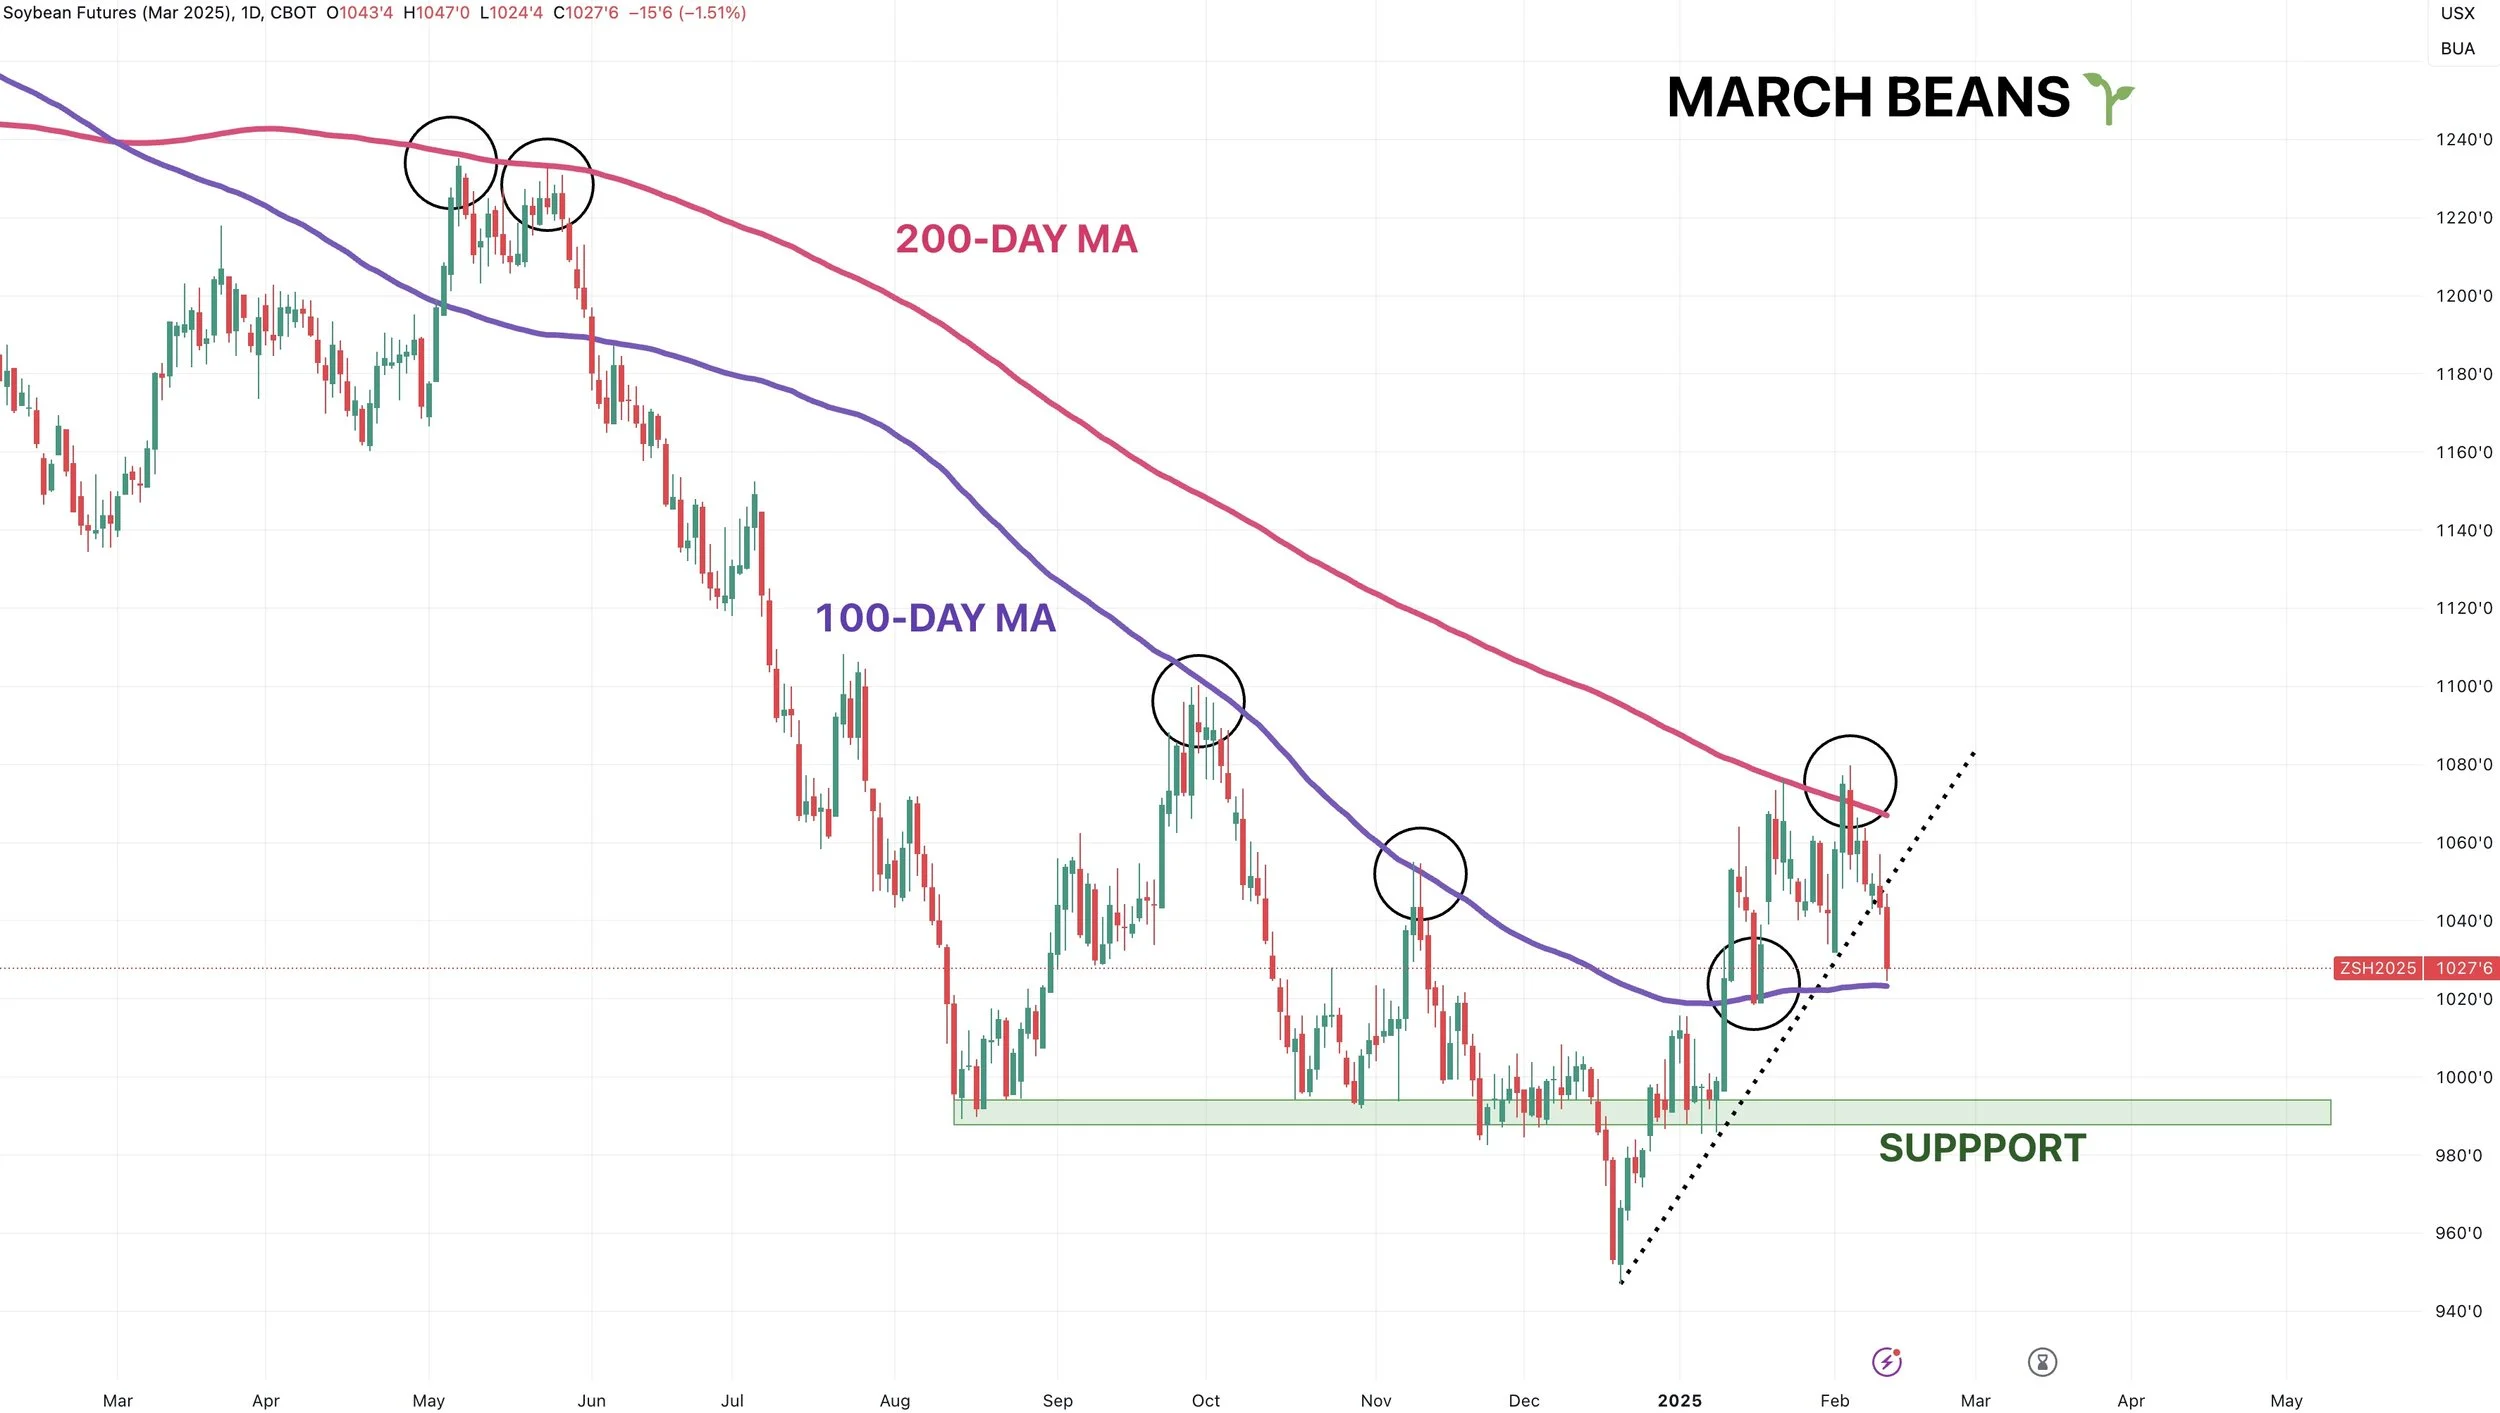
Looking at the chart, it doesn’t look too hot.
We broke the uptrend, but we are still holding the 100-day MA (purple line).
The 100-day MA was once pretty big resistance, it is now support. Bulls pretty much want to bounce right now or it likely results in a bigger sell off. Tomorrow will be key to see if the funds and algos buy here.
For bulls to be pretty certain we are going to see higher prices, they'd like to climb above the 200-day MA (pink line). It has acted as a lid several times.
Here is a look at continuous beans.
This doesn’t look promising as we once again rejected that multi-year downward trendline from 2022.
Bulls really need to break above that to have a story for higher prices.

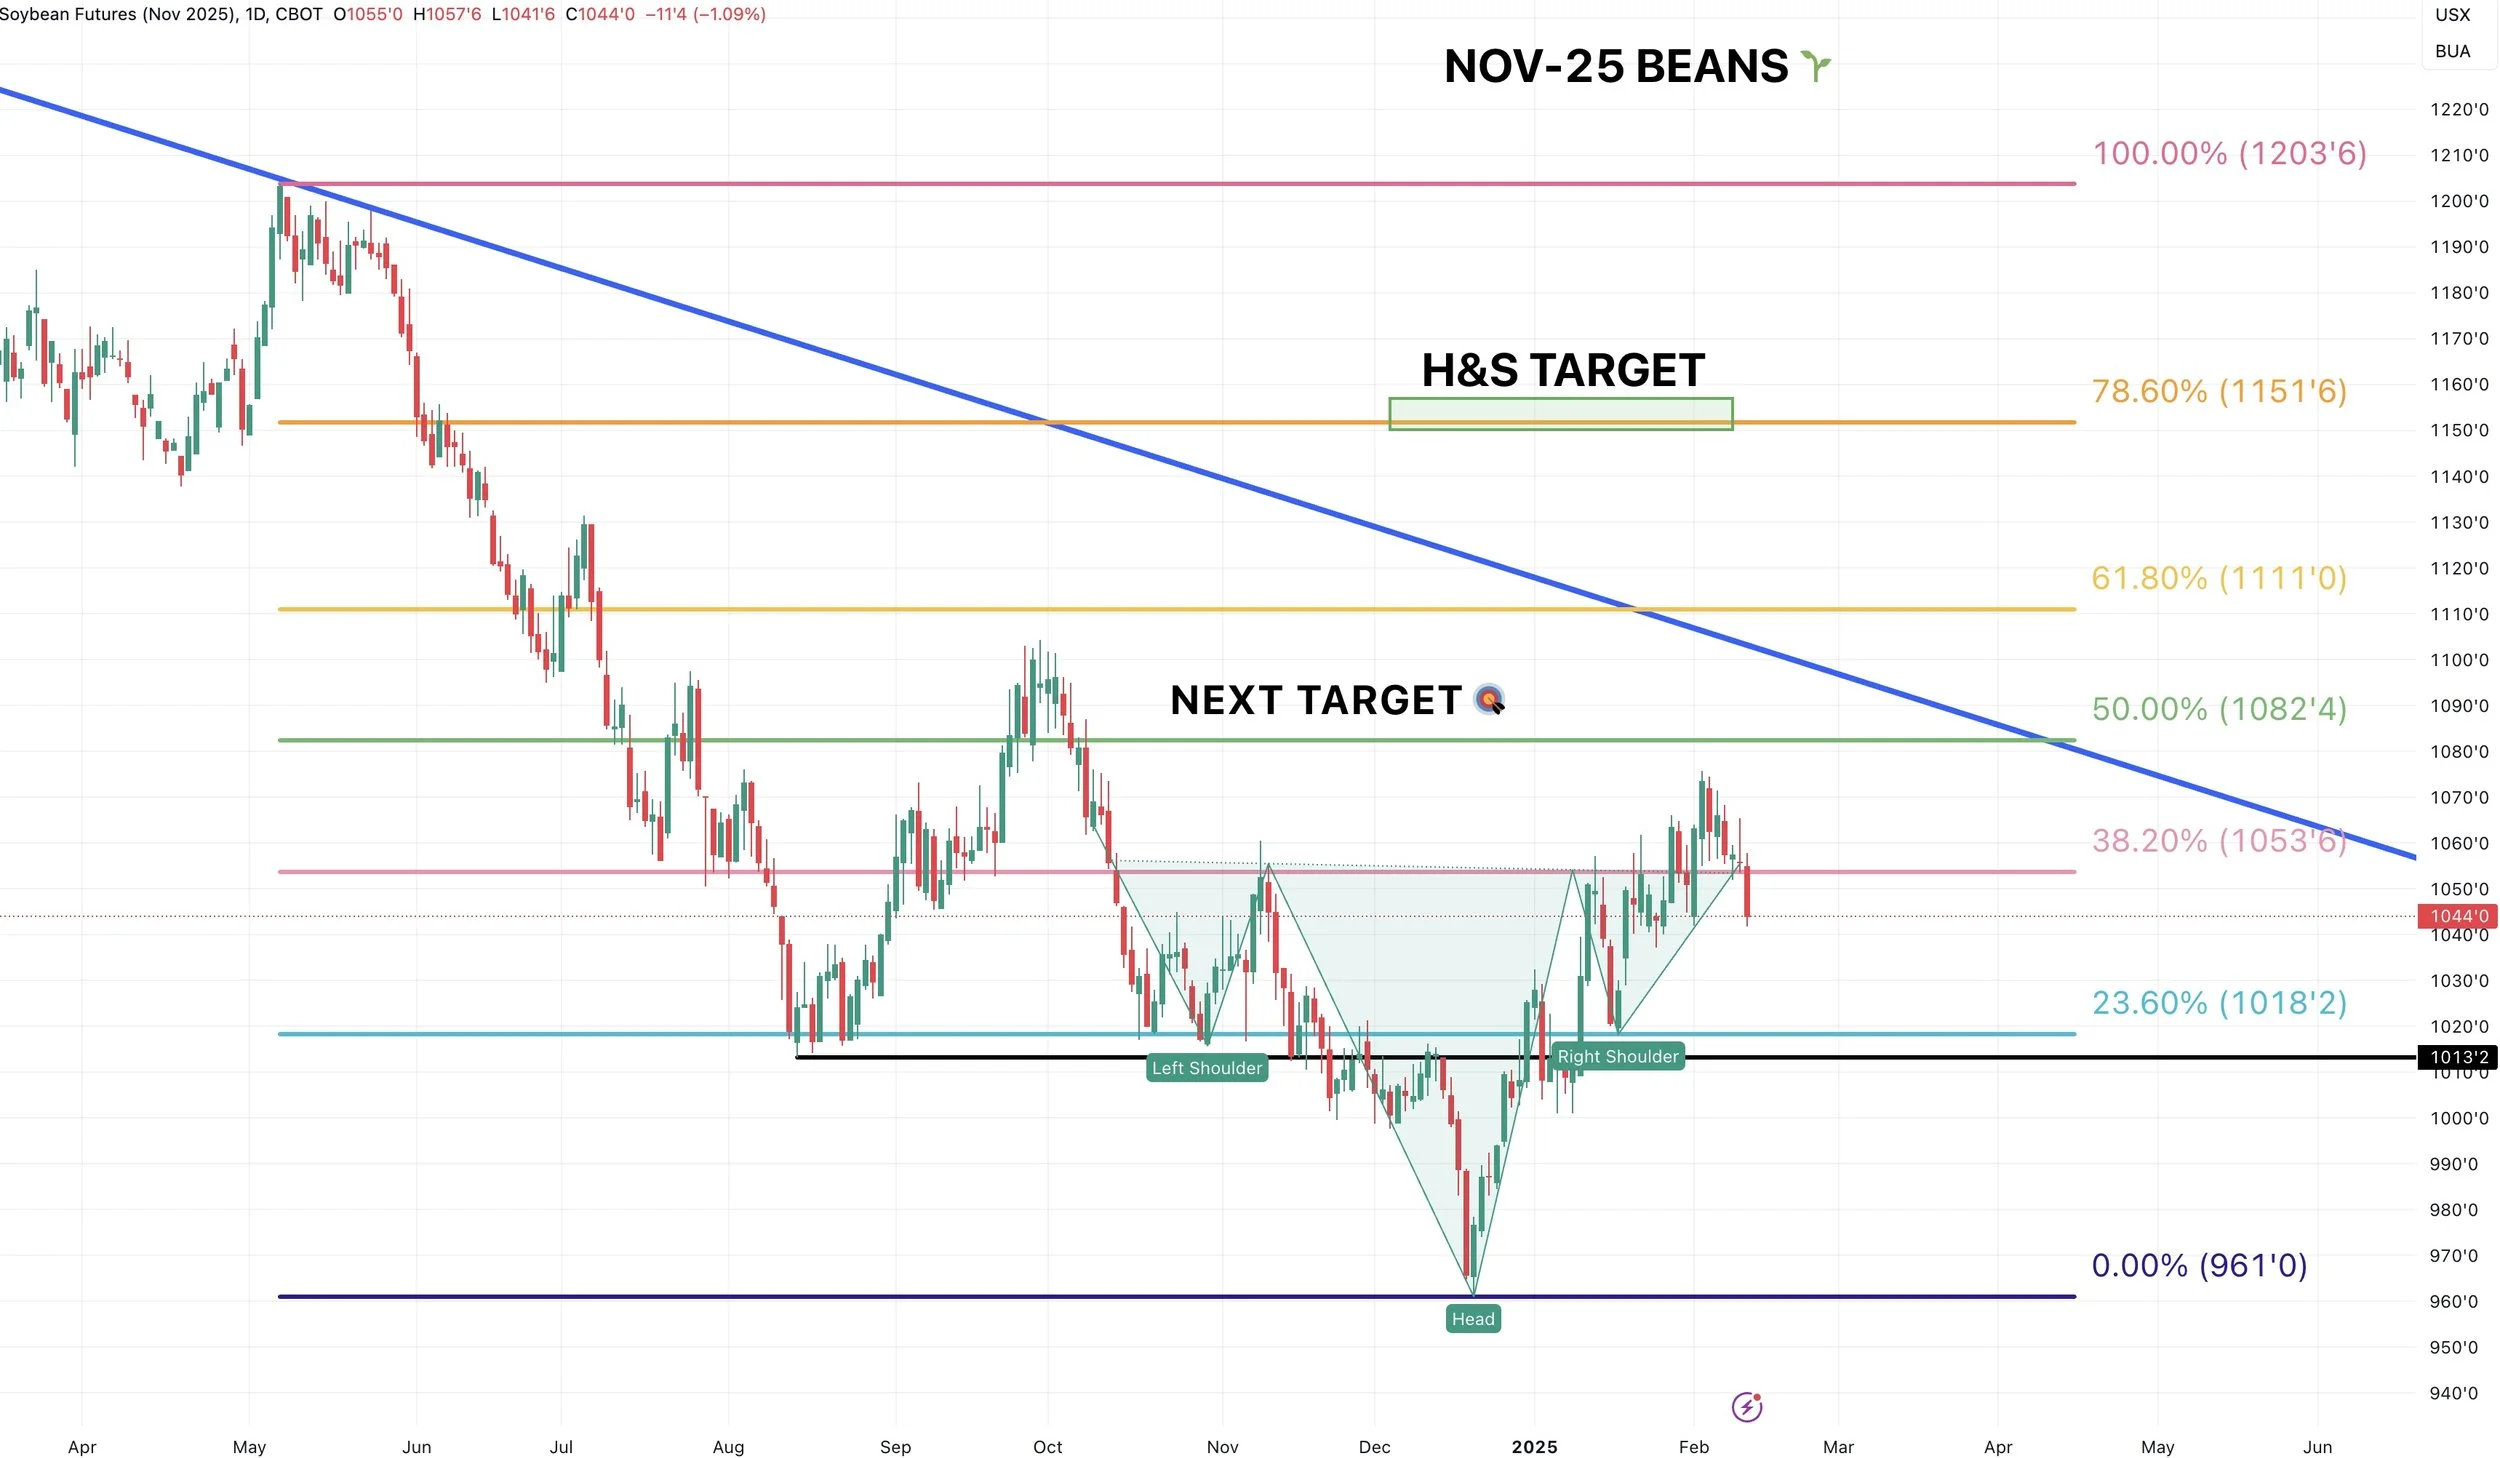
The targets for new crop have not changed.
My next target is still $10.82 (50% of May 2024 highs).
A bigger picture target is still going to be around that $11.50 area.
It is the implied upside move from this inverse head & shoulders.
It is also 78.6% to the May highs.
If that target hits later this year, I will look to be a lot more aggressive than I am at these levels.
Wheat
Not much to add on wheat.
I still think we are underavlued here.
We have one of the tightest global balance sheets in ages with plenty of other friendly factors I've gone over in the past.
I am personally still waiting for my March $6.20 target to hit to make sales.
That is 38.2% of the May highs.

The May chart gives a little better picture of the level bulls need to hold to keep the upward bias in place.
Ideally we hold $5.78, which is -10 cents lower than today.
That was old resistance, hopefully it is now support.
If we break below that, then the chart would somewhat look broken and remove the short term upward bias.

Looking at KC, we continue to hold this support level of $5.89
Ideally we continue to do so. If not, next support is $5.75. After that, the next support is the old lows.
If $5.89 doesn't hold, I'd like to think $5.75 probably does.
Next target is still $6.30 (38.2% of May highs)

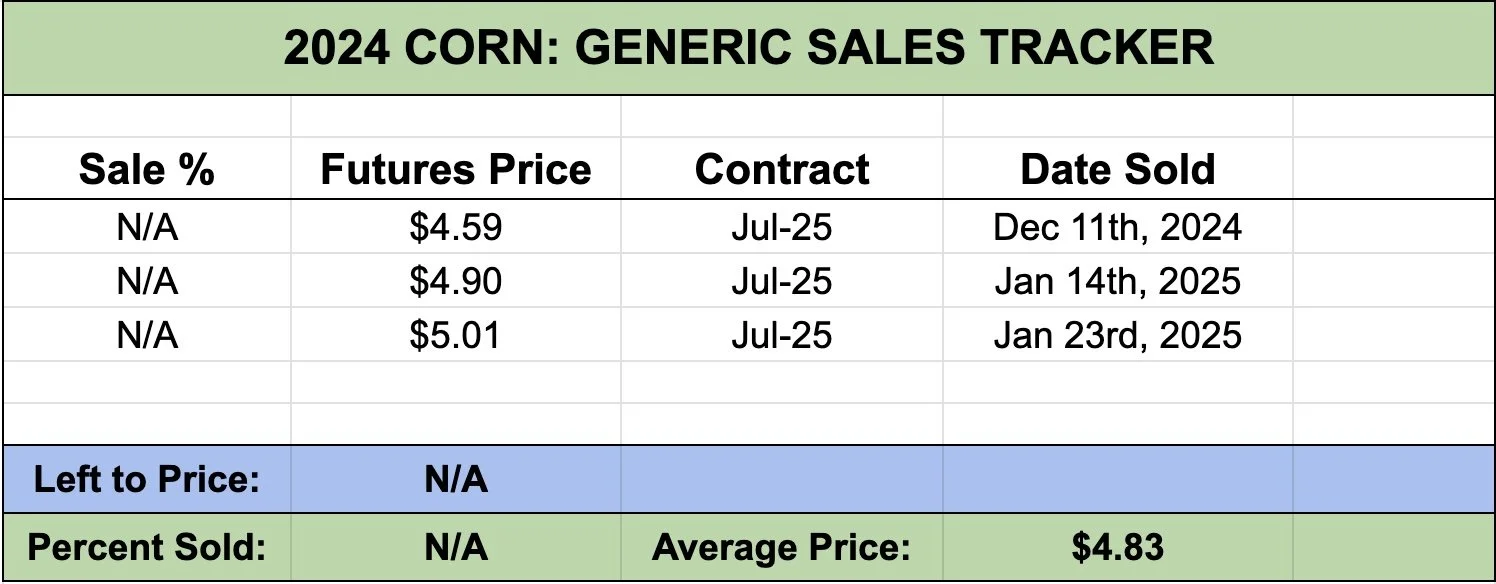
Generic Cash Sales Tracker
Due to requests here is our generic cash sales trackers.
This does not include any hedge recommendations etc. Simply cash.
This is futures prices.
For old crop there is no percentages as we only recently started tracking our generic sell signals. Future new crop sales will have percentages as we continue to make sales.
This will be included at the bottom of every update.
*NEW SALE:
5% NEW CROP CORN AT $4.72


Past Sell or Protection Signals
We recently incorporated these. Here are our past signals.
Jan 23rd: 🌽 🌱
Corn & beans old crop sell signal.
CLICK HERE TO VIEW
Jan 15th: 🌽 🌱
Corn & beans hedge alert/sell signal.
Jan 2nd: 🐮
Cattle hedge alert at new all-time highs & target.
Dec 11th: 🌽
Corn sell signal at $4.51 200-day MA
CLICK HERE TO VIEW
Oct 2nd: 🌾
Wheat sell signal at $6.12 target
Sep 30th: 🌽
Corn protection signal at $4.23-26
Sep 27th: 🌱
Soybean sell & protection signal at $10.65
Sep 13th: 🌾
Wheat sell signal at $5.98
May 22nd: 🌾
Wheat sell signal when wheat traded +$7.00
Want to Talk?
Our phones are open 24/7 for you guys if you ever need anything or want to discuss your operation.
Hedge Account
Interested in a hedge account? Use the link below to set up an account or shoot Jeremey a call at (605)295-3100.
Check Out Past Updates
2/11/25
USDA: NOT A BEARISH REPORT. DISAPPOINTING PRICE ACTION
2/10/25
USDA TOMORROW. LONG TERM PATH FOR SUB 10% CORN STOCKS TO USE?
2/7/25
WHY WOULD THE FUNDS EXIT THEIR LONGS?
2/6/25
WHEAT FINALLY CATCHING A BID
2/5/25
COMPLETE THOUGHTS ON MARKETS: BACK & FORTH DISCUSSION
2/4/25
STRONG JANUARY LEAD TO STRONG YEAR? TARIFFS, CHARTS & MORE
2/3/25
TARIFFS PUSHED BACK
1/31/25
TARIFF NEWS ALL OVER THE PLACE. ARE YOU PREPARED FOR POSSIBILITIES?
1/30/25
WHEAT BULL ARGUMENT. TRUMP ADDS TARIFFS
1/29/25
CORN APPROACHES $5.00
1/28/25
TARIFFS, CORN FUNDS, SOUTH AMERICA & MORE
1/27/25
HEALTHY CORRECTION WE TALKED ABOUT & TARIFF NEWS
1/24/25
GRAINS DUE FOR SHORT TERM CORRECTION?
1/23/25
OUR ENTIRE NEW CROP SALES THOUGHTS & OLD CROP SELL SIGNAL
1/22/25
GRAINS TAKE A BREATHER. IS CORN IN A BULL OR BEAR MARKET?
1/21/25
HUGE DAY IN GRAINS. WHAT TO DO WITH OLD CROP VS NEW CROP
Read More
1/20/25
VIDEO CHART UPDATE
1/17/25
TRUMP, CHINA, ARGY & USING THE SPREADS INVERSE
1/16/25
OLD CROP LEADS US LOWER. MARKETING THOUGHTS
1/15/25
SIGNAL & HEDGE ALERT QUESTIONS EXPLAINED. IS $6 CORN EVEN POSSIBLE?
1/14/25
MORE DETAILS ON TODAYS HEDGE ALERT & SELL SIGNAL
1/14/25
CORN & SOYBEANS HEDGE ALERT/SELL SIGNAL
1/13/25
USDA GAME CHANGER OR NOT?
1/10/25
BULLISH USDA FOR CORN & BEANS
1/9/25
USDA OUT TOMORROW
1/8/25
2 DAYS UNTIL USDA. BE PREPARED
1/7/25
THE HISTORY OF THE JAN USDA & MORE
1/6/25
MAJOR USDA REPORT FRIDAY
1/3/25
UGLY DAY ACROSS THE GRAINS
1/2/25
LONG TERM CORN UPTREND? JANUARY DROP OFF IN BEANS? LONG TERM WHEAT FACTORS
1/2/25
CATTLE HEDGE ALERT
12/31/24
MASSIVE DAY FOR GRAINS. FLOORS? 2025 SALES? GAME PLAN? CHART BREAKDOWNS
12/30/24
GRAINS FADE EARLY HIGHS
12/27/24
STILL LONG TERM UPSIDE POTENTIAL, BUT TAKE ADVANTAGE OF 6 MONTH CORN HIGH
12/26/24
CORN ABOVE 200-DAY MA. ARGY DRY. BEANS +44 CENTS OFF LOWS
12/23/24
CORN & BEANS TALE OF 2 STORIES. BEANS REJECT OLD SUPPORT
12/20/24
PERFECT BOUNCE IN CORN. SIMPLE BEAN BACKTEST BEFORE LOWER?
12/19/24
THE SOYBEAN PROBLEM. NEW WHEAT LOWS. CORN UPTREND
12/18/24
BEANS BREAK SUPPORT & OPEN FLOOD GATES
12/17/24
SINK OR SWIM TIME FOR SOYBEANS
12/16/24
SOYBEANS & WHEAT FIGHTING LOWS. WILL CORN DEMAND CONTINUE
12/13/24
POST USDA COOL OFF
12/12/24
CORN CORRECTION. WHY WE ALERTED SELL SIGNAL YESTERDAY
12/11/24
USDA PRICED IN? FAIR VALUE OF CORN? BEAN BREAKOUT?
12/11/24
CORN SELL SIGNAL
12/10/24
USDA BREAKDOWN
12/9/24
USDA TOMORROW
12/6/24
CORN TRYING TO BREAKOUT. MAKING MARKETING DECISIONS
12/5/24
OPTIMISTIC BOUNCE IN GRAINS
12/4/24
WHEAT UNDERVALUED? MOST RISK IN BEANS. HAVE A GAME PLAN
12/3/24
BEANS HOLDING DESPITE LACK OF BULLISH STORY
12/2/24
TRUMP & BRAZIL HURDLES
11/27/24
CORN SPREADS, CRUCIAL SPOT FOR BEANS, SEASONALITY SAYS BUY
11/26/24