
FULL USDA REPORT BREAKDOWN
CLOSING GRAIN MARKET AUDIO COMMENTS & WEEKLY COMMODITY PRICE HIGHLIGHTS RECAPPED
The USDA January 12th supply and demand report continued job of manipulating grain futures markets with big headline of “yield increase” although production didn’t increase much by dropping harvested acres, in an effort to hold trend line corn yields higher.
World corn and bean carryout stocks considered bearish towards future price. China reported big crop corn crop, to help manipulate crop prices lower.
How will we know when we make lows in the grain markets?
Kick the can down the road on Brazil soybean and corn production
Wheat planted acre numbers somewhat friendly
Despite lower prices, the action was reversal type candle stick closes for corn, soybeans, and wheat charts from a technical view.
Adding to your net price by locking in hedge profits and making sales that make sense
What is going to drive the grain markets and stop the price bleeding?
Full write up & numbers from garbage USDA crop report below audio commentary*
Listen to today’s audio here
You only got to listen 4min of today’s 13min audio. Subscribe HERE to keep listening & get every update. Not Sure? Try a 30-day Free Trial HERE
Weekly Commodity Price Wrap & USDA Supply & Demand Report Breakdown
Prefer to Listen? Audio Version
Monday we opened lower at the CBOT, continuing the price weakness for the grain markets from the brutal first week of the new year.
Next saw a little bit of a turnaround Tuesday in future prices for the grains. Then we had the CONAB production numbers on Wednesday for corn and soybeans. They didn’t trim Brazil production as much as bulls would have liked.
Then yesterday was a disappointing day as soybeans were +13 cents higher but ended the day unchanged.
Lastly.. today's USDA annual crop report where we got the final 2023 yields and production.
Overall it was a bearish towards future prices, as expected. Almost everyone was expecting a bearish USDA report and that is exactly what we got.
Despite the awful report, the price action wasn’t all that bad. We had an impressive bounce across the board, which left technical reversal possible signs.
Corn had the most bearish report, yet closed +6 cents off it's lows and down over a dime on the day.
Soybeans were down over a massive -30 cents following the report, but rallied +20 cents off their lows to close down just -12 cents.
The wheat market also rallied a dime off their lows, down almost -8 cents on the day.
Here were the weekly price changes.

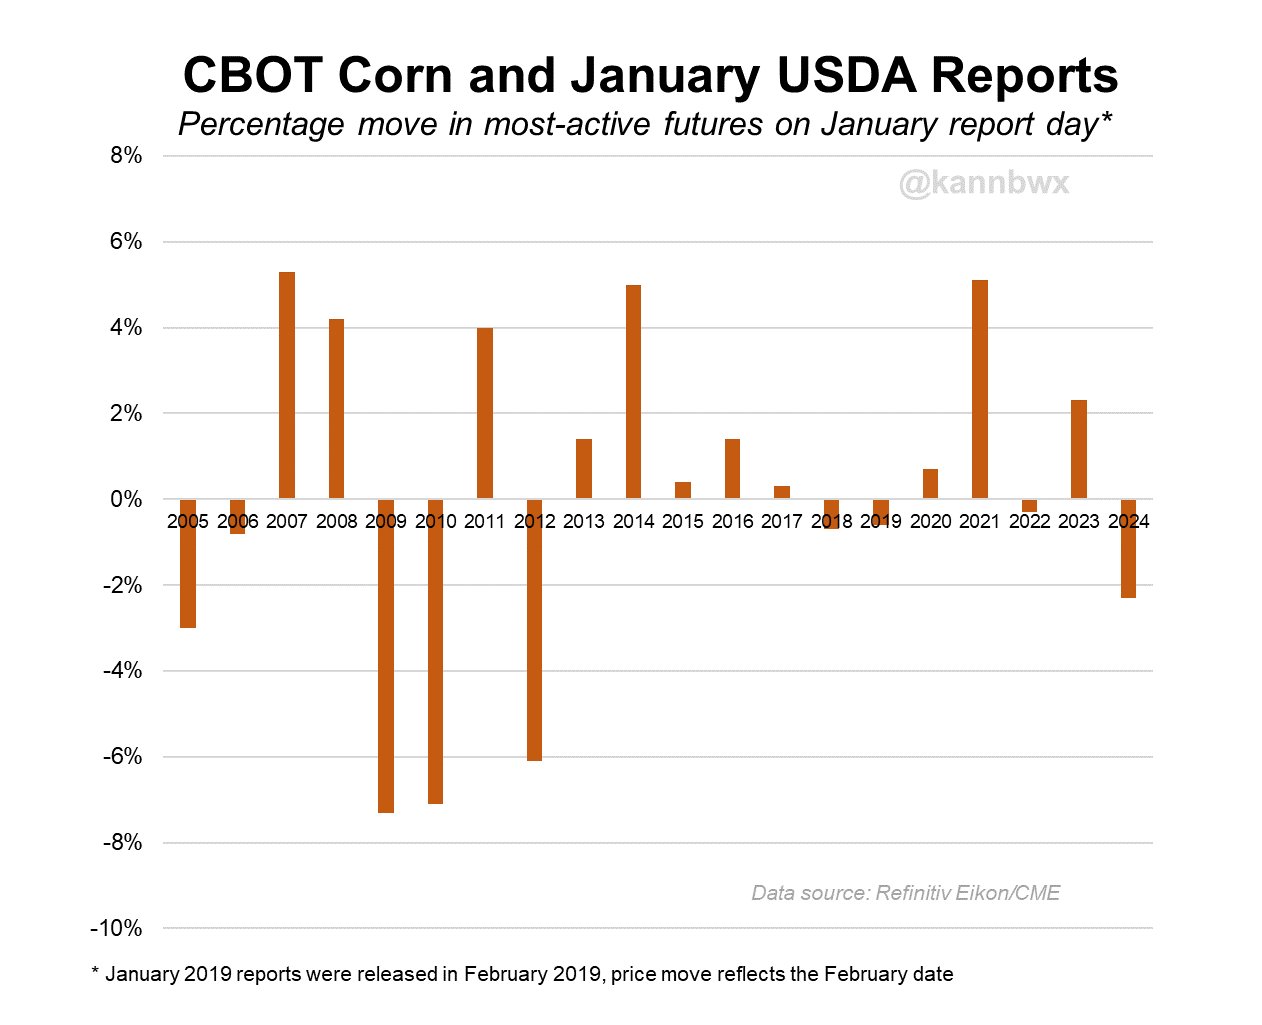
This is how today's report shaped up with previous years in terms of most active futures price move on the January report day.
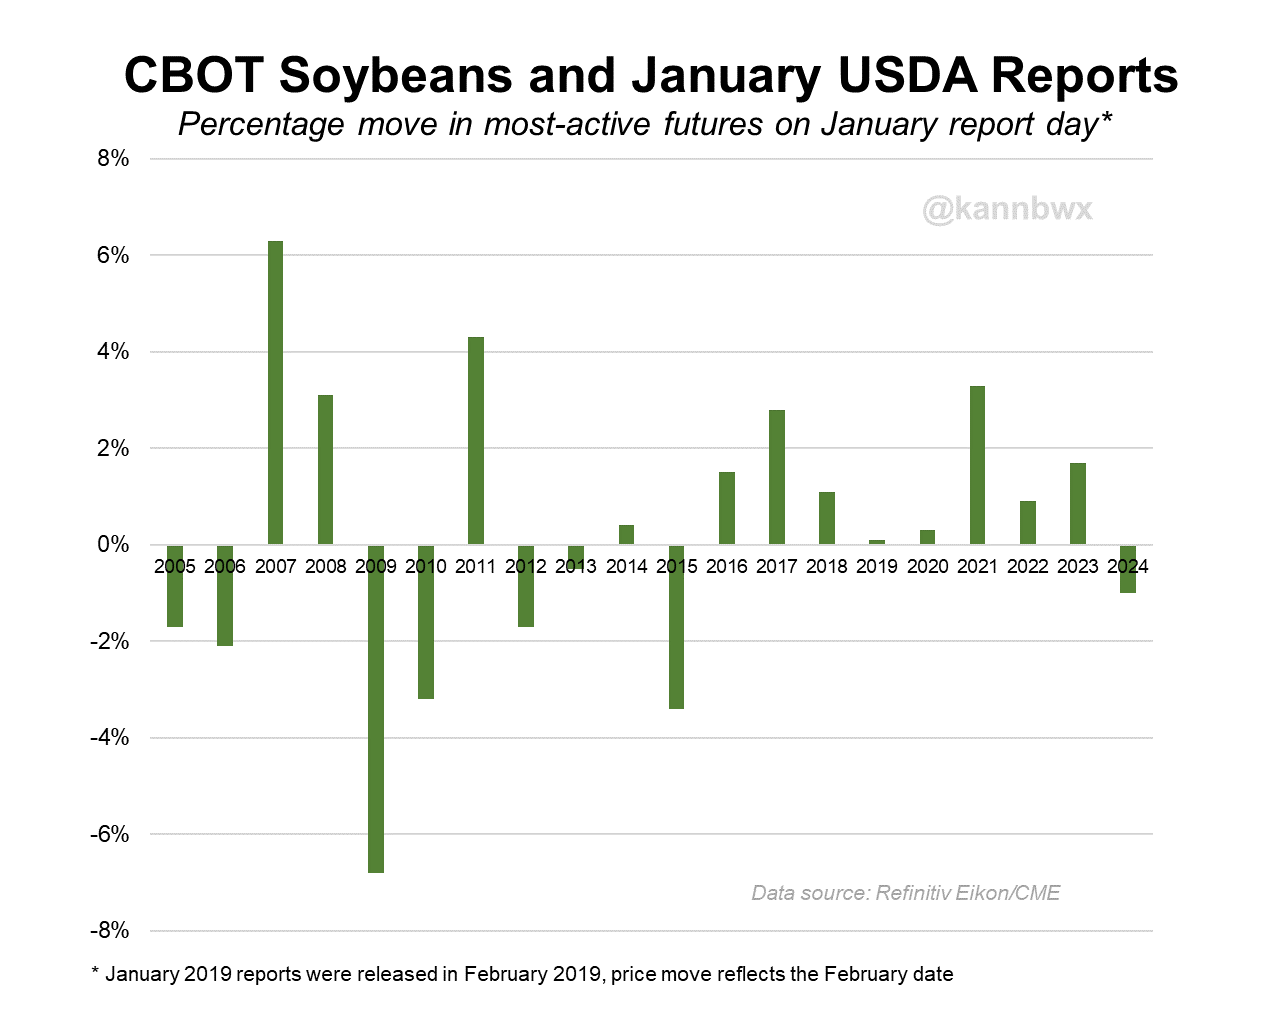
Credit to Karen Braun for these next two charts.
For corn, this was the worst performance for the January report in 12 years, since 2012.
For beans, this was the first time in 9 years that beans traded lower on this report.
Now let's take a look at the report numbers.
First we had the USDA raise US production and yield. This was the biggest surprise as nobody saw this one coming, but yesterday we pointed out that this was a very real possibility of happening because the USDA does things no one expects.
They raised corn yield from 174.9 to a whopping 177.3 which is a record yield. This was 1 bushel higher than the highest pre-report estimate.
They also raised beans from 49.9 to 50.6. This was still below trend line and far from the record of 51.9.
Here is what I said Wednesday:
"This report can bring surprises. So what are some surprises to look out for? The trade is expecting US yield to come in unchanged from November. No one is expecting yield to increase. So yes, that is a possibility and a risk. Especially considering all of the areas where it looked like they wouldn't have much of a crop end up having a decent one."
"I am also being very aware that there is a chance the USDA slightly bumps both corn and bean yields. If you take a look at the trade range for US corn yield, there is more risk of a big number than a small number with the ranges being 174 to 176.5 compared to November's 174.9."
Yes this big of a jump especially in corn yield shocked the market, but we knew this was a potential risk not many were talking about.
Todays corn yield was the biggest shock to the upside on January yield since 2009.

So what does this report mean?……..
The rest of this is subscriber-only. In today’s update we will be going over what this report means. Doing a full breakdown of all of the numbers. Taking a look at history. Did today’s charts leave a silver lining?
HOLIDAY SALE
Make this the year you beat Big Ag at their own game.
Comes with ability to call or text us 24/7 and completely tailored marketing plans to take your operation to the next level.
Become a price maker.
$399 vs $800 per year
TRY 30 DAYS FREE
Not sure? Give us a try for 30 days
Want to Talk?
Our phones are open 24/7 for you guys if you ever need anything or want to discuss your operation.
Hedge Account
Interested in a hedge account? Use the link below to set up an account or shoot Jeremey a call at (605)295-3100 or Wade at (605)870-0091
Check Out Past Updates
1/11/24
USDA REPORT TOMORROW. ARE YOU PREPARED?
1/10/24
PREPARING FOR THE USDA
1/9/24
TURNAROUND TUESDAY & USDA PREVIEW
1/8/24
HOW TO GET COMFORTABLE AHEAD OF USDA REPORT
1/5/24
FIRST WEEK OF NEW YEAR FLOPS
1/4/24
REALIZING POTENTIAL UPSIDE BUT BEING AWARE OF RISKS
1/3/24
RAINS & BRAZIL ESTIMATES
1/2/24
UGLY DAY: BRAZIL, RISKS, & MARKETING STRATEGIES
Read More
12/29/23
SHORT TERM RISK & LONG TERM UPSIDE
12/28/23
BRAZIL RAINS?
12/27/23
EFFECTS OF US DOLLAR COLLAPSE ON GRAINS & STRATEGIES TO CONSIDER
12/26/23
GETTING COMFORTABLE WITH ALL POSSIBILITIES
12/22/23
BEAN BASIS RECOMMENDATION TO TAKE BACK CONTROL FROM BIG AG
12/21/23
COMMODITIES ARE DIRT CHEAP VS STOCKS
12/20/23
ARE YOU COMFORTABLE WITH $3 CORN OR $6 CORN?
12/19/23
CORN FIGHTING NEW LOWS & BRAZIL RAINS
12/18/23