WAS THAT THE BOTTOM IN CORN?
MARKET UPDATE
Don’t miss our next sell signal in the grains like the one on February 18th
Try 30 Days FREE: CLICK HERE
You can scroll to read the usual update as well. As the written version is the exact same as the video.
Timestamps for video:
News: 0:00min
Forecasts & Drought Update: 1:20min
Cattle Signal: 3:20min
Corn: 3:50min
Bottom in Corn?: 5:45min
Soybean: 8:15min
Wheat: 10:20min
Want to talk about your situation?
(605)295-3100
Futures Prices Close
Overview
Very light news day as corn & soybeans find some strength while the wheat market gives back some recent gains.
We won't have any major news until the March 31st USDA report.
Here is what we have for news.
EU Delays Retaliatory Tariffs:
This is friendly because the EU is the 4th largest buyer for corn. Accounting for nearly 10% of total US corn exports.
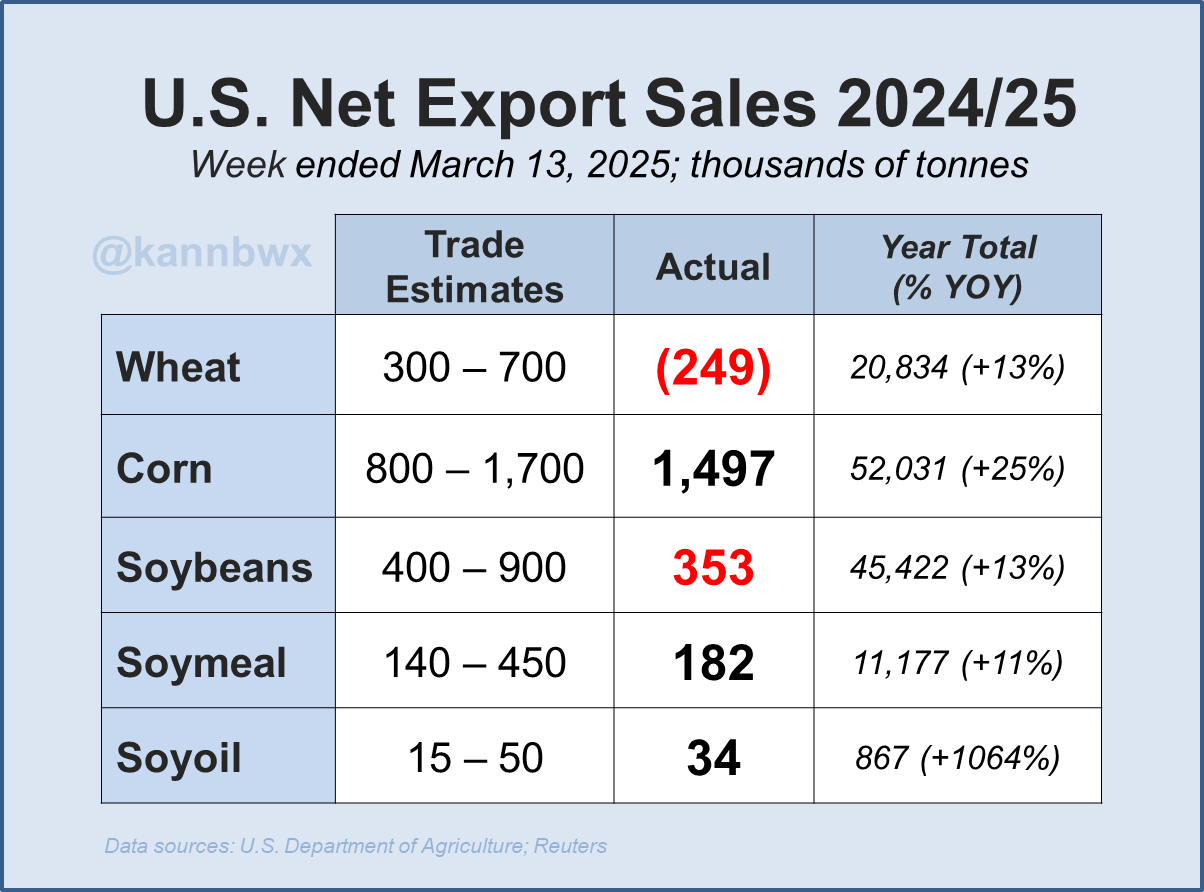
Export Sales:
We saw wheat sales actually come in negative this week. As there appears to have been incorrectly reported numbers out of Panama last week. This is part of the reason for the weakness in wheat today.
We saw fantastic corn numbers. Up +45% vs the 4-week average. Corn exports still remain well ahead of the USDA pace.
They came in at 58.8 million bushels. We only need 10.7 million each week to hit the USDA's current estimate.
I'd have to image they eventually bump this number. That would help the old crop balance sheet.
The March report doesn’t update the balance sheet. It is just stocks and planting intentions. So exports won’t be updated until April.
Numbers from Karen Braun
Here is a visual resprentation of our corn exports pace vs the USDA's estimate.
Updated Spring & Summer Forecasts
Here is some updated forecasts from BAM weather. As their outlook has slightly changed.
April: wet for the majority of the corn belt, but dry in the winter wheat areas
May: wet in the far eastern belt but the dryness creeps more north
June: wet to the east and dry to the west
July: wet in the far eastern belt, but then turns pretty dry in the central plains as it expands
April
May
June
July
Here is what the current corn areas in drought look like compared to previous years.
Only year we saw more drought for this time of year was 2013, but in 2013 it quickly vanished as this was following the disater of 2012 so drought was already on a decline from the record levels.
This does not mean anything yet, but will be closely watched.
Corn Spreads
The spreads continue to show that no matter what direction this market moves, old crop is going to lead us higher and lower.
The May-Dec spread went from +43 cent inverse, to +0, now back to +16 cents.
Today May was up +7 while Dec was only up +1
May corn fell -75 cents off the highs. Dec only fell -37 cents.
We have preached this for months. In this current market if you want to re-own something look at old crop, not new crop. If you want to protect something, protect old crop not new crop.
If you want to protect new crop, you can use old crop puts (NOT futures).
Cattle Hedge Alert & Sell Signal
Yesterday we alerted a sell signal for cattle.
In case you missed, once again wanted to remind you.
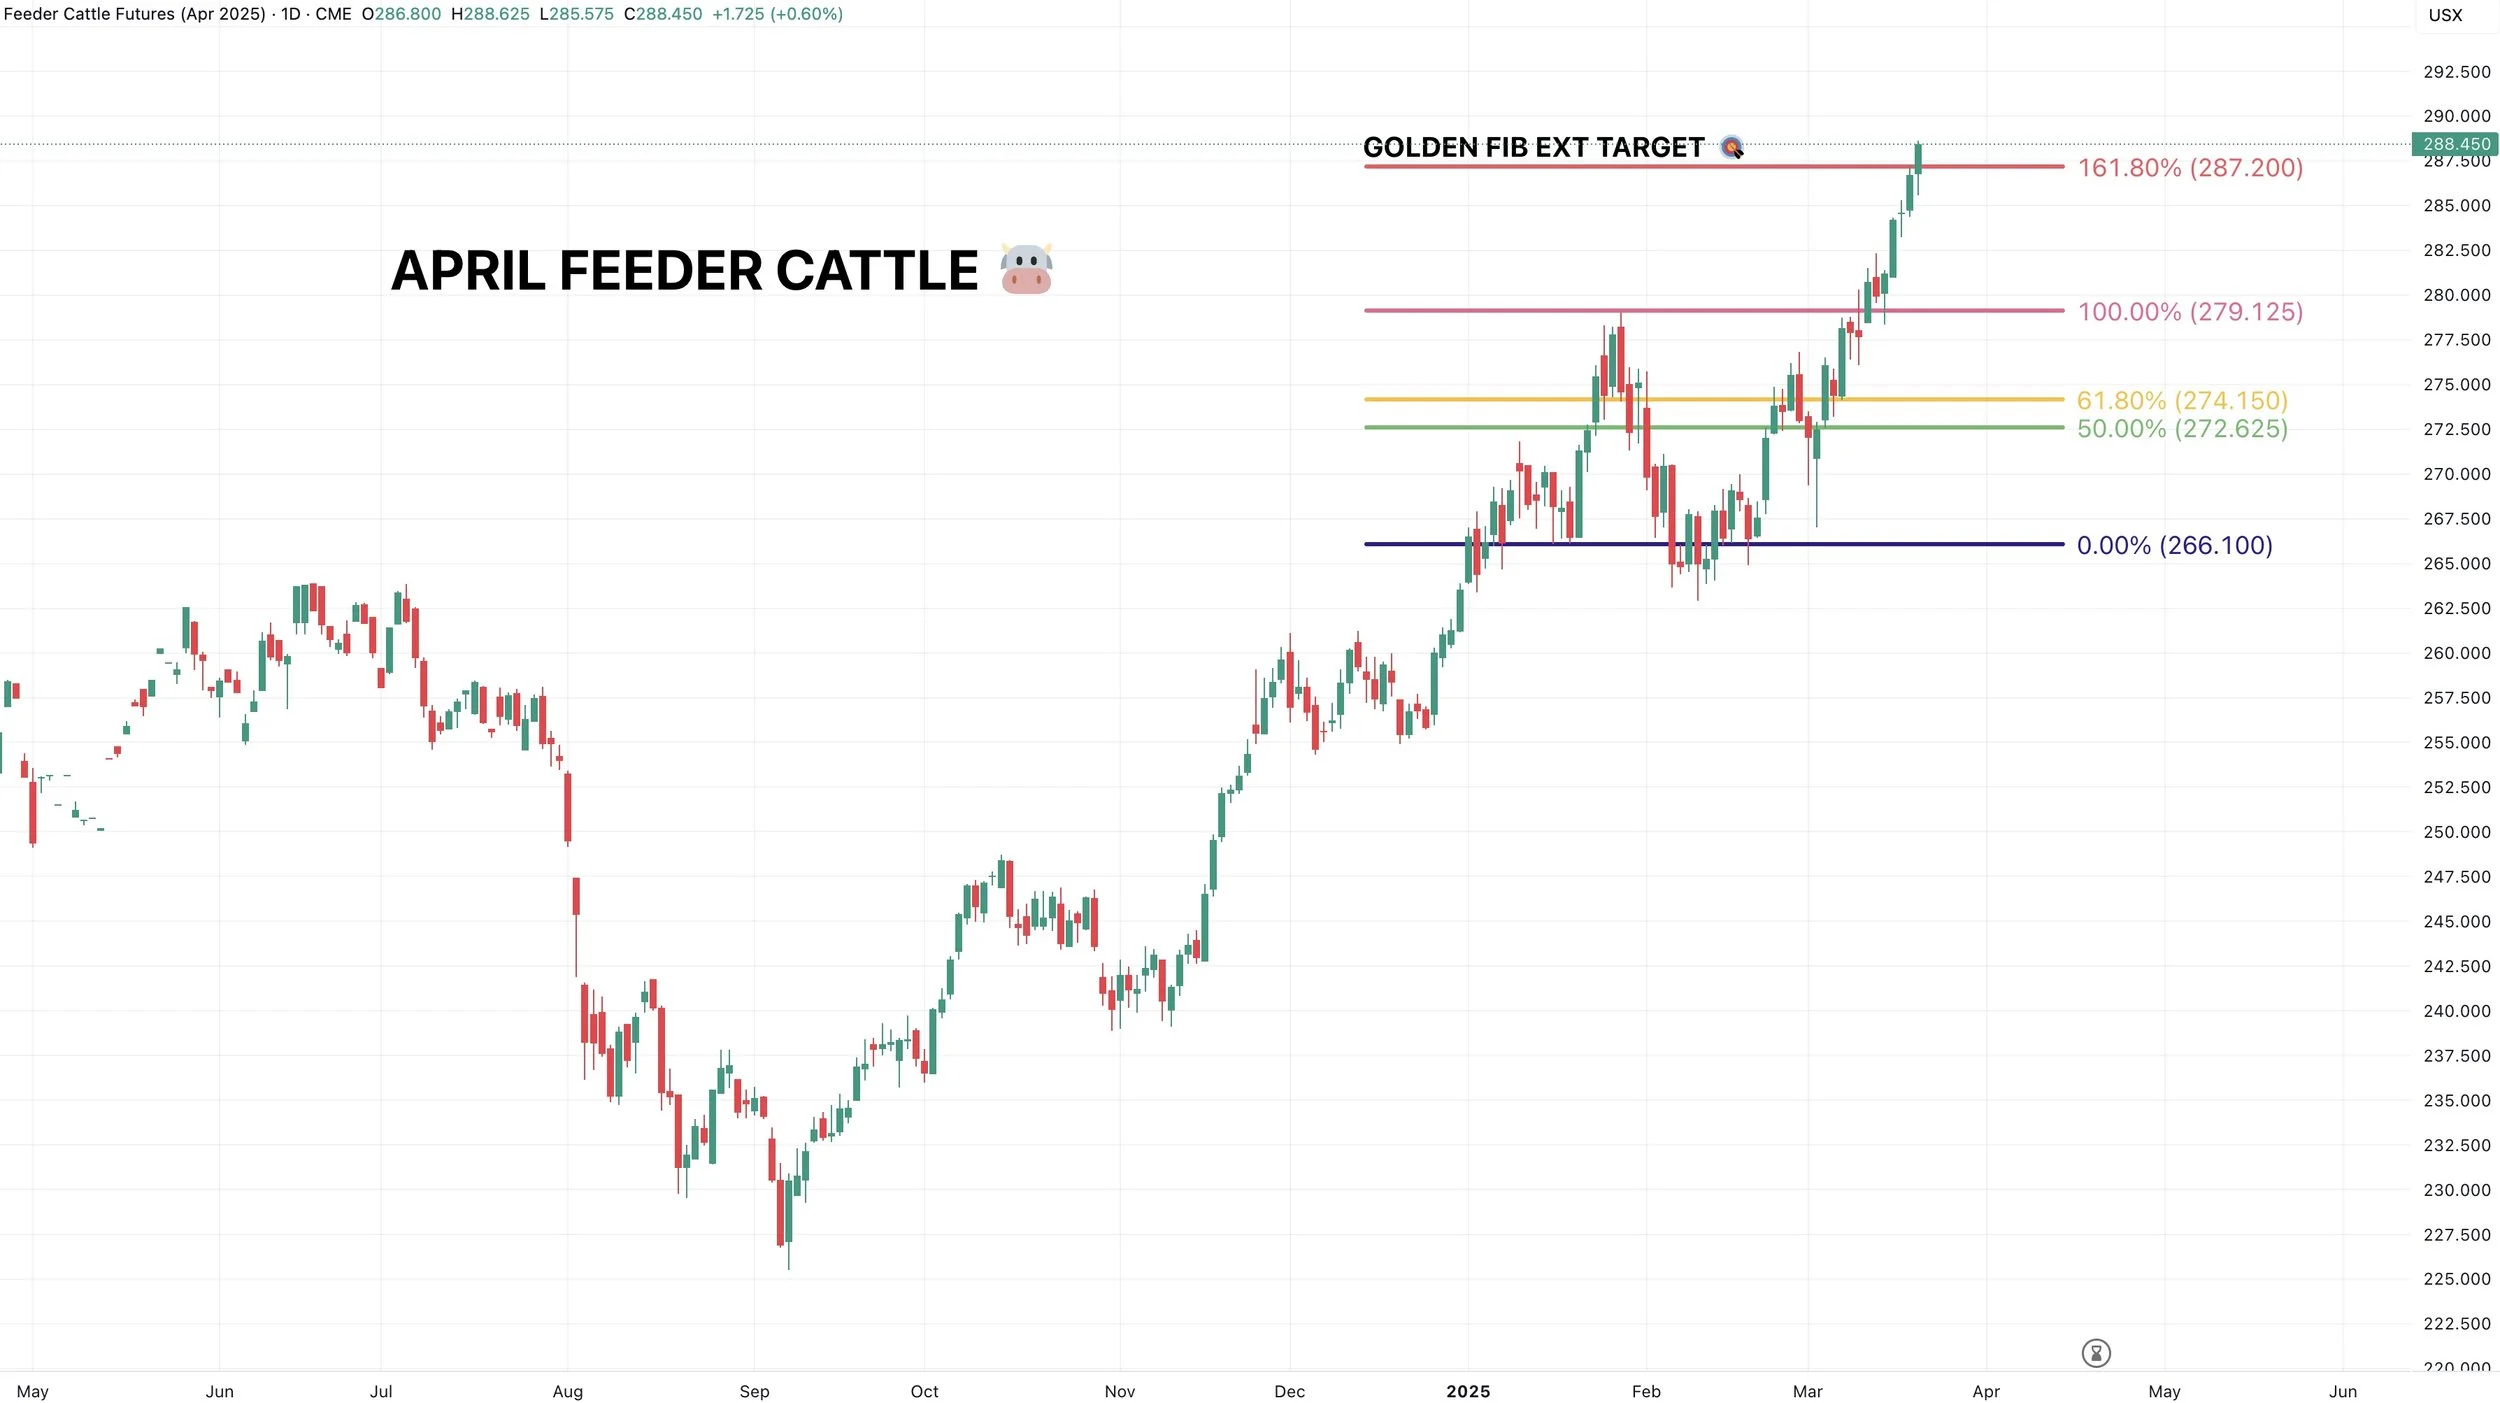
We hit my target on April feeder cattle (simple golden fib extension of the first rally. 161.8% is the most common level for a 2nd move).
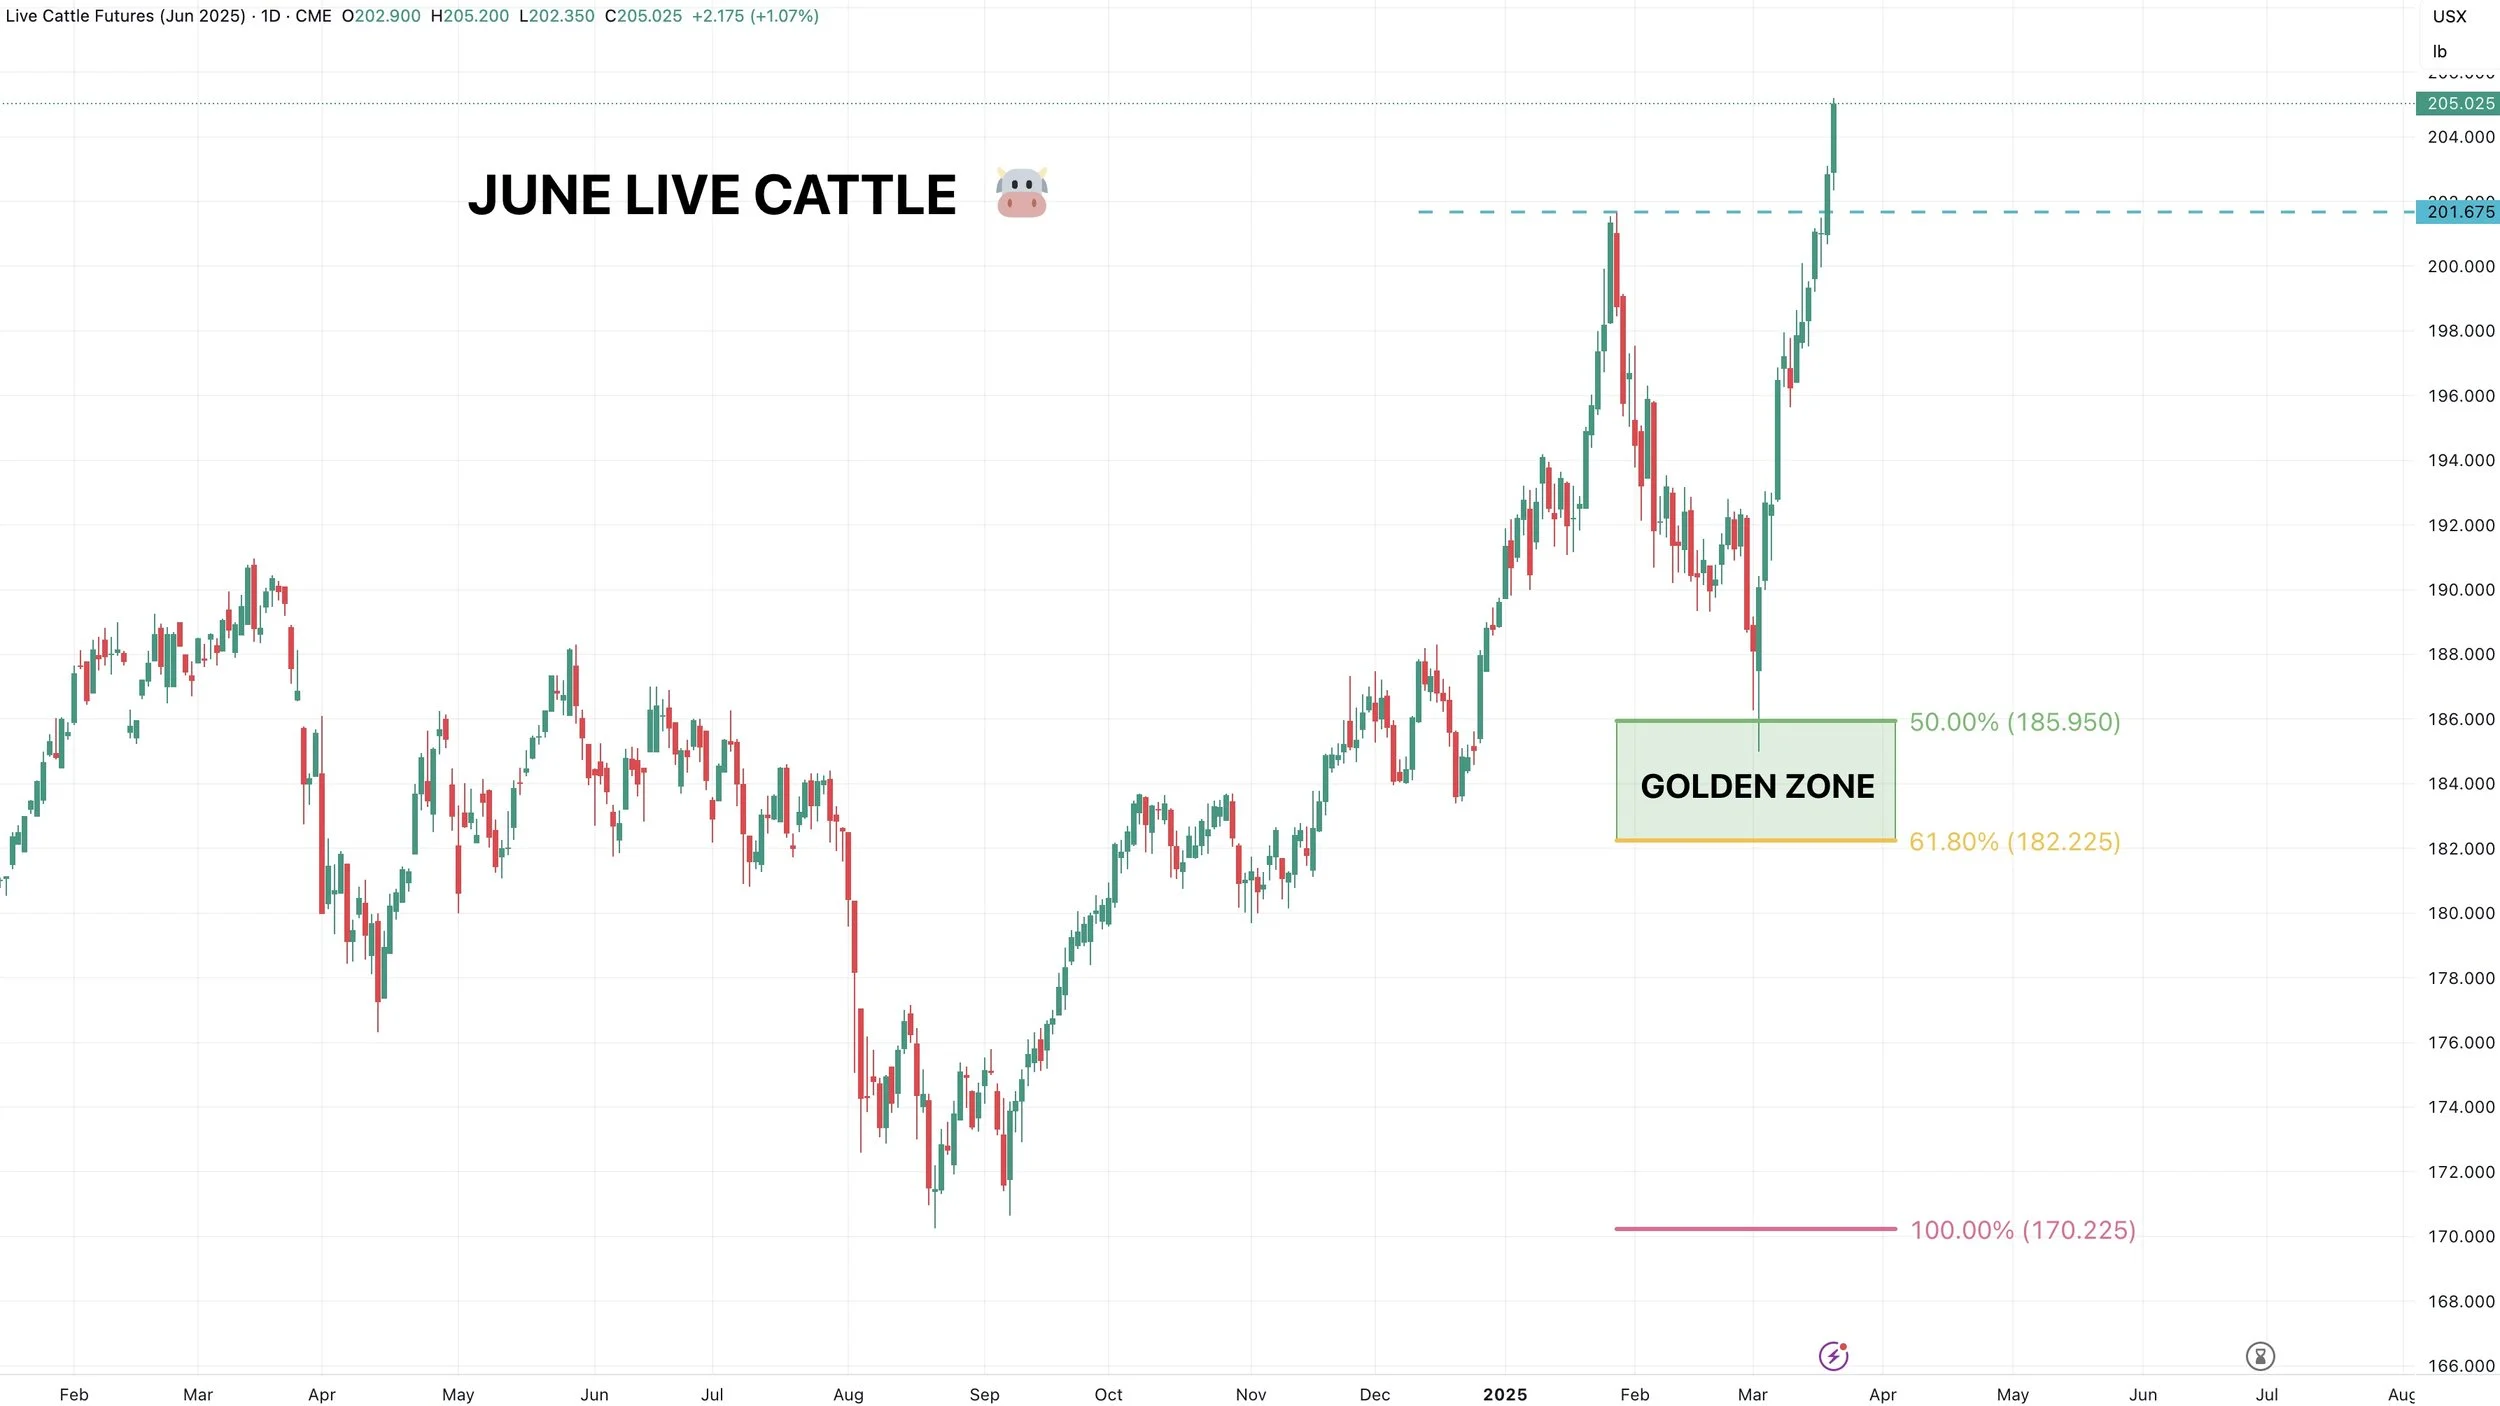
Live cattle also posted new highs. Giving those that missed the first run a 2nd chance.
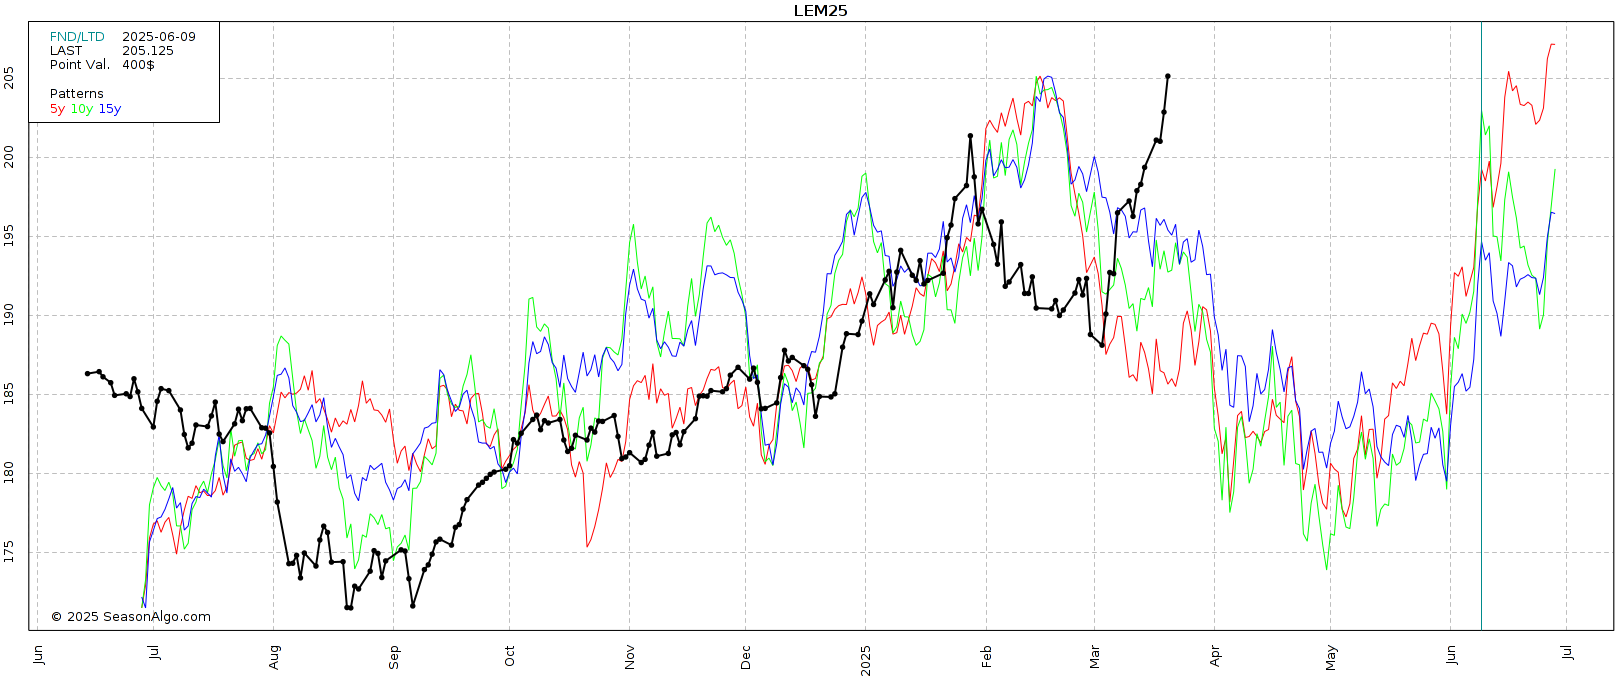
Here is the June live cattle seasonal.
Seasonally, we start to fall off here.
If you have questions or want to talk specifics give us a call or text (605)295-3100.
Today's Main Takeaways
Corn
Fundamentals:
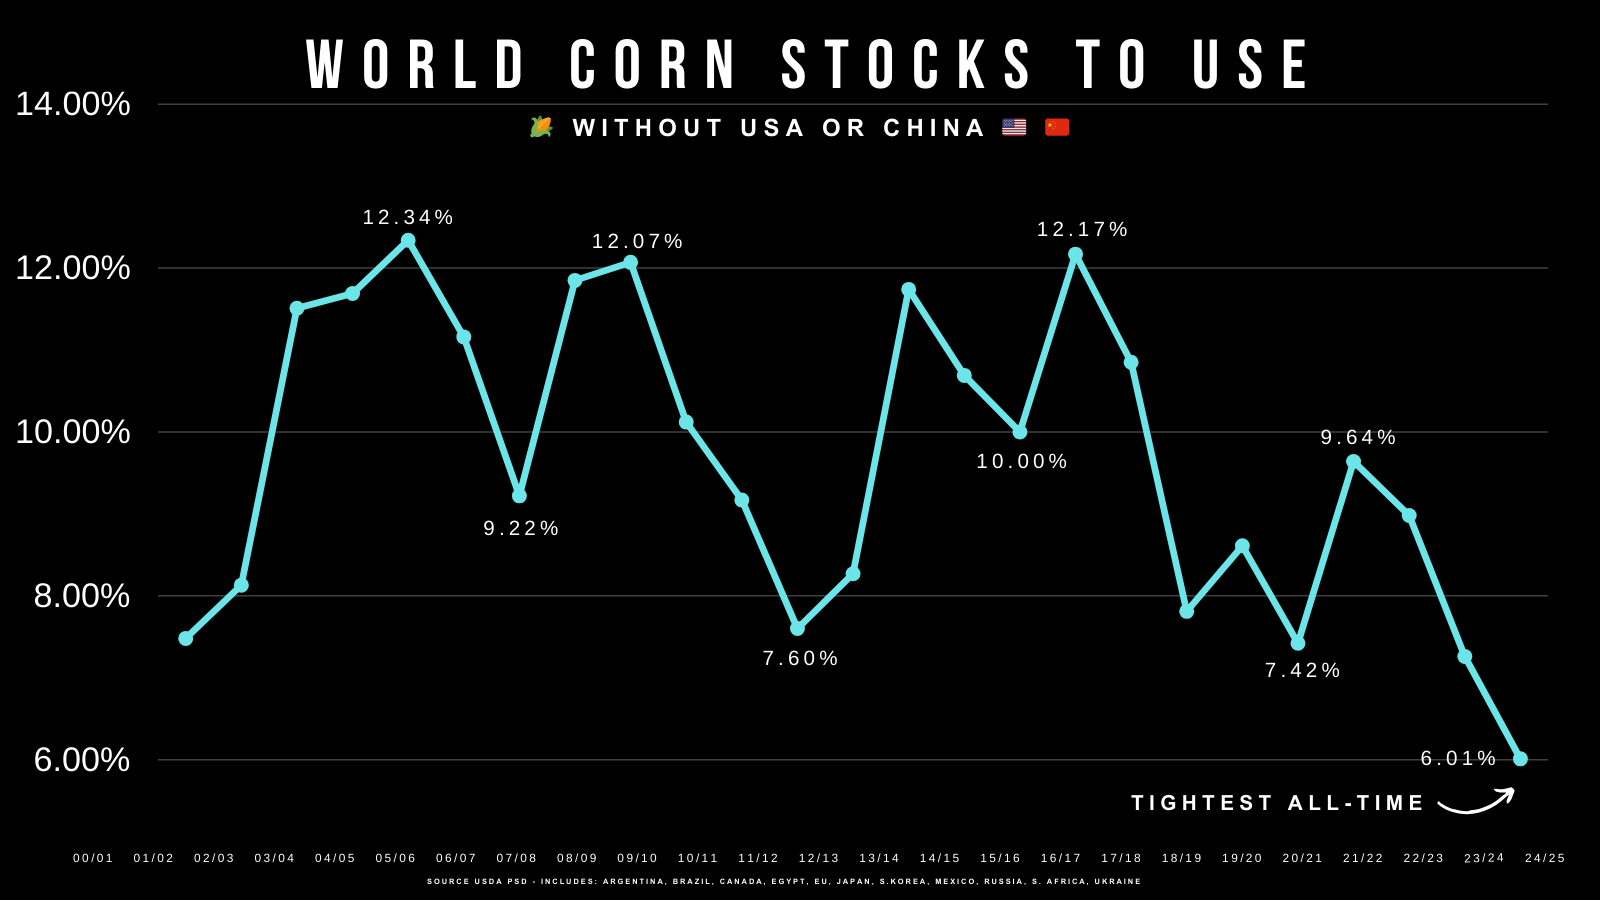
Here is a new chart I wanted to show you guys.
This is the world stocks to use ratio without China or the US.
It is the tightest ever by a sizeable margin.
The US and China are by far the leading producers of corn. So why does this chart matter?
It simply means that outside these two, the rest of the world's corn supply is the lowest it has ever been relative to demand.
Which means that the world situation can’t afford a hiccup here in the US.
No this does not matter if the US crop outperforms, but it it gives that much more importance to a weather scare.
Fundamentally I still see corn as undervalued here.
The global situation is the tightest in years.
The funds hit the exit door on tariff worries but I would like to think they'll be back to stick around and see how this growing season shapes before just going full short mode.
Because they too realize the world balance sheet cannot handle losses in the US crop.
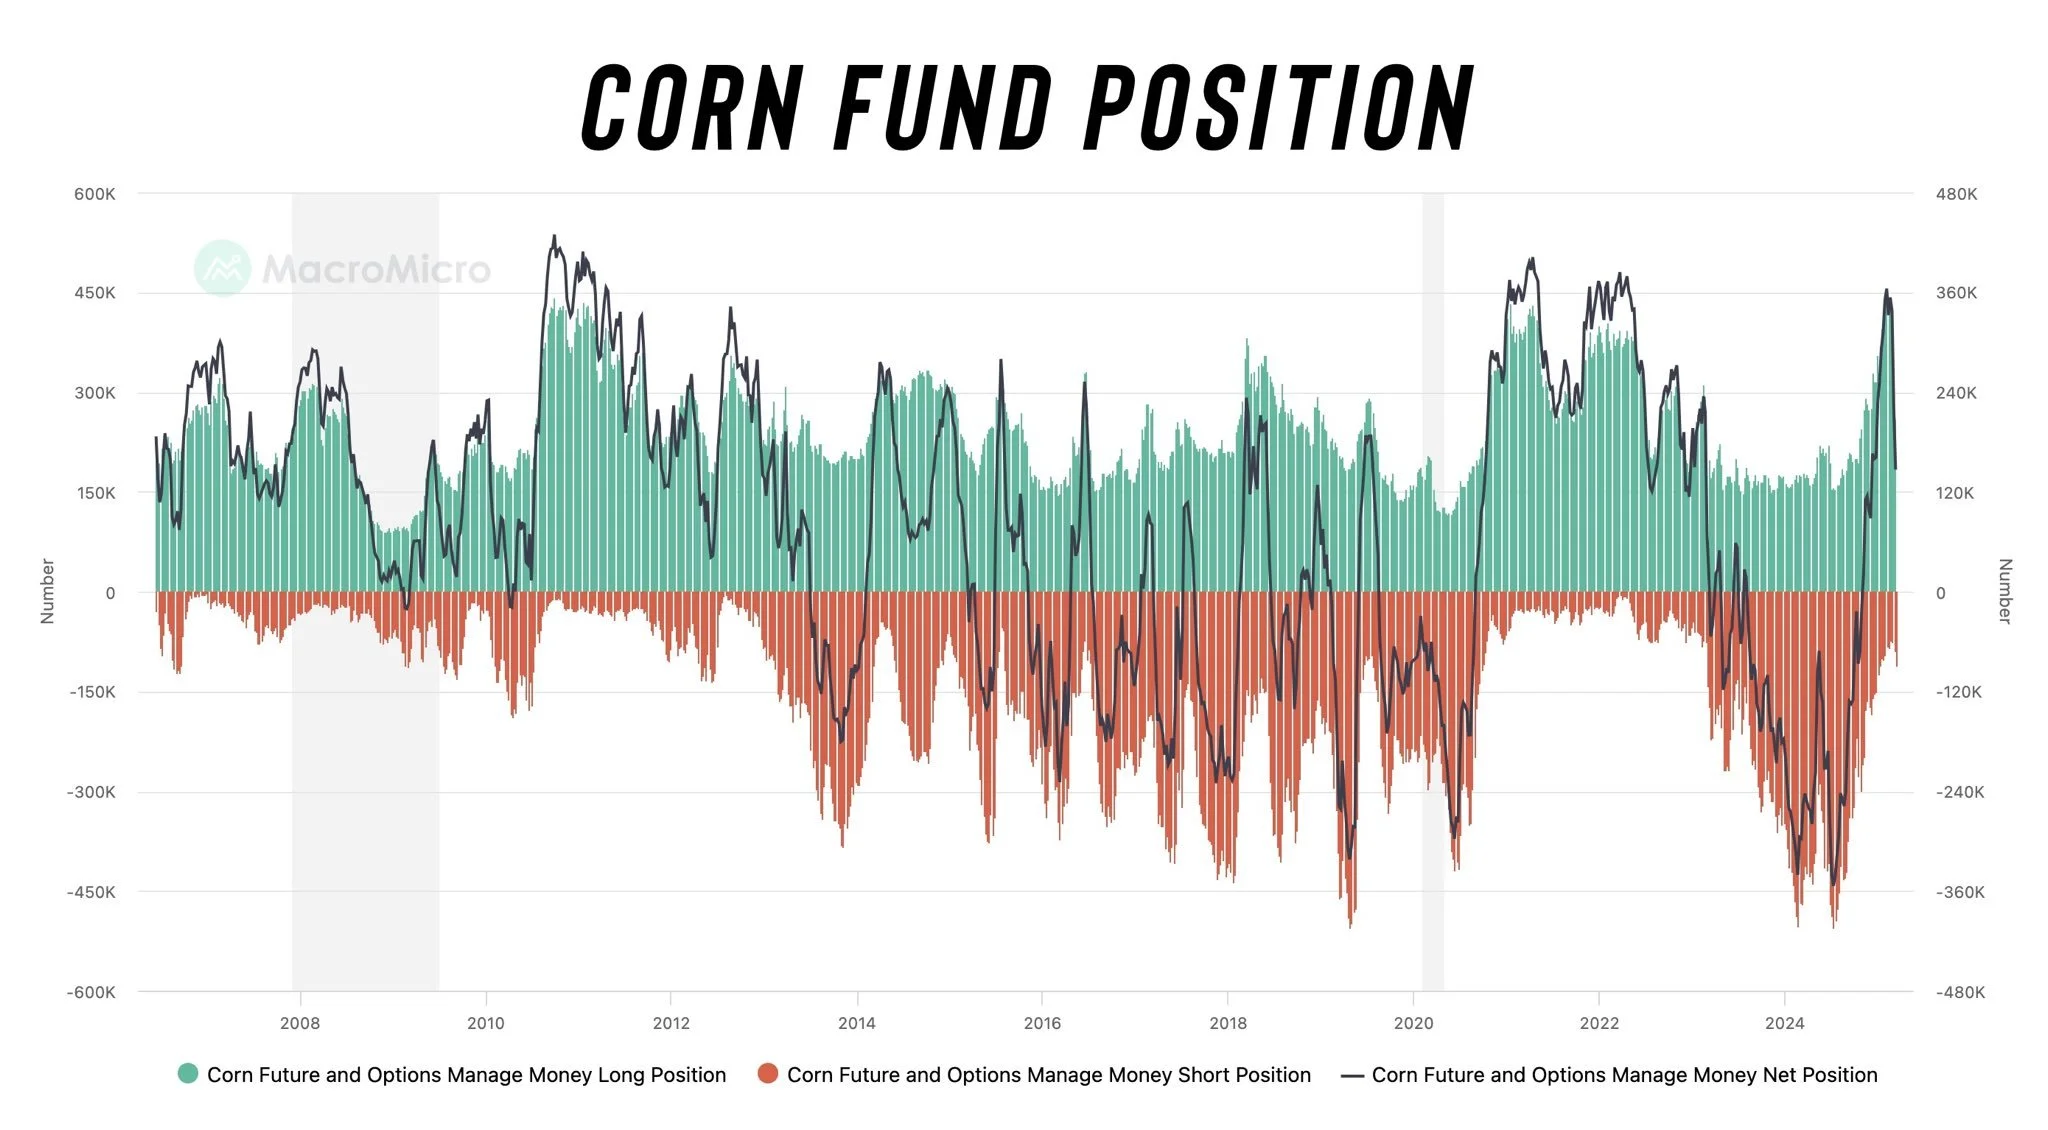
But the funds are selling, should I be worried?
I went ovet this last week, but for those still wondering:
Yes the funds have sold a massive amount of corn.
But let me break down the actual numbers for you.
Feb 4th
Long: 448k
Short: -84k
Net: 364k
Today
Long: 259k
Short: -112k
Net: 147k
Change
Long: -189k
Short -28k
Net: -217k
So they sold 200k long positions, but only added 30k shorts. Which means only 15% of the selling was actual new short positions.
So the funds are not getting "short" corn. They simply reduced their long exposure due to the tariff uncertainties.
Technicals: Was that the bottom in corn?
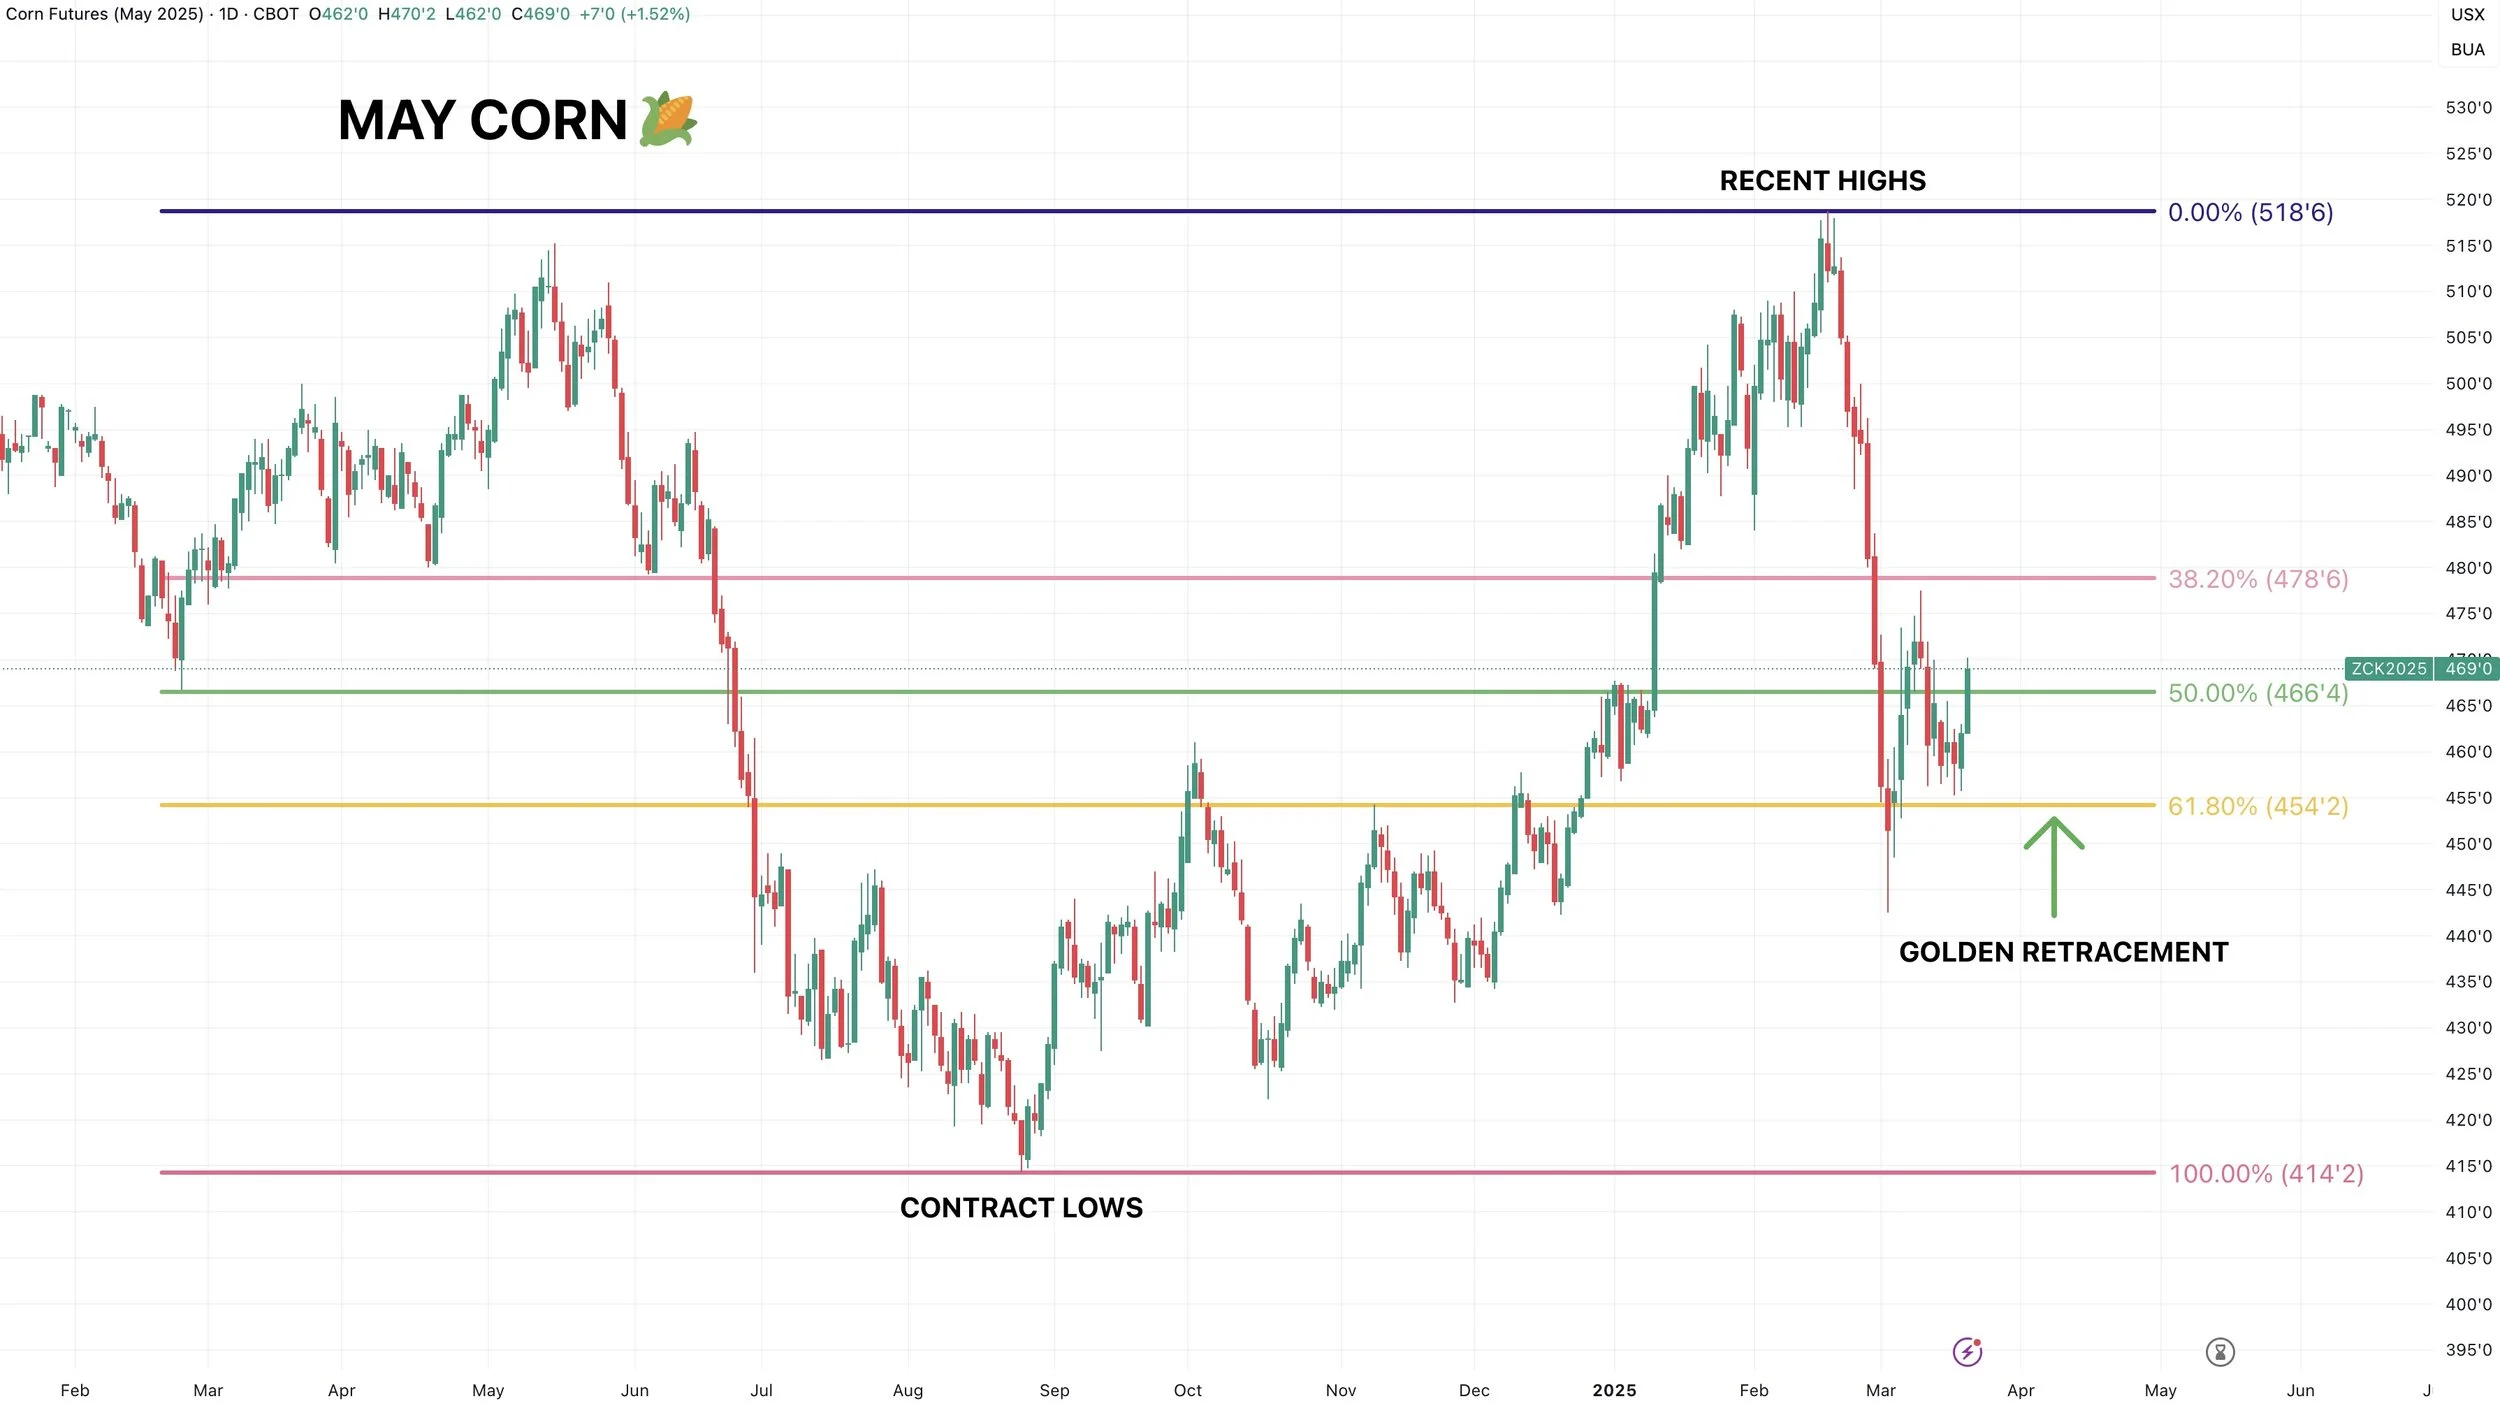
Two days ago I laid out exact reasons why I thought corn would hold this level. We are doing so thus far and have bounced nicely.
Here are those reasons again why I believe this is the bottom for corn.
I am going to break each reason down into a separate chart to help you visualize and understand my thought process.
61.8% is known as the "golden" retracement.
We have 2 instances of this that line up at the same time on the corn chart.
The 1st one:
61.8% of the entire rally from $4.14 to $5.14 brings us to $4.54 (big yellow line at the bottom of the red box)
The 2nd one:
61.8% of this recent mini rally after the tariff sell off is $4.56 (yellow line at the bottom of the small green box)
The 3rd reason:
Both of these golden retracements also line up with prior key resistance.
We rejected this exact level in October, November, and December. (circled in red)
Old resistance turns to new support.
The 4th reason:
Before December, corn had not closed above the 200-day MA since 2023.
That is how massive of a lid it had been.
We rejected in late 2023, then again on the May 2024 highs.
We finally broke above it, and resistance of that magnitude should turn into new support.
Here is what all 4 of those reasons look like put together.
Having this many reasons makes this a high area of interest to hold and why I "think" we will.
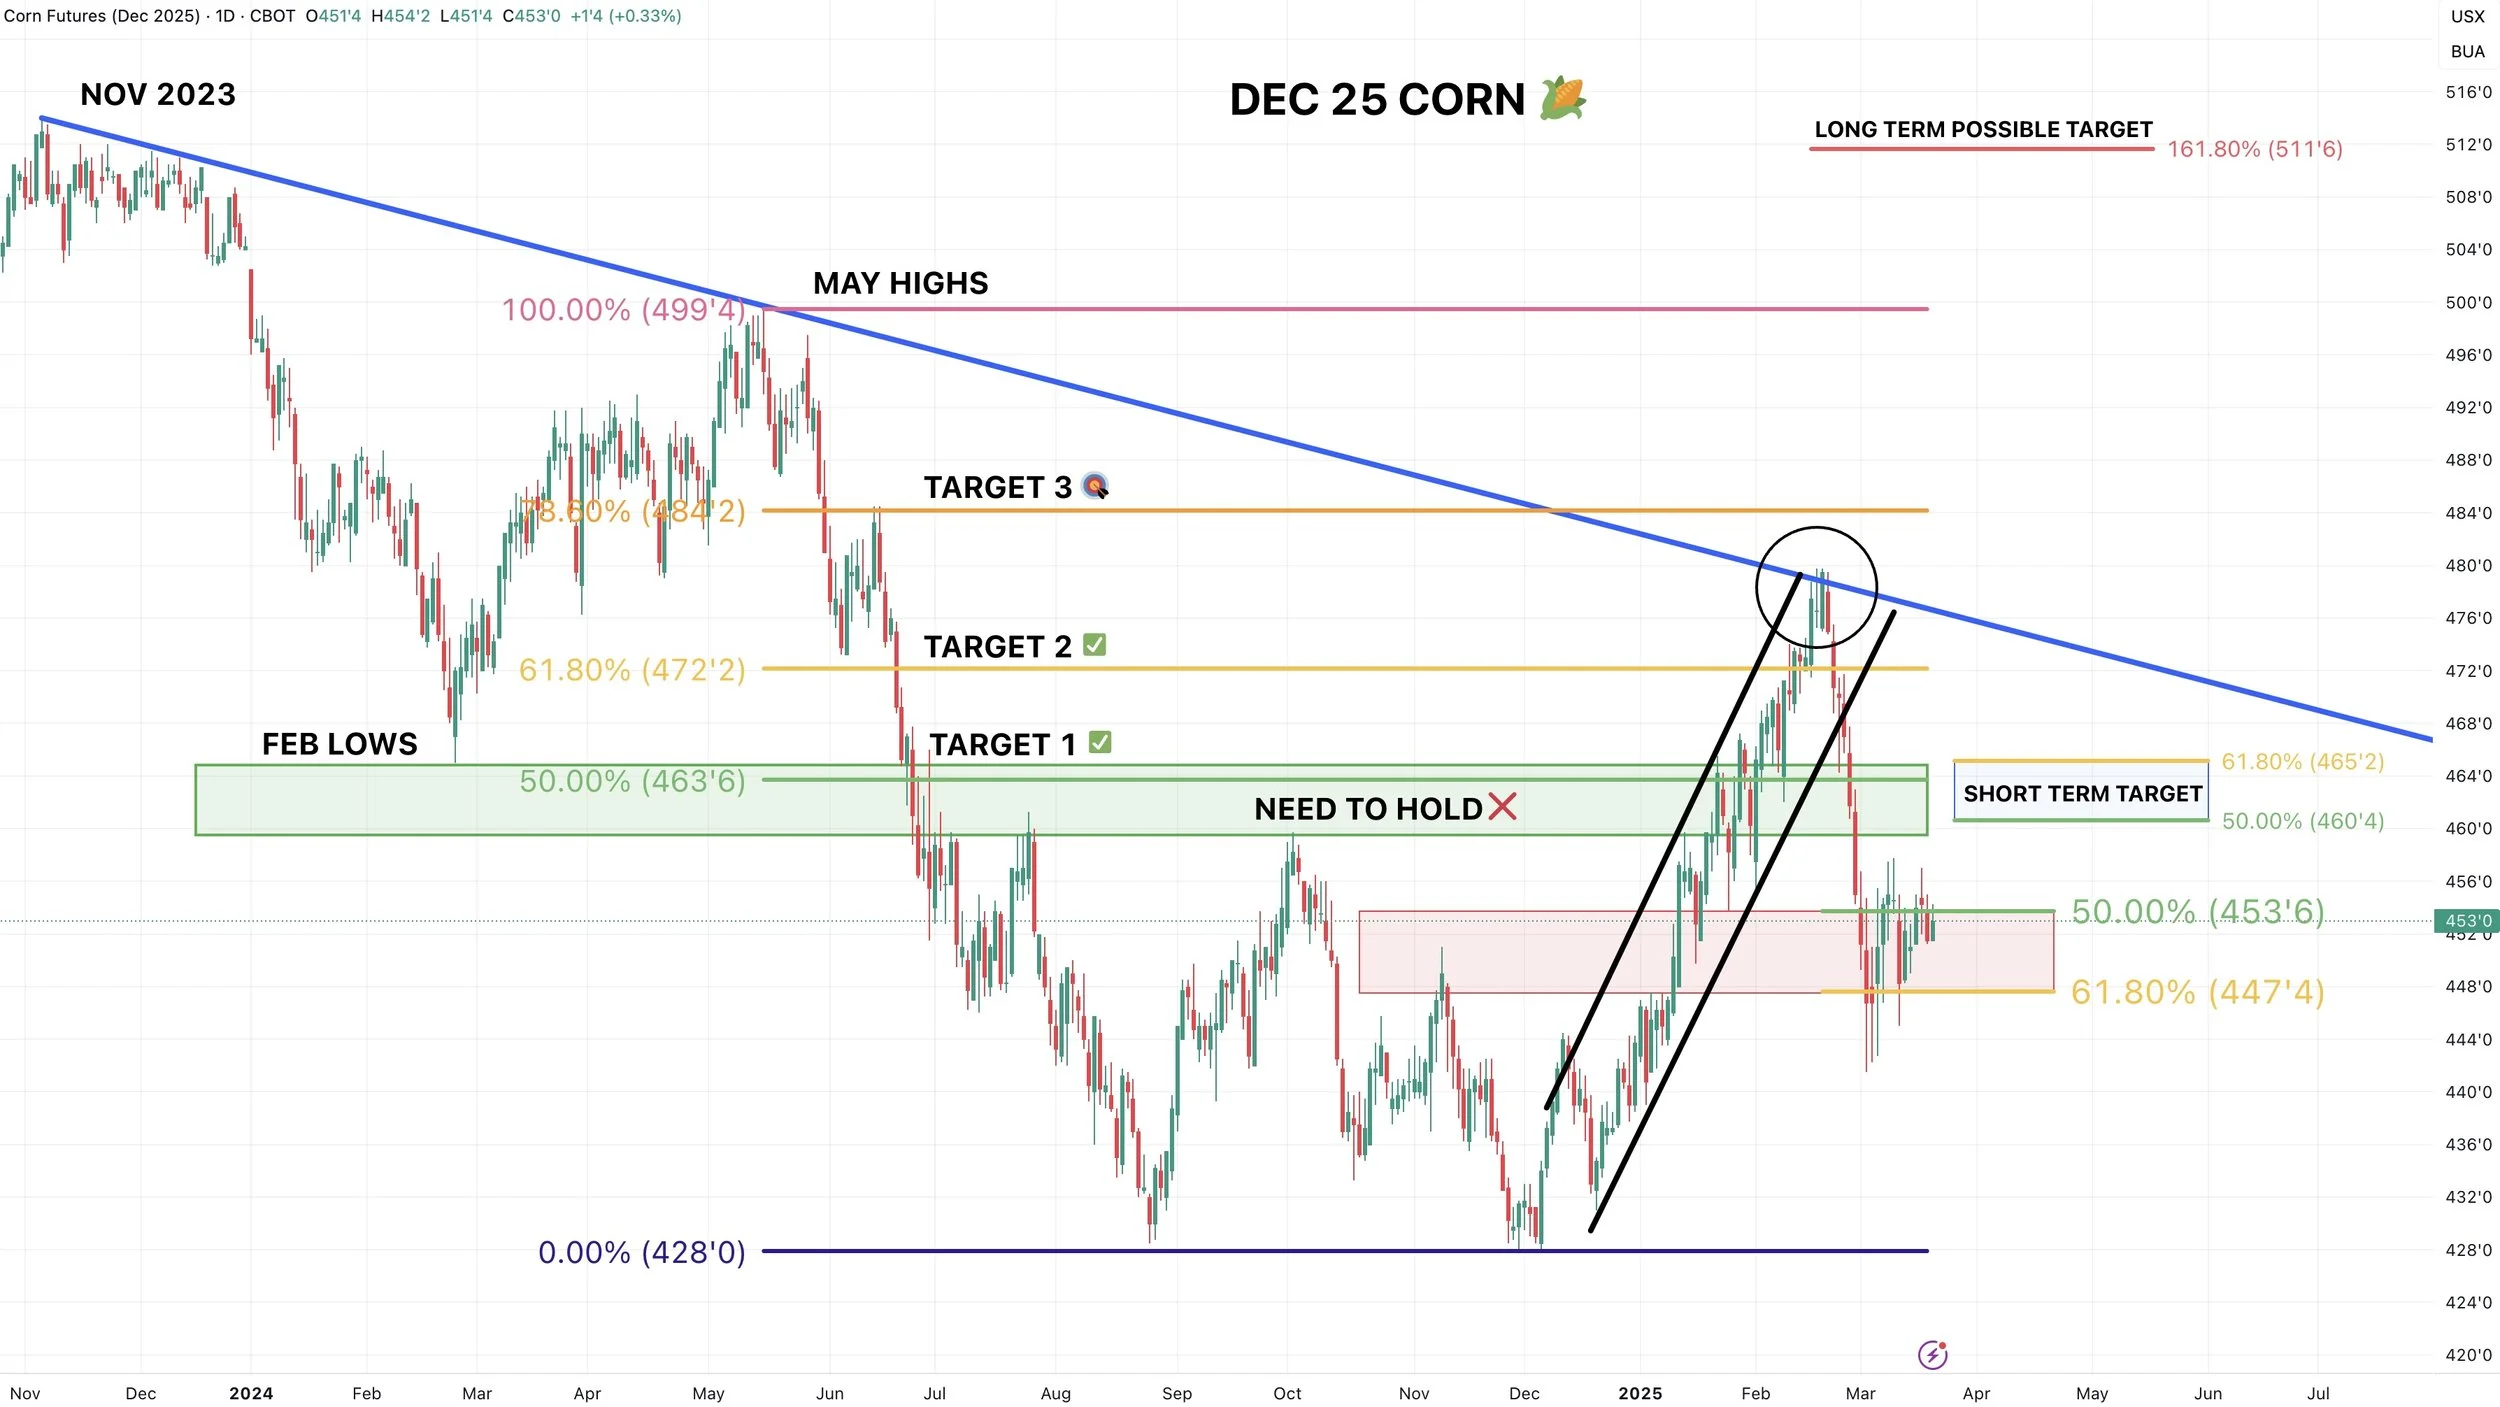
Dec corn also finding support at the golden retracement level.
Would like to think we hold this red box.
Next upside resistance is $4.60
Tha is the 50% retracement of the sell off as well as our highs from October.
Soybeans
Fundamentals:
Nothing to update. The world story isn’t friendly but we have already endured every known bearish factor.
The only unknown bearish factor is the trade war.
Aside from that, less acres in the US could lead to the new crop balance sheet tightening up if we don’t get some amazing growing season. I think this could provide us some opportunities.
Technicals:
Nothing has changed on the bean chart.
Bulls number 1 objective is to close above the 100-day MA. If we can do that, you could say we have put in a bottom.
Until we do that, we need to hold this key support.
Just like in corn, this key support we have held several times in the past also happens to be the 61.8% retracement from the recent highs down to the contract lows.
Again, this is known as the golden retracement. The most common level to retrace to.
So both the support level and retracement level lining up lead me to believe soybeans hold this level. But you never know.
Looking to the upside, we still have a potential inverse & shoulders pattern which is bullish as long as we hold this support level.
If we break above the 100-day MA, then our next resistance will be the 200-day MA. That is where we rejected on the recent highs.
Once you clear the 200-day it gives you the go ahead that the trend is shifting higher. So that would be a good indication of higher prices.
(Refer back to the corn chart, it is a good example of this)
My big picture target right now is $11.29 to $11.37
That is the 61.8% retracement up to the May 2024 highs. It is also our lows from February 2024. (green box)
Same set up in Nov beans.
That possible target is $11.11 to $11.17
Like May beans, it is 61.8% of the May highs and our Feb 2024 lows. (green box)
Wheat
Fundamentals:
It's impossible for me to be bearish wheat at these levels.
We have a very tight global situation relative to past years.
Russia's grain exports for February were down over -50% year or year.
The funds hold a massive short position in KC wheat.
I continue to believe wheat is underavlued.
Technicals:
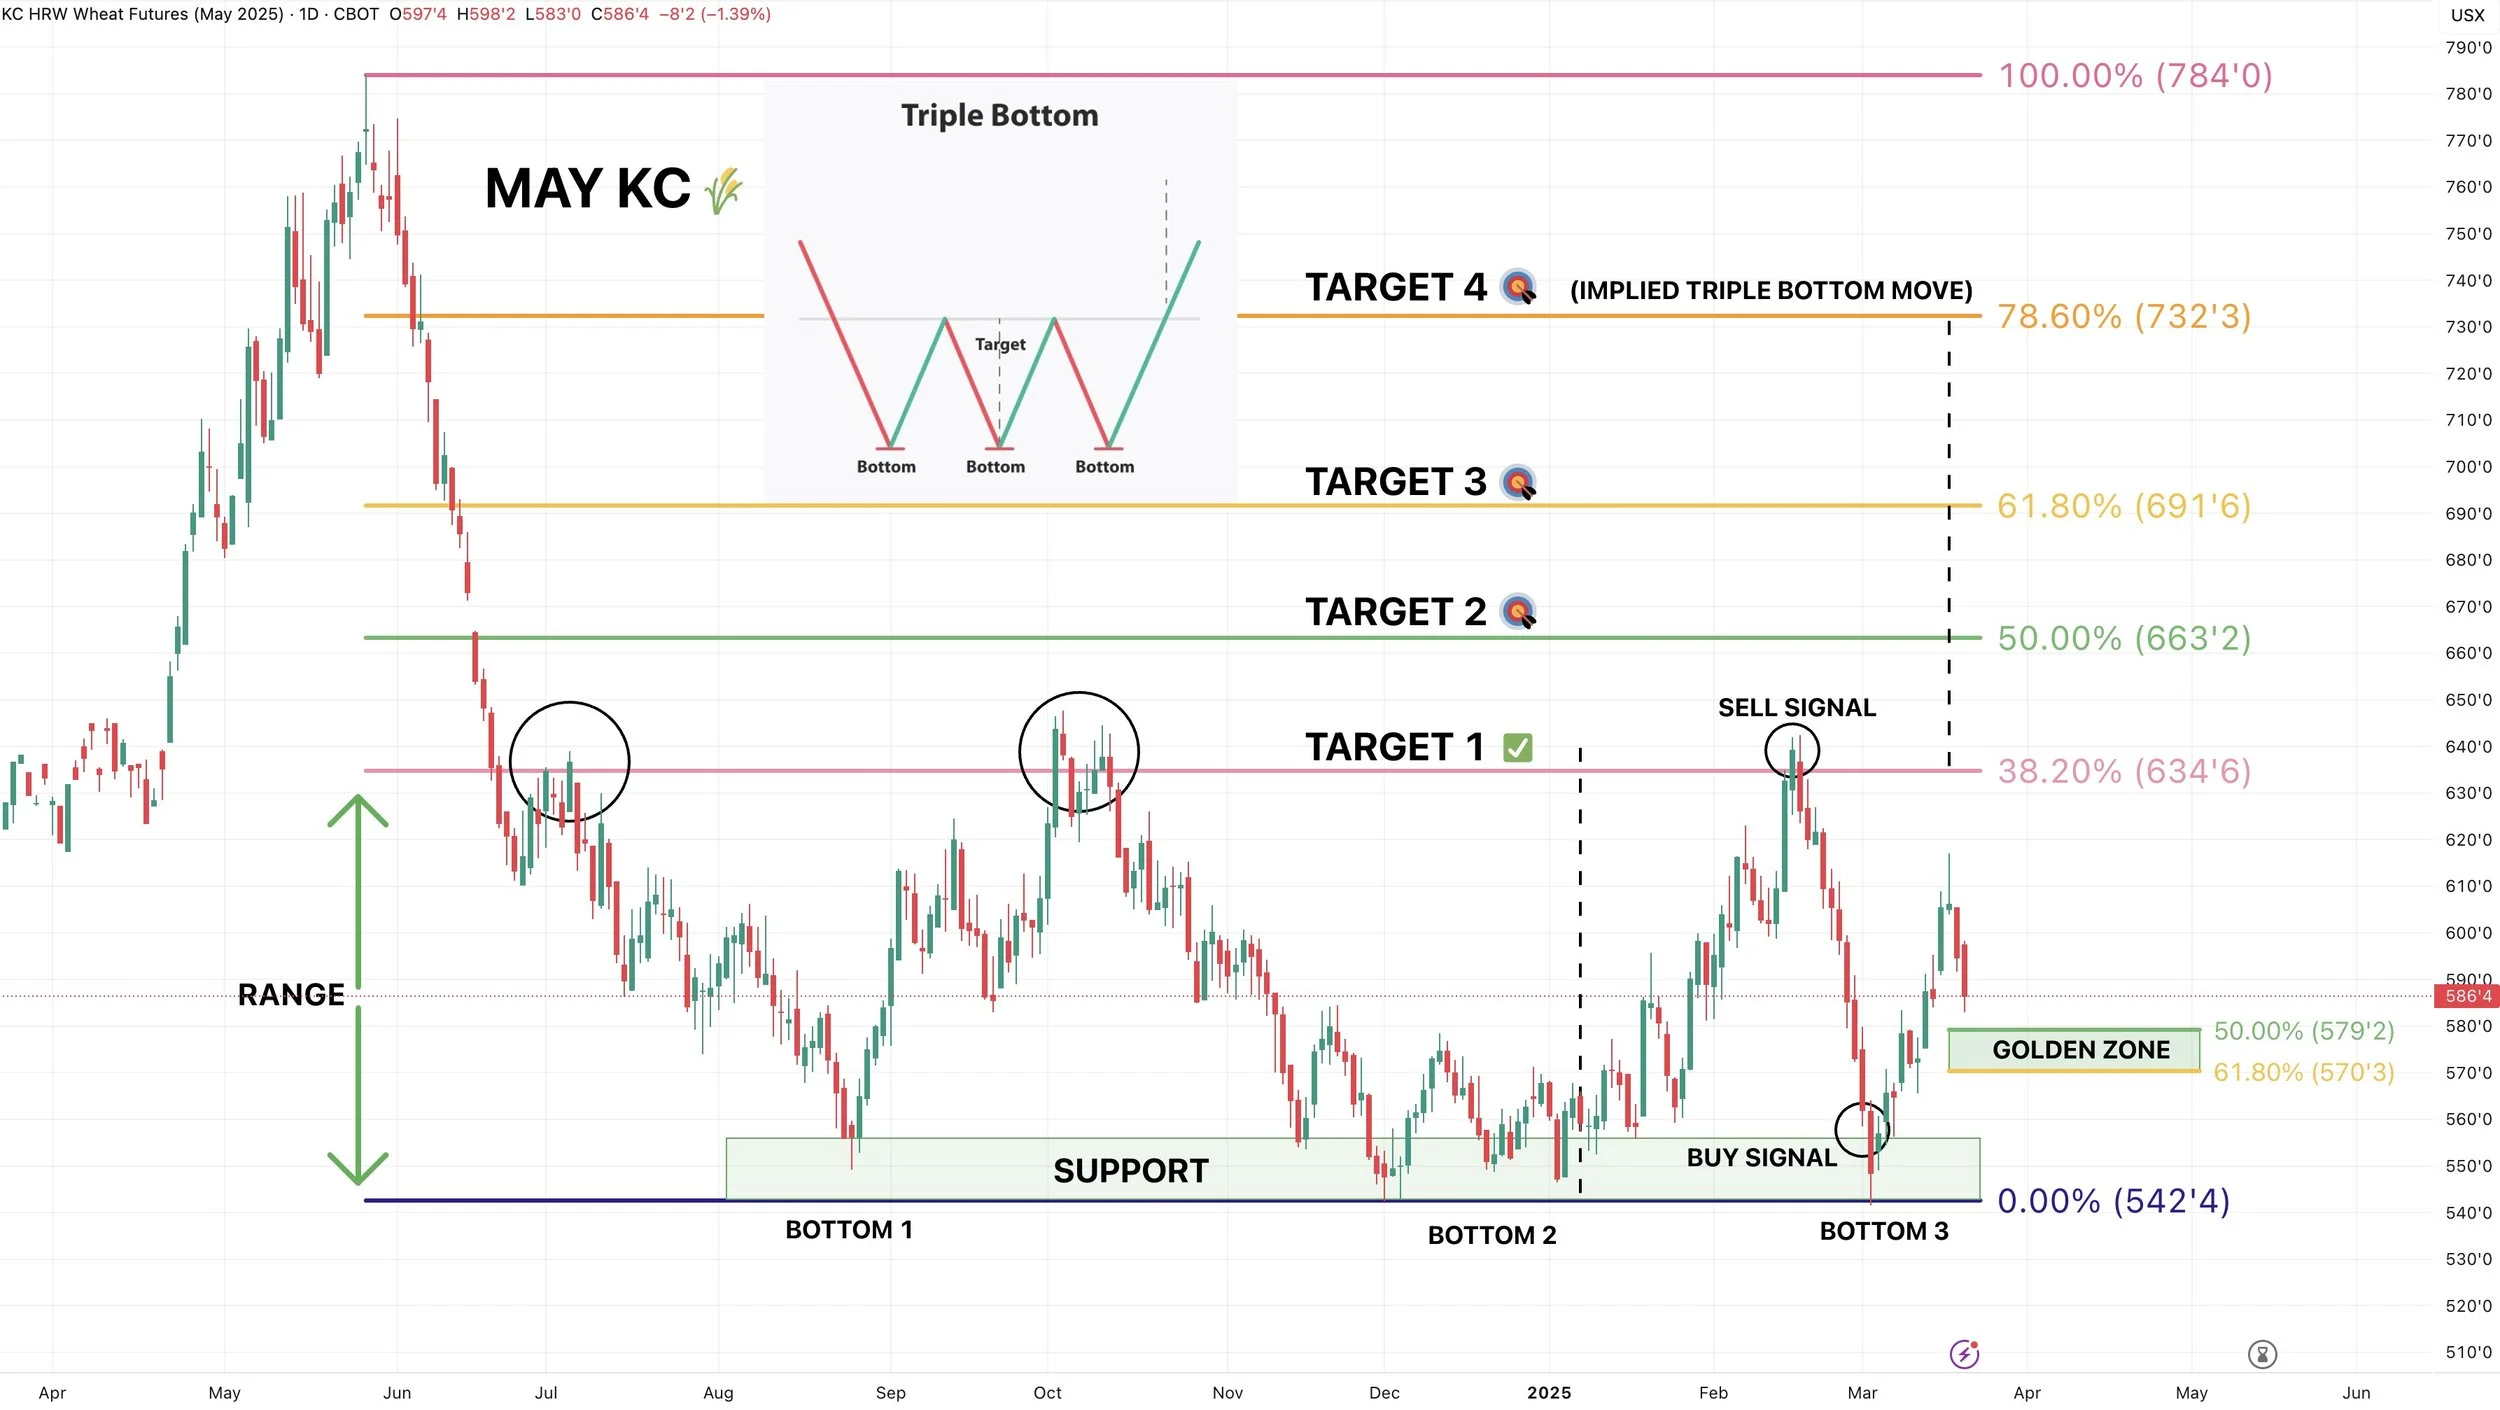
Short term I looking for a bounce in the golden zone of this recent rally. $5.70 to $5.79
To the upside, I have each target laid out.
$6.35 is our next retracement level. That is also where we topped out in October and on the recent rally.
Then you have $6.63 then $6.91 then $7.32
How I would approach this is simply taking a little risk off at each spot.
That $7.32 target also lines up with the implied move from this triple bottom pattern we created. A break above those recent highs would confirm this.
May wheat simply trapped in this channel.
Next objective is another test of the top of the channel.
A lot of times it will make sense to simply take risk off the table in any wheat market (Chicago, KC, or MPLS) when we hit targets on one but not the other.
For example, if we hit a target in KC. It is a green light to de-risk in Chicago as well. As they move in dandem for the most part.
Past Sell or Protection Signals
We recently incorporated these. Here are our past signals.
Feb 18th: 🌽 🌾
Old crop KC wheat & old crop corn signal.
Jan 23rd: 🌽 🌱
Corn & beans old crop sell signal.
CLICK HERE TO VIEW
Jan 15th: 🌽 🌱
Corn & beans hedge alert/sell signal.
Jan 2nd: 🐮
Cattle hedge alert at new all-time highs & target.
Dec 11th: 🌽
Corn sell signal at $4.51 200-day MA
CLICK HERE TO VIEW
Oct 2nd: 🌾
Wheat sell signal at $6.12 target
Sep 30th: 🌽
Corn protection signal at $4.23-26
Sep 27th: 🌱
Soybean sell & protection signal at $10.65
Sep 13th: 🌾
Wheat sell signal at $5.98
May 22nd: 🌾
Wheat sell signal when wheat traded +$7.00
Want to Talk?
Our phones are open 24/7 for you guys if you ever need anything or want to discuss your operation.
Hedge Account
Interested in a hedge account? Use the link below to set up an account or shoot Jeremey a call at (605)295-3100.
Check Out Past Updates
3/19/25
THE PATH HIGHER & THE DOWNSIDE RISKS IN GRAINS
3/19/25
CATTLE ALERT
3/18/25
SEASONALS, CATTLE HEDGE, CHARTS & DROUGHT?
3/17/25
WHEAT RALLIES. DON’T GET BACKED INTO A CORNER
3/14/25
MARCH 31ST REPORT THOUGHTS & WHAT’S NEXT FOR GRAINS
3/13/25
EXPLAINING RE-OWNERSHIP VS COURAGE CALLS
3/12/25
TARIFF FEARS. EU, CANADA, & ETHANOL
3/11/25
USDA SNOOZE. RECORD FUND SELLING A CONCERN?
3/10/25
USDA TOMORROW. GETTING COMFORTABLE IN MARKETING
3/7/25
HOW TIGHT IS THE WORLD & US SITUATION?
3/6/25
TARIFFS PUSHED BACK. FUTURE OPPORTUNITIES?
3/5/25
IS GRAINS BIGGEST RISK WEAK CRUDE & DEFLATION?
3/4/25
TRADE WAR BEGINS. 8TH DAY OF PAIN FOR GRAINS
3/3/25
TARIFFS ON TOMORROW. BUY SIGNAL
3/3/25
BUY SIGNAL
2/28/25
WHEN WILL THE BLEEDING STOP?
2/27/25
CORN AT CRITICAL SPOT. USDA ACRE REPORT. WAY TOO EARLY DROUGHT TALK
2/26/25
HISTORY SUGGESTS CORN TOP ISN’T IN? ACRE OUTLOOK TOMORROW
2/25/25
POSITIVE CLOSE. WHAT TO KNOW ABOUT USDA OUTLOOK
2/24/25
USDA OUTLOOK, FIRST NOTICE DAY & BRAZIL
2/21/25
WHAT TO EXPECT MOVING FORWARD IN GRAINS
2/20/25
FIRST NOTICE DAY CONCERNS. MASSIVE CORN ACRES OR NOT?
2/19/25
HOW TIGHT IS THE CORN SITUATION?
2/18/25
MORE DETAILS ON TODAYS SELL SIGNAL
2/18/25
OLD CROP KC WHEAT & CORN SELL SIGNAL
2/14/25
WHEAT BREAKING OUT ON WEATHER RISK. TECHNICALS & FUNDAMENTALS
2/12/25

