
STRONG JANUARY LEAD TO STRONG YEAR? TARIFFS, CHARTS & MORE
MARKET UPDATE
Want every daily update & our next sell signal?
Try 30 Days Free: CLICK HERE
Don’t miss the next opportunity.
You can scroll to read the usual update as well. As the written version is the exact same as the video.
Timestamps for video:
Tariffs & Overview: 0:00min
Strong Jan Lead to Strong Year?: 3:00min
Stocks to Use vs Prices: 5:37min
Corn: 6:44min
Beans: 9:43min
Wheat: 11:58min
Want to talk or put together a market plan?
(605)295-3100
Futures Prices Close

Overview
Grains rally back to back days to start February.
Over the weekend we had all of the tariff news. This led to grains gapping lower Friday and Monday.
Since Monday morning, we have rallied and closed both of those gaps.
Wheat posted a new high for the year while both corn & soybeans are flirting with theirs as well.
Off the Sunday Overnight Lows:
Corn: +22 cents
Beans: +43 cents
Wheat: +26 cents
Yesterday it was then announced that both Mexico and Canada tariffs were both going to be delayed by 30 days. As they gave into Trumps demands.
Basically, they agreed to make their borders more secure. As this was the only way Trump was not going to go ahead with the 25% tariffs on both.
Mexico agreed to send 10k guards to their border and Canada agreed to spend $1.3 billion to strengthen their border. Trump wants to stop fentanyl from crossing the borders and illegal immegration.
Mexico really had no other choice, as their economy isn’t in great shape as it has shrank for the first time in 3 years. So they really do not want a trade war.

Canada tariffs do not really affect the grain market prices, but we do import a lot of fertilizer and export a lot of ethanol to Canada.
What tariffs are still out there?
There is now 2. China and the EU.
First the EU, Trump said he still plans to tariff them within the next 14 days.
We still have tariffs on for China at the moment.
China actually announced a retaliation tariff on the US. Imposing 10-15% on US energy as well as agricultural tools.
Soybeans were not mentioned in this. This was a pretty minimal retaliation from China.
A call between Trump and China's President to negotiate was suppose to happen today but got canceled.
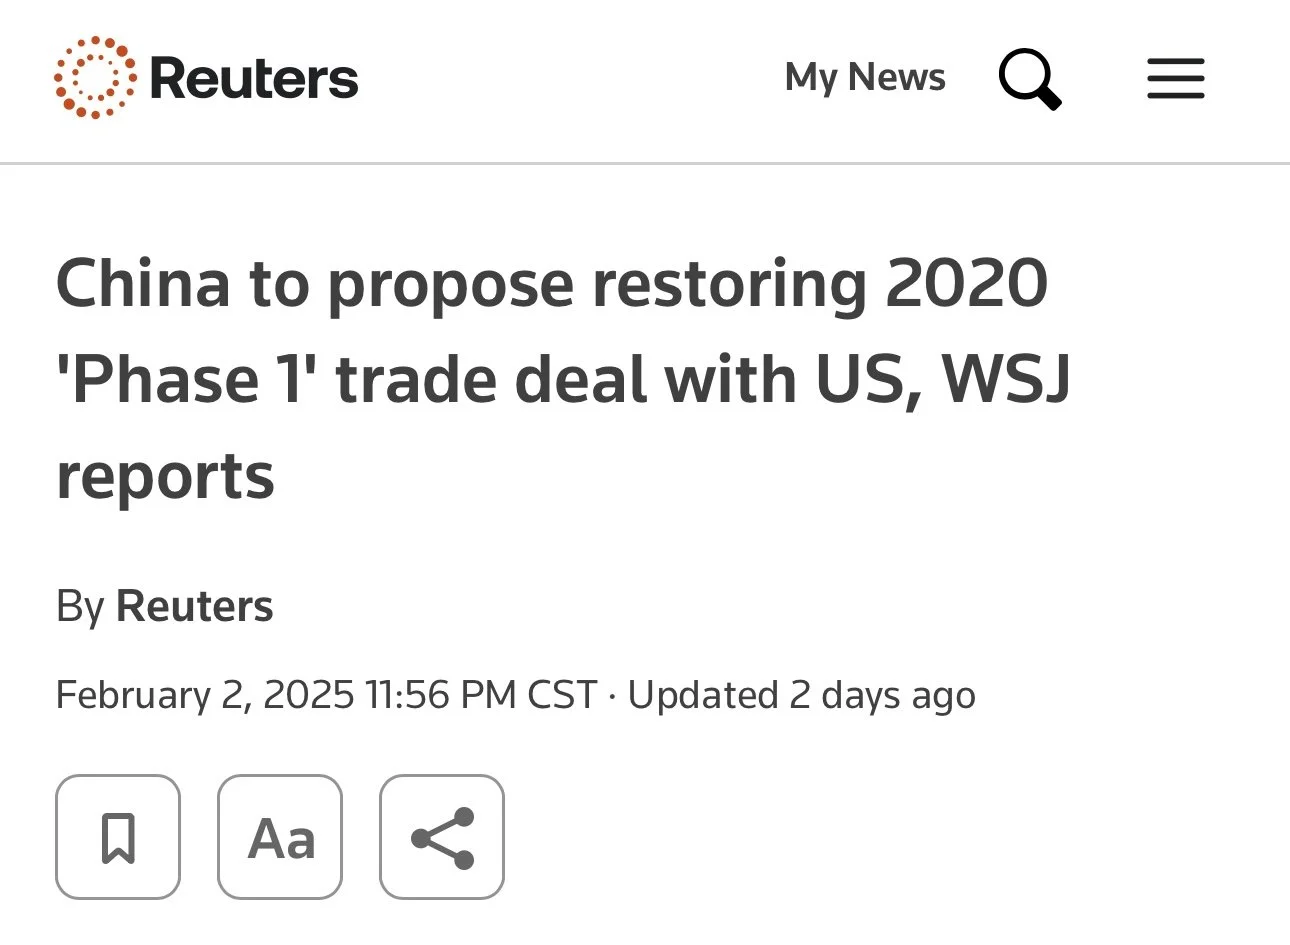
There have been news reports that China is going to propse the "Phase 1" trade agreement from back in 2020.
The Phase 1 deal is what ended the 2 year long trade war last go around.
This would be a very friendly factor if it happens. We all know what happened last time after the trade agreement at the end of 2020.
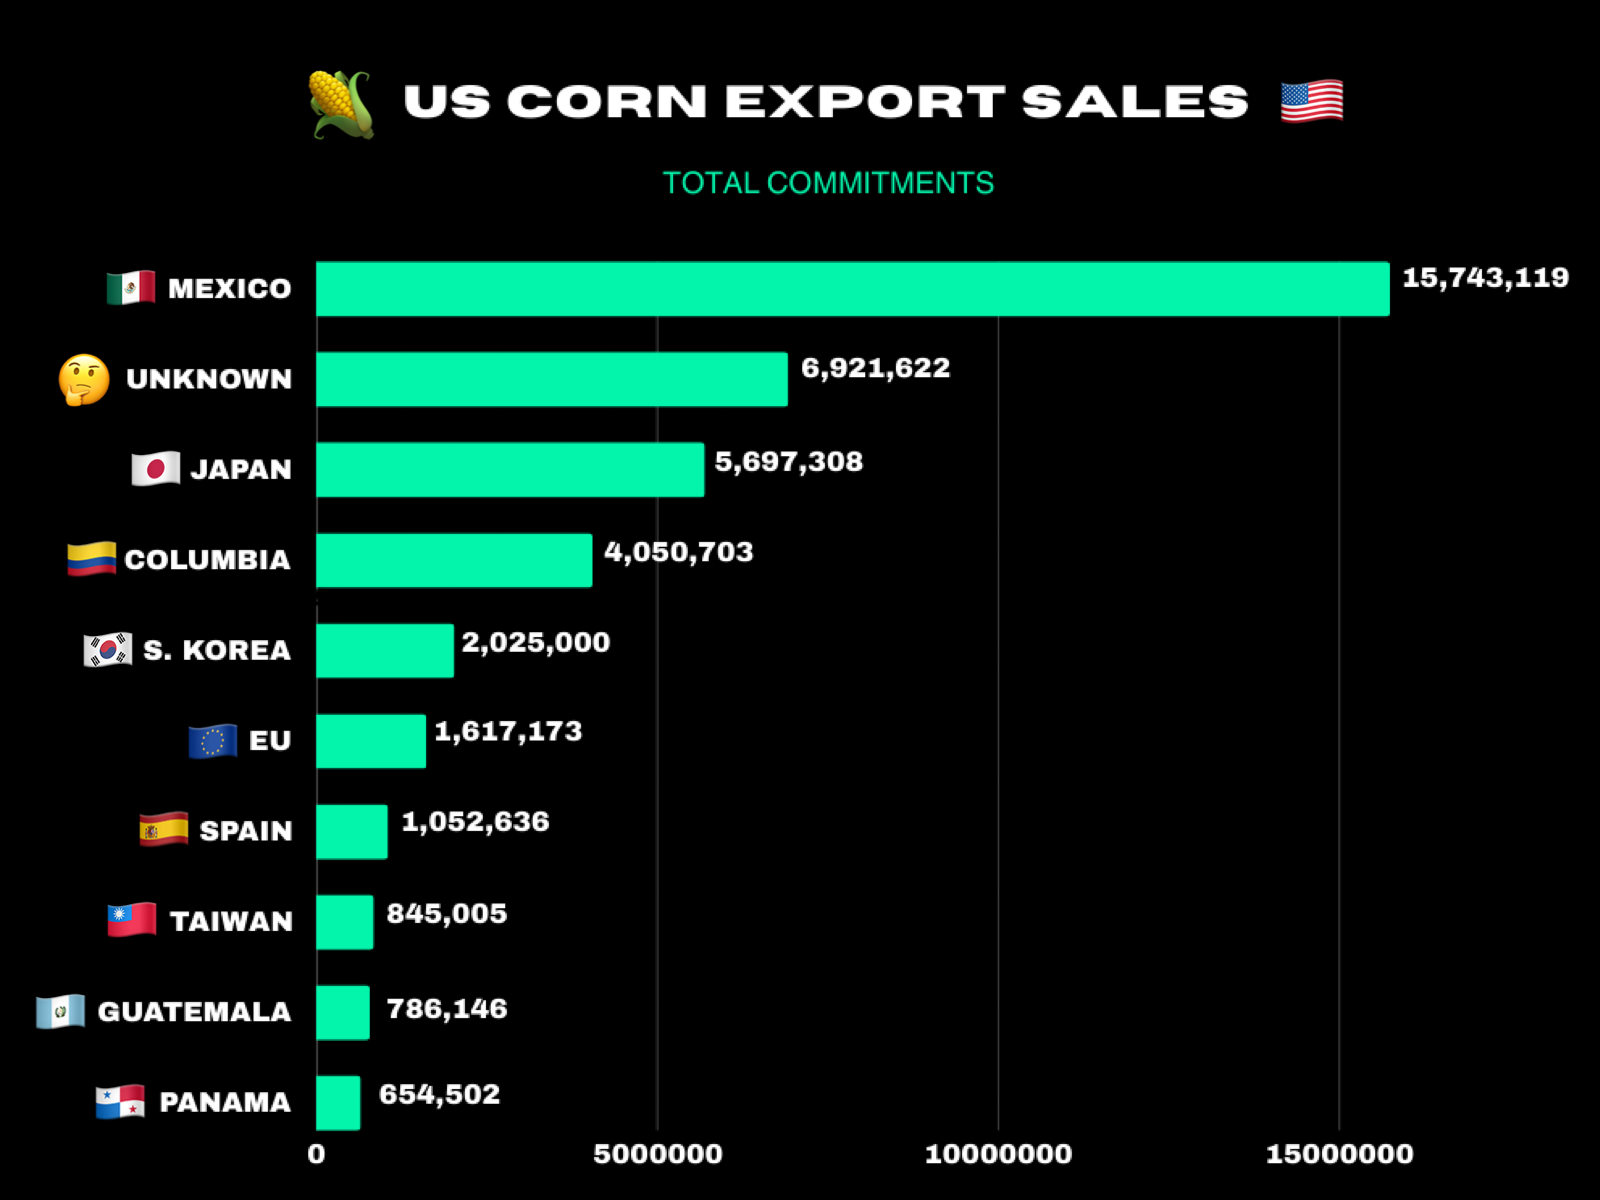
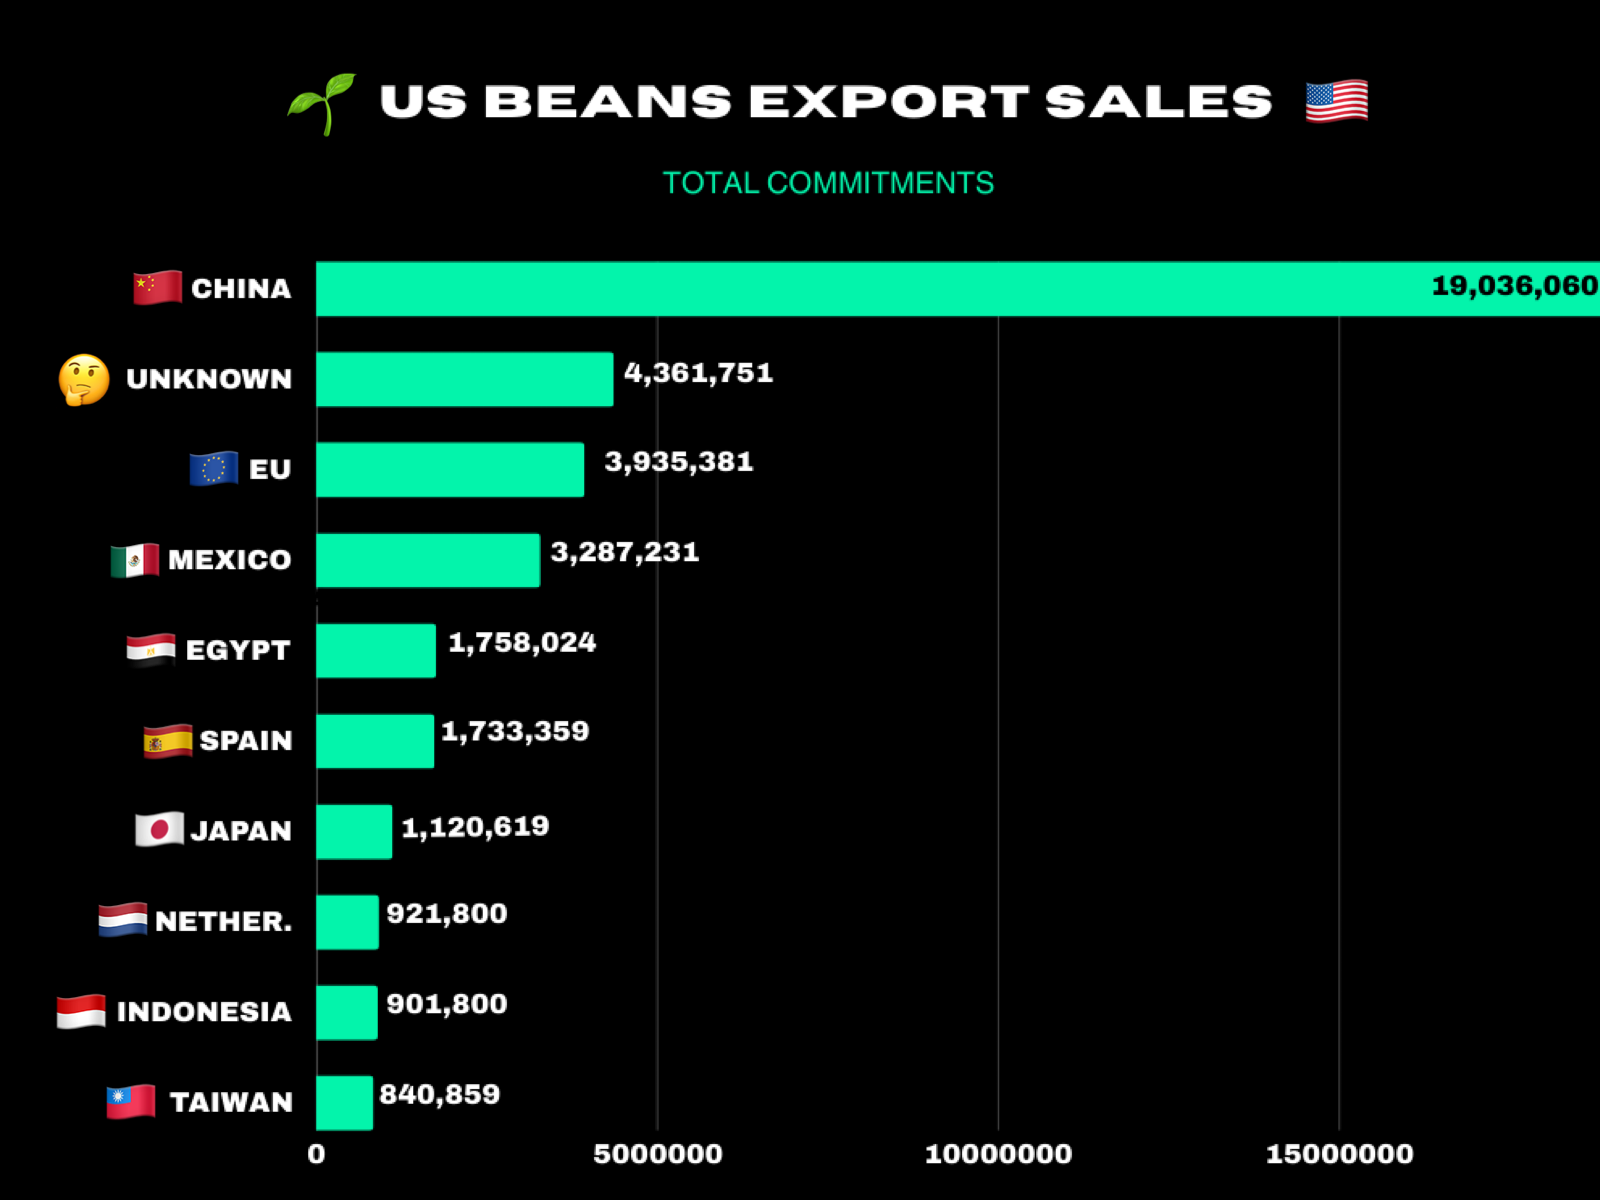
Tariff Countries vs Exports
Here is how all of these countries stack up for US exports.
Mexico is the #1 US corn buyer. So these tariffs would of course affect the corn market the most. They have bought 40% of all US exports.
China is the #1 US soybean buyer. So China tariffs would affect the bean market the most. They have bought 47% of all US exports.
The EU is a top 5 buyer of both corn and beans. So this would about equally effect corn & beans. But not nearly to the extent of Mexico or China.
Then Canada is not even a top 10 buyer of corn or beans. Hence why this does not affect the markets a ton.
Does a strong January historically lead to a strong year?
For corn, 2025 was the 5th strongest January since 2008. (Based on % gain)
Here is the top 6 strongest January's and the only years where we saw over a 4% gain for the month.
#1: 2021 (+63 cents) (+13%)
#2: 2008 (+46 cents) (+10%)
#3: 2013: (+42 cents) (+6%)
#4: 2022: (+33 cents) (+5.5%)
#5: 2025: (+23 1/2 cents) (5.15%)
#6: 2011 (+30 1/2 cents) (+4.85%)
(2016 is the next closest at just +13 cents or 3.7%)
Now here is a chart that shows all of these years.
Every year aside from 2013 did indeed result in higher prices later in the year.

Now here is when each of those years topped out and how much they rallied after Feb 1st.
2021:
Price Feb 1st: $5.47
Year High: May 7th at $7.32
Price Rally: $1.85
2008:
Price Feb 1st: $5.01
Year High: June 30th at $7.73
Price Rally: $2.73
2013:
Price Feb 1st: $7.46
Year High: Feb 1st at $7.46
Prices did not rally as the high was made Feb 1st
2022:
Price Feb 1st: $6.26
Year High: April 29th at $8.24
Price Rally: $1.98
2011:
Price Feb 1st: $6.59
Year High: June 11th at $8.00
Price Rally: $1.41
Bottom line, yes historically a strong January does lead to a relatively strong year. This does not mean we have to have a strong year, but this is what history tells us.
Corn is very close to putting in a new high, there is only 1 year in the entire history of the corn market where we made our yearly highs in February. That is 2013.
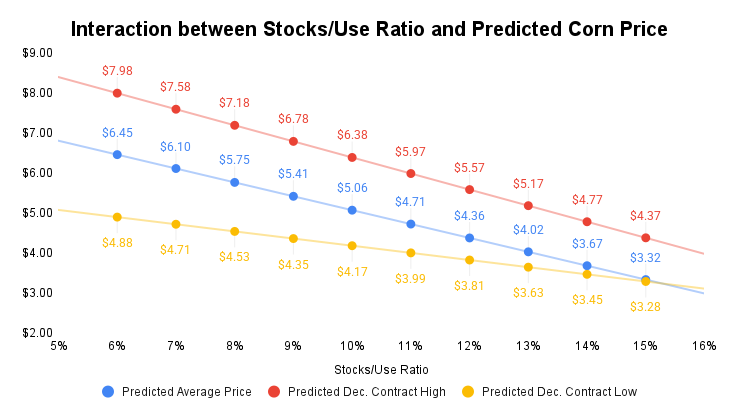
Stock to Use Ratio vs Price
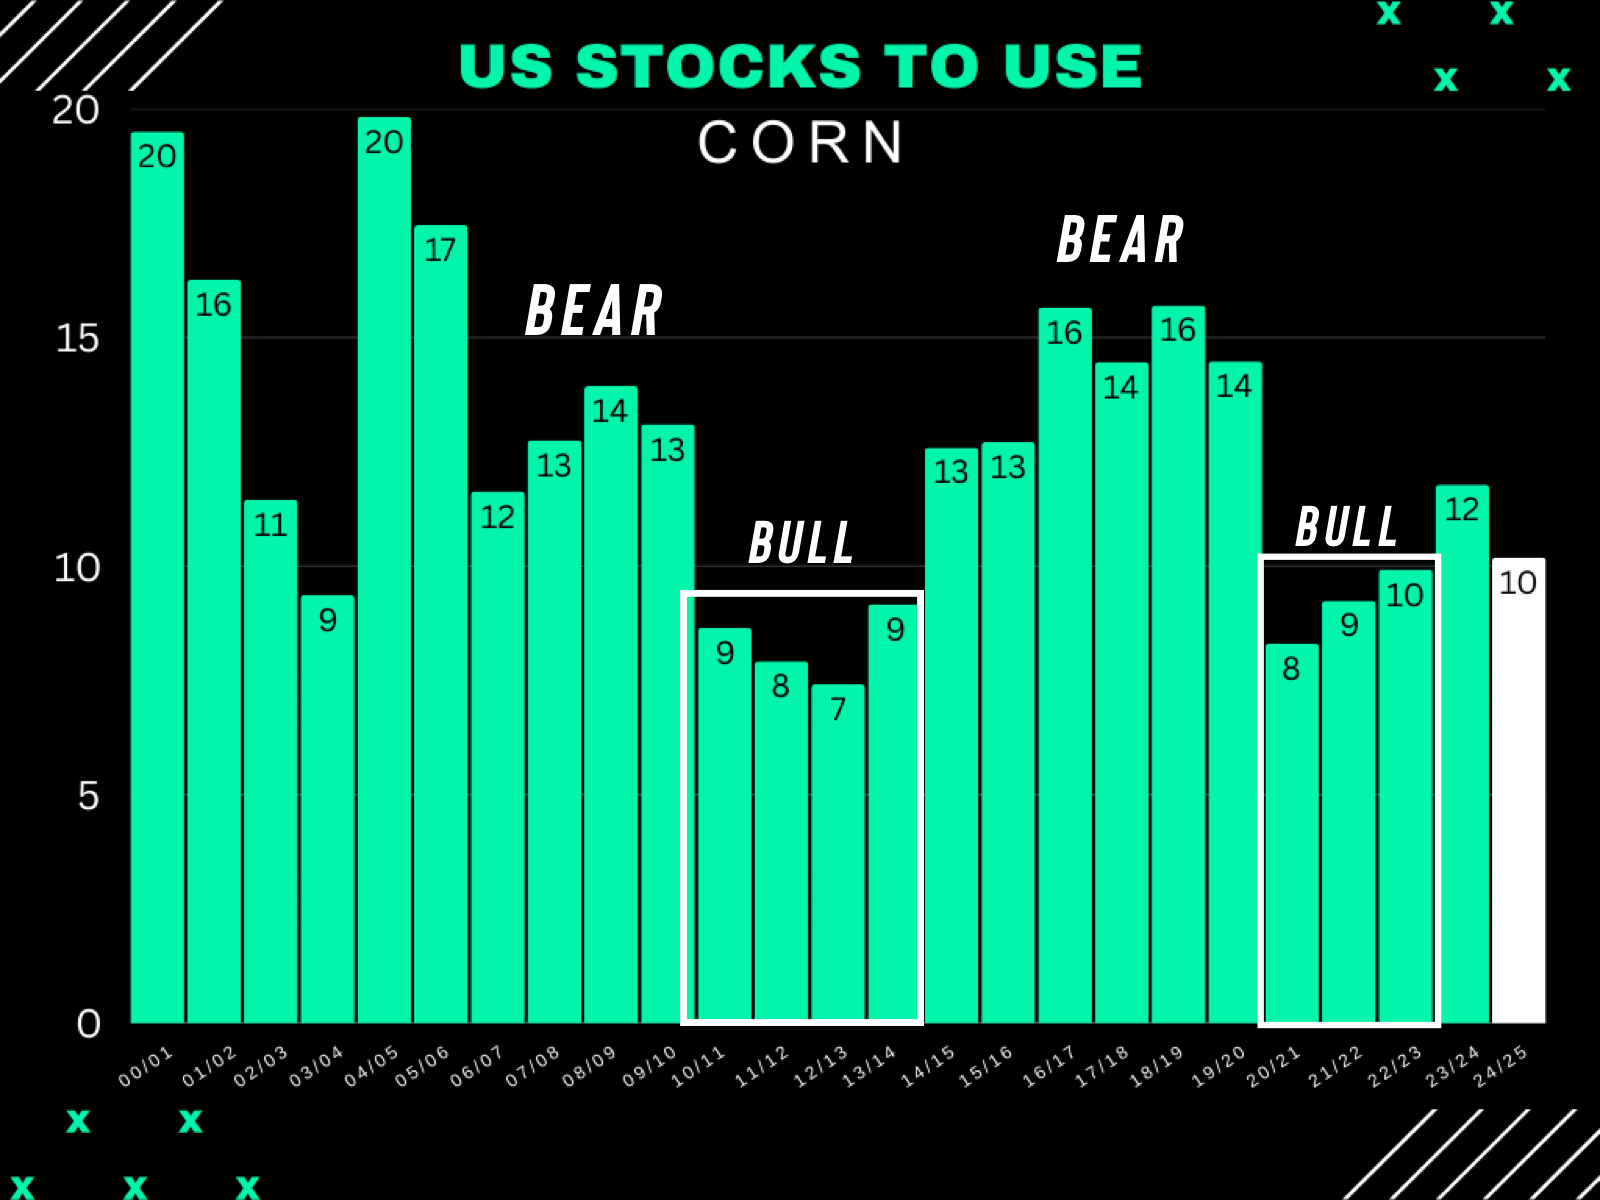
Here is a fantastic chart from Brady out of Kansas. (@BradyD78 on X)
It just shows how corn prices interact vs the stocks to use ratio.
The higher the stocks to use, the tighter the price variable from the highs and lows will be.
The smaller the ratio, the wider our price range from the highs and lows will be.
For example our stocks to use ratio is 10.19%
Let's say our stocks to use ratio winds up somewhere between 10% and 11%
According to the data, our average price for corn should be somewhere around $4.70 to $5.00 with the possibility for highs in the realm of $6.00
I showed this chart last week, but wanted to include it again.
We are not quiet as tight as "true bull market" years. That resulted in $6 to $8 corn.
But we are no where close to the bear market years either.
If our stocks to use falls below 10% then we have a real case for a bull market (currently at 10.19%)
Today's Main Takeaways
Corn
$5.37 Corn?
Here is a weekly look at continuous corn.
This $4.97 level is a big barrier to overcome.
It was our exact lows back in 2021.
It also happens to be the exact highs from the other day.
Once corn breaks this level and gets a weekly close above, the upside is wide open.
The big major objective I am looking for is going to be $5.37 for a few reasons.
Reason #1:
It is the next fib level 38.2% retracement to the April 2022 highs of $8.24

Here is what that looks like on the monthly chart.
Again, $4.97 was the exact lows from 2021.
Makes sense we'd find resistance.
Once it clears, the upside is wide open.

I do not know if $5.37 will happen on the March contract or a later dated contract such as July.
But it is a point of interest on both.
For March:
First we do have resistance at $5.08
This was our May highs.
Back in late 2023, prices were trapped in a sideways channel for several months.
The bottom of that channel? $5.08
The upper end of the channel? $5.37
$5.37 also happens to be the 78.6% retracement to the contract highs of $5.74
If we get above those May highs, things get really interesting.

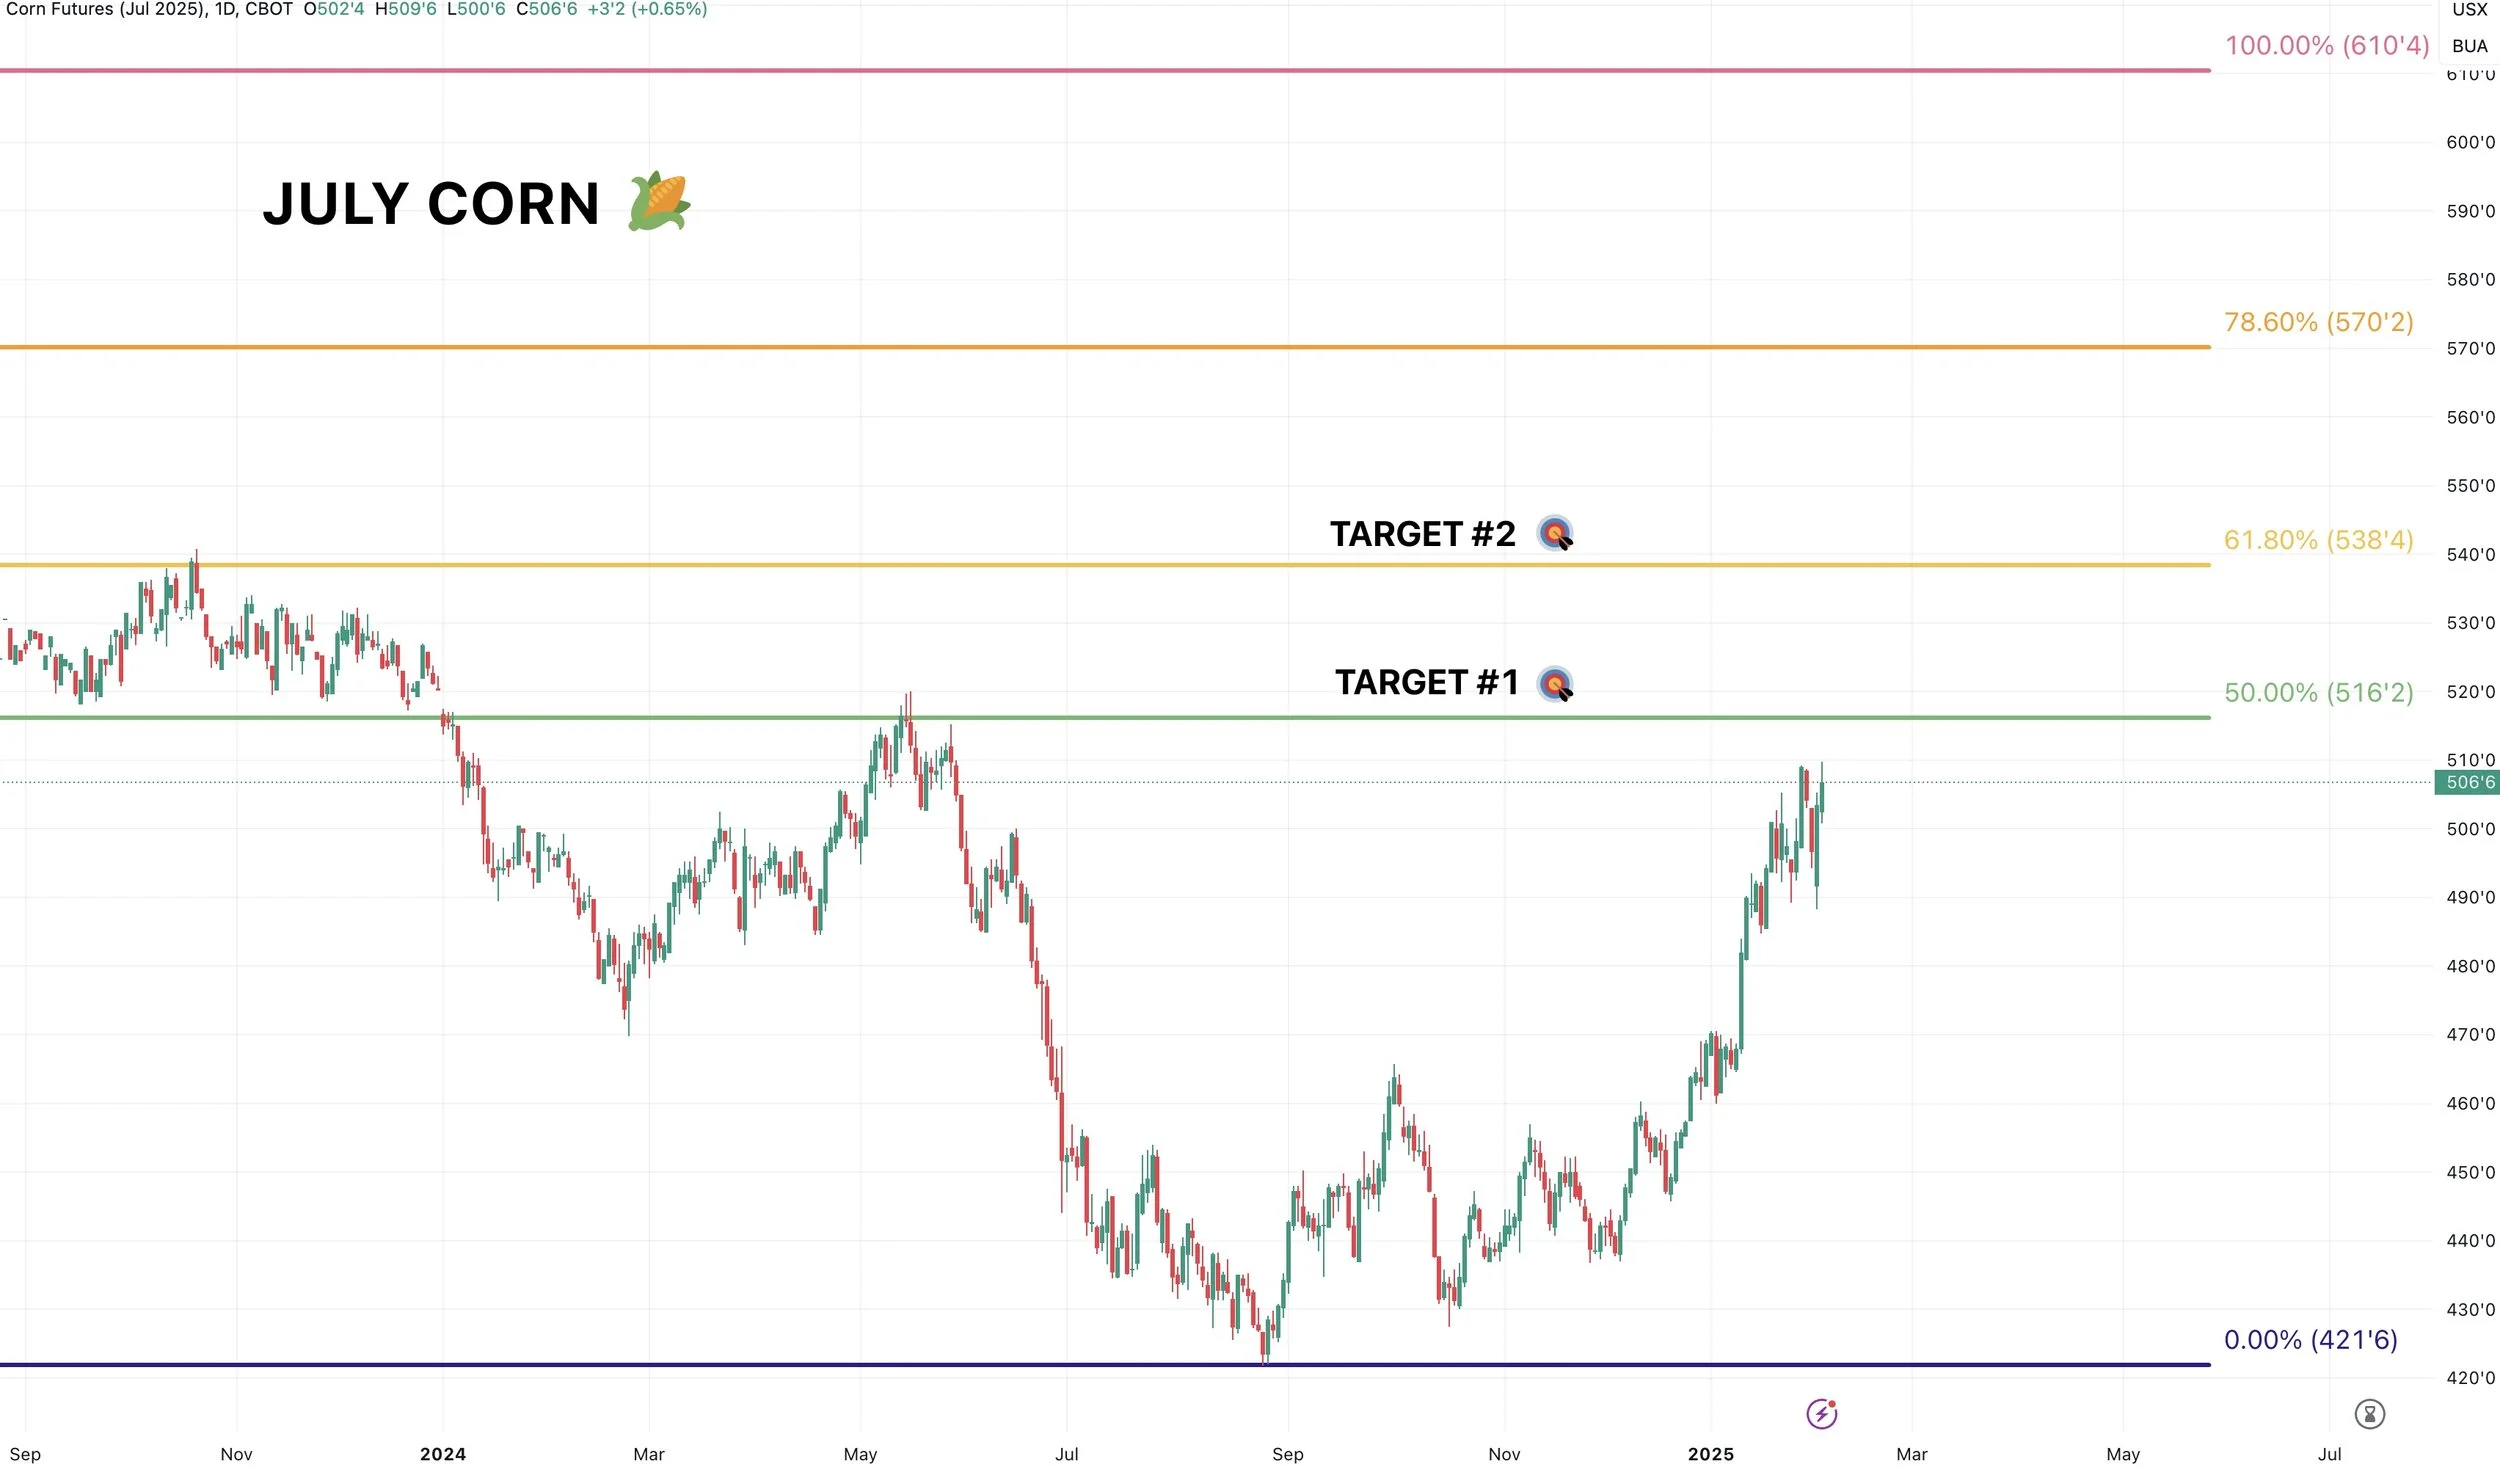
Looking at July corn:
The first target is going to be $5.16
Which is the 50% retracement to the contract highs of $6.10 1/2 and does also line up right around those May 2024 highs.
After that, $5.37-$5.38 is next up.
It is the 61.8% retracement to the contract highs (61.8% is the most common retracement level)
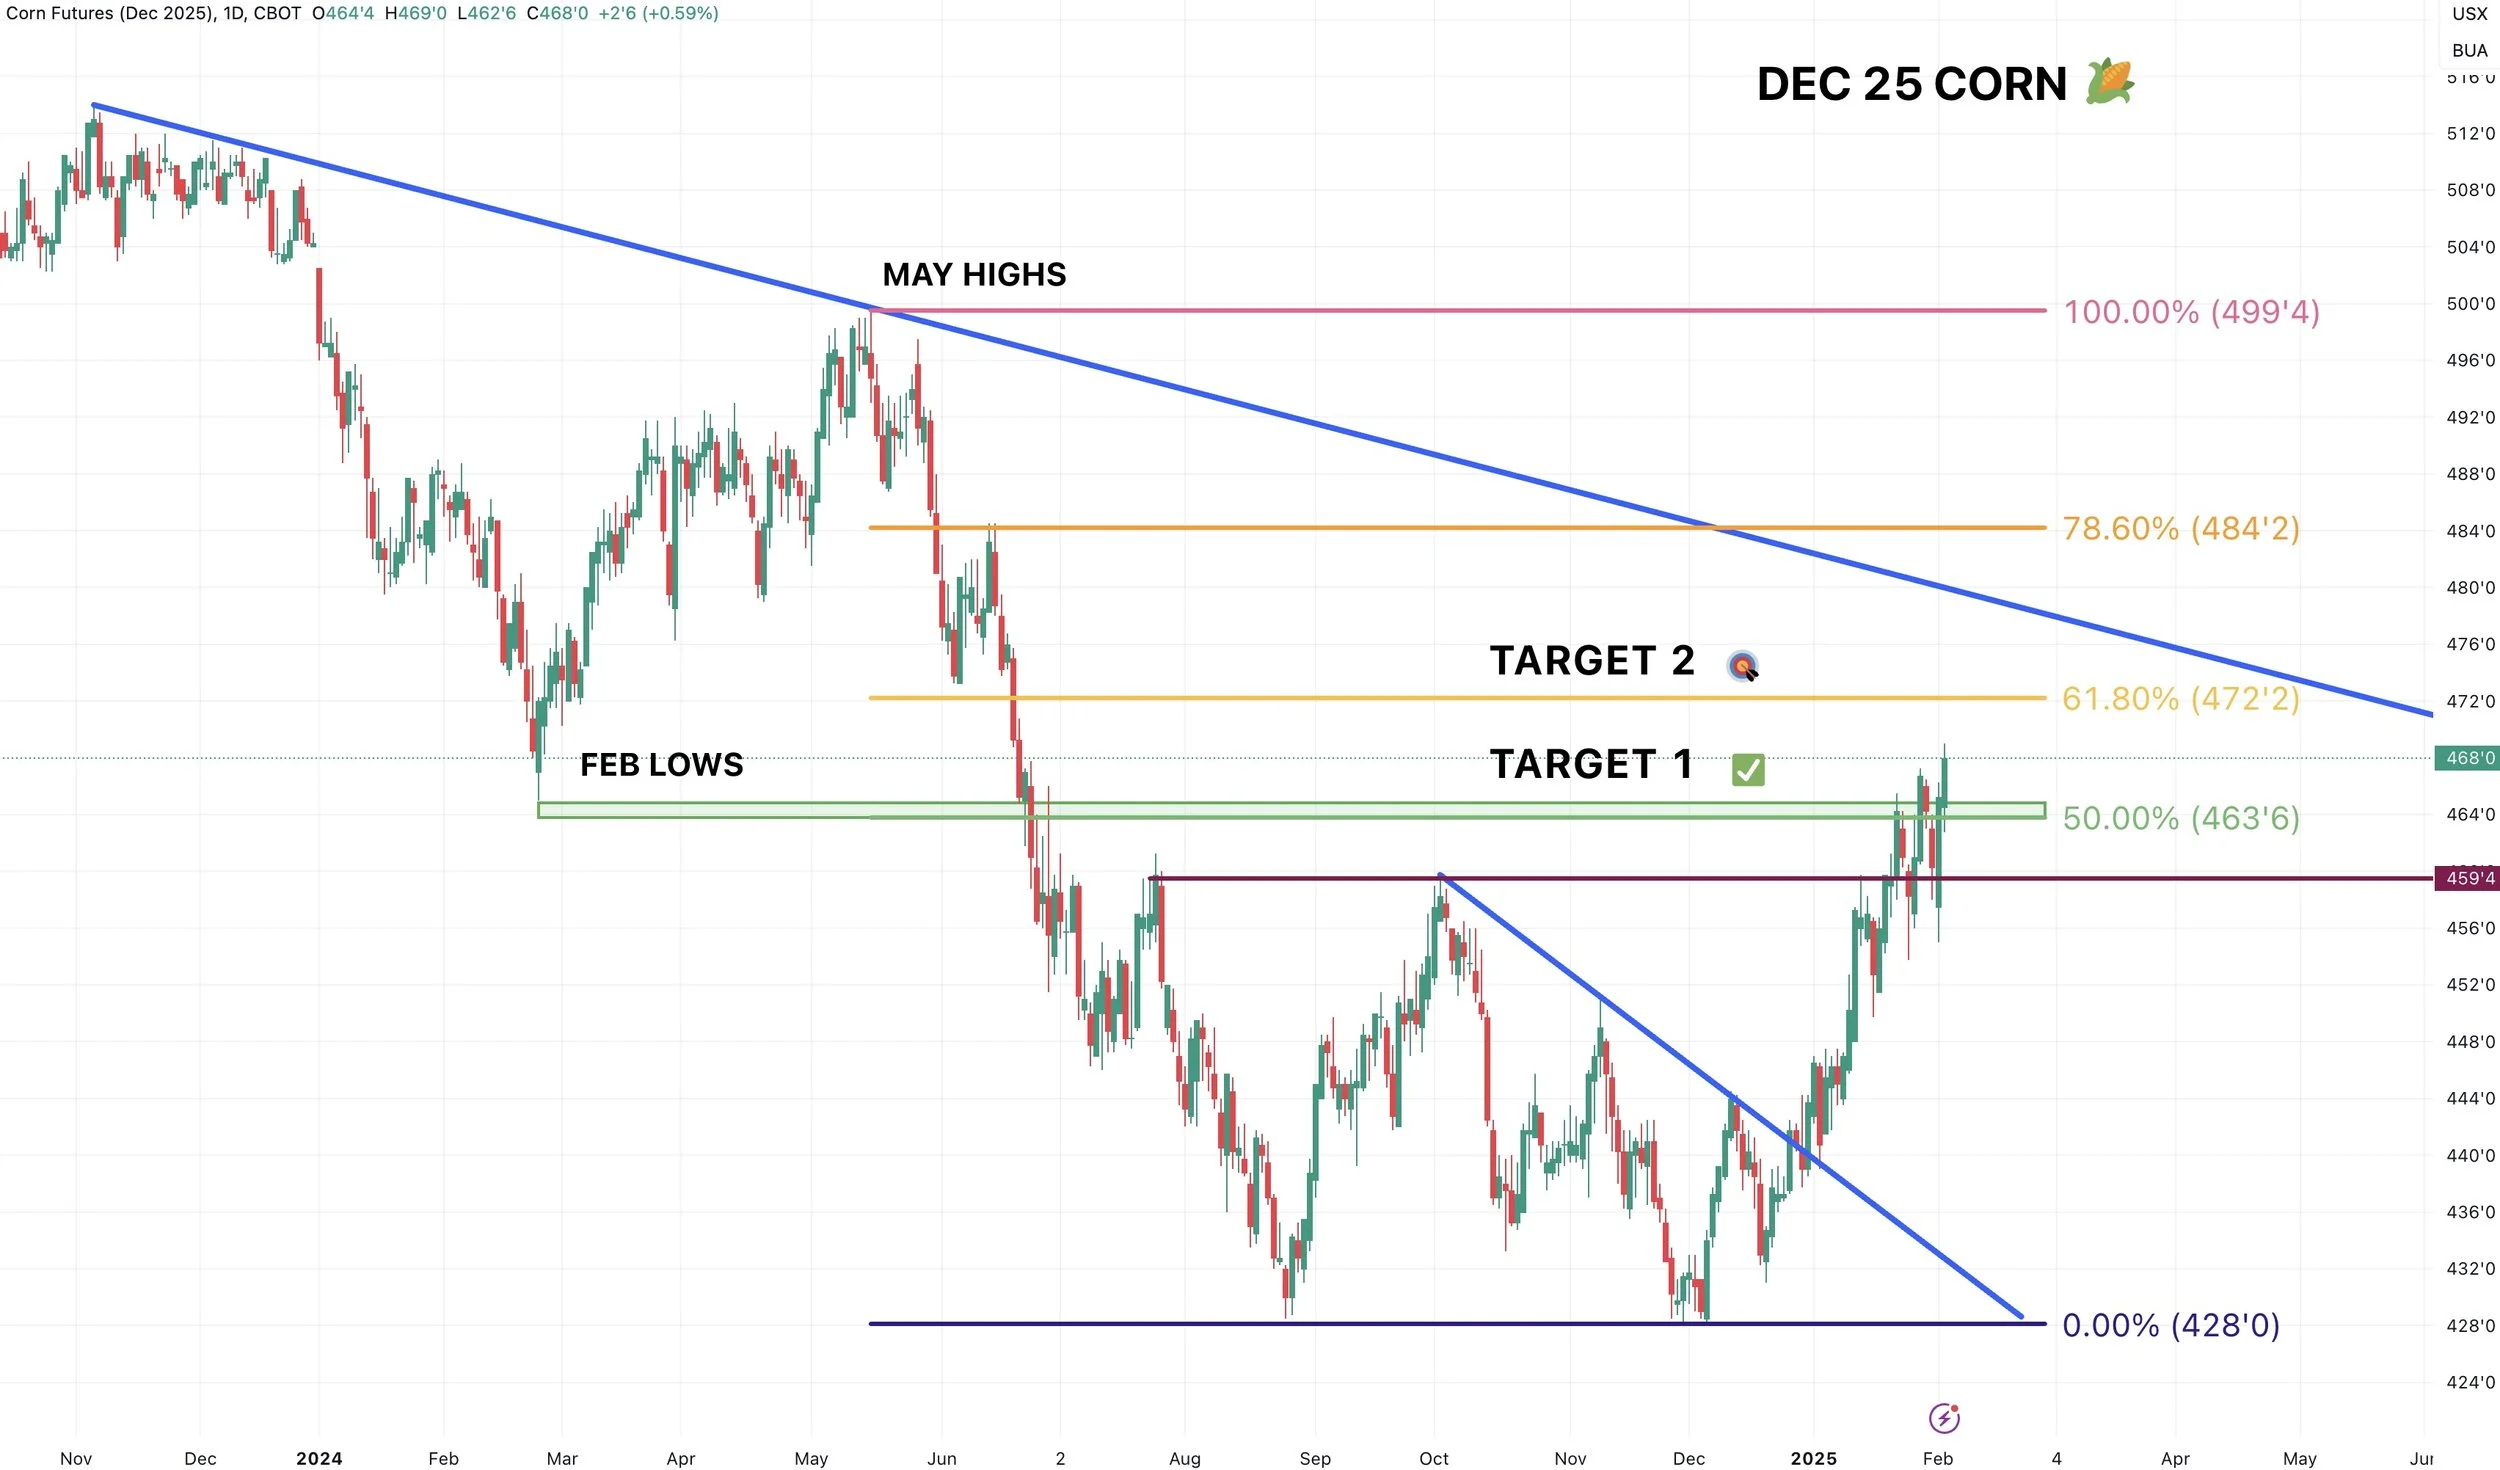
New crop:
Nothing has changed, we hit the first target of $4.64 a week or two ago.
$4.72 is the next target if you want to take a little risk.
It is the 61.8% retracement to the May highs.
Bottom Line & Risk Management
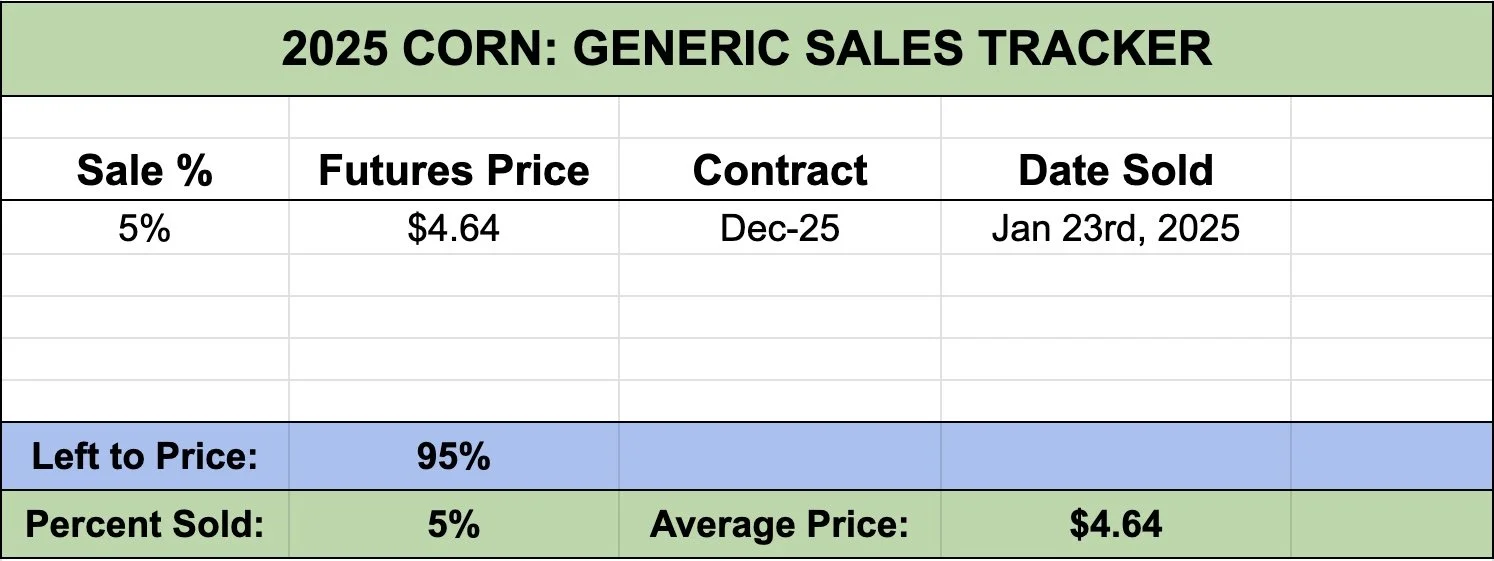
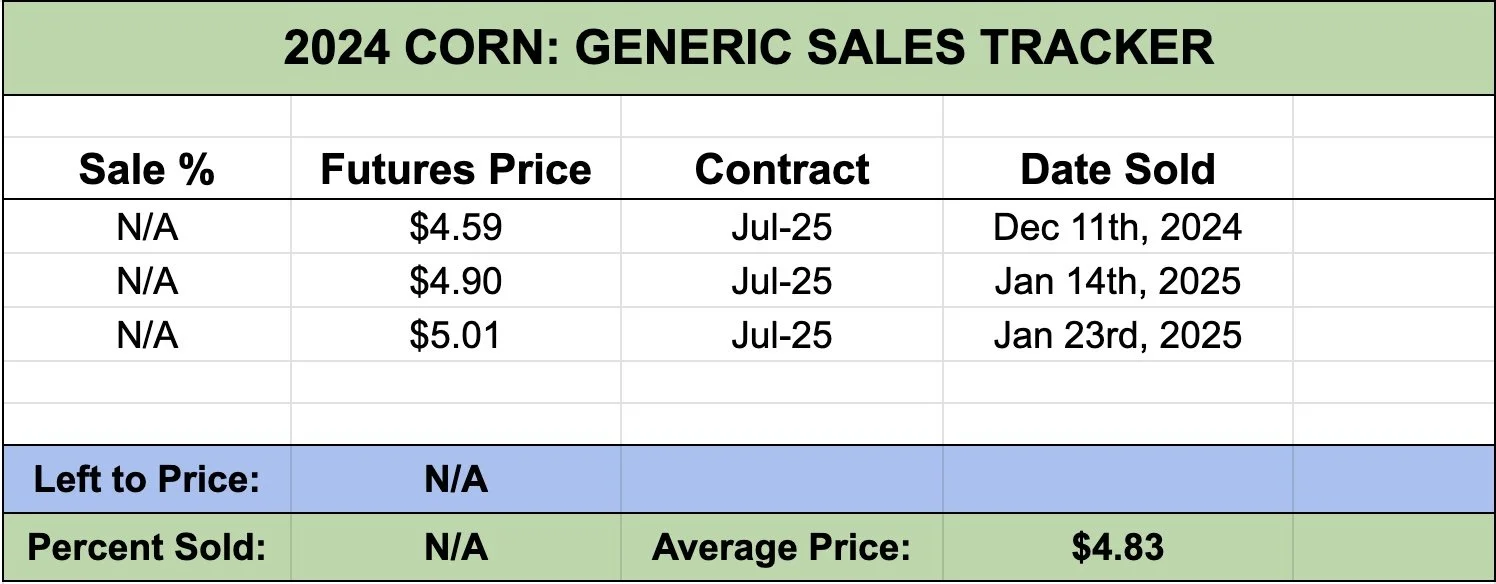
We alerted an old crop sell signal on Jan 23rd right around $4.90 on March corn.
If you didn’t take advantage or feel like you are behind, then take risk off here.
For new crop, I do not want to be oversold at all. If anything I want to be less sold than normal.
For new crop, ideally we want to protect it by using shorter dated puts on old crop. As old crop is far more overvalued while new crop is undervalued. Old crop should lead the way higher and lower.
It does feel like a lot of the US farmers are more sold than usual and many are actually oversold on old crop. If this is the case, we should see less selll pressure than normal. Which makes it that much easier to rally.
Soybeans
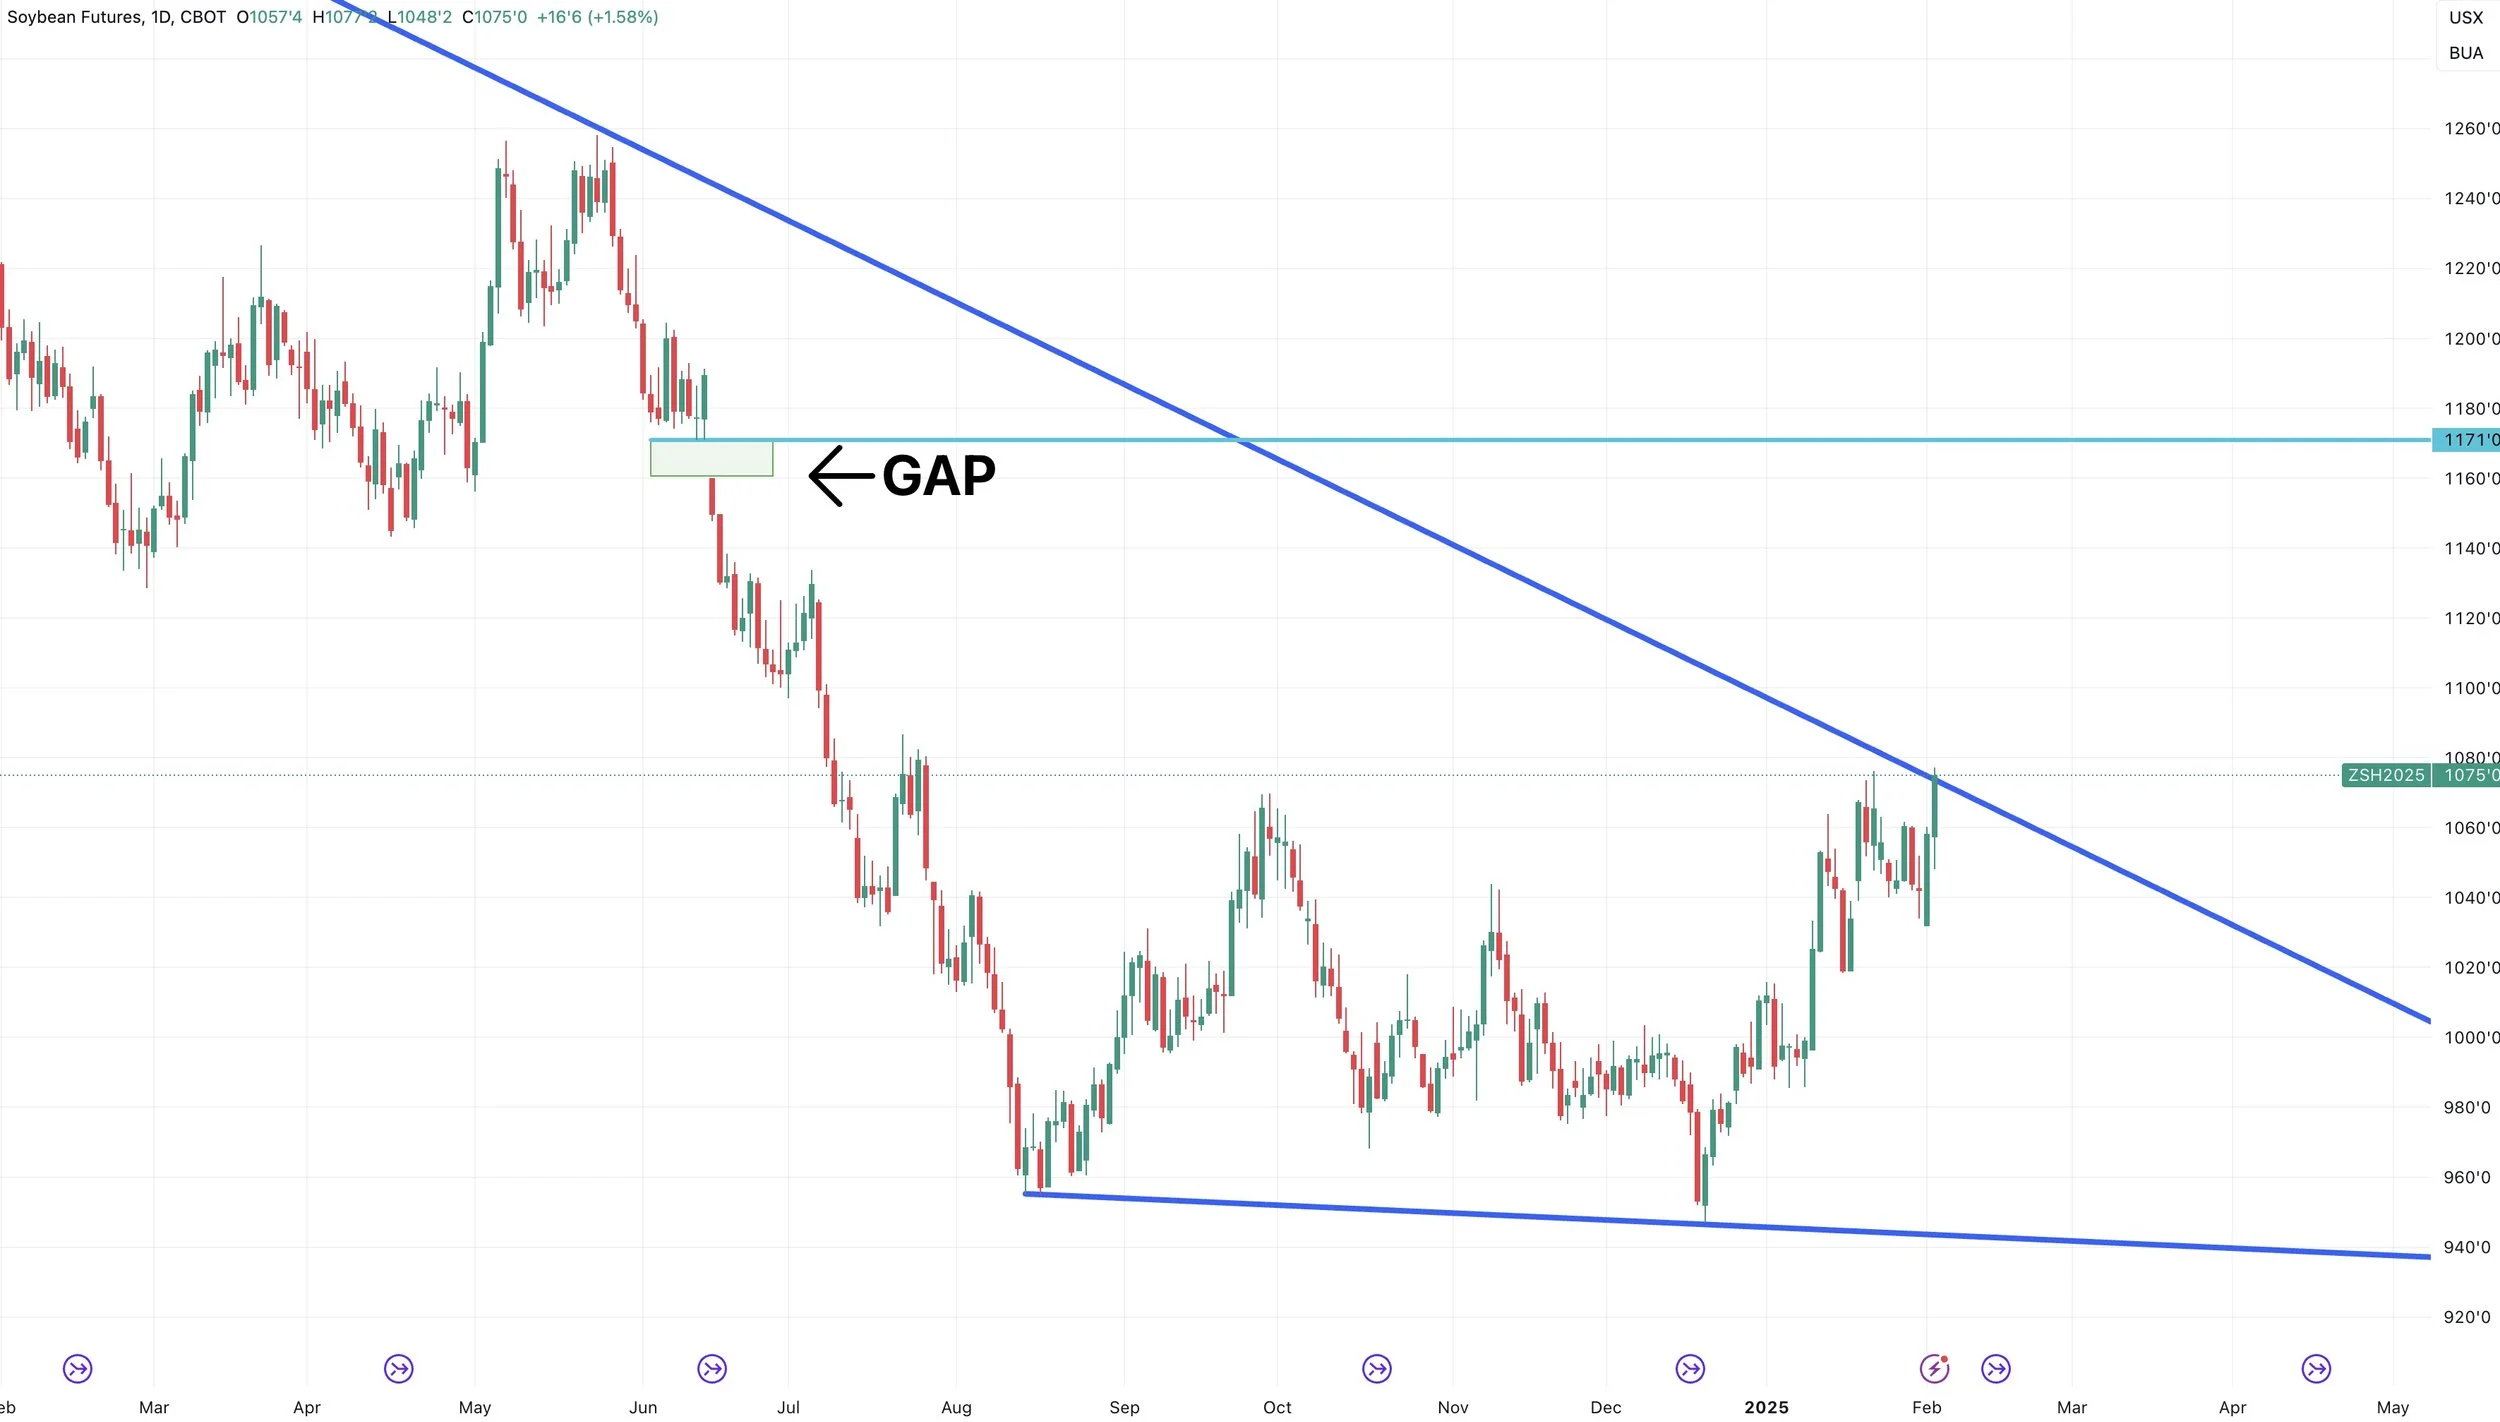
Here is look at continuous soybeans.
We are on the verge of busting this downward trend we have been battling from the 2022 highs of $17.84
Seems like a big deal IF we can get some follow through.

A big picture target for continuous soybeans would be $11.70 to complete that gap fill left from last June.
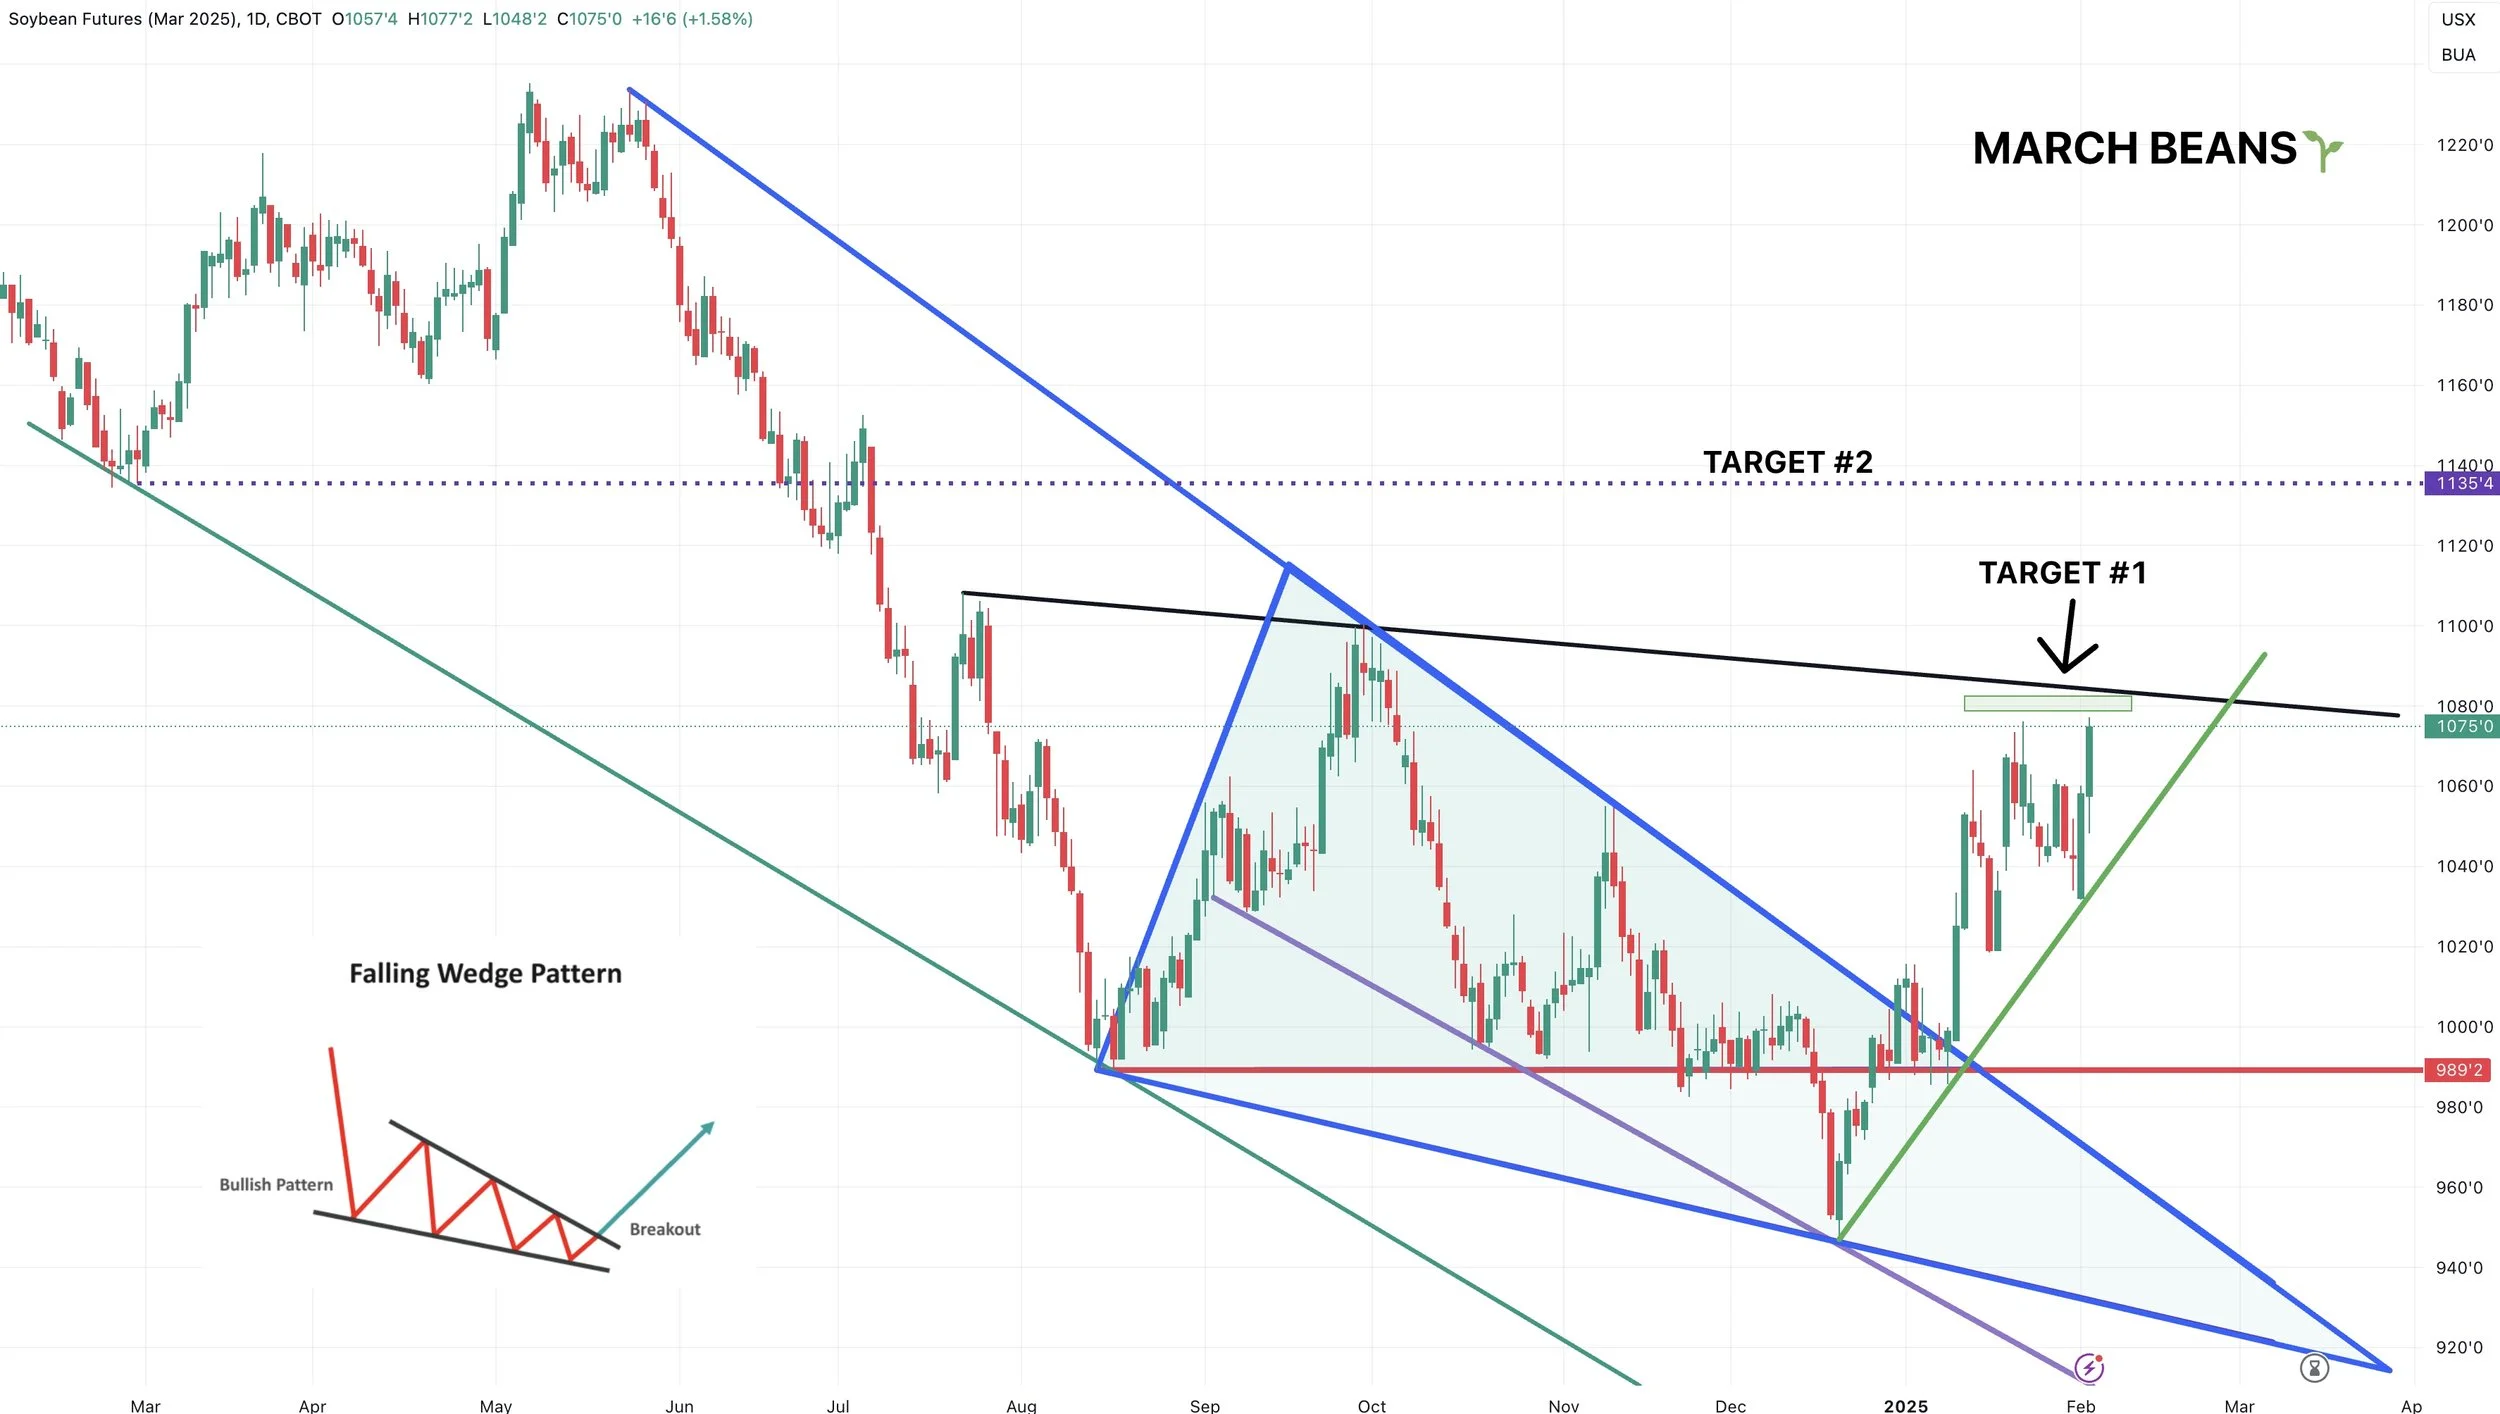
Looking at March beans, we are getting very close to our next upside objective.
The $10.80 area, a 3rd retest of that black downward trendline.
If we break that trendline, next target would be the $11.35 range (dotted purple line)
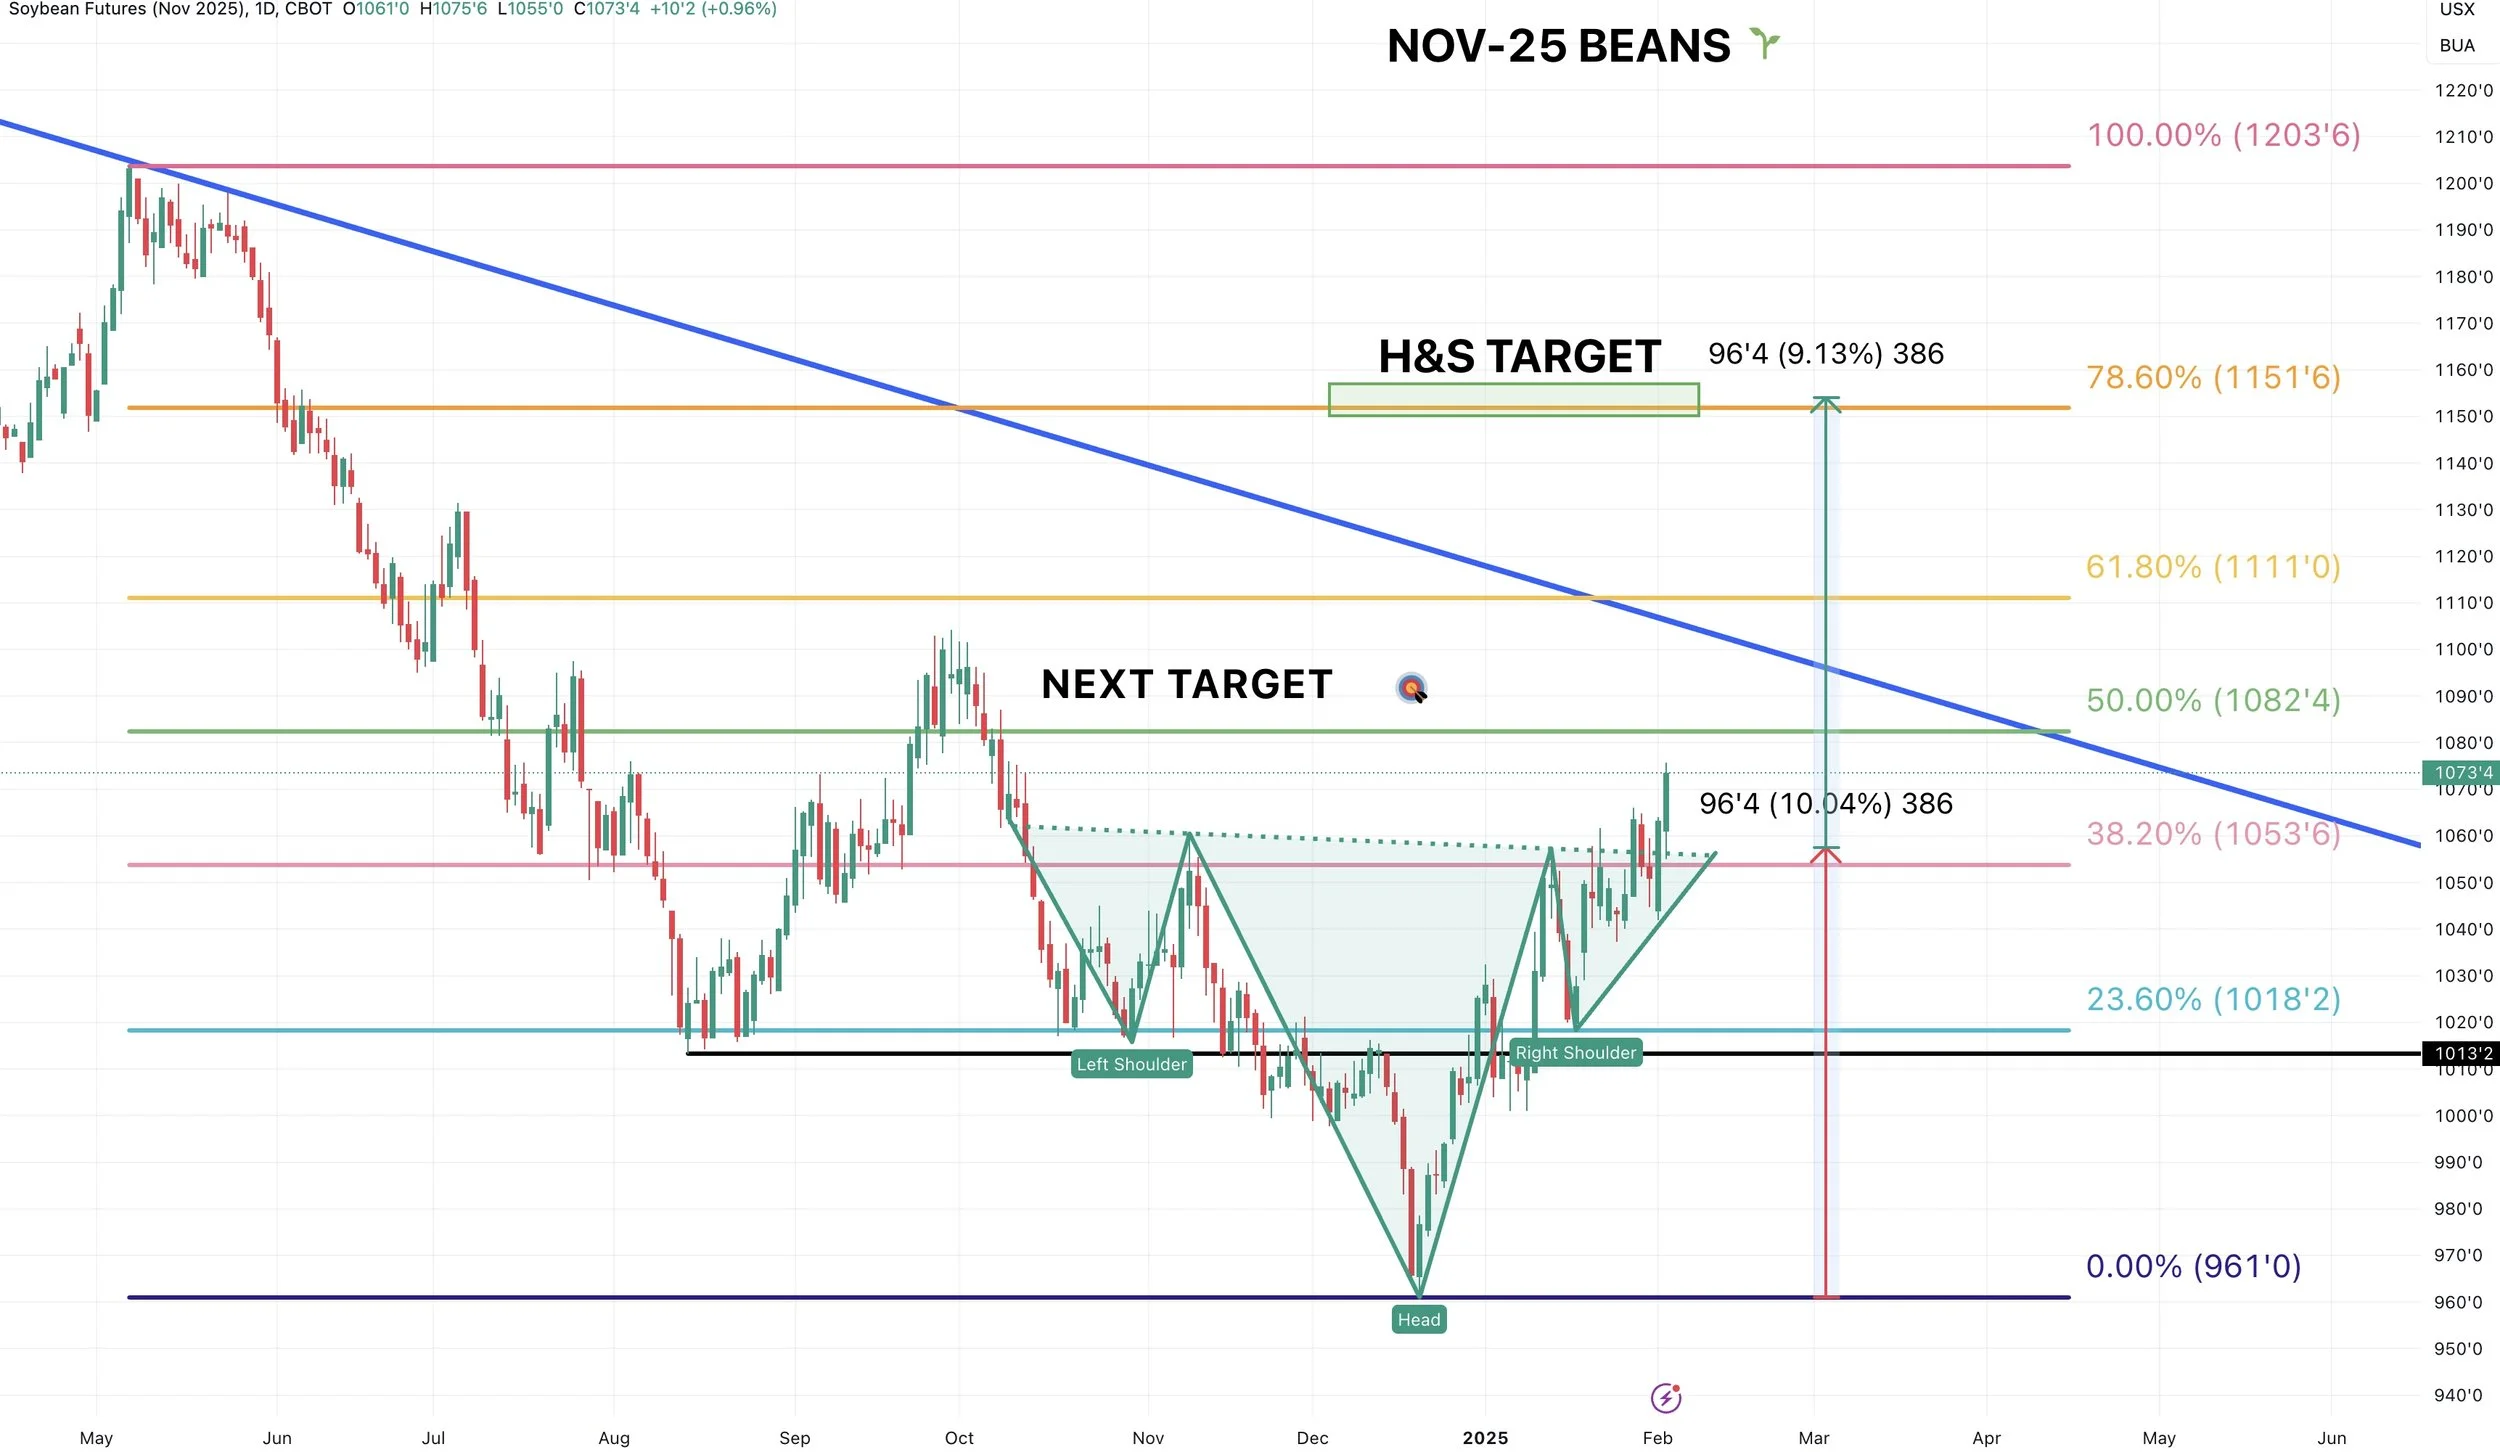
Looking at new crop, we are approaching that 2nd target of $10.82 (50% retracment of May 2024 highs).
That would not be a bad place to look to take a little risk off the table.
A bigger picture target is still going to be around that $11.50 area.
It is the implied upside move from this inverse head & shoulders.
It is also the 78.6% retracement to the May highs.
If we can crawl up there, I would look to be a lot more aggressive.
Bottom Line & Risk Management:
Just like corn, on Jan 23rd we alerted an old crop sell signal. Prices are now back to where they were that day.
So if you did not pull the trigger, or feel like you are behind. Take some risk off risk off here.
Similar to corn, we do not love getting carried away with new crop sales at this time.
The global situation is still bearish, and Brazil still has a big crop about to the hit the market. So this could add some pressure or limit our upside on a rally.
I am not bearish on soybeans at all, I am just not overly bullish either, as corn has a far better fundamental story in the US and globally than beans.
The tariff news could change everything if China & Trump agree to that Phase 1 deal. But at the same time, if they can’t agree this would be really negative for beans. (Although I think they probably agree to something).
Looking later this year, we will also be looking at less acres here in the US. Which should help add some fire to the bean market.
Wheat
I still think wheat is underavlued here.
We have several friendly factors and wheat is starting to finally catch a bid.
I went over a bunch of reasons last week why I see a bull argument for wheat. If you missed it, you can read that by clicking here.
A few friendly factors:
Russia has their worst winter wheat crop on record
Russian exports continue to drop
The funds are short over -100k SRW wheat contracts
We have the tightest global balance sheet in a decade
India the worlds #3 exporter is in for a hot Feb
Smallest global stocks to use ratio for major global exporters since 2008
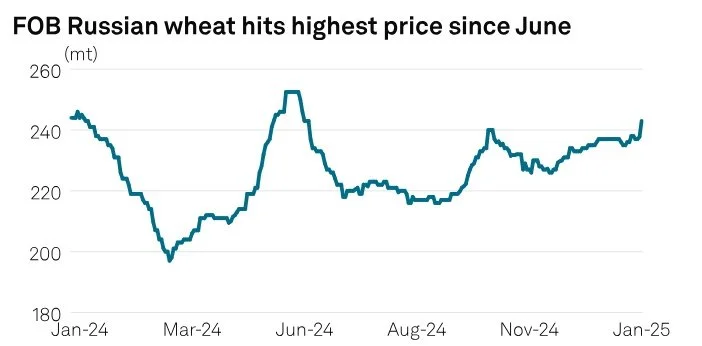
We also have Russian wheat prices jumping to their highest prices since June on their falling supply and slow exports.
Eventually people will have to come to the US for some wheat.
Bottom line, I still have no interest selling wheat here and probably won’t have any under $6.00
We finally have some nice breakouts on the charts that I have been waiting to happen for a few months.
Wheat is trading at it's highest levels since November now.
Looking at the charts, first for March Chicago the next resistance is $5.84
After that the upside is wide open.

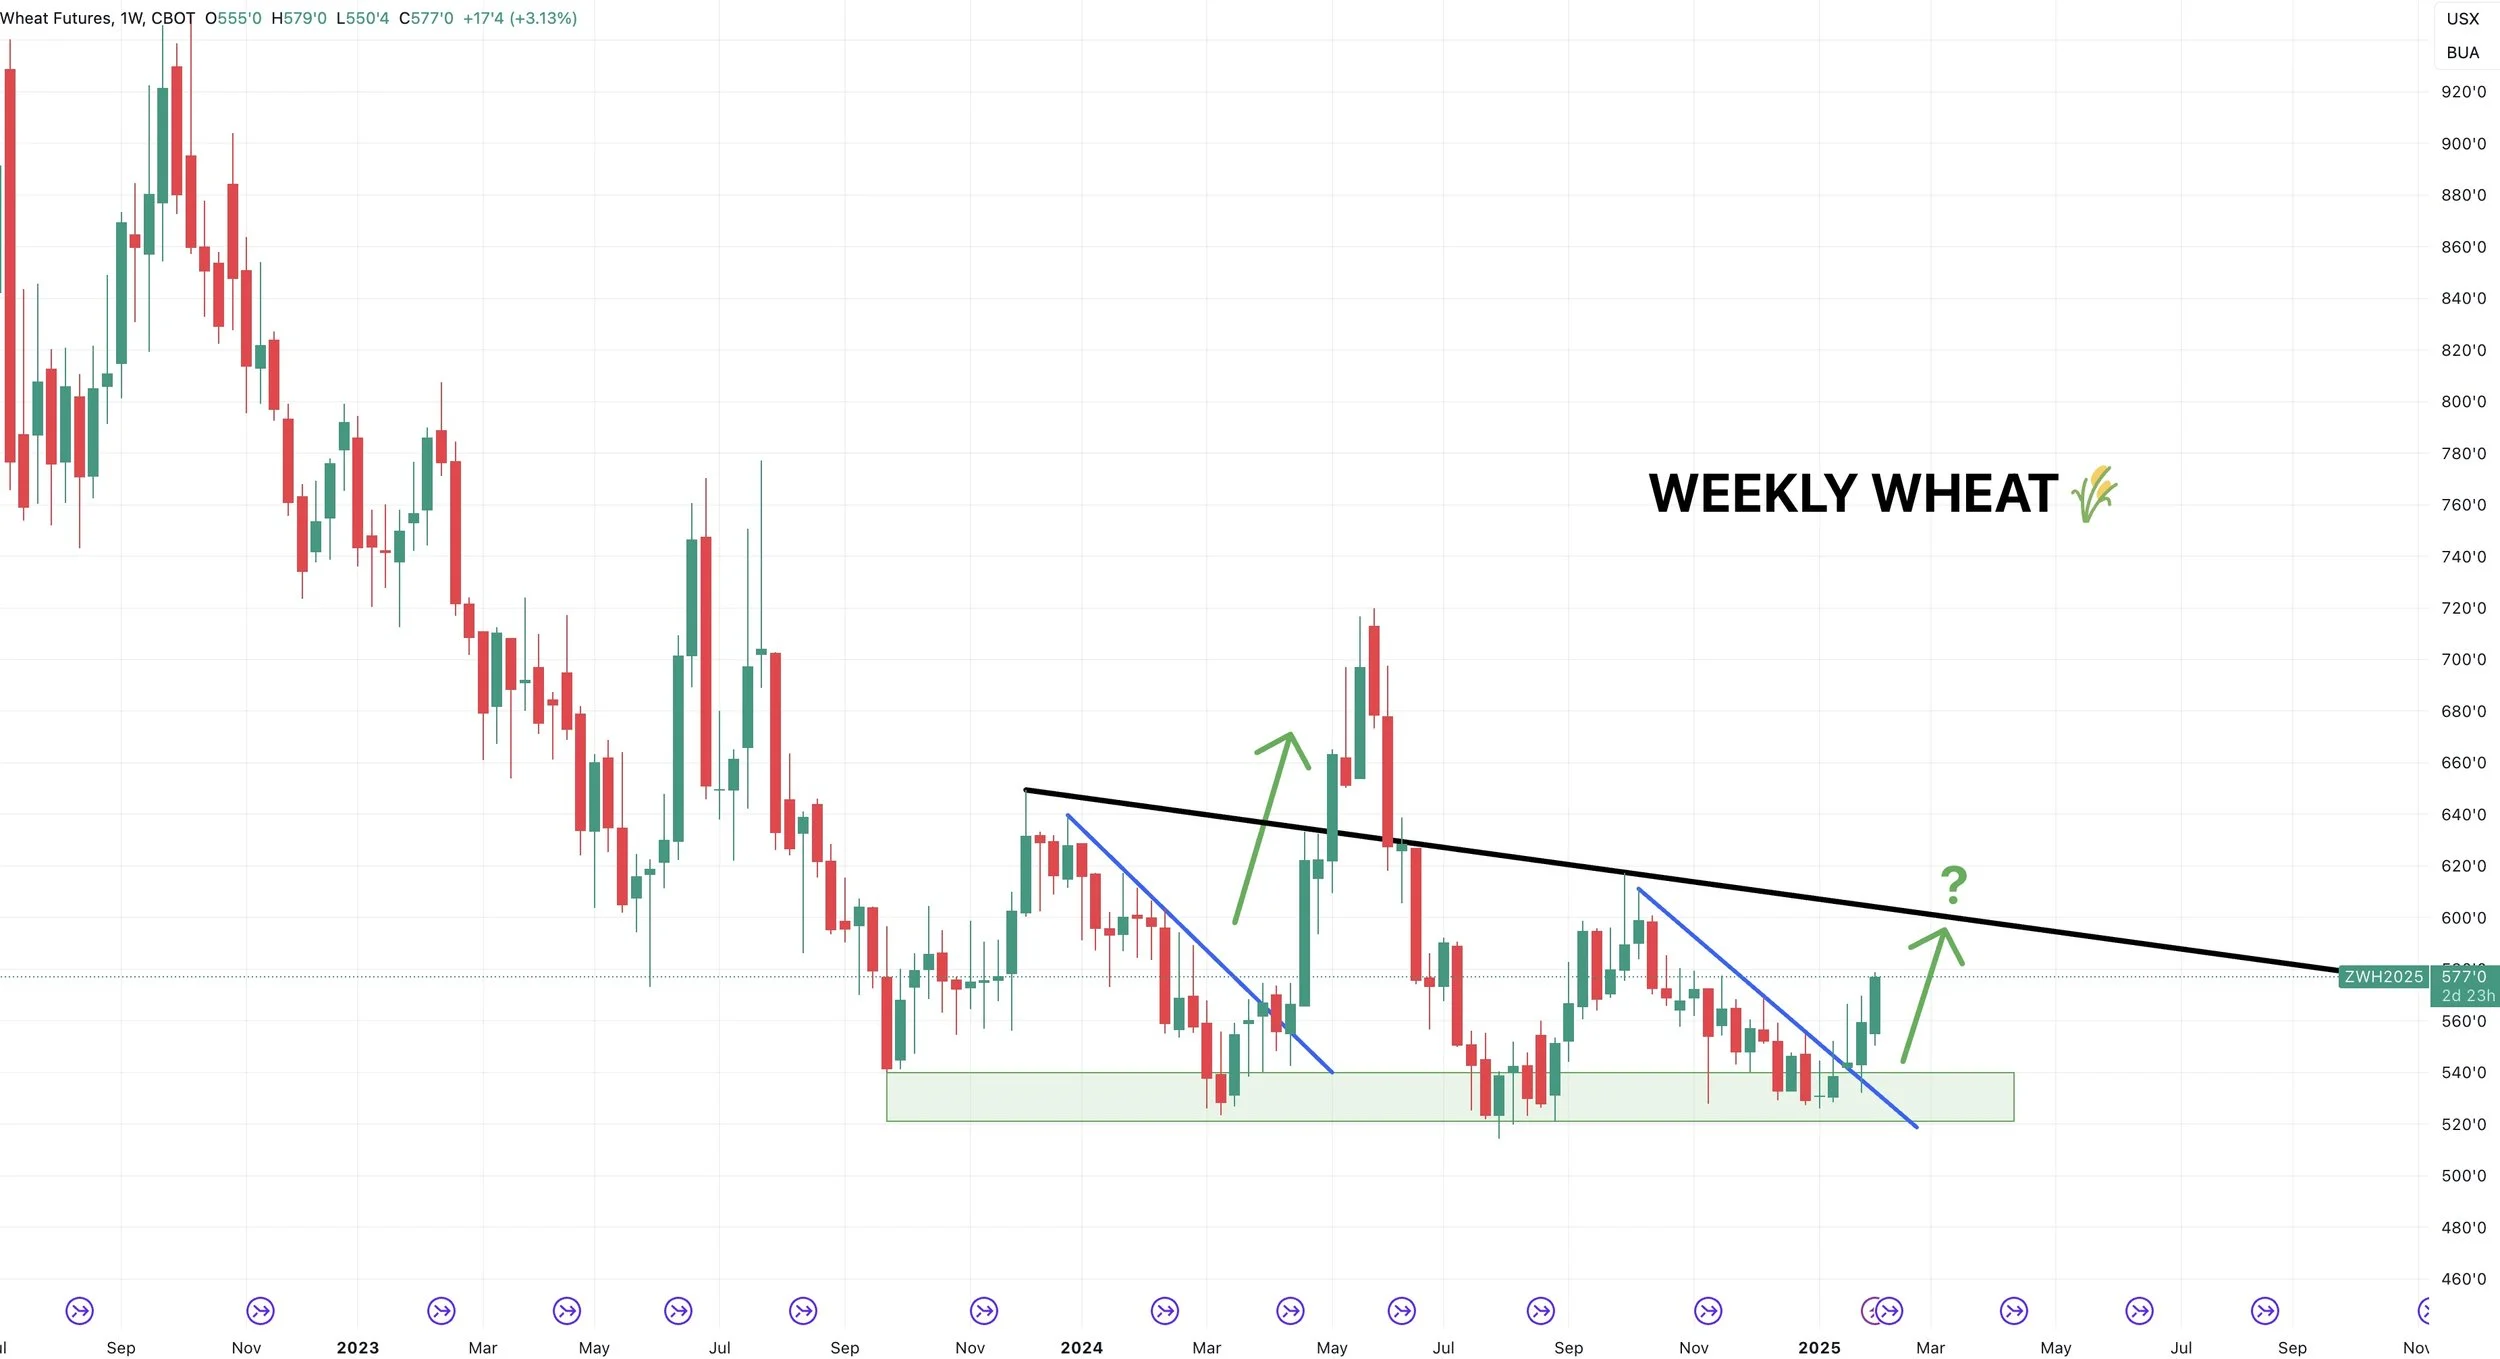
Here is a weekly chart, looks like a nice breakout.
Next upside objective looks to be right around that $6.00
Would be a 3rd test of that black neckline.
Above the line and things likely escalate.
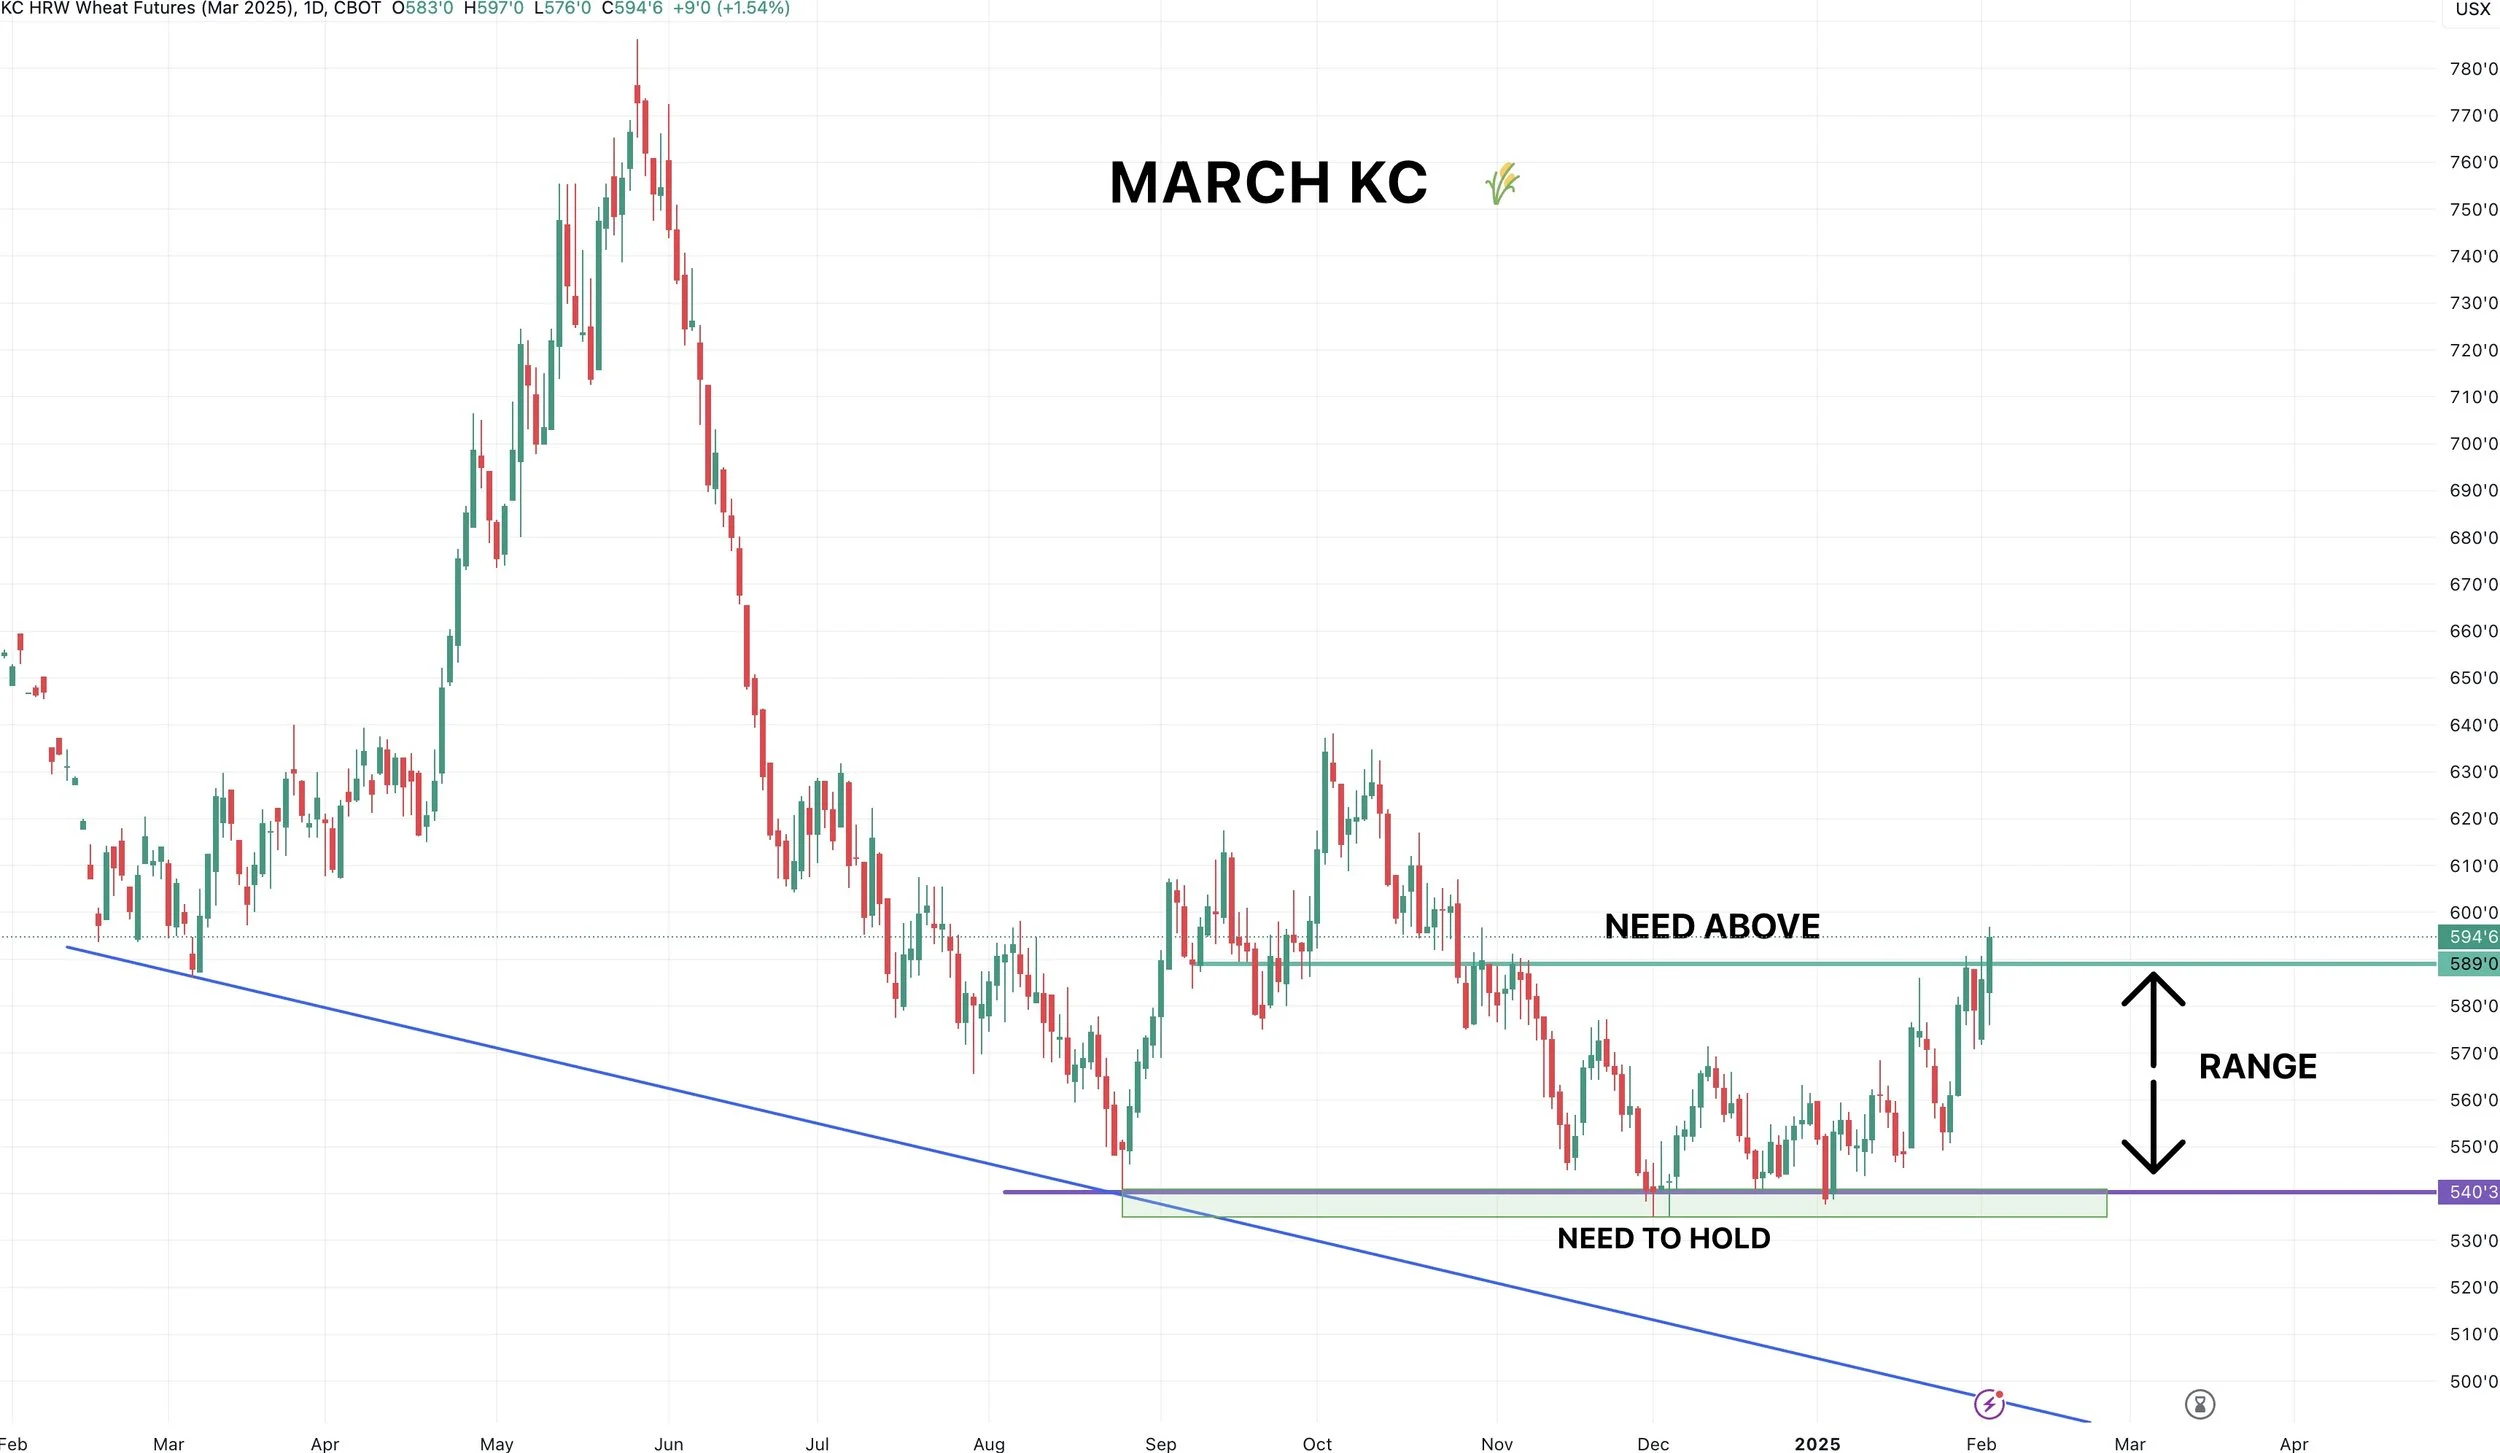
Looking at KC wheat, we broke that $5.89 resistance.
This should hopefully open the upside up further.
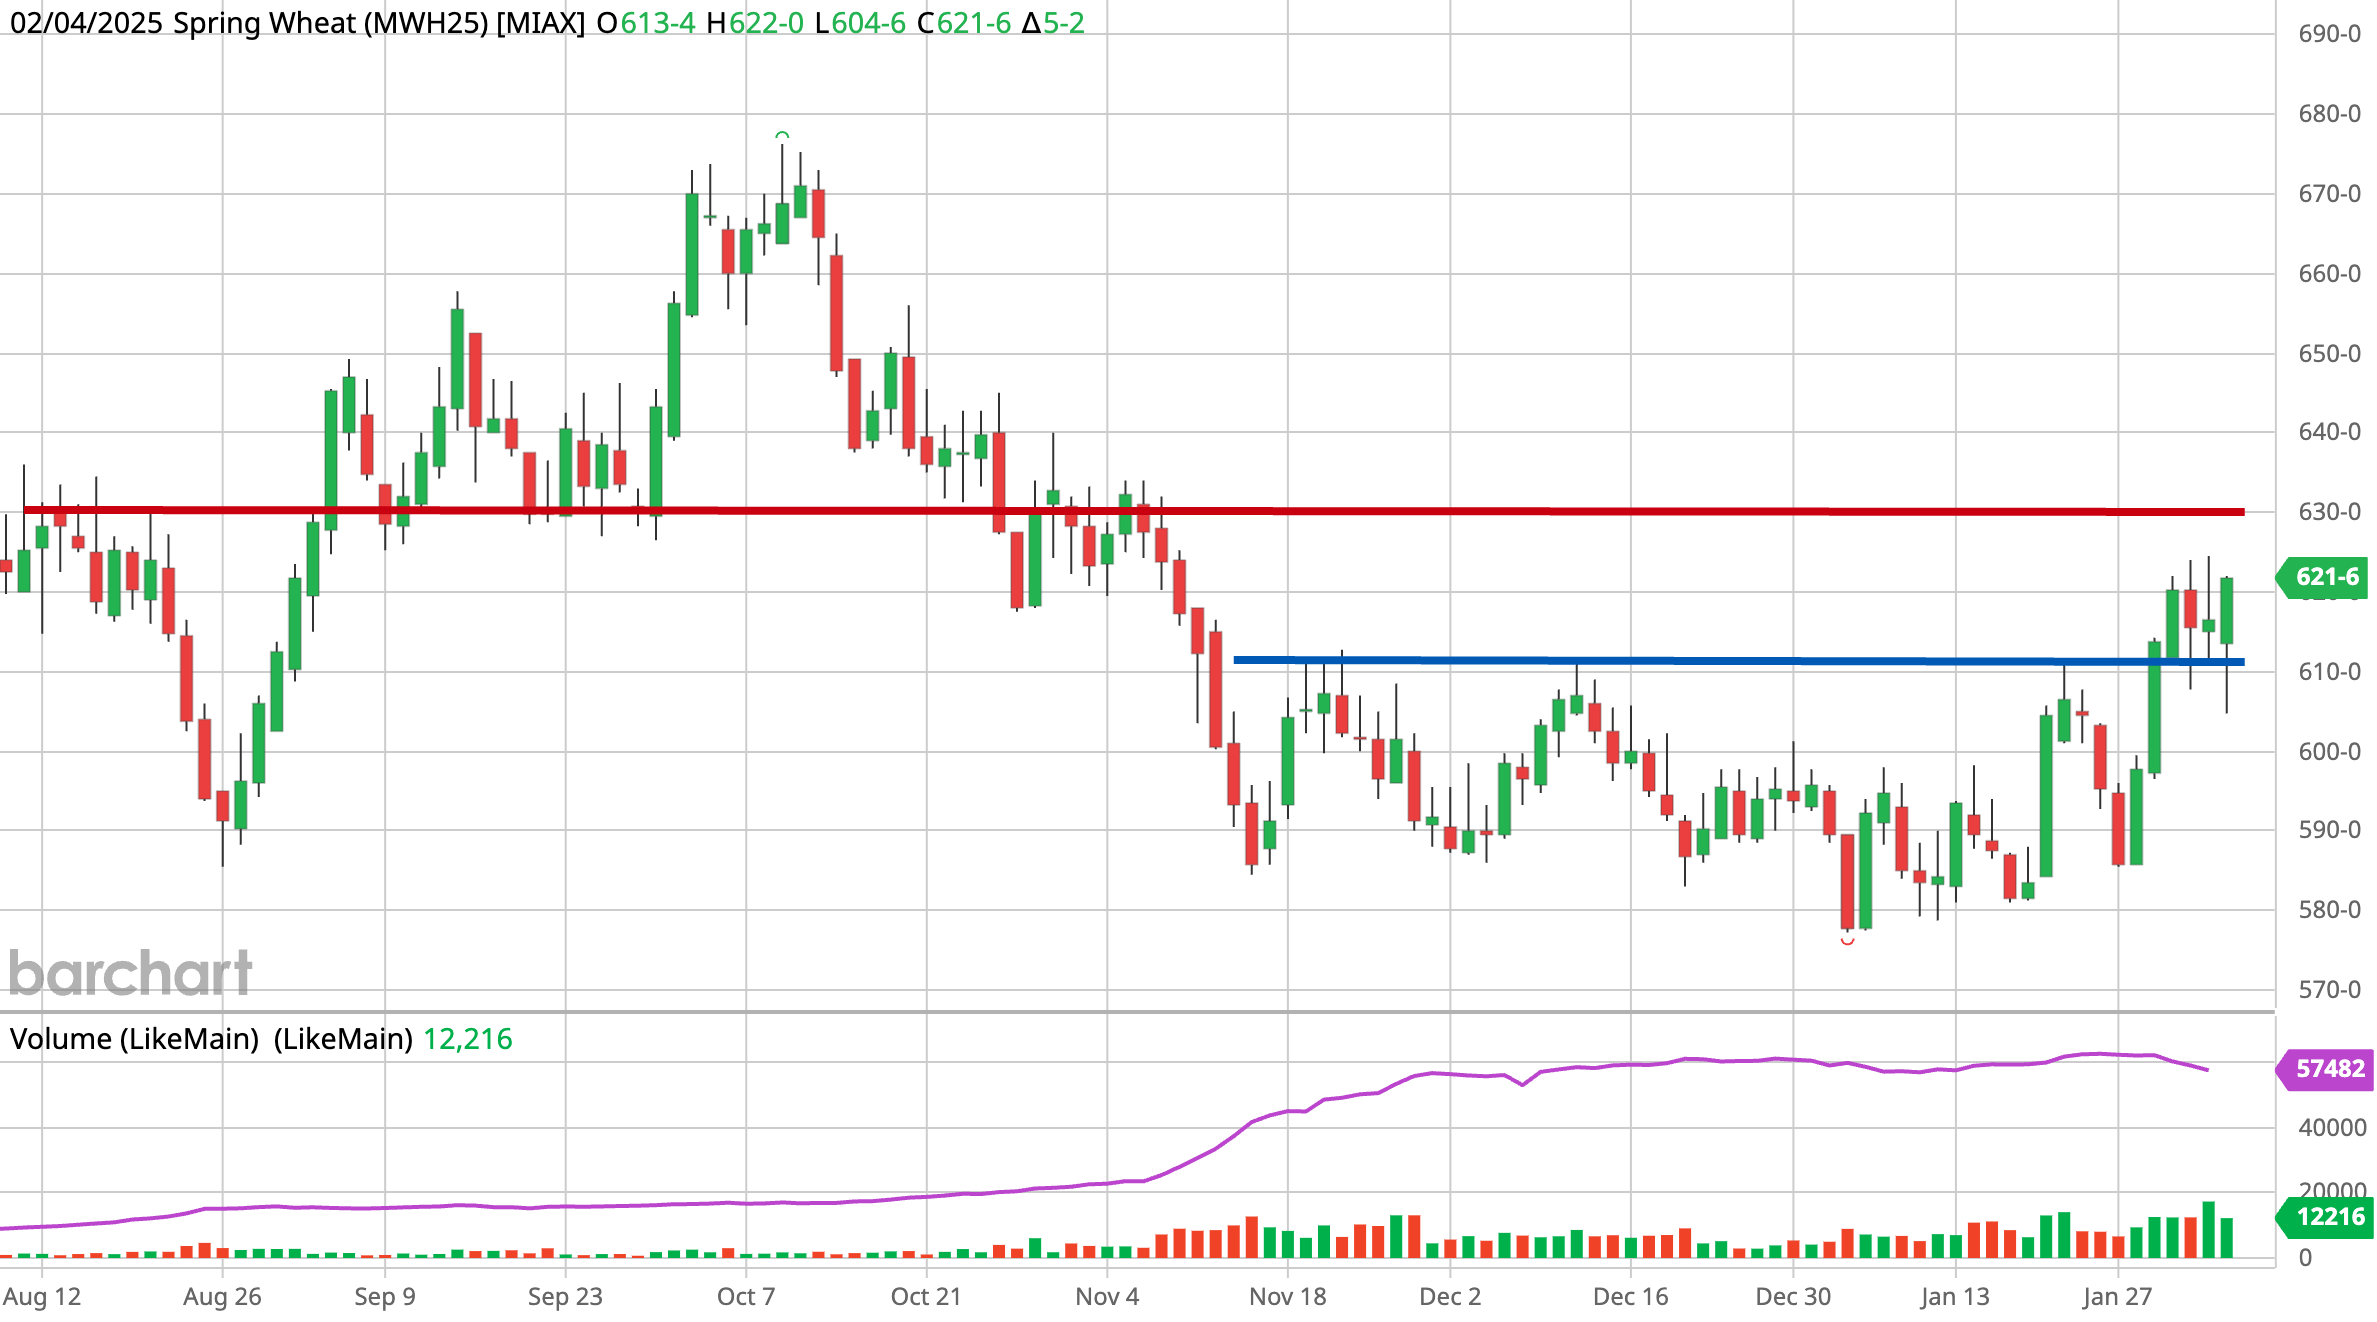
MPLS Wheat:
Nice breakout. Next resistance is $6.30
Above there and the upside opens up.
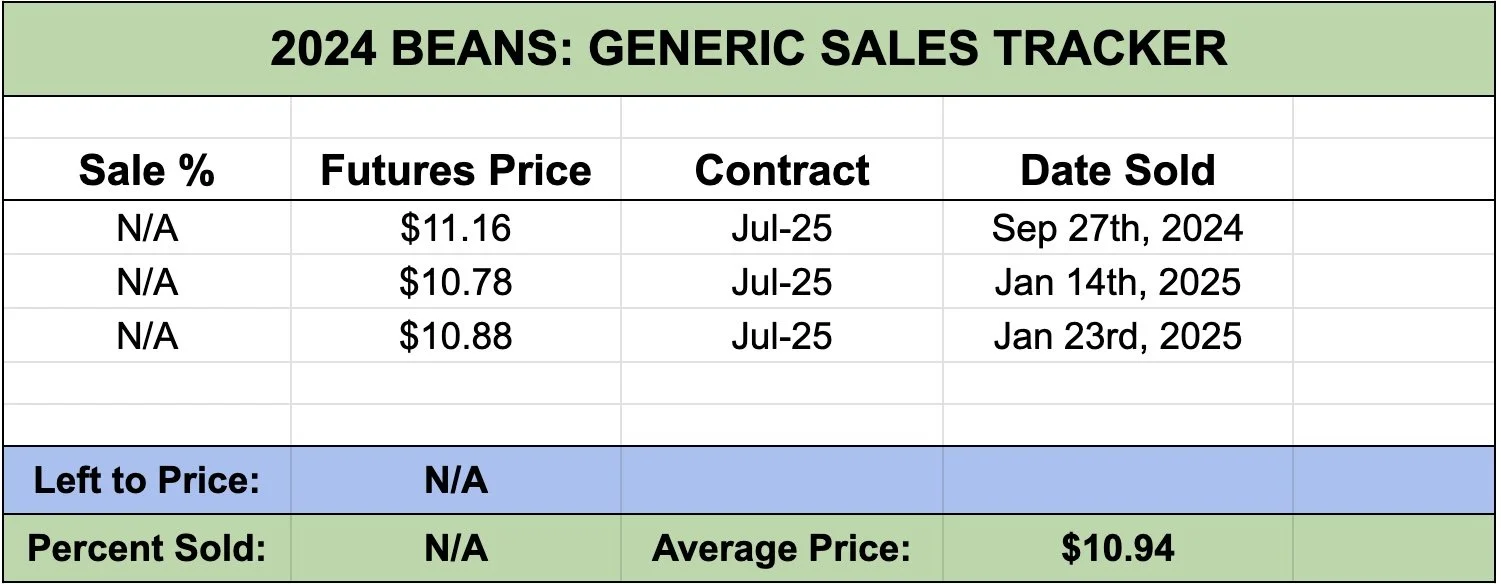
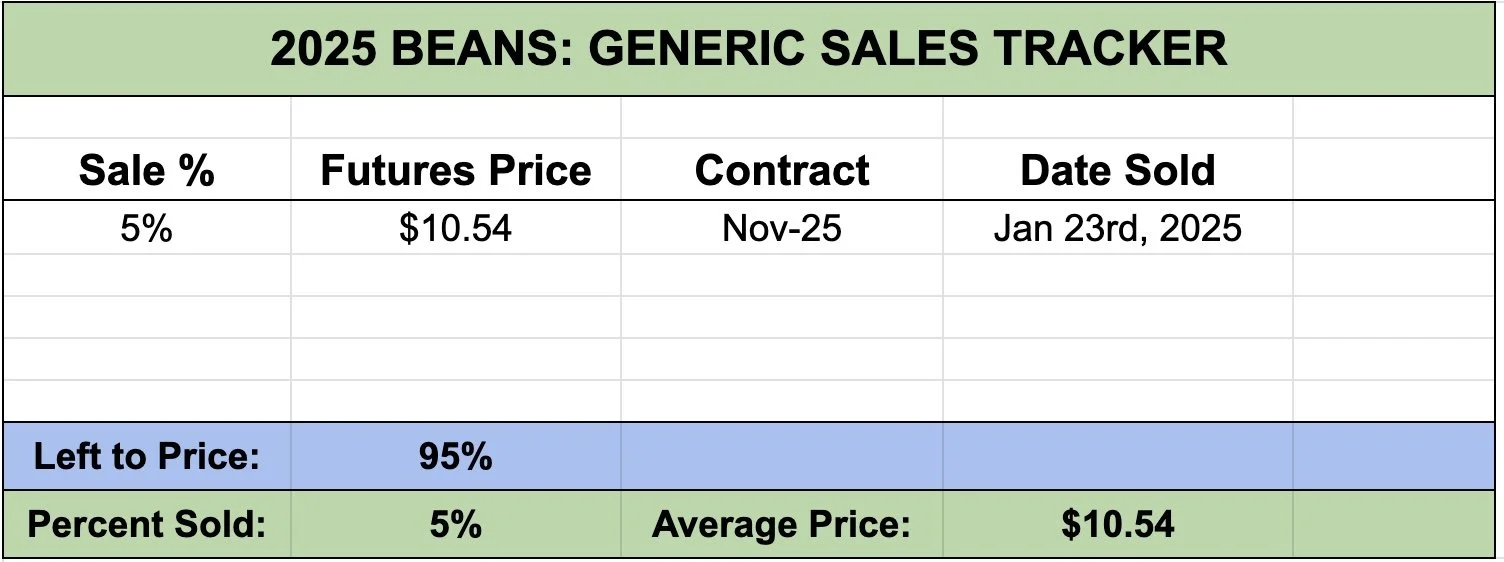
Generic Cash Sales Tracker
Due to requests here is our generic cash sales trackers.
This does not include any hedge recommendations etc. Simply cash.
This is futures prices.
For old crop there is no percentages as we only recently started tracking our generic sell signals. Future new crop sales will have percentages as we continue to make sales.
This will be included at the bottom of every update.
Past Sell or Protection Signals
We recently incorporated these. Here are our past signals.
Jan 23rd: 🌽 🌱
Corn & beans old crop sell signal.
CLICK HERE TO VIEW
Jan 15th: 🌽 🌱
Corn & beans hedge alert/sell signal.
Jan 2nd: 🐮
Cattle hedge alert at new all-time highs & target.
Dec 11th: 🌽
Corn sell signal at $4.51 200-day MA
CLICK HERE TO VIEW
Oct 2nd: 🌾
Wheat sell signal at $6.12 target
Sep 30th: 🌽
Corn protection signal at $4.23-26
Sep 27th: 🌱
Soybean sell & protection signal at $10.65
Sep 13th: 🌾
Wheat sell signal at $5.98
May 22nd: 🌾
Wheat sell signal when wheat traded +$7.00
Want to Talk?
Our phones are open 24/7 for you guys if you ever need anything or want to discuss your operation.
Hedge Account
Interested in a hedge account? Use the link below to set up an account or shoot Jeremey a call at (605)295-3100.
Check Out Past Updates
2/3/25
TARIFFS PUSHED BACK
1/31/25
TARIFF NEWS ALL OVER THE PLACE. ARE YOU PREPARED FOR POSSIBILITIES?
1/30/25
WHEAT BULL ARGUMENT. TRUMP ADDS TARIFFS
1/29/25
CORN APPROACHES $5.00
1/28/25
TARIFFS, CORN FUNDS, SOUTH AMERICA & MORE
1/27/25
HEALTHY CORRECTION WE TALKED ABOUT & TARIFF NEWS
1/24/25
GRAINS DUE FOR SHORT TERM CORRECTION?
1/23/25
OUR ENTIRE NEW CROP SALES THOUGHTS & OLD CROP SELL SIGNAL
1/22/25
GRAINS TAKE A BREATHER. IS CORN IN A BULL OR BEAR MARKET?
1/21/25
HUGE DAY IN GRAINS. WHAT TO DO WITH OLD CROP VS NEW CROP
Read More
1/20/25
VIDEO CHART UPDATE
1/17/25
TRUMP, CHINA, ARGY & USING THE SPREADS INVERSE
1/16/25
OLD CROP LEADS US LOWER. MARKETING THOUGHTS
1/15/25
SIGNAL & HEDGE ALERT QUESTIONS EXPLAINED. IS $6 CORN EVEN POSSIBLE?
1/14/25
MORE DETAILS ON TODAYS HEDGE ALERT & SELL SIGNAL
1/14/25
CORN & SOYBEANS HEDGE ALERT/SELL SIGNAL
1/13/25
USDA GAME CHANGER OR NOT?
1/10/25
BULLISH USDA FOR CORN & BEANS
1/9/25
USDA OUT TOMORROW
1/8/25
2 DAYS UNTIL USDA. BE PREPARED
1/7/25
THE HISTORY OF THE JAN USDA & MORE
1/6/25
MAJOR USDA REPORT FRIDAY
1/3/25
UGLY DAY ACROSS THE GRAINS
1/2/25
LONG TERM CORN UPTREND? JANUARY DROP OFF IN BEANS? LONG TERM WHEAT FACTORS
1/2/25
CATTLE HEDGE ALERT
12/31/24
MASSIVE DAY FOR GRAINS. FLOORS? 2025 SALES? GAME PLAN? CHART BREAKDOWNS
12/30/24
GRAINS FADE EARLY HIGHS
12/27/24
STILL LONG TERM UPSIDE POTENTIAL, BUT TAKE ADVANTAGE OF 6 MONTH CORN HIGH
12/26/24
CORN ABOVE 200-DAY MA. ARGY DRY. BEANS +44 CENTS OFF LOWS
12/23/24
CORN & BEANS TALE OF 2 STORIES. BEANS REJECT OLD SUPPORT
12/20/24
PERFECT BOUNCE IN CORN. SIMPLE BEAN BACKTEST BEFORE LOWER?
12/19/24
THE SOYBEAN PROBLEM. NEW WHEAT LOWS. CORN UPTREND
12/18/24
BEANS BREAK SUPPORT & OPEN FLOOD GATES
12/17/24
SINK OR SWIM TIME FOR SOYBEANS
12/16/24
SOYBEANS & WHEAT FIGHTING LOWS. WILL CORN DEMAND CONTINUE
12/13/24
POST USDA COOL OFF
12/12/24
CORN CORRECTION. WHY WE ALERTED SELL SIGNAL YESTERDAY
12/11/24
USDA PRICED IN? FAIR VALUE OF CORN? BEAN BREAKOUT?
12/11/24
CORN SELL SIGNAL
12/10/24
USDA BREAKDOWN
12/9/24
USDA TOMORROW
12/6/24
CORN TRYING TO BREAKOUT. MAKING MARKETING DECISIONS
12/5/24
OPTIMISTIC BOUNCE IN GRAINS
12/4/24
WHEAT UNDERVALUED? MOST RISK IN BEANS. HAVE A GAME PLAN
12/3/24
BEANS HOLDING DESPITE LACK OF BULLISH STORY
12/2/24
TRUMP & BRAZIL HURDLES
11/27/24
CORN SPREADS, CRUCIAL SPOT FOR BEANS, SEASONALITY SAYS BUY
11/26/24