WHY THIS IS MORE THAN A DEAD CAT BOUNCE..
WEEKLY GRAIN NEWSLETTER
Here are some not so fearless comments for www.dailymarketminute.com
Did the dead cat bounce or our are markets still alive?
That was the question for wheat and corn as we ended the week, while the bean market showed strong demand to go along with some heat scares.
Overall the markets still have to be considered disappointing for the bulls. But as the charts below show at least we have a little life.
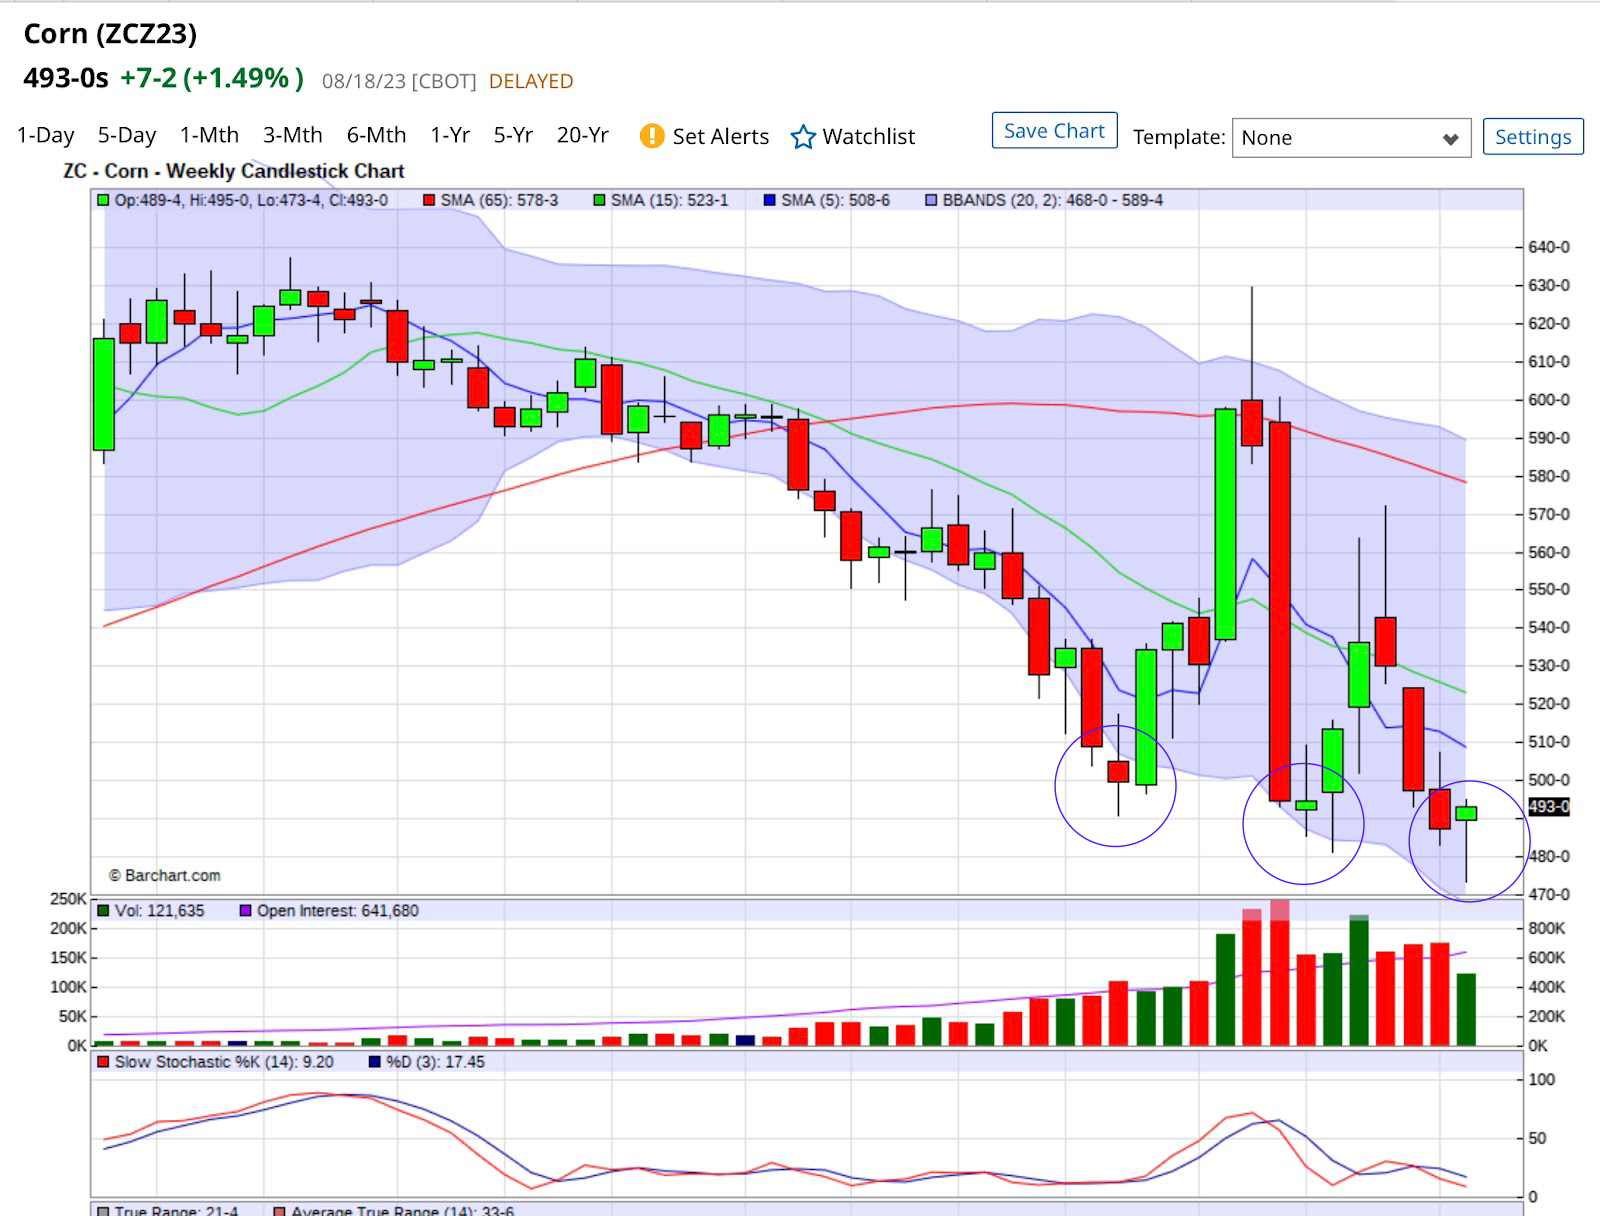
This first chart is a weekly September corn chart. The first thing that sticks out to me is that we left a hammer on the weekly charts, which is similar to what we did a few weeks ago when we left a doji on the charts. It is a bullish signal, last time we rallied 60 plus cents. Don’t be surprised if we can get back 50-75% of what we have lost in the past couple of weeks back. The hot and dry forecast is one that could spark some short covering.
Look at this December corn weekly chart. Notice the tails when we made new lows, followed by the reversal higher.
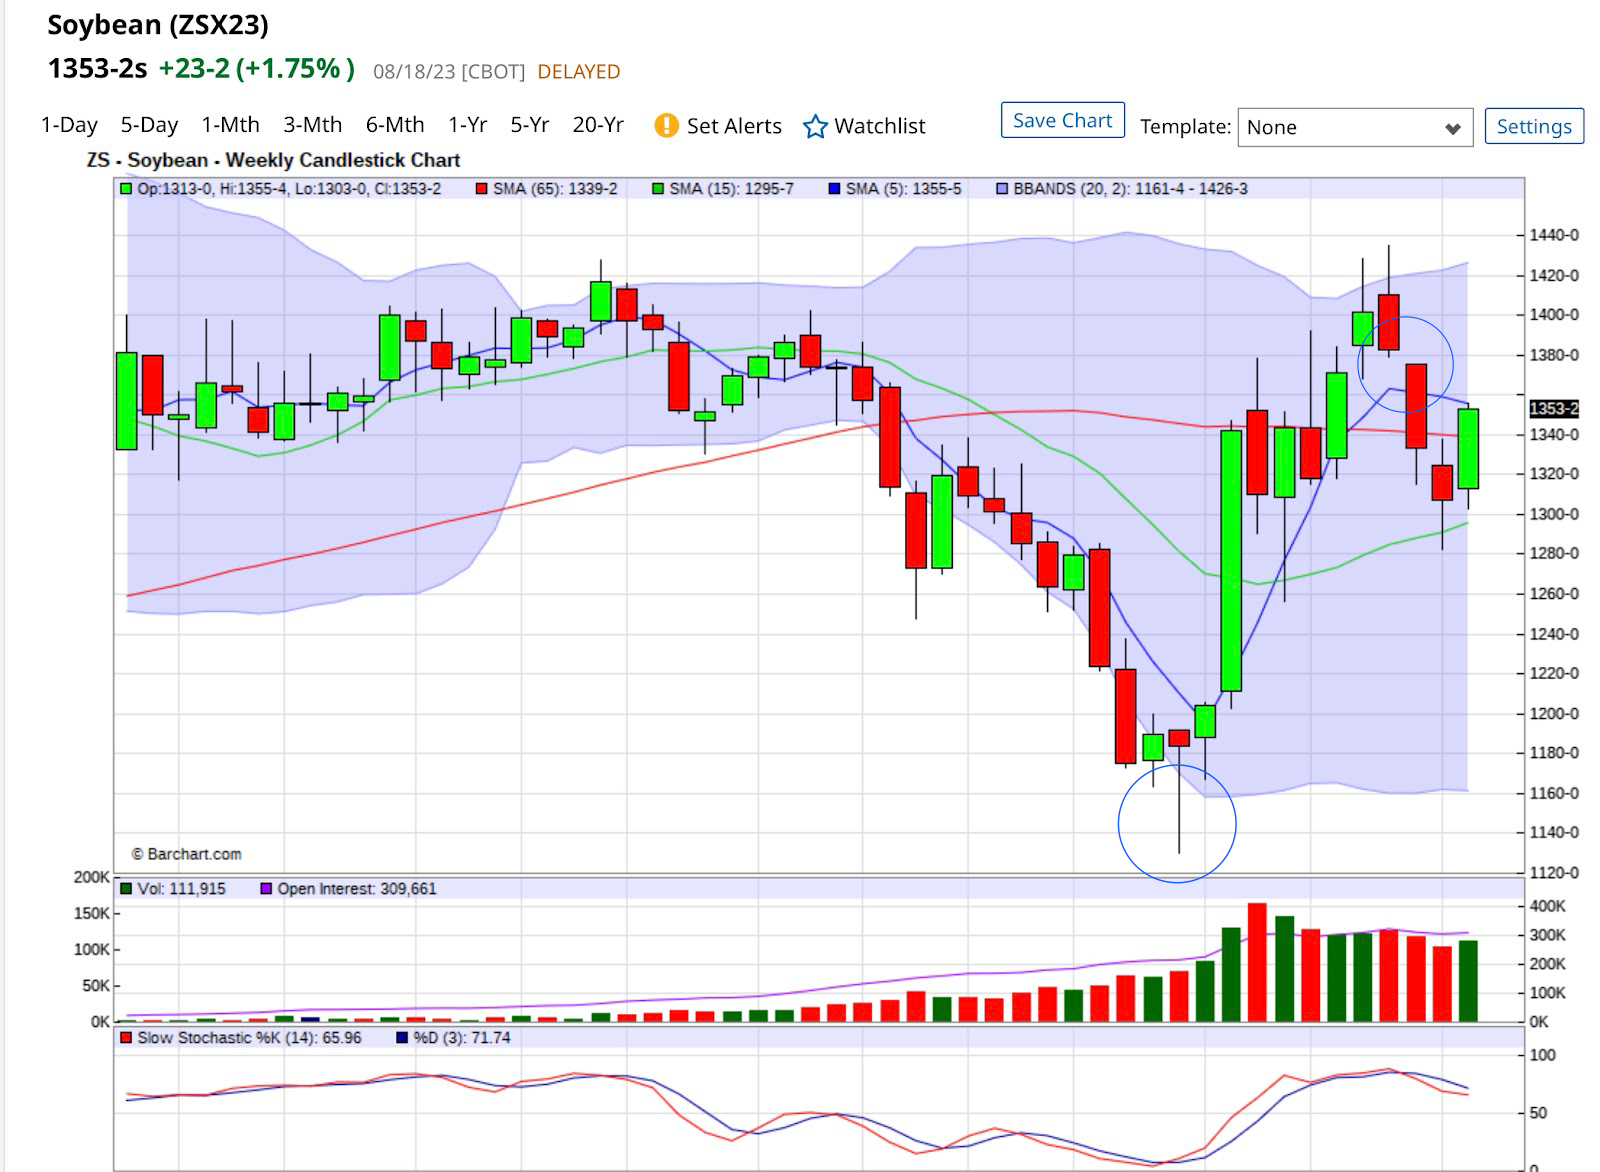
The weekly soybean chart looks like it wants to fill the gap we left a few weeks ago and then perhaps test the highs we had. With demand solid, dry and hot in the forecast don’t rule out new highs despite us getting closer to harvest.
The bean oil situation remains very bullish.. This chart. Is close to an upside breakout.
The weekly soybean oil chart is one that has the demand behind it to go after the all time highs. Don't rule this out. It seems given our fundamental situation it is just a matter of time before we go nuclear or see bean oil prices go parabolic.
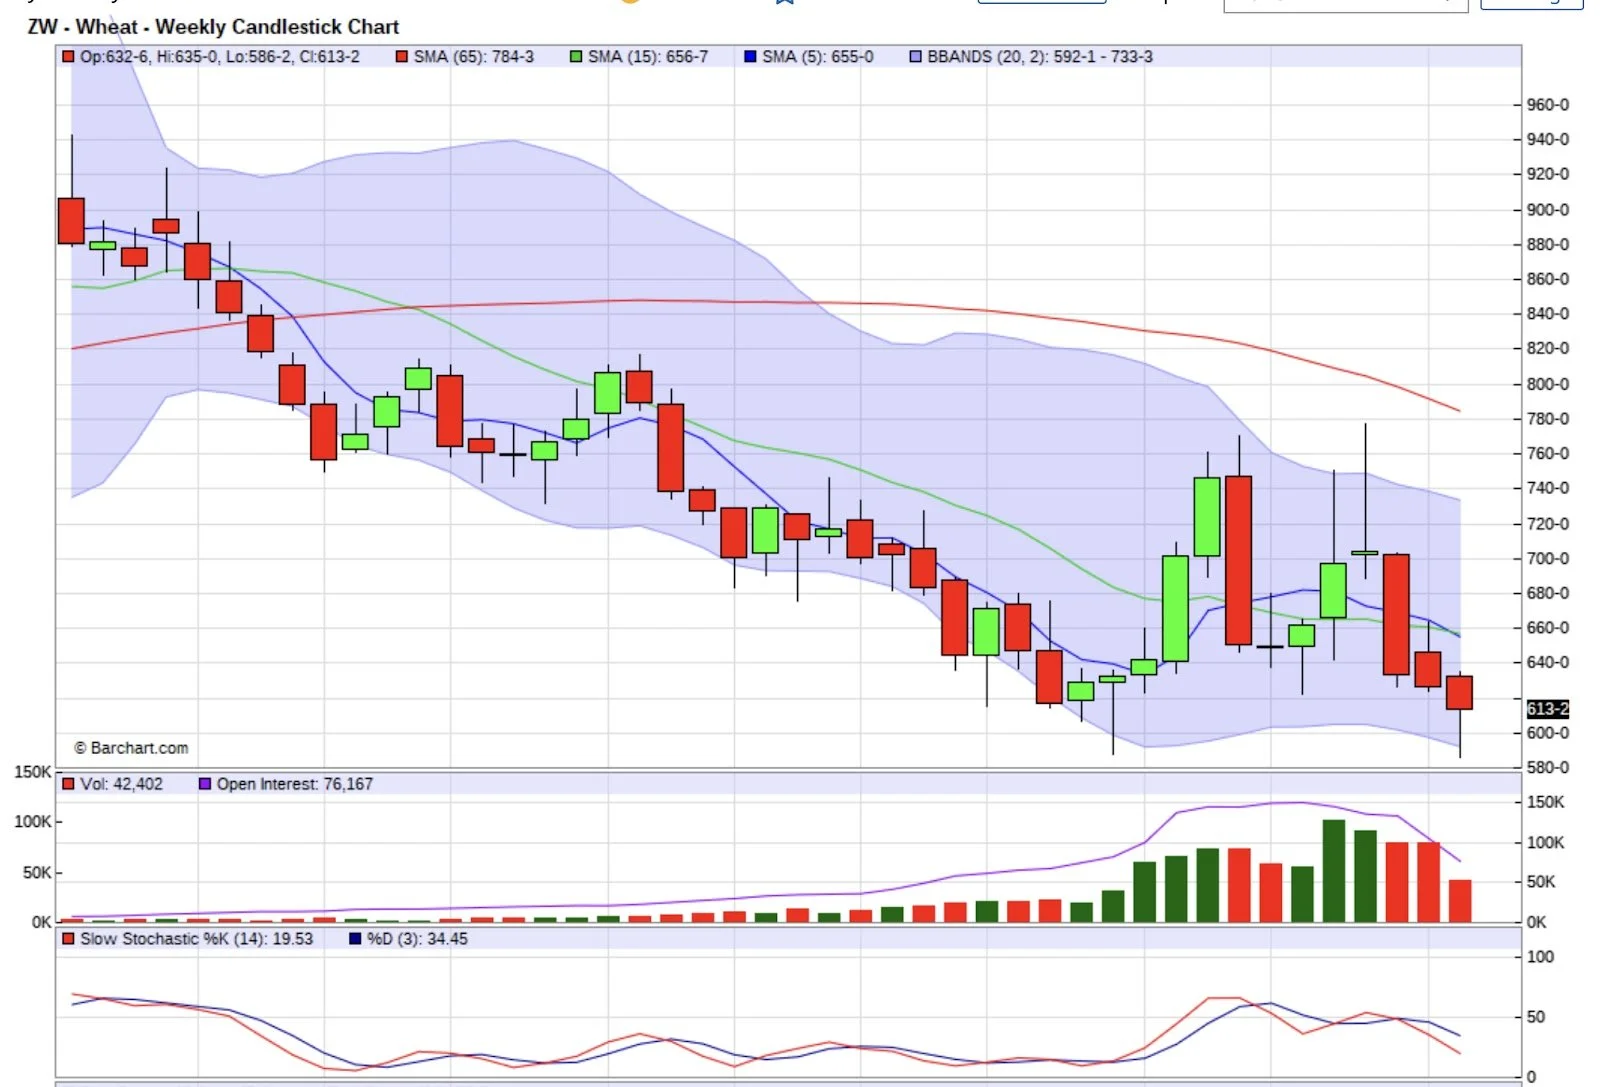
Here is a weekly CBOT wheat chart. Notice the hammer we left. Also a bullish signal. Look for us to run back up to 7-7.50 area.
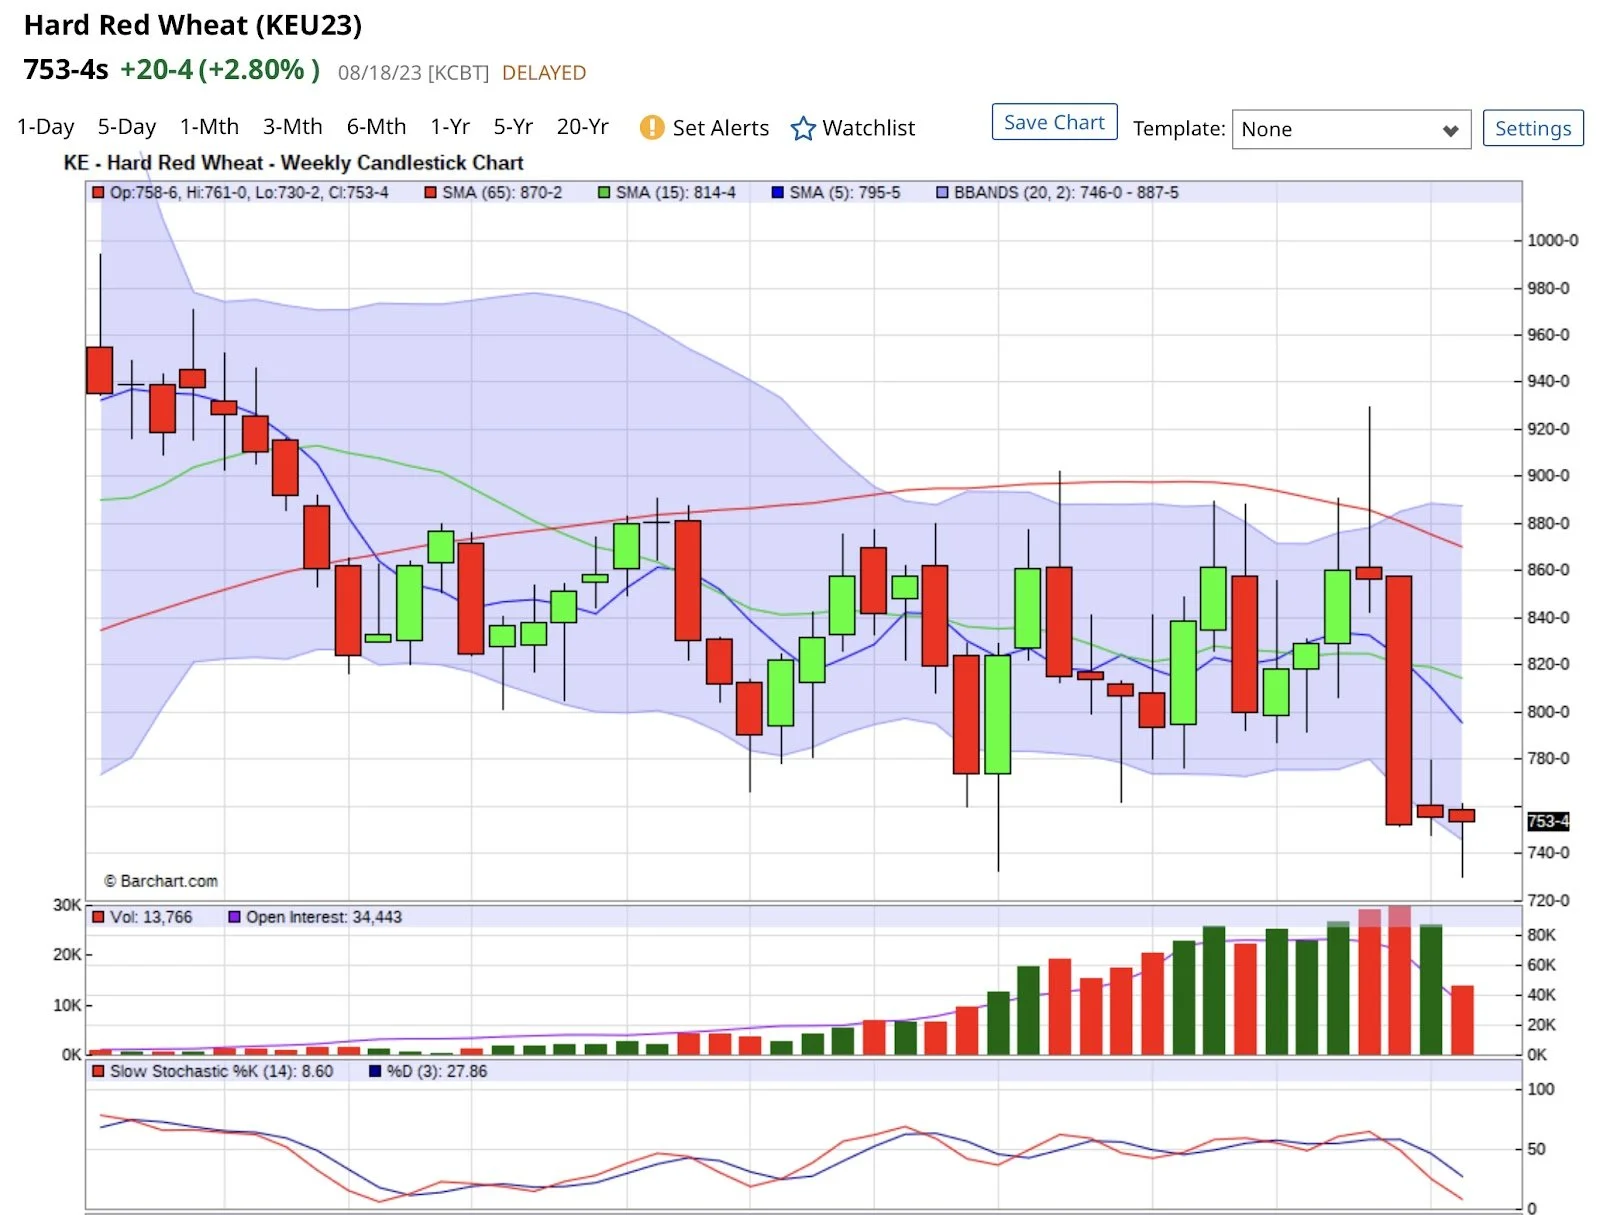
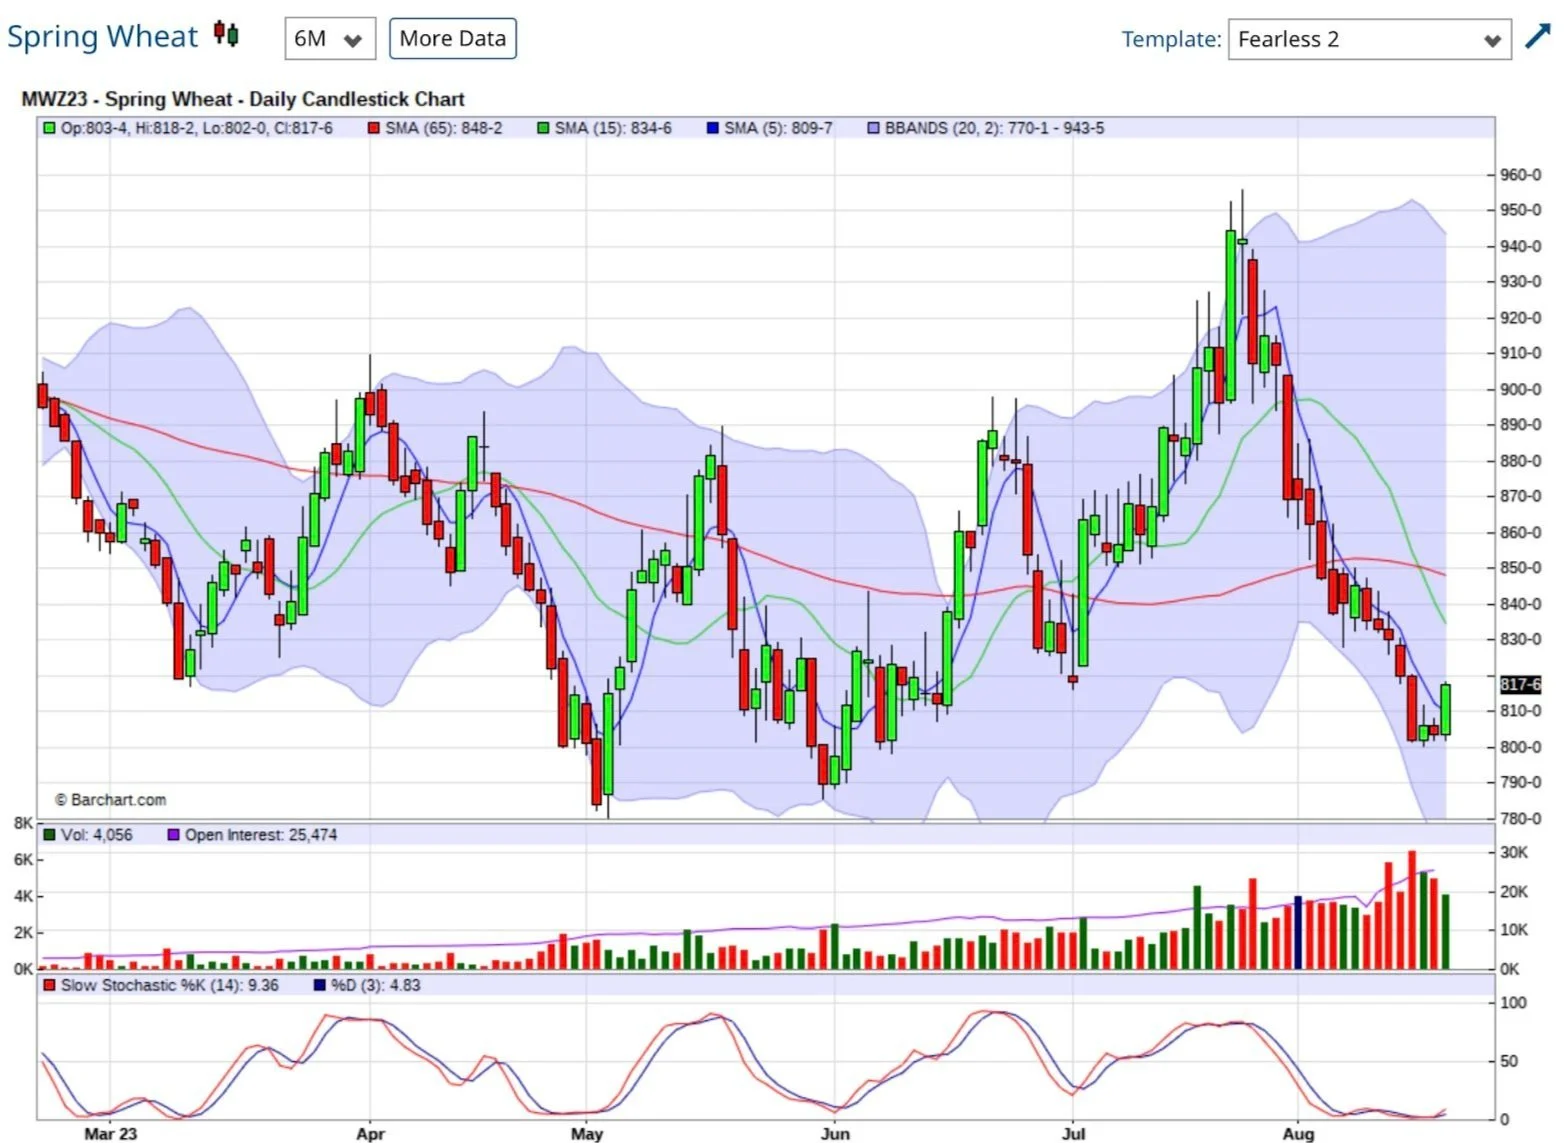
KC wheat also left a hammer. Look for KC wheat to rally back towards 8.00
MPLS wheat should test 9.00 again in the near future.
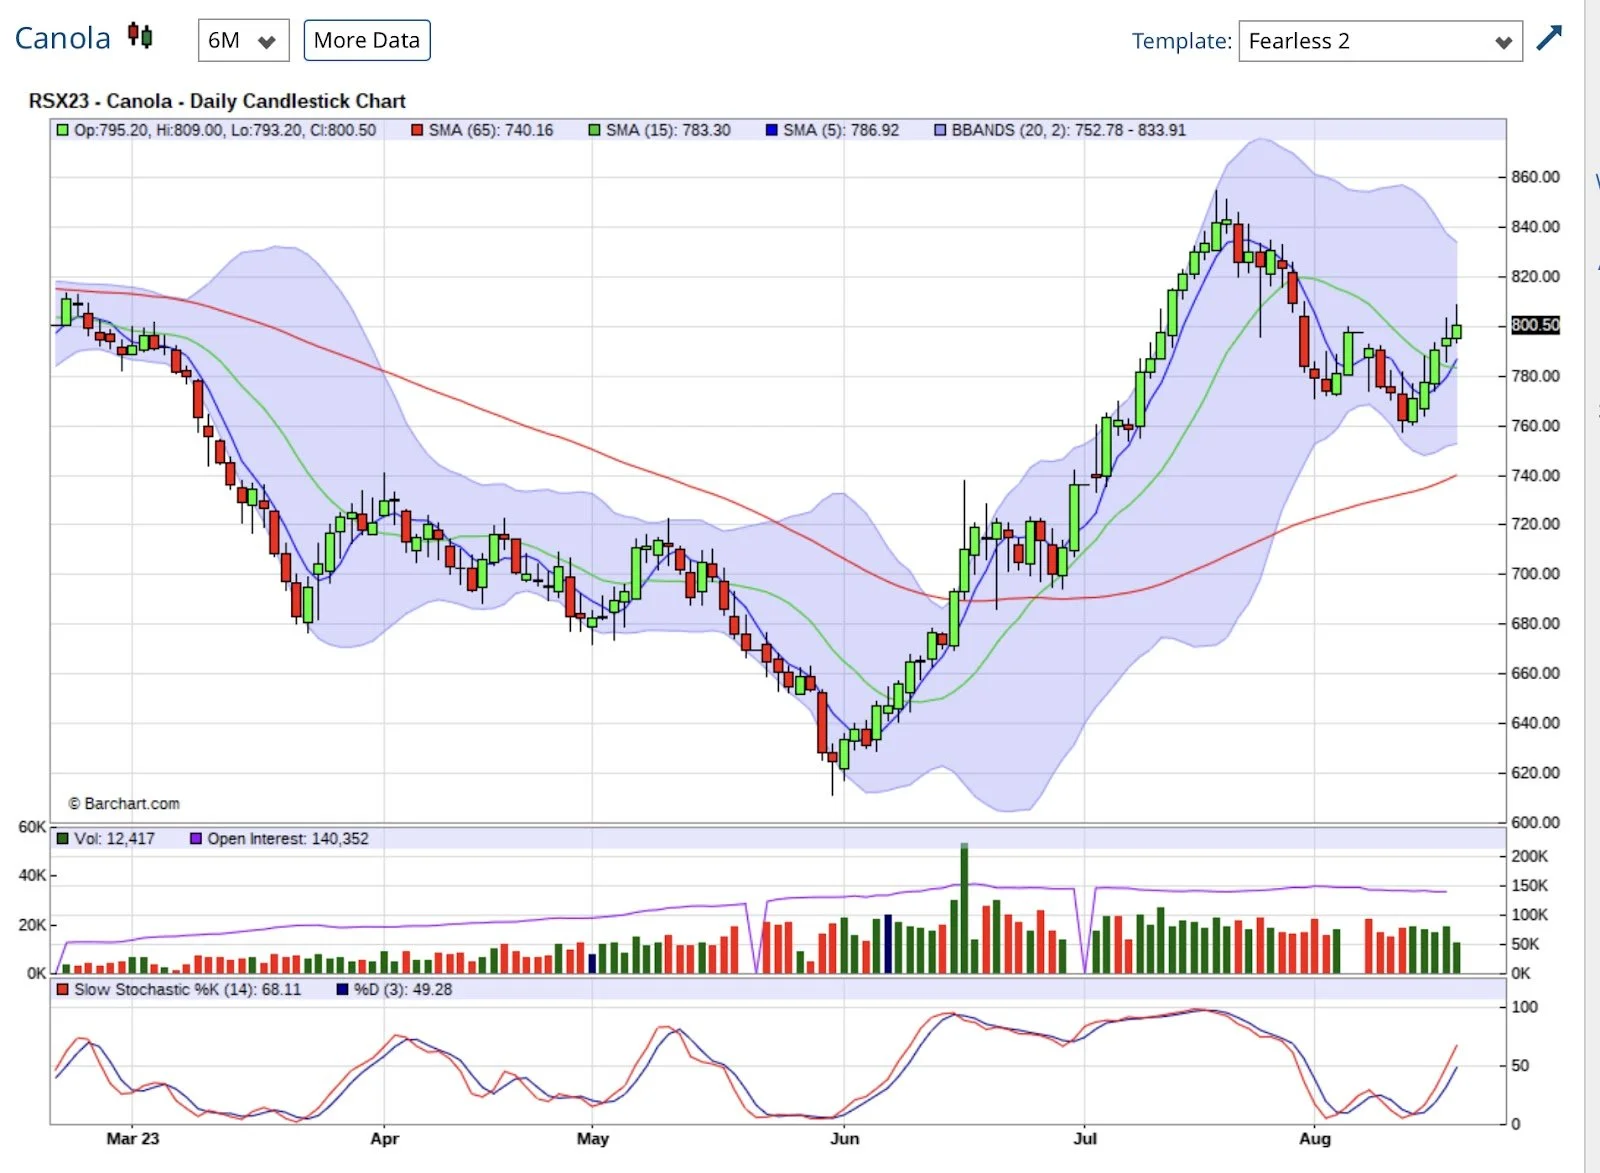
Canola is at a good crossroads; it wouldn't take much to make new highs in the near future.
Below are the fundamental factors that back the chart predictions above…..
The rest of this is subscriber-only content. Please subscribe to keep reading and get every exclusive update sent via text & email.
KEEP READING - GET 50% OFF
Get a huge discount to our daily updates. (Scroll to check out past updates you would have received)
Become a Price Maker. Not a Price Taker.
NOT SURE? TRY 30 DAYS FREE
Try a month completely free, no obligations.
Past Updates
8/18/23 - Market Update
GRAINS BOUNCE. WEATHER REMAINS BULLISH
Read More
8/18/23 - Audio
WEATHER,WAR, & MANAGING RISK
Read More
8/16/23 - Audio
CAN DEMAND & WEATHER LEAD TO A BOUNCE?
8/15/23 - Audio
GRAINS LOWER WITH IMPROVEMENT TO CROPS
8/14/23 - Audio
BEANS RALLY BUT CONDITIONS IMPROVE & WHEAT DISAPPOINTS
8/13/23 - Weekly Grain Newsletter
WHAT’S NEXT FOLLOWING DISAPPOINTING USDA REPORT?
8/11/23 - Audio & Report Recap
USDA REPORT BREAKDOWN
Read More
8/10/23 - Audio

