
FULL USDA REPORT BREAKDOWN
AUDIO & WEEKLY WRAP
USDA continued job of manipulating markets with big headline of “yield increase” although production didn’t increase much by dropping harvested acres
World stocks bearish. China reported big crop
How will we know when we make lows?
Kick the can down the road on Brazil
Wheat numbers somewhat friendly
Despite lower prices, the action was friendly
Adding to your net price and making sales that make sense
What is going to drive the markets and stop the bleeding?
Full write up & numbers below audio*
Listen to today’s audio here
Weekly Wrap & Report Breakdown
Prefer to Listen? Audio Version
Monday we opened lower, continuing the weakness from the brutal first week of the new year.
Next saw a little bit of a turnaround Tuesday. Then we had the CONAB numbers on Wednesday. They didn’t trim Brazil production as much as bulls would have liked.
Then yesterday was a disappointing day as soybeans were +13 cents higher but ended the day unchanged.
Lastly.. today's USDA report.
Overall it was bearish, as expected. Almost everyone was expecting a bearish report and that is exactly what we got.
Despite the awful report, the price action wasn’t all that bad. We had an impressive bounce across the board.
Corn had the most bearish report, yet closed +6 cents off it's lows and down over a dime on the day.
Soybeans were down over a massive -30 cents following the report, but rallied +20 cents off their lows to close down just -12 cents.
The wheat market also rallied a dime off their lows, down almost -8 cents on the day.
Here were the weekly price changes.

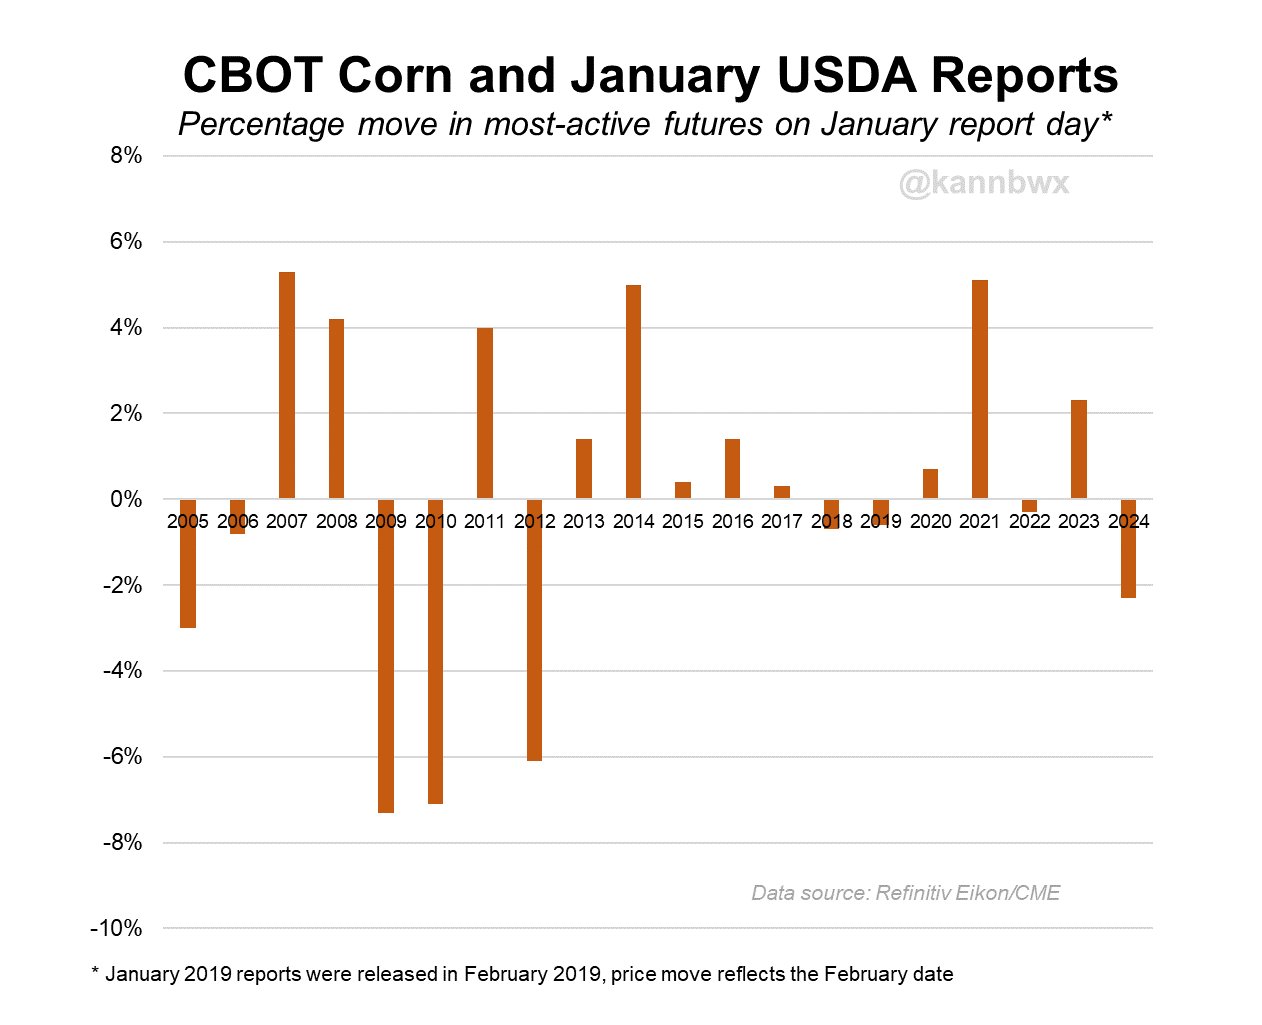
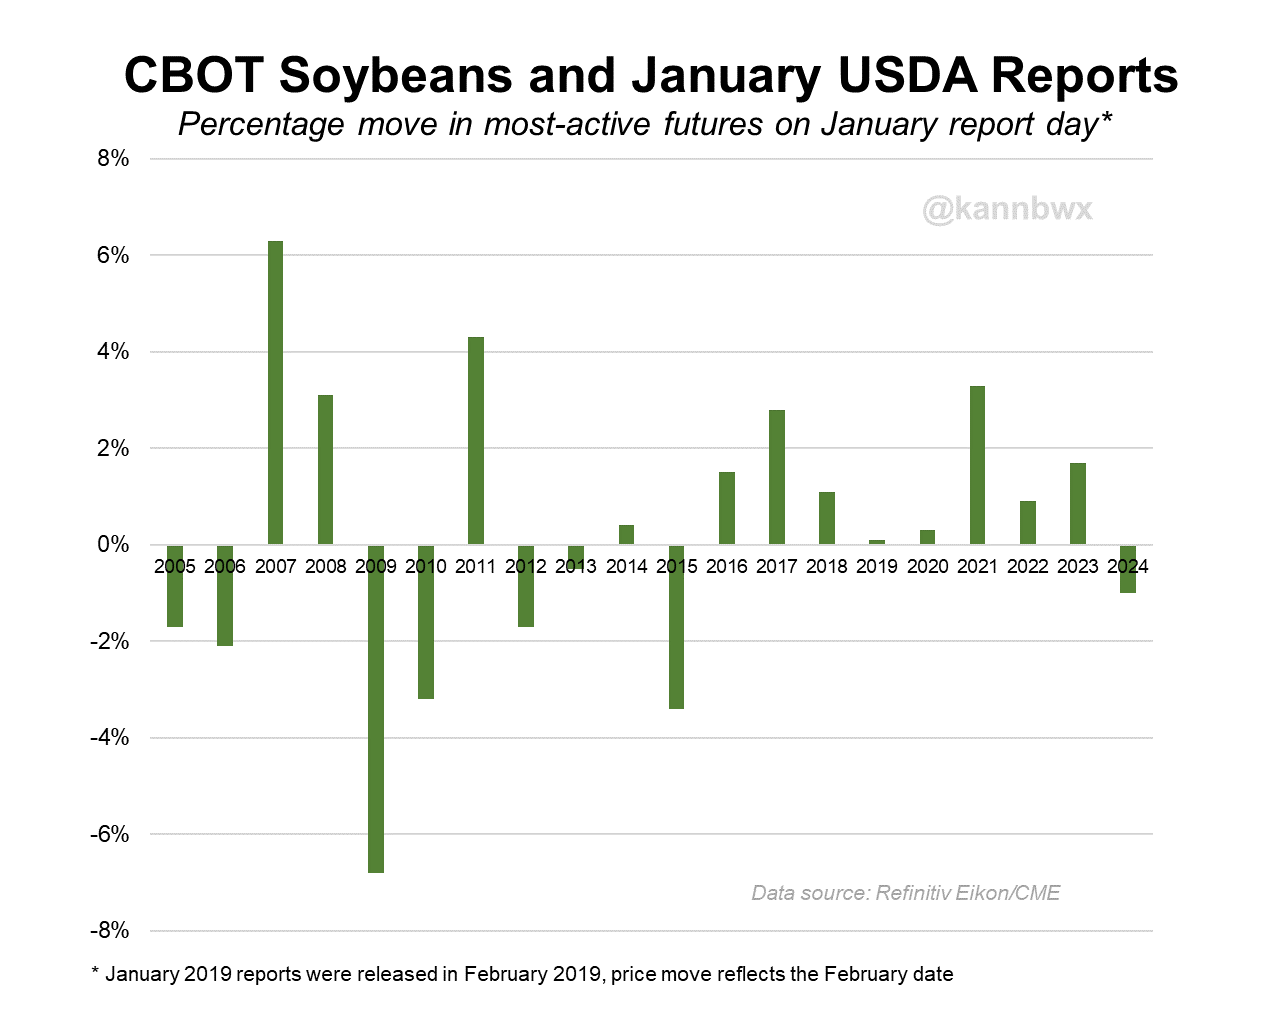
This is how today's report shaped up with previous years.
Credit to Karen Braun for these next two charts.
For corn, this was the worst performance for the January report in 12 years, since 2012.
For beans, this was the first time in 9 years that beans traded lower on this report.
Now let's take a look at the report numbers.
First we had the USDA raise US production and yield. This was the biggest surprise as nobody saw this one coming, but yesterday we pointed out that this was a very real possibility of happening because the USDA does things no one expects.
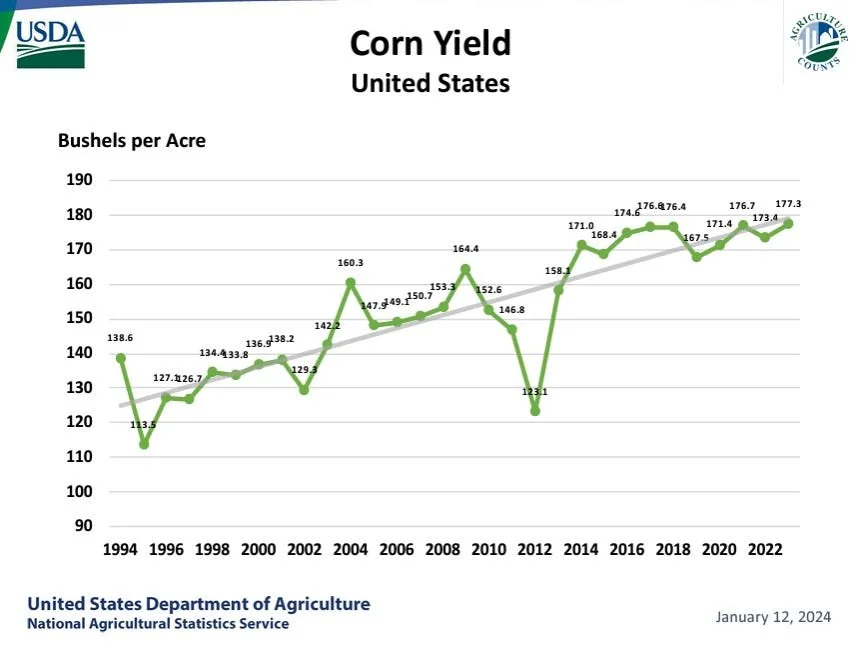
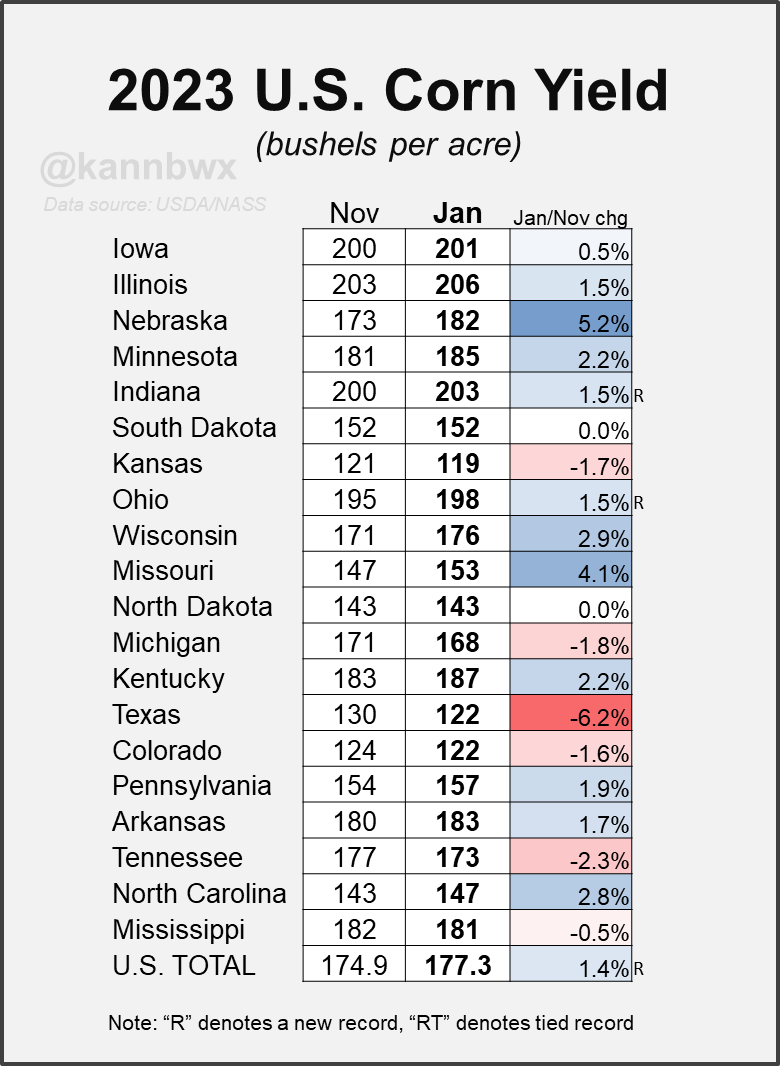
They raised corn yield from 174.9 to a whopping 177.3 which is a record yield. This was 1 bushel higher than the highest pre-report estimate.
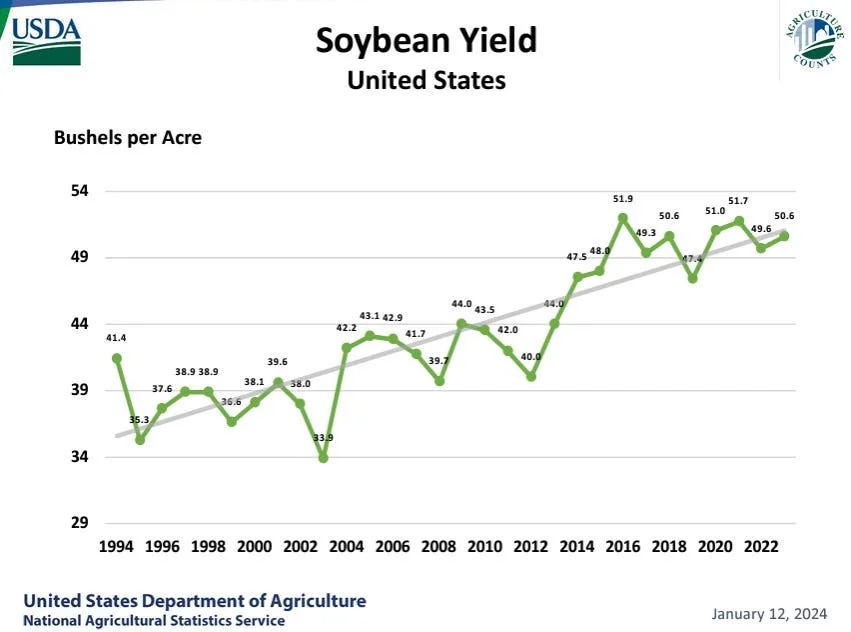
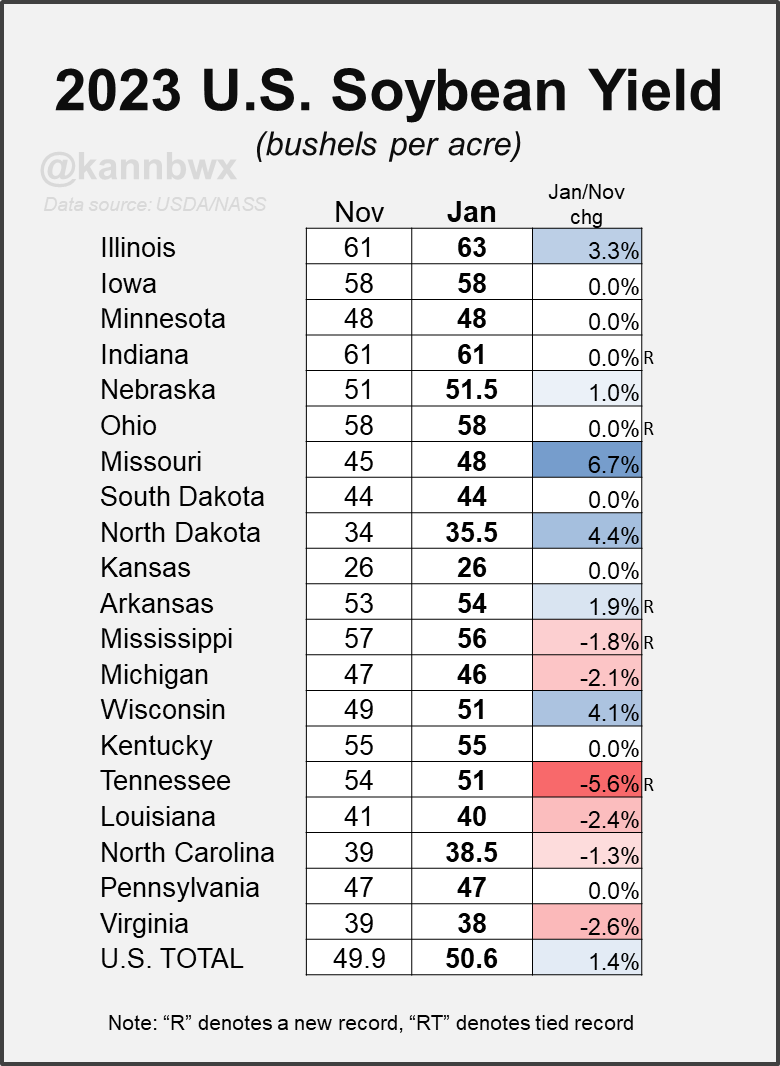
They also raised beans from 49.9 to 50.6. This was still below trend line and far from the record of 51.9.
Here is what I said Wednesday:
"This report can bring surprises. So what are some surprises to look out for? The trade is expecting US yield to come in unchanged from November. No one is expecting yield to increase. So yes, that is a possibility and a risk. Especially considering all of the areas where it looked like they wouldn't have much of a crop end up having a decent one."
"I am also being very aware that there is a chance the USDA slightly bumps both corn and bean yields. If you take a look at the trade range for US corn yield, there is more risk of a big number than a small number with the ranges being 174 to 176.5 compared to November's 174.9."
Yes this big of a jump especially in corn yield shocked the market, but we knew this was a potential risk not many were talking about.
Todays corn yield was the biggest shock to the upside on January yield since 2009.

Here are the updated trendline yield charts.
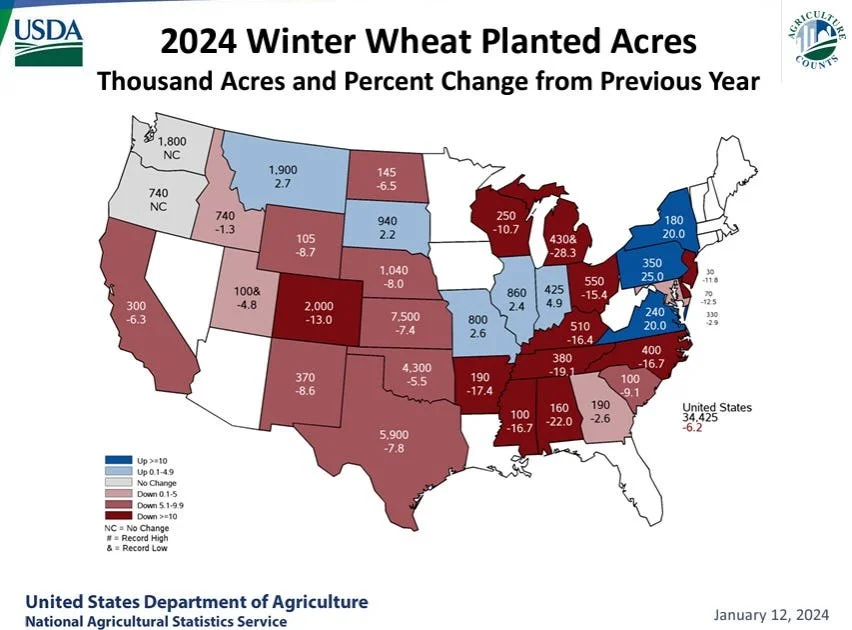
Here are state by state breakdown charts from Karen Braun.
They include yield changes as well as harvested acres.
First for corn. Many states saw some big improvements. Nearly every state saw an improvement aside from a select few including Texas, Kansas, Tennessee, Colorado, and Michigan.
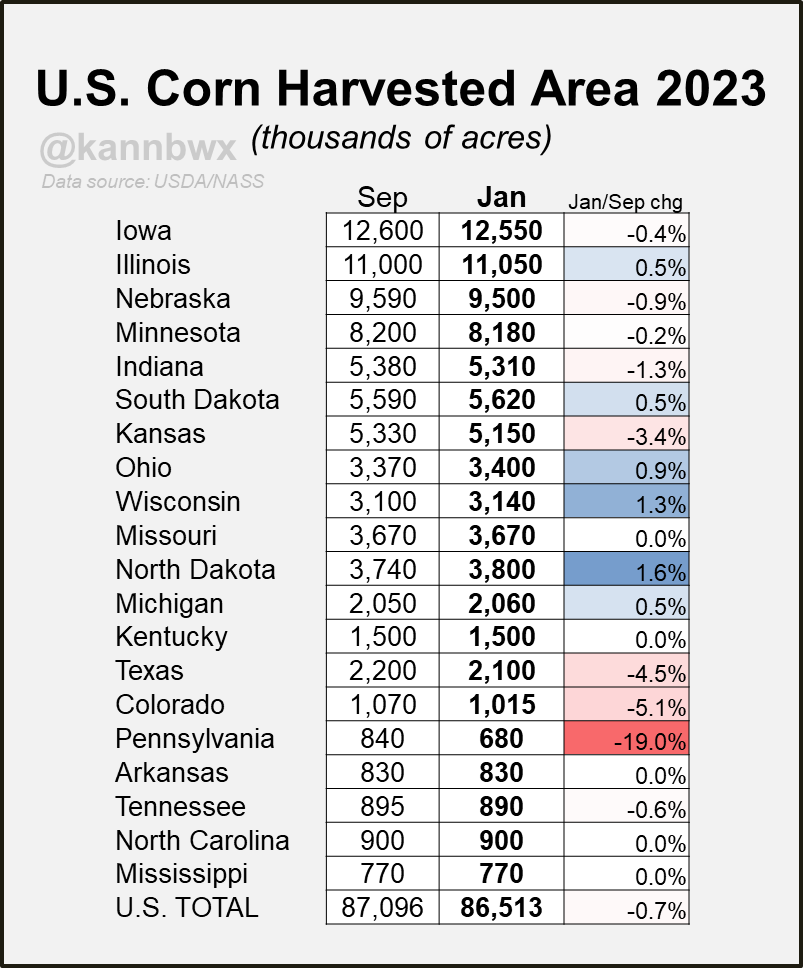
Harvested acres came in slightly lower than the trade estimates.
We should be thankful the harvested acres numbers at least dropped, or the negative effect on prices would have been even worse.
The lower acres limits the larger yields effect on production.
Soybean yield came in at a 2 year high but was below trend line.
The main boost came from Illinois and Missouri.
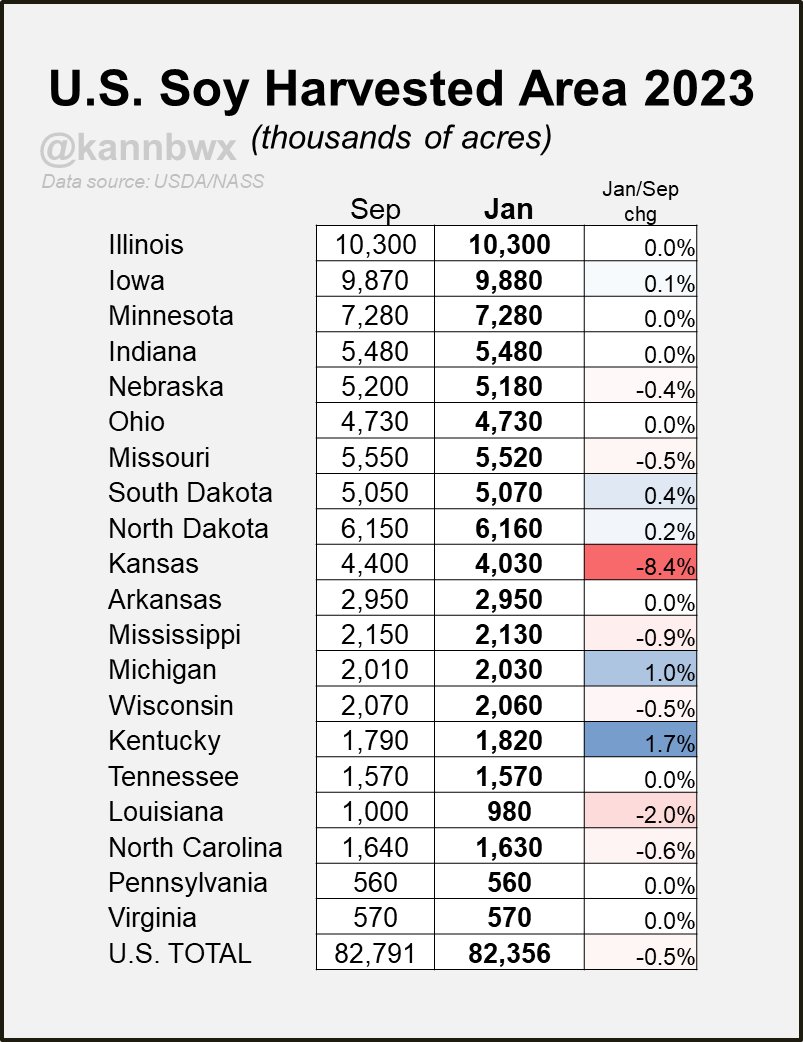
Here is the harvested acres, not any major changes to the top producing states. Again, it was beneficial that these harvested acres came in low.
Next was South America. This was one of the most highly anticipated numbers.
Most figured they would play it slow. I mean CONAB came in at 155 for their Brazil beans, and the USDA will almost always come in higher than them. So the USDA came in at 157.
Despite most of the recent private estimates being in the 145 to 152 range.
One thing I found disappointing was the fact that the USDA came in at 127 for their Brazil corn, while CONAB was FAR lower at 117.6

Wheat plantings came in below estimates, we said this would be one that could surprise.
It was a slight bullish surprise but nothing to write home about.

Now endings stocks.
US endings stocks didn’t see any major changes.
Wheat was slightly below estimates which was friendly.
Corn and beans both came in higher than estimates but were within the expected ranges.

Now this next number was perceived as very bearish for corn.
Corn came in a whopping +12 million tons higher than the trade was expecting.
The trade was actually expecting a -2 million drop, but instead we got a +10 million increase.
Why was this number so high?
Remember a while back when China reported a record corn crop and everyone thought they were lying. This number took into account for the crop that China reported.
From Karen Braun:
"It's important to note that World-China corn stocks were up marginally from last month. Yes the total number is bigger, but Chinese supplies are not accessible to the global market and they may not influence the amount of corn China plans to import. Wouldn’t fret over this number."
The soybean number was also slightly higher due to the gains in Argentina's crop in this report out weighing the losses in Brazil's crop.
Wheat slightly higher as well with both Russia and Ukraine crops and exports moving higher.

Lastly we had the Quarterly Grain Stocks for the US.
These all came in above expectations.

So now that we got the report out of the way, I wanted to take a look at some history.
Credit to Wright on the Market for pointing this out.
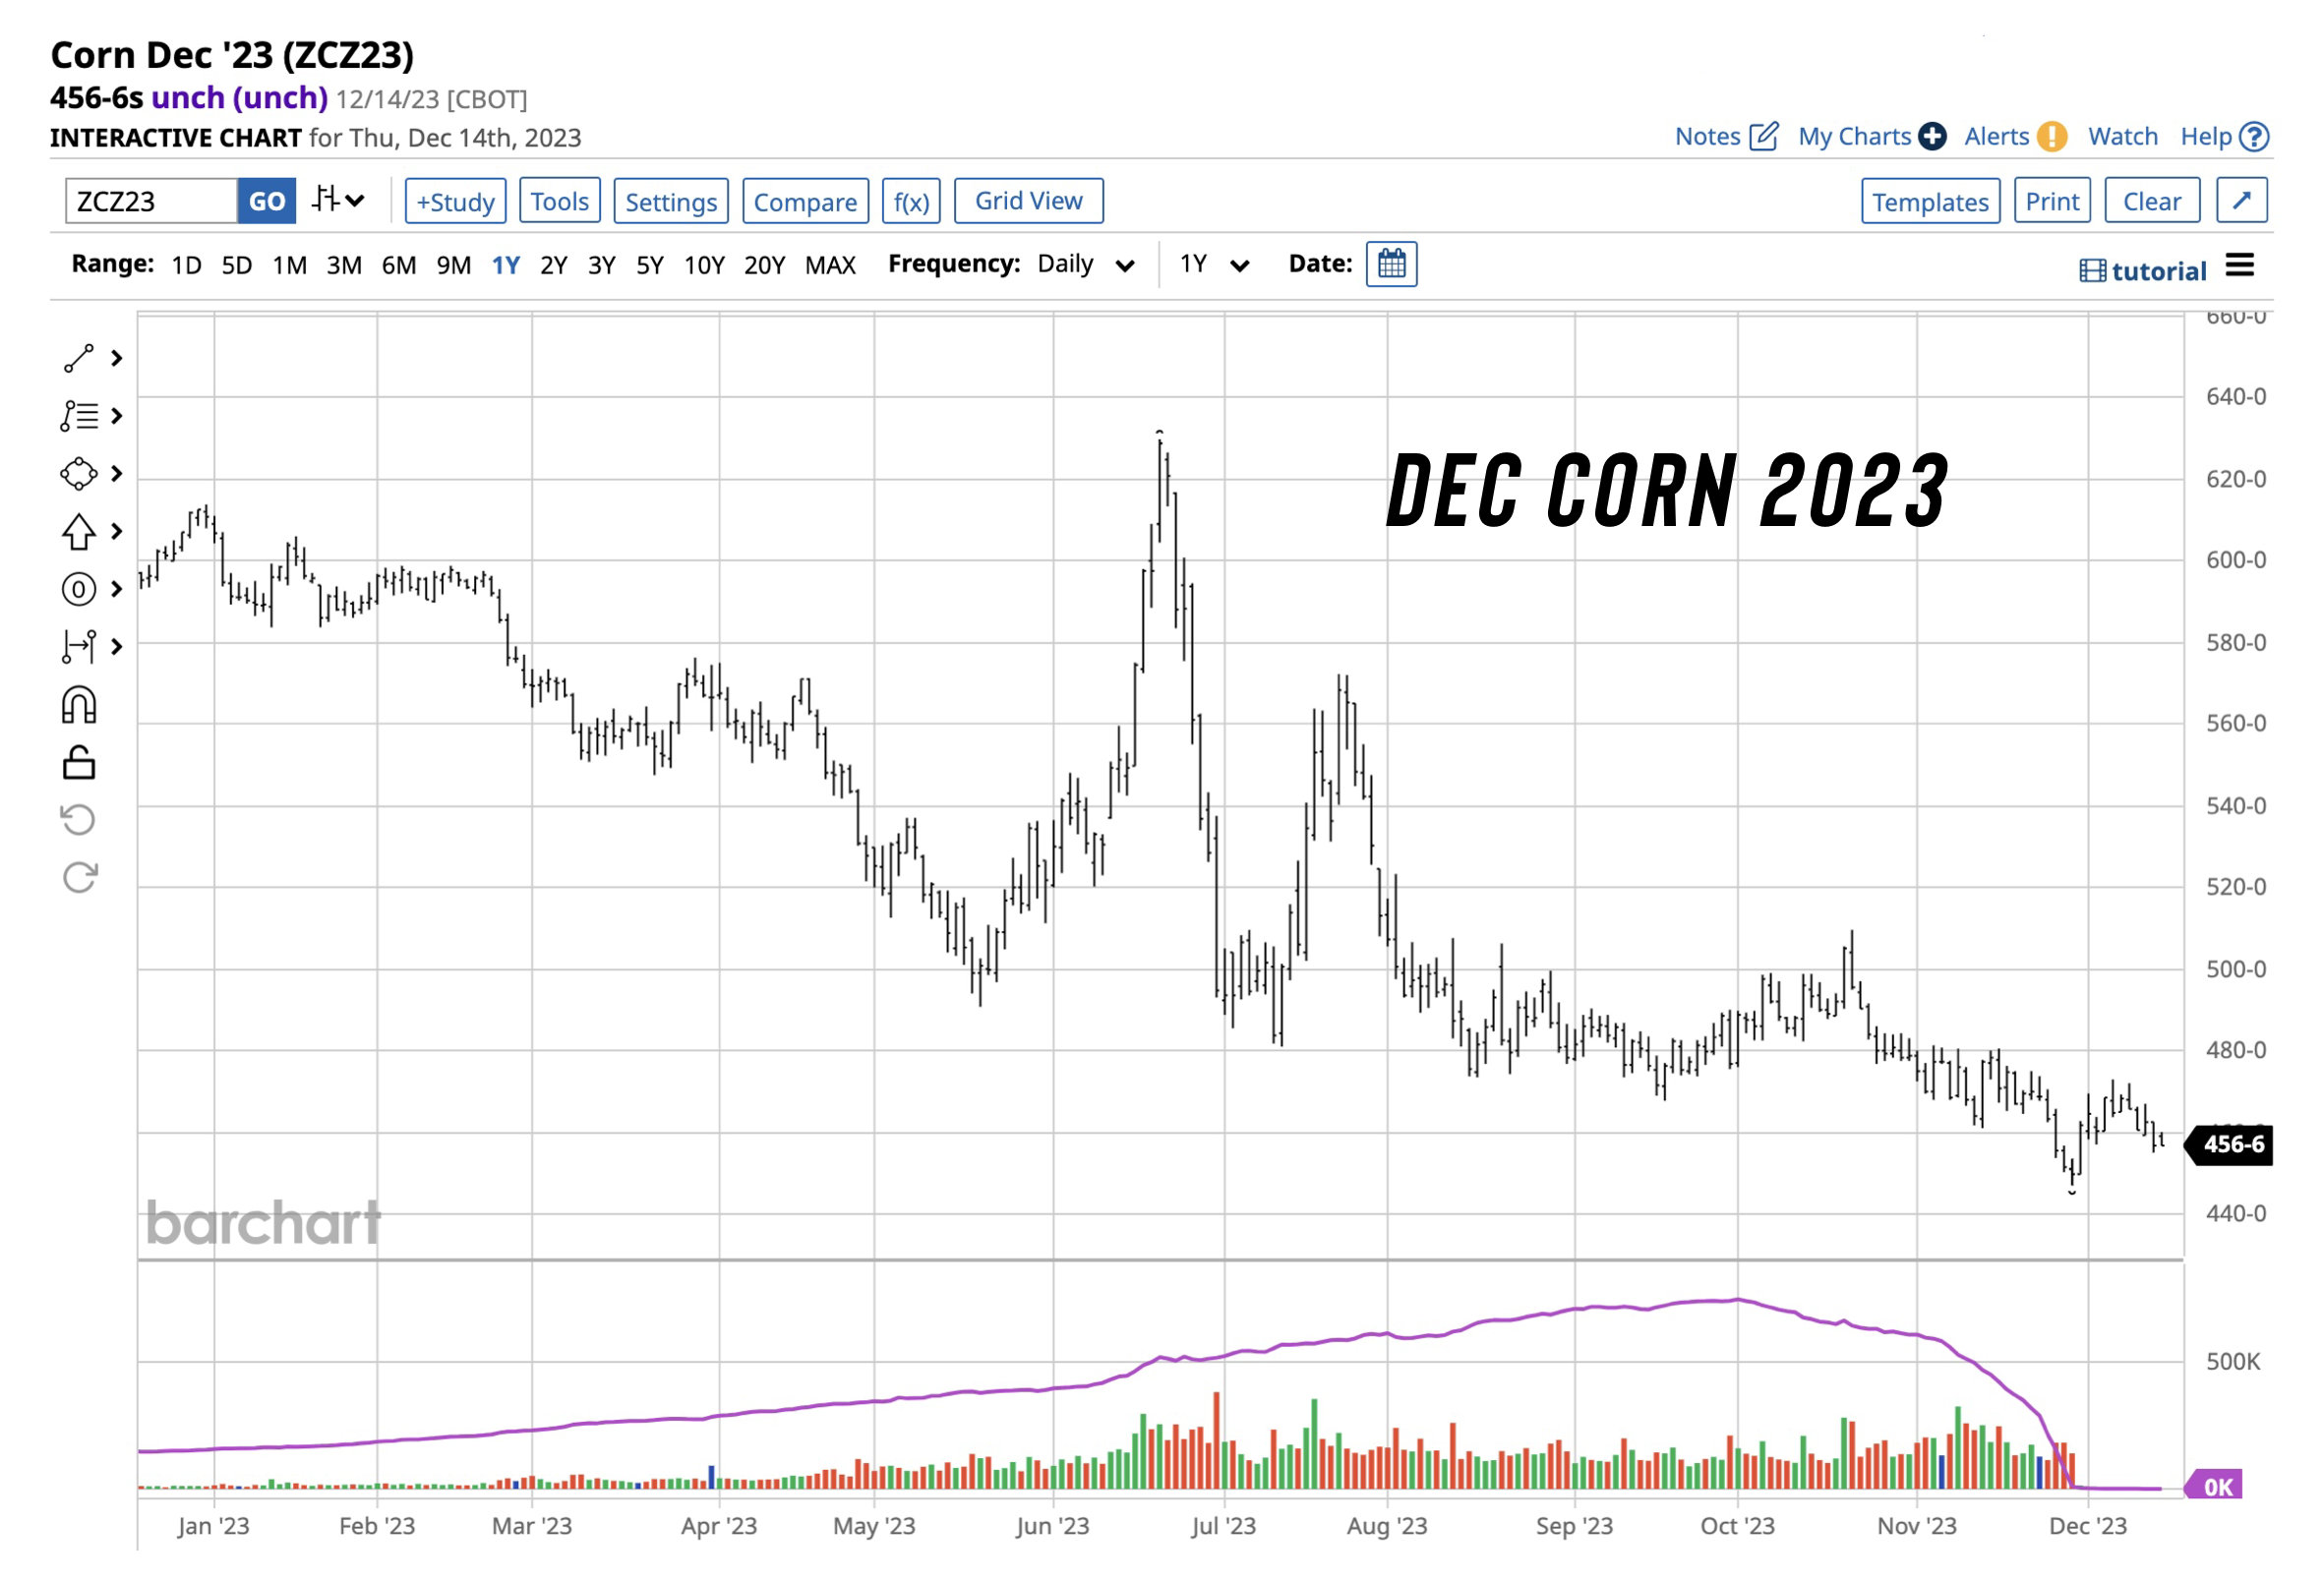
Everyone compared 2023 to that of 2013.
If you take a look at these two corn charts, very similar. Aside from the drought scare and spike in June.
This is the December 2013 and December 2023 charts.
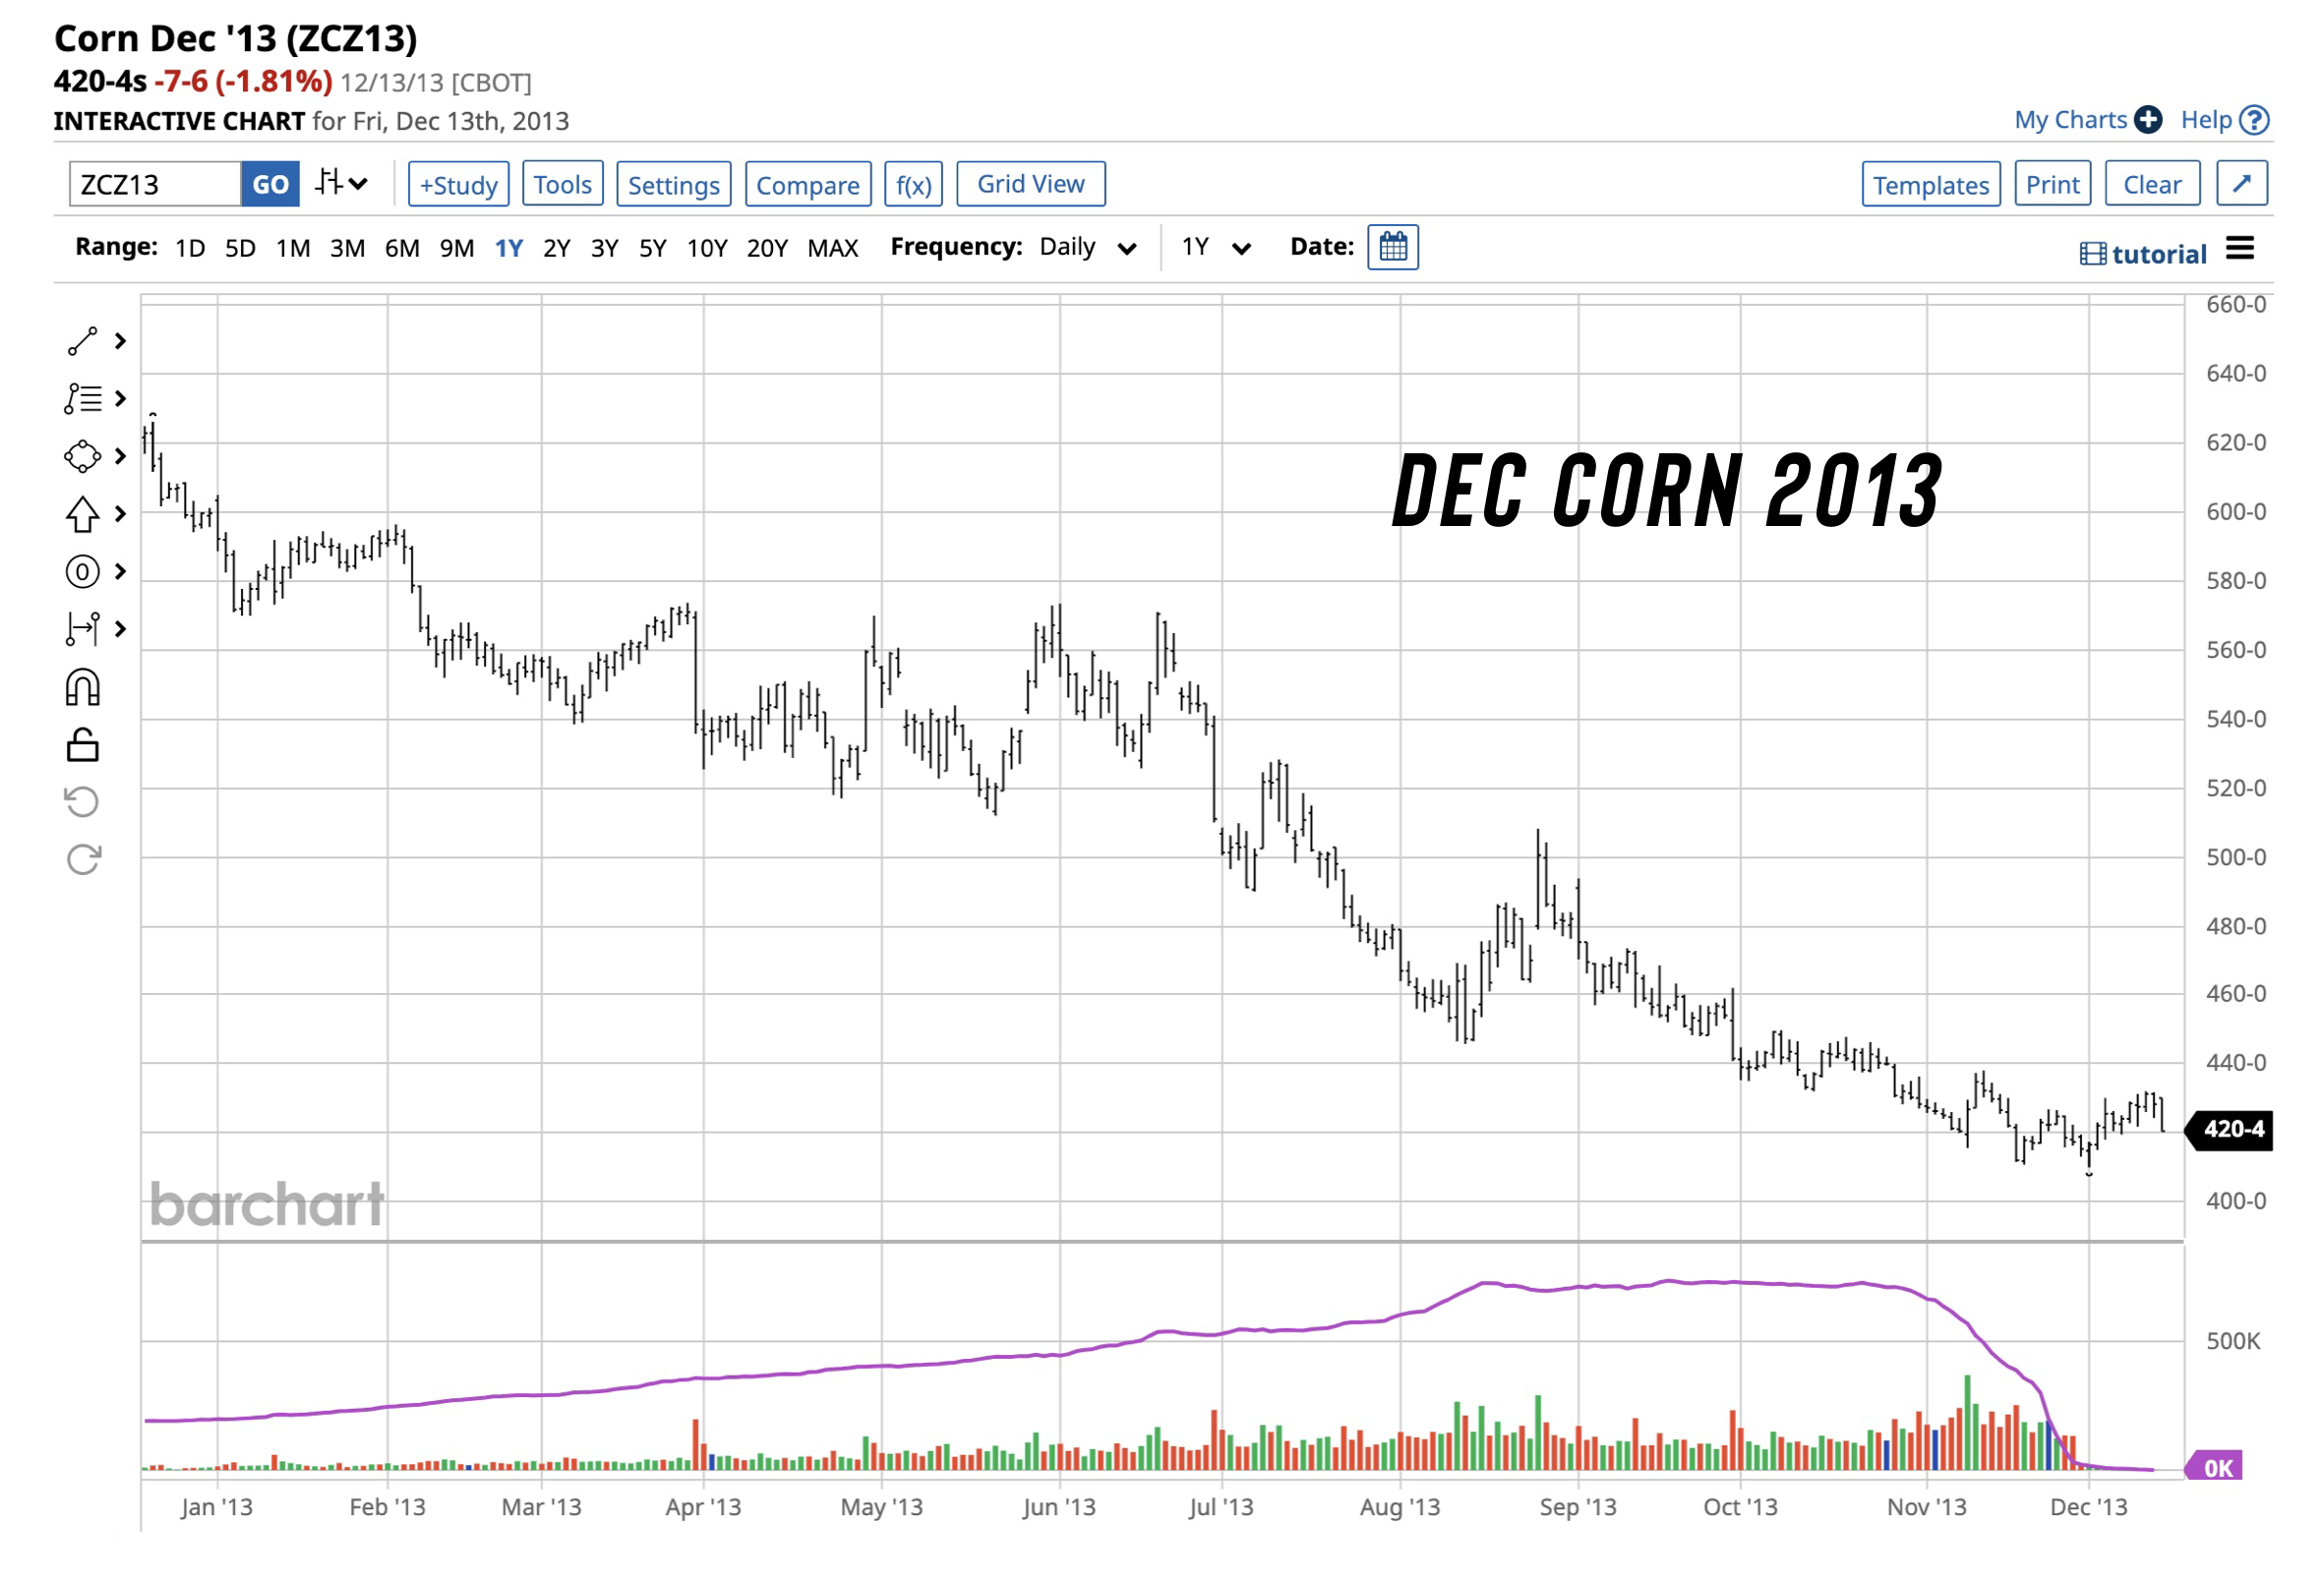
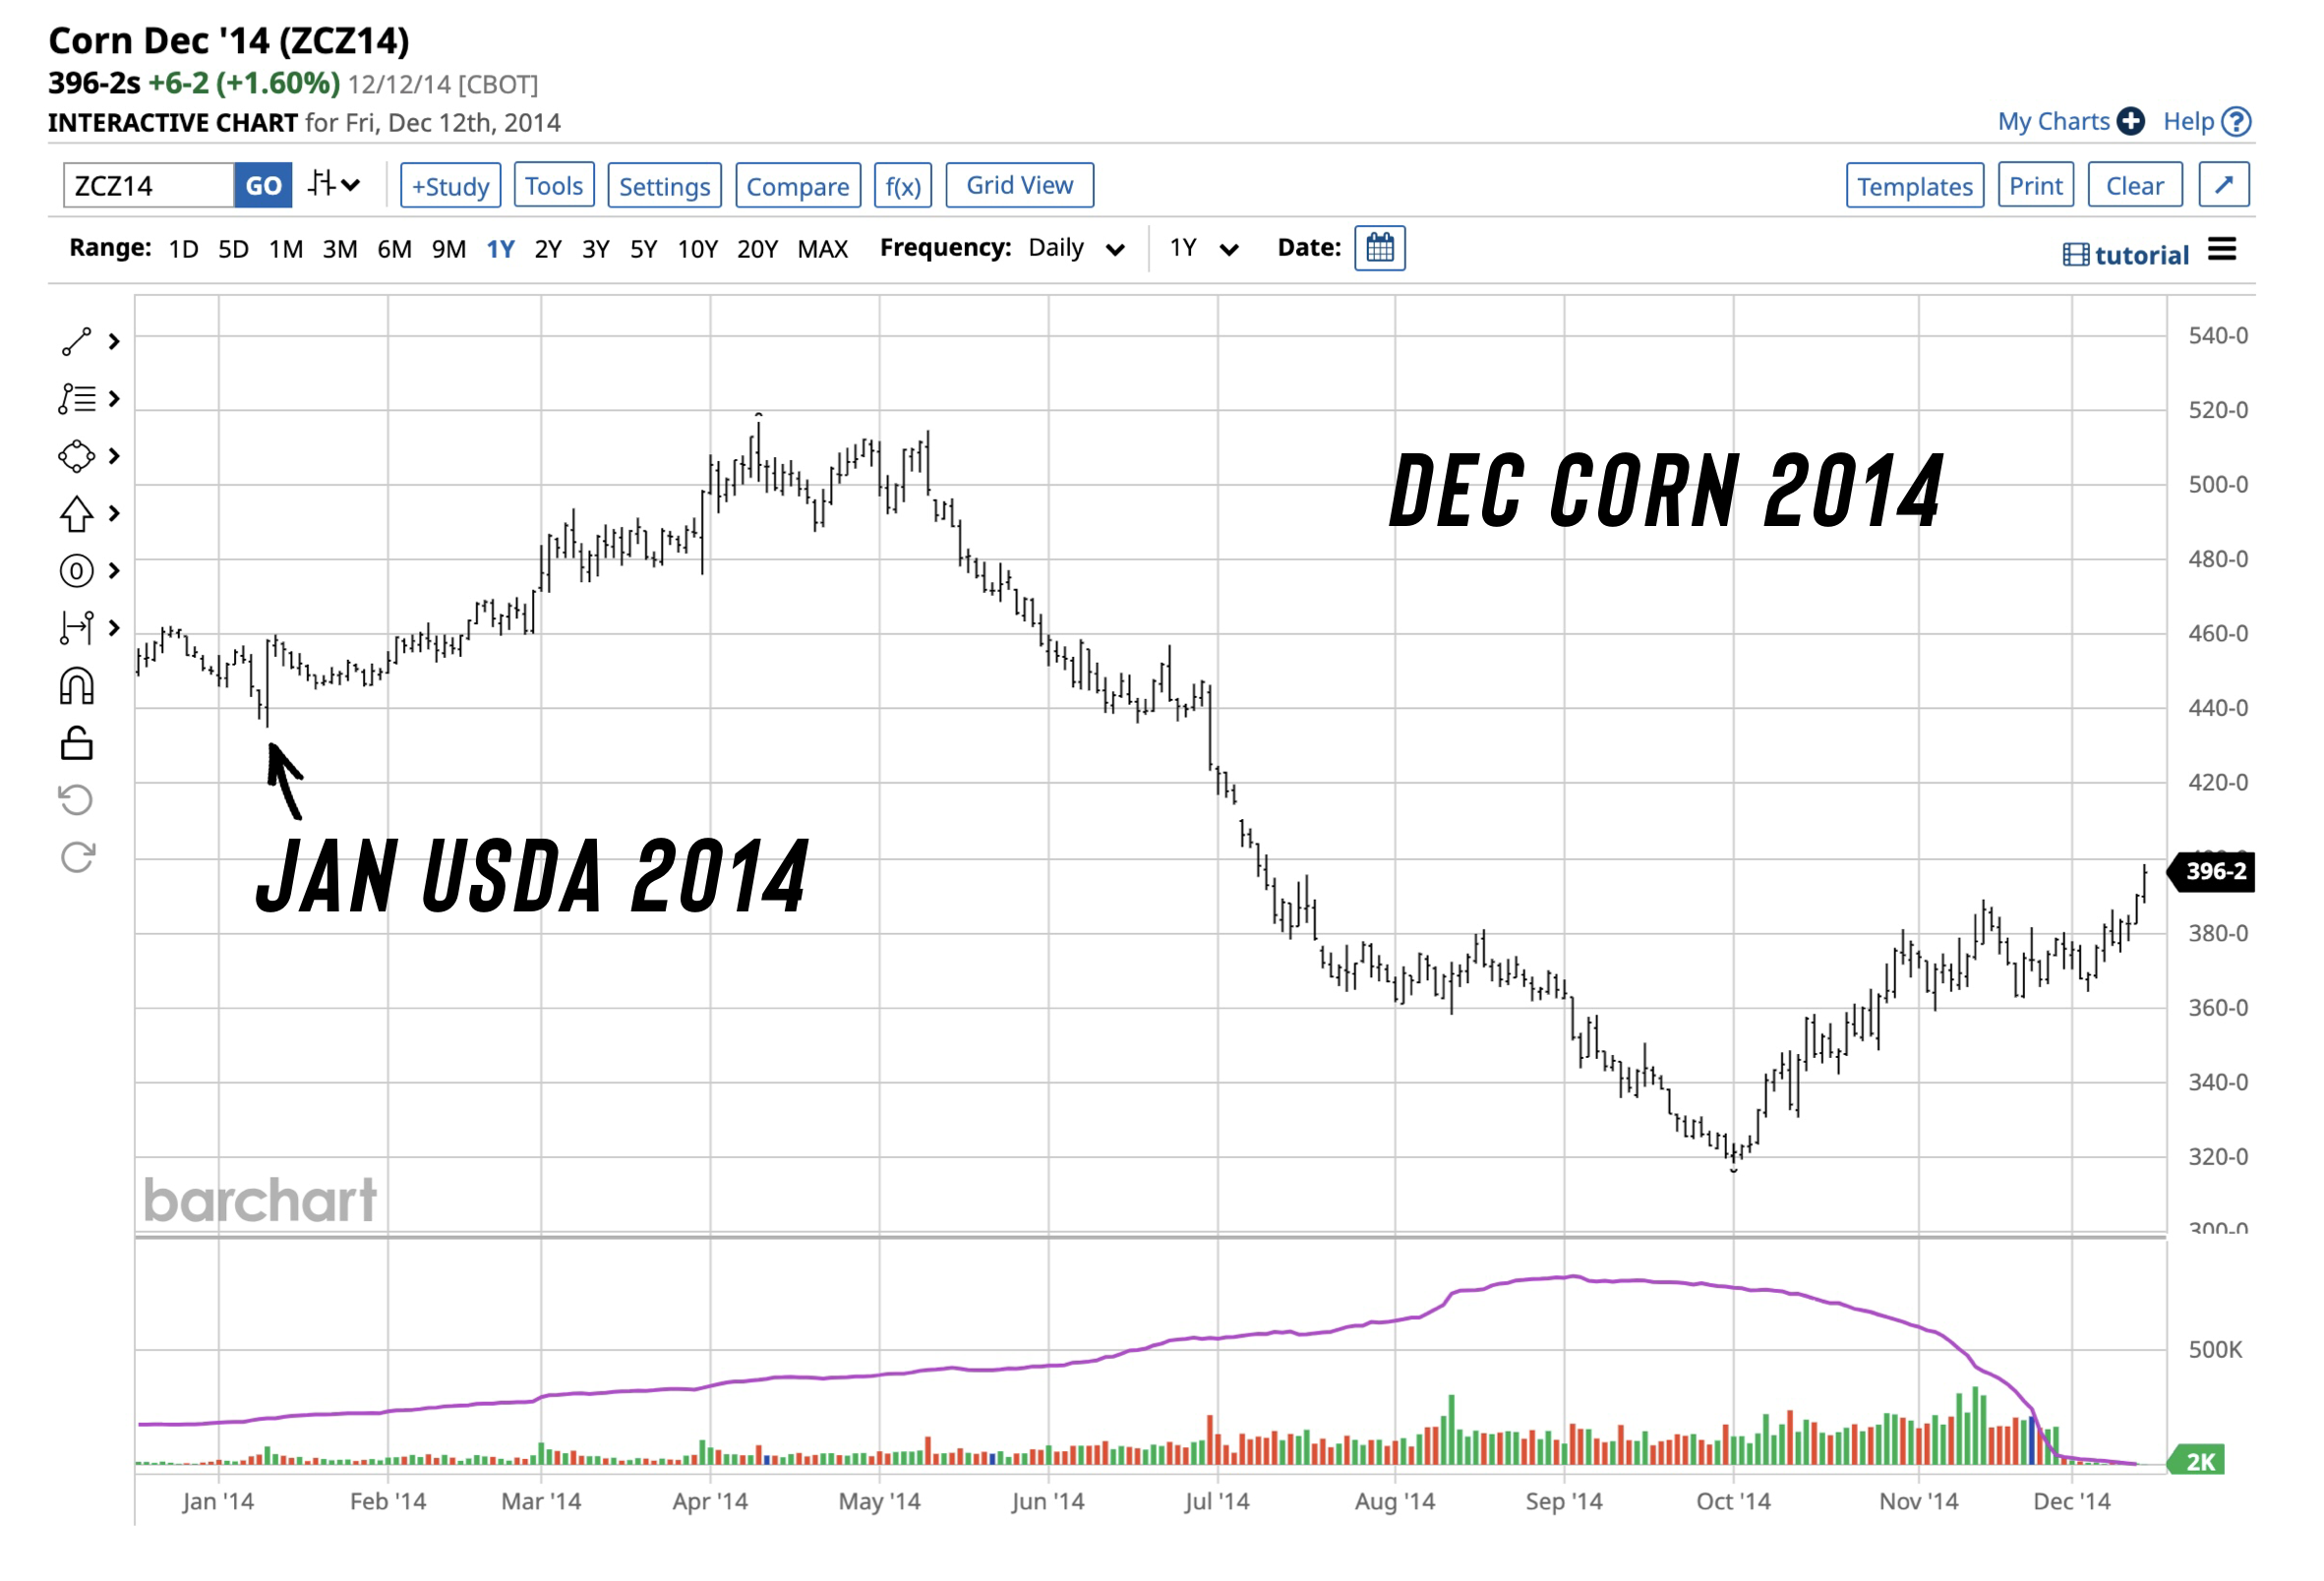
So if 2023 was like 2013, does that mean 2024 will be like 2014?
Often times the markets do follow similar patterns.
The years 2012 and 2022 were similar.
The years 2013 and 2023 were also similar.
So if 2024 is like 2014, where do we go from here?
If you take a look at the chart below from 2014, it was this exact report in January where we printed our lows and moved higher into spring.
Now I am not saying this happen, as there is good reason to believe this report could potentially trigger another leg lower. But some food for thought.
I do believe prices will be higher come spring time.
Although yes, this was the most bearish report since 2012 and the report in 2014 was friendly. Keep in mind, 2012 was one of the most bearish reports on record, while 2013 was a positive report as well.
The purpose of this is to outline the similarity in the price trends rather than the history of the report.
Now let's look at the charts. If you listened to today's audio, the black circles are what we referred to as "reversal type action". Long wicks like today are often signs of reversals.
Corn 🌽
We barely closed below the $4.50 level at $4.48. Unless we bounce here, the market may now want to try and test the old 2015 to 2016 highs of $4.38
What do bulls need? You need to crawl back above $4.70.
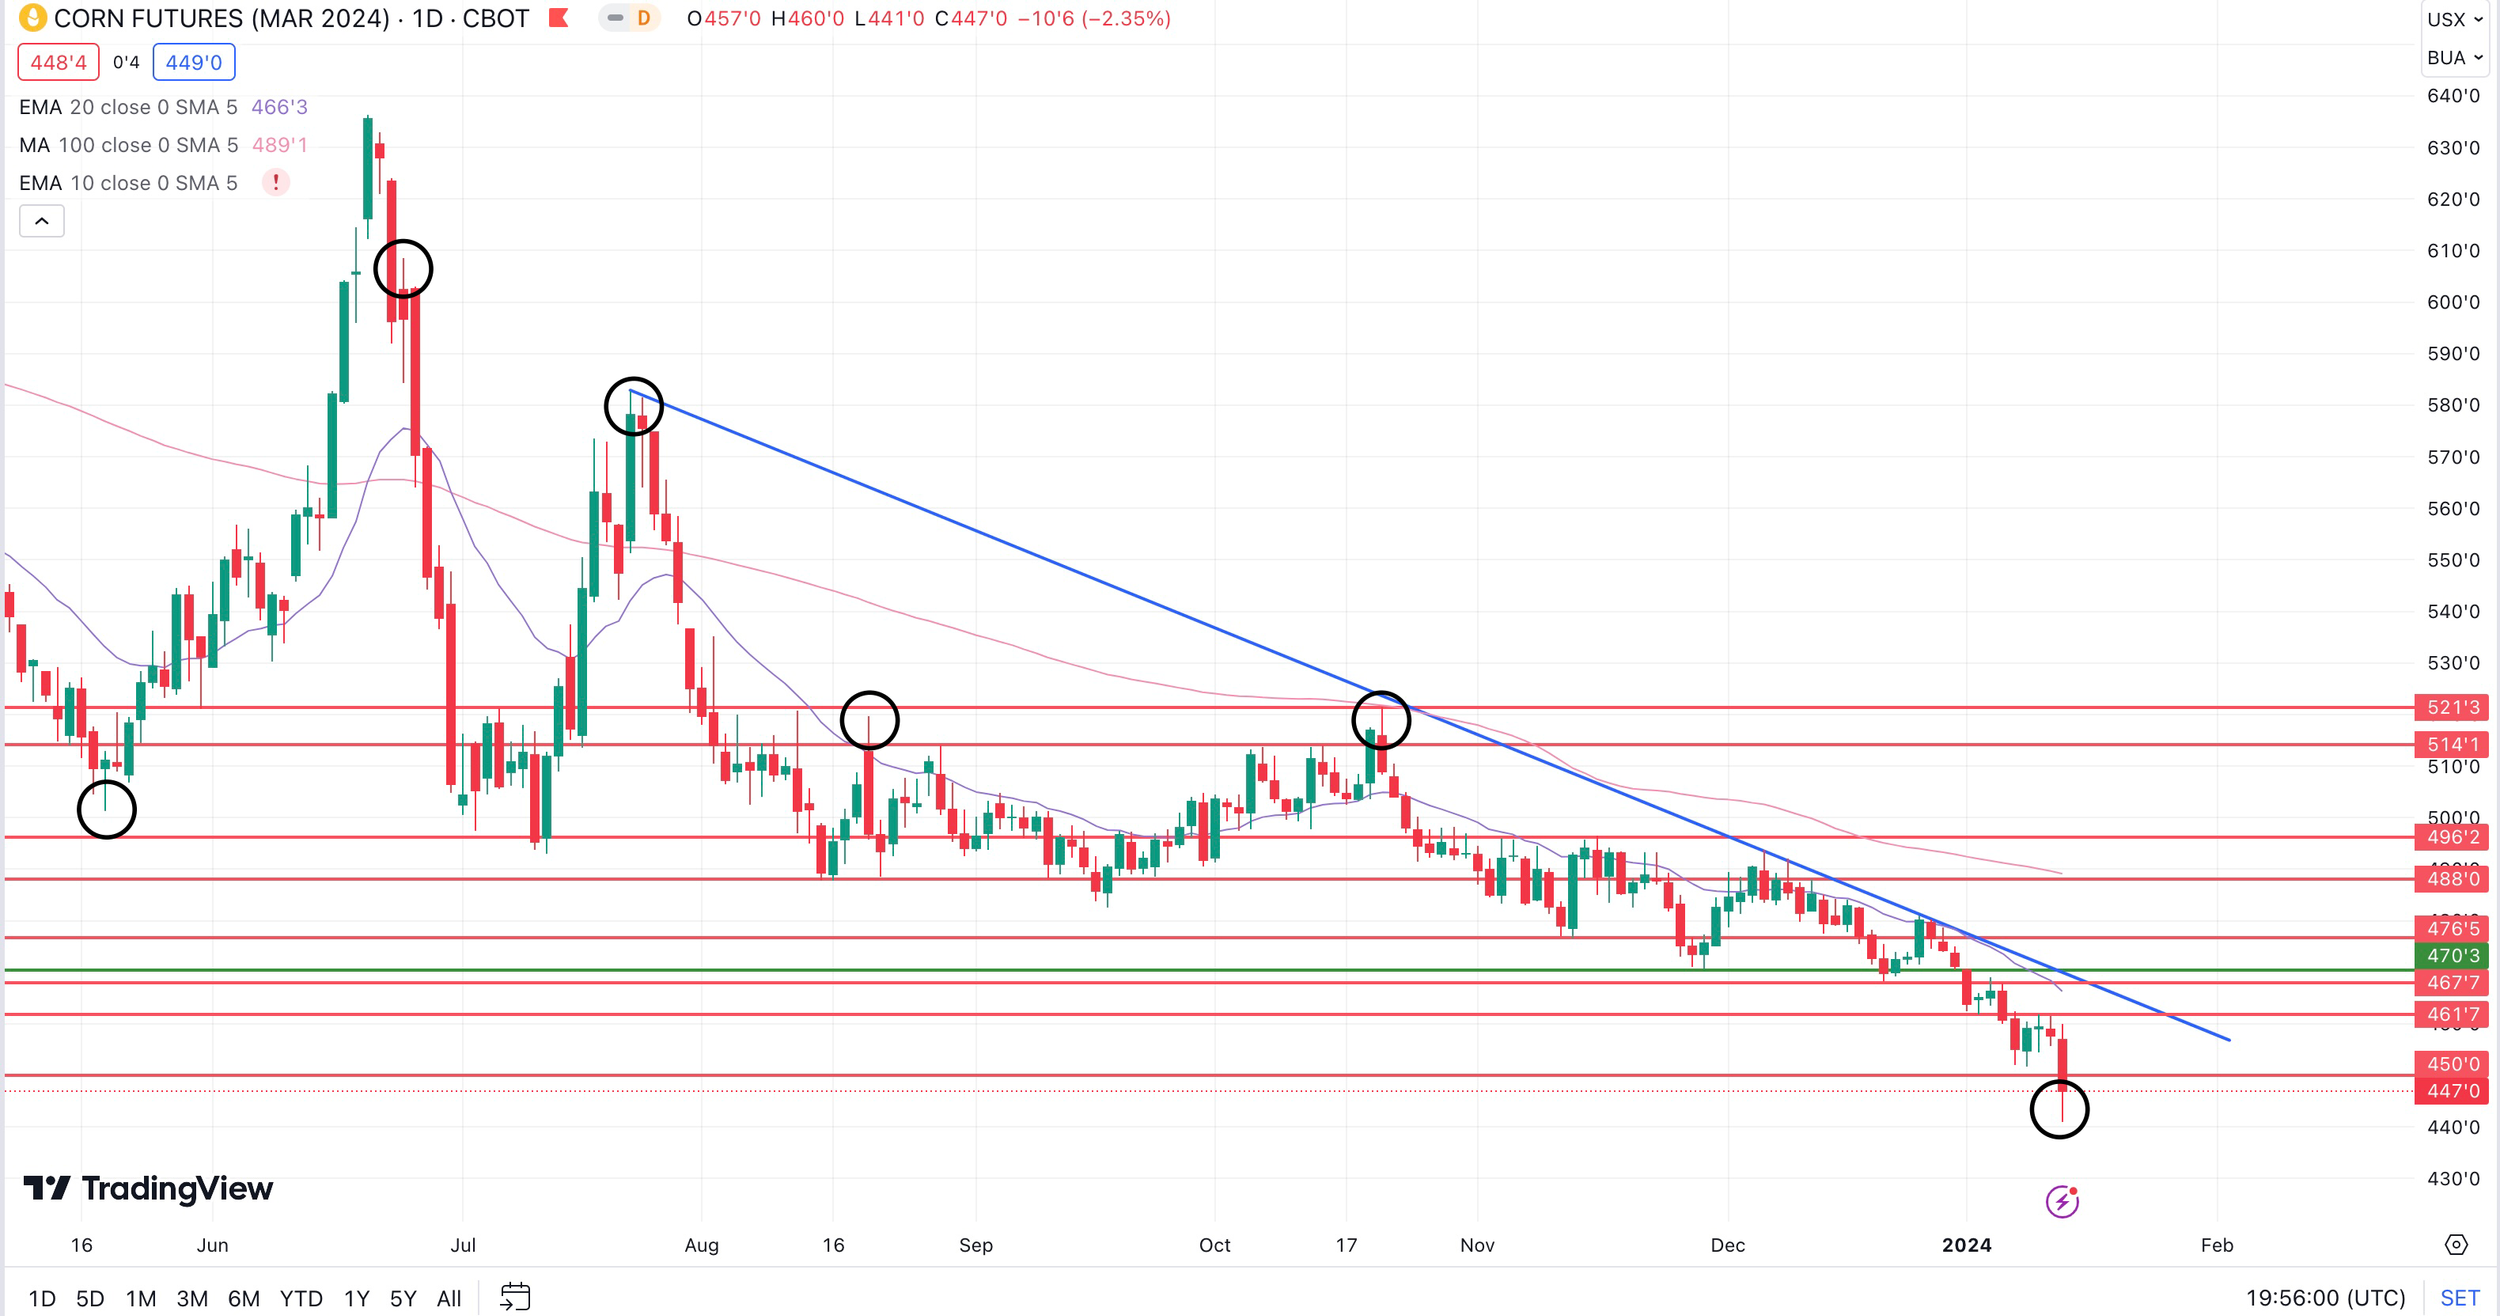

Corn March-23 (1-Day & 5min)
Soybeans 🌱
Despite the awful report, soybeans actually didn’t have all that bad of a close.
At one point we were down over -30 cents, but rallied back to close down just -10 cents.
That $12.50 area remains stiff resistance as we have bounced off of it several times the past few days.
We are heavily oversold and sit below all major moving averages.
As mentioned yesterday, I don’t see a ton of reason why couldn’t possibly look to test the $12 level as I have that area as our next major support (which we bounced off of today before rallying +20 off our lows).
I am hoping we bounce out of here, but we need to realize that is our risk.
If that level weren’t to hold, bears would be looking towards those summer lows of $11.40.
The first upside target is our 20-day moving average at $12.84. Then we have that gap we left at $12.98 is the bulls target to get things back over $13.
From a pure technical standpoint, if we take a look at the wick today. We left the longest wick in recent memory. These are typically signs of reversals.
Our next closest wick we have to today was all the way back on August 8th, the following two weeks we rallied over $1. Not saying we are going to magically rally $1 here. Just pointing out that today's price action was actually pretty positive despite the surface negativity.
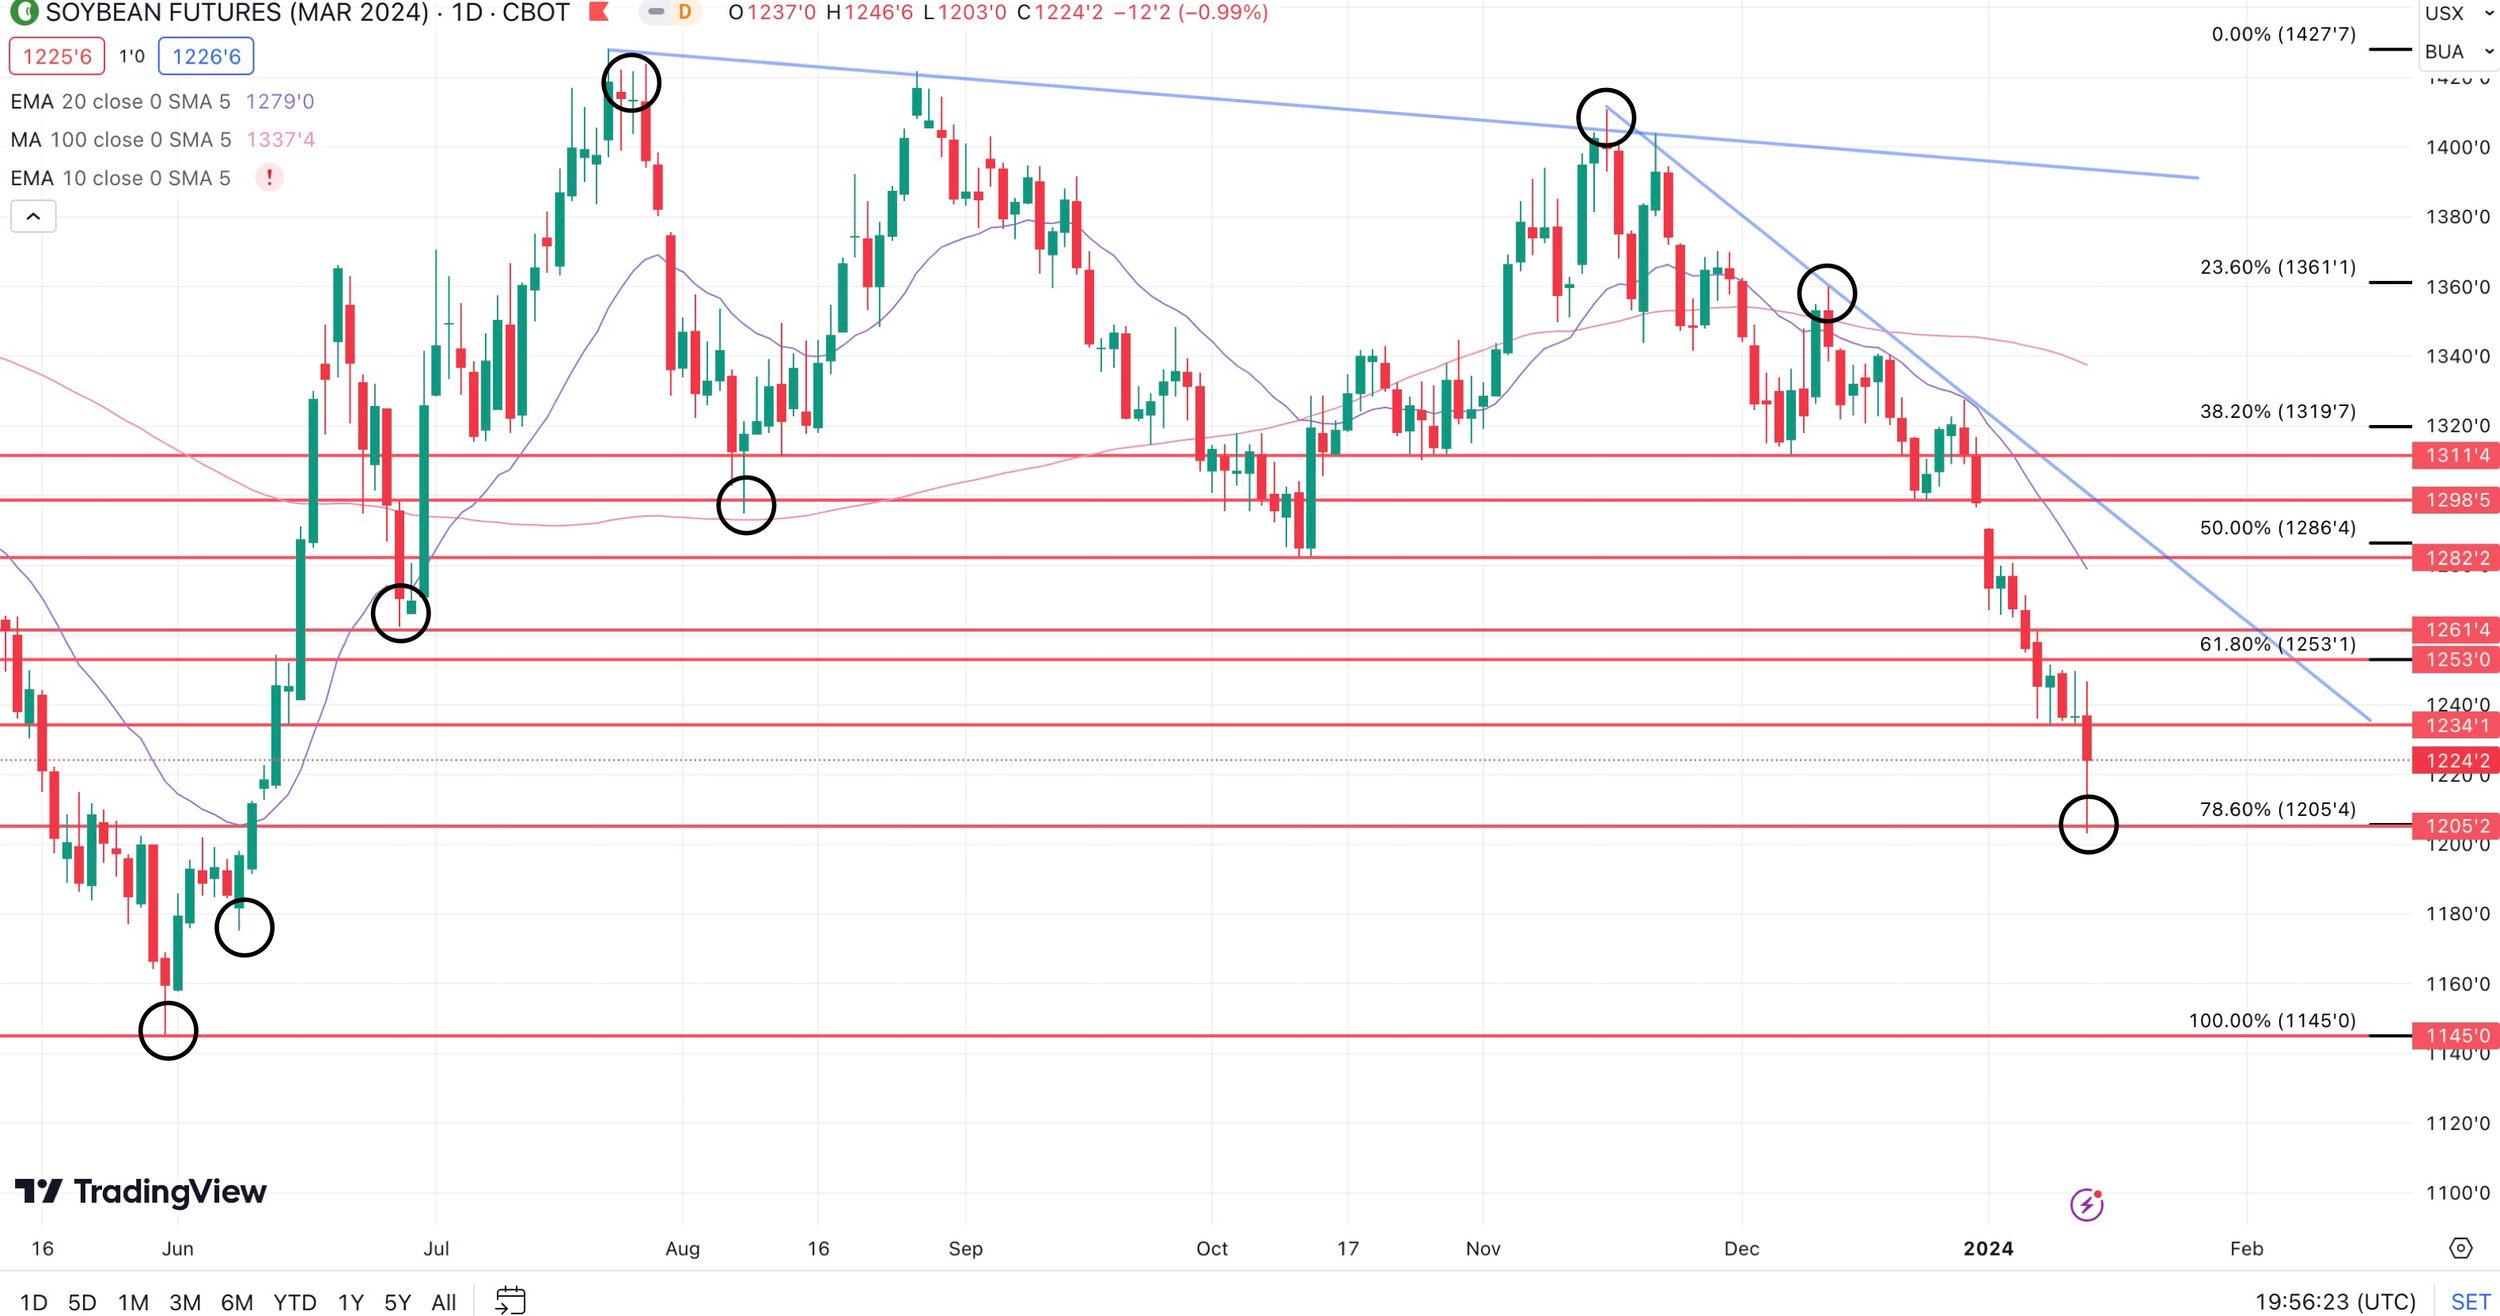

Soybeans March-23 (1-Day & 5min)
Wheat 🌾
Wheat still remains in no man's land.
No real change from yesterday. Stuck in the middle of this recent range.
Bulls still need to take out the recent $6.39 highs.
KC wheat is also stuck in the middle of a very wide range. Bulls need to hold $5.95 and take out $6.71
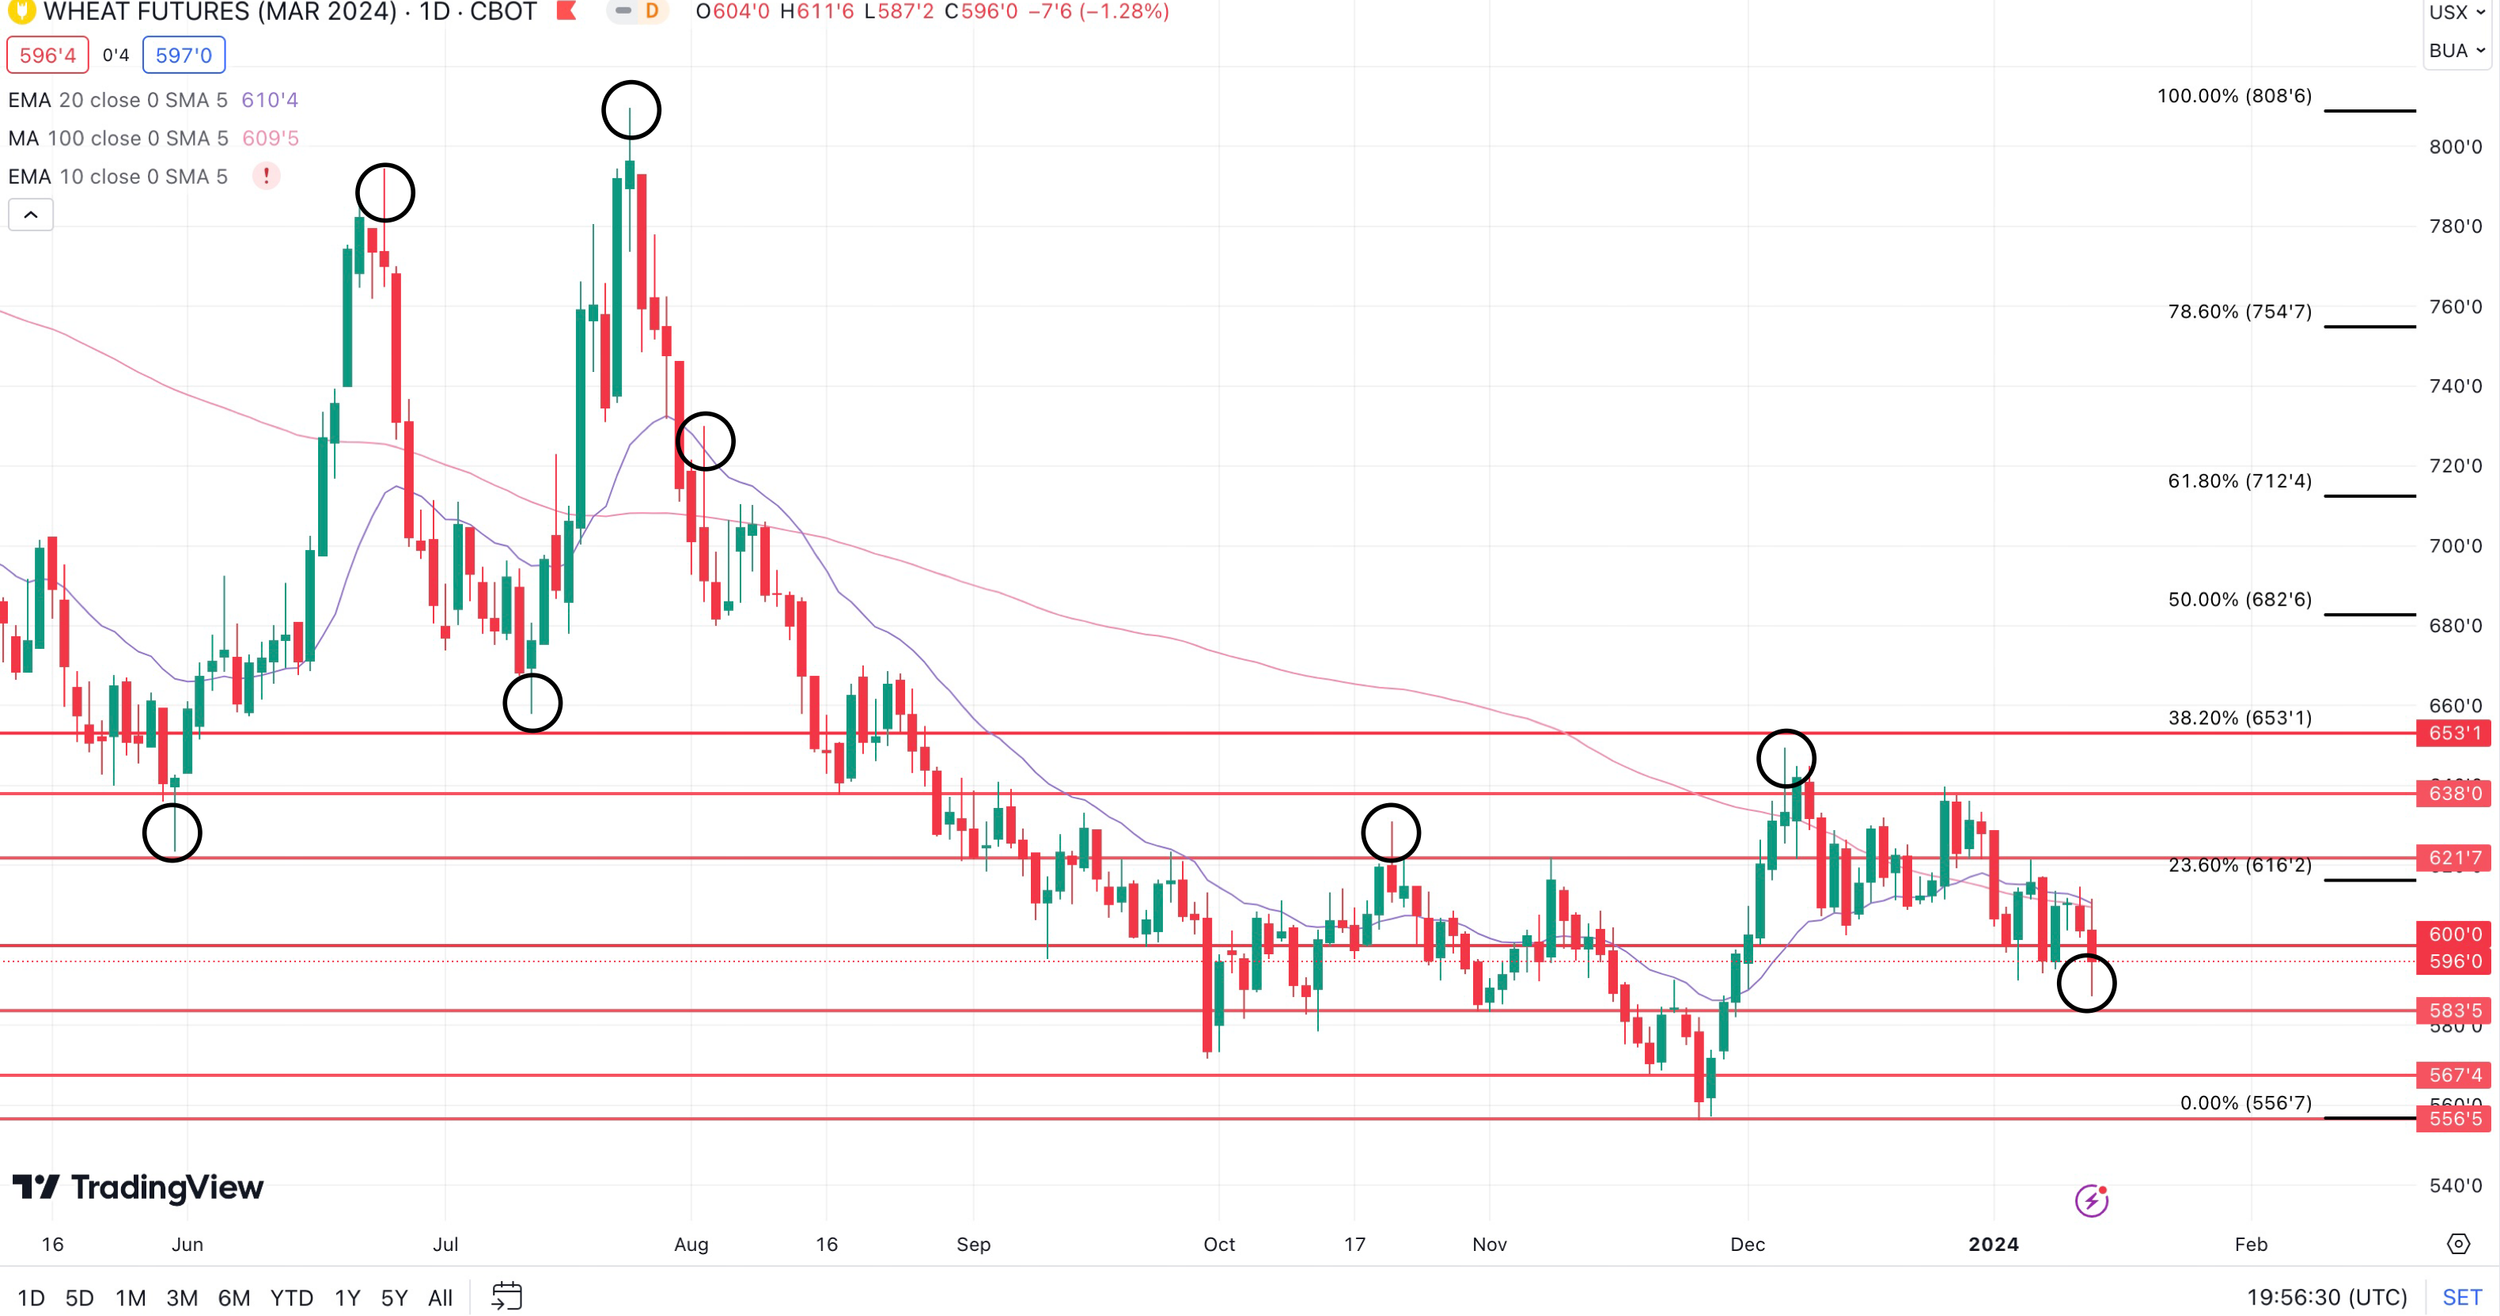
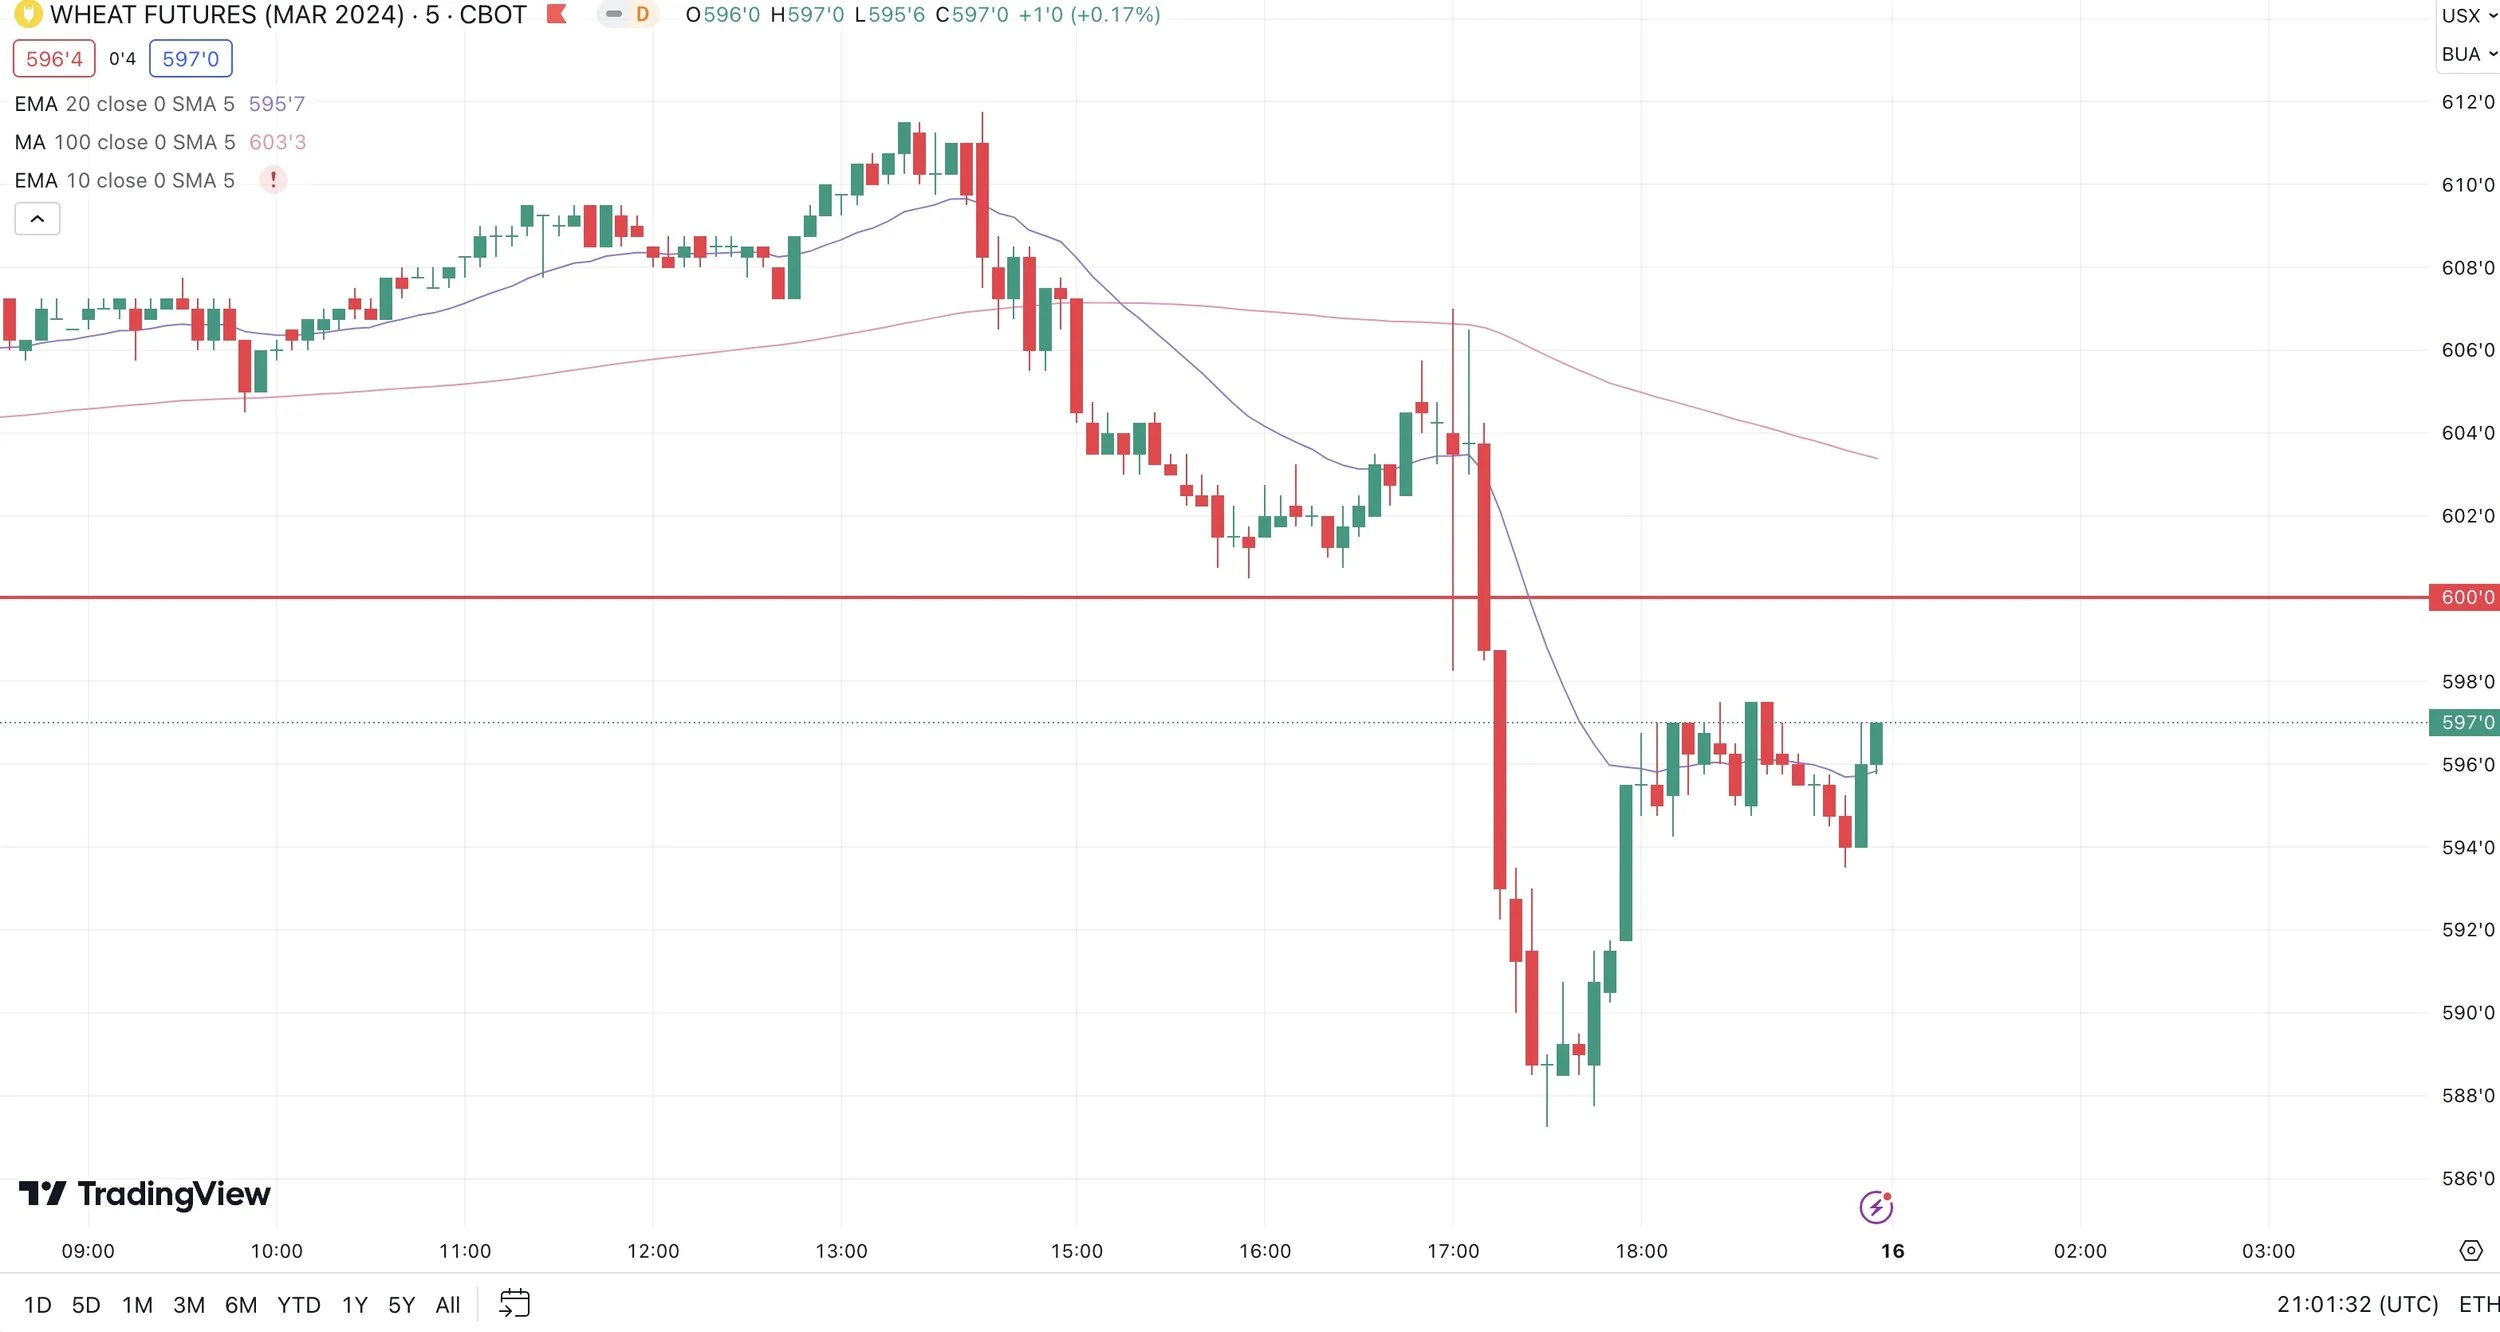
Chicago March-23 (1-Day & 5min)
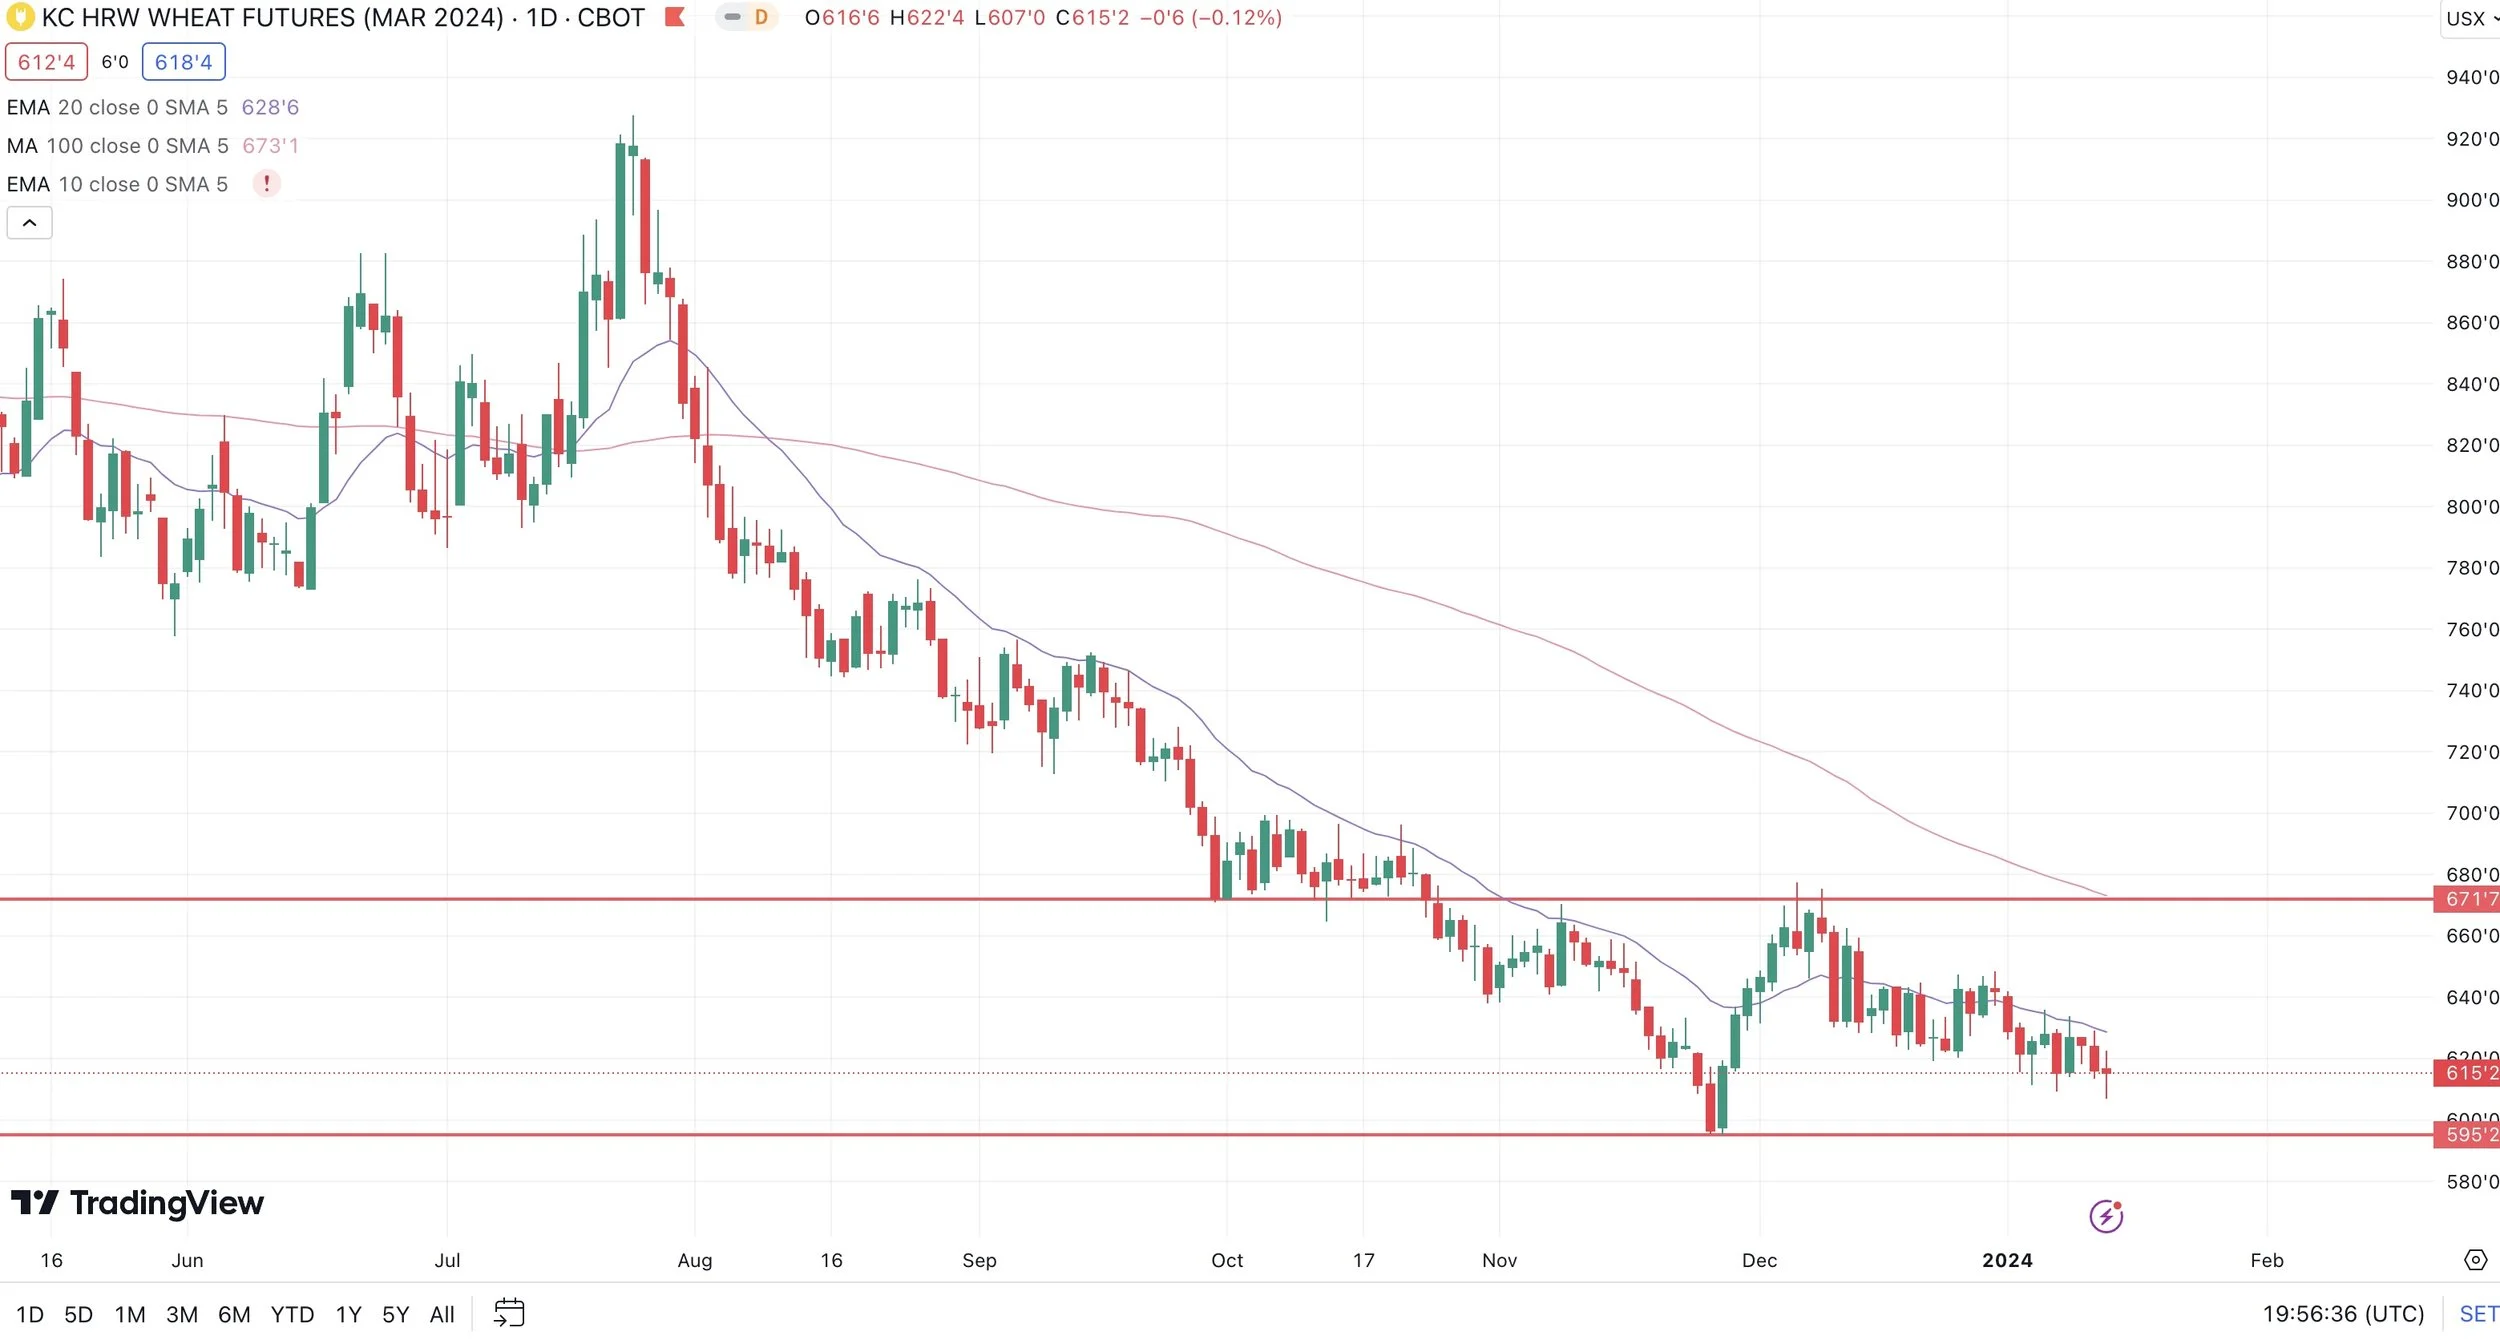
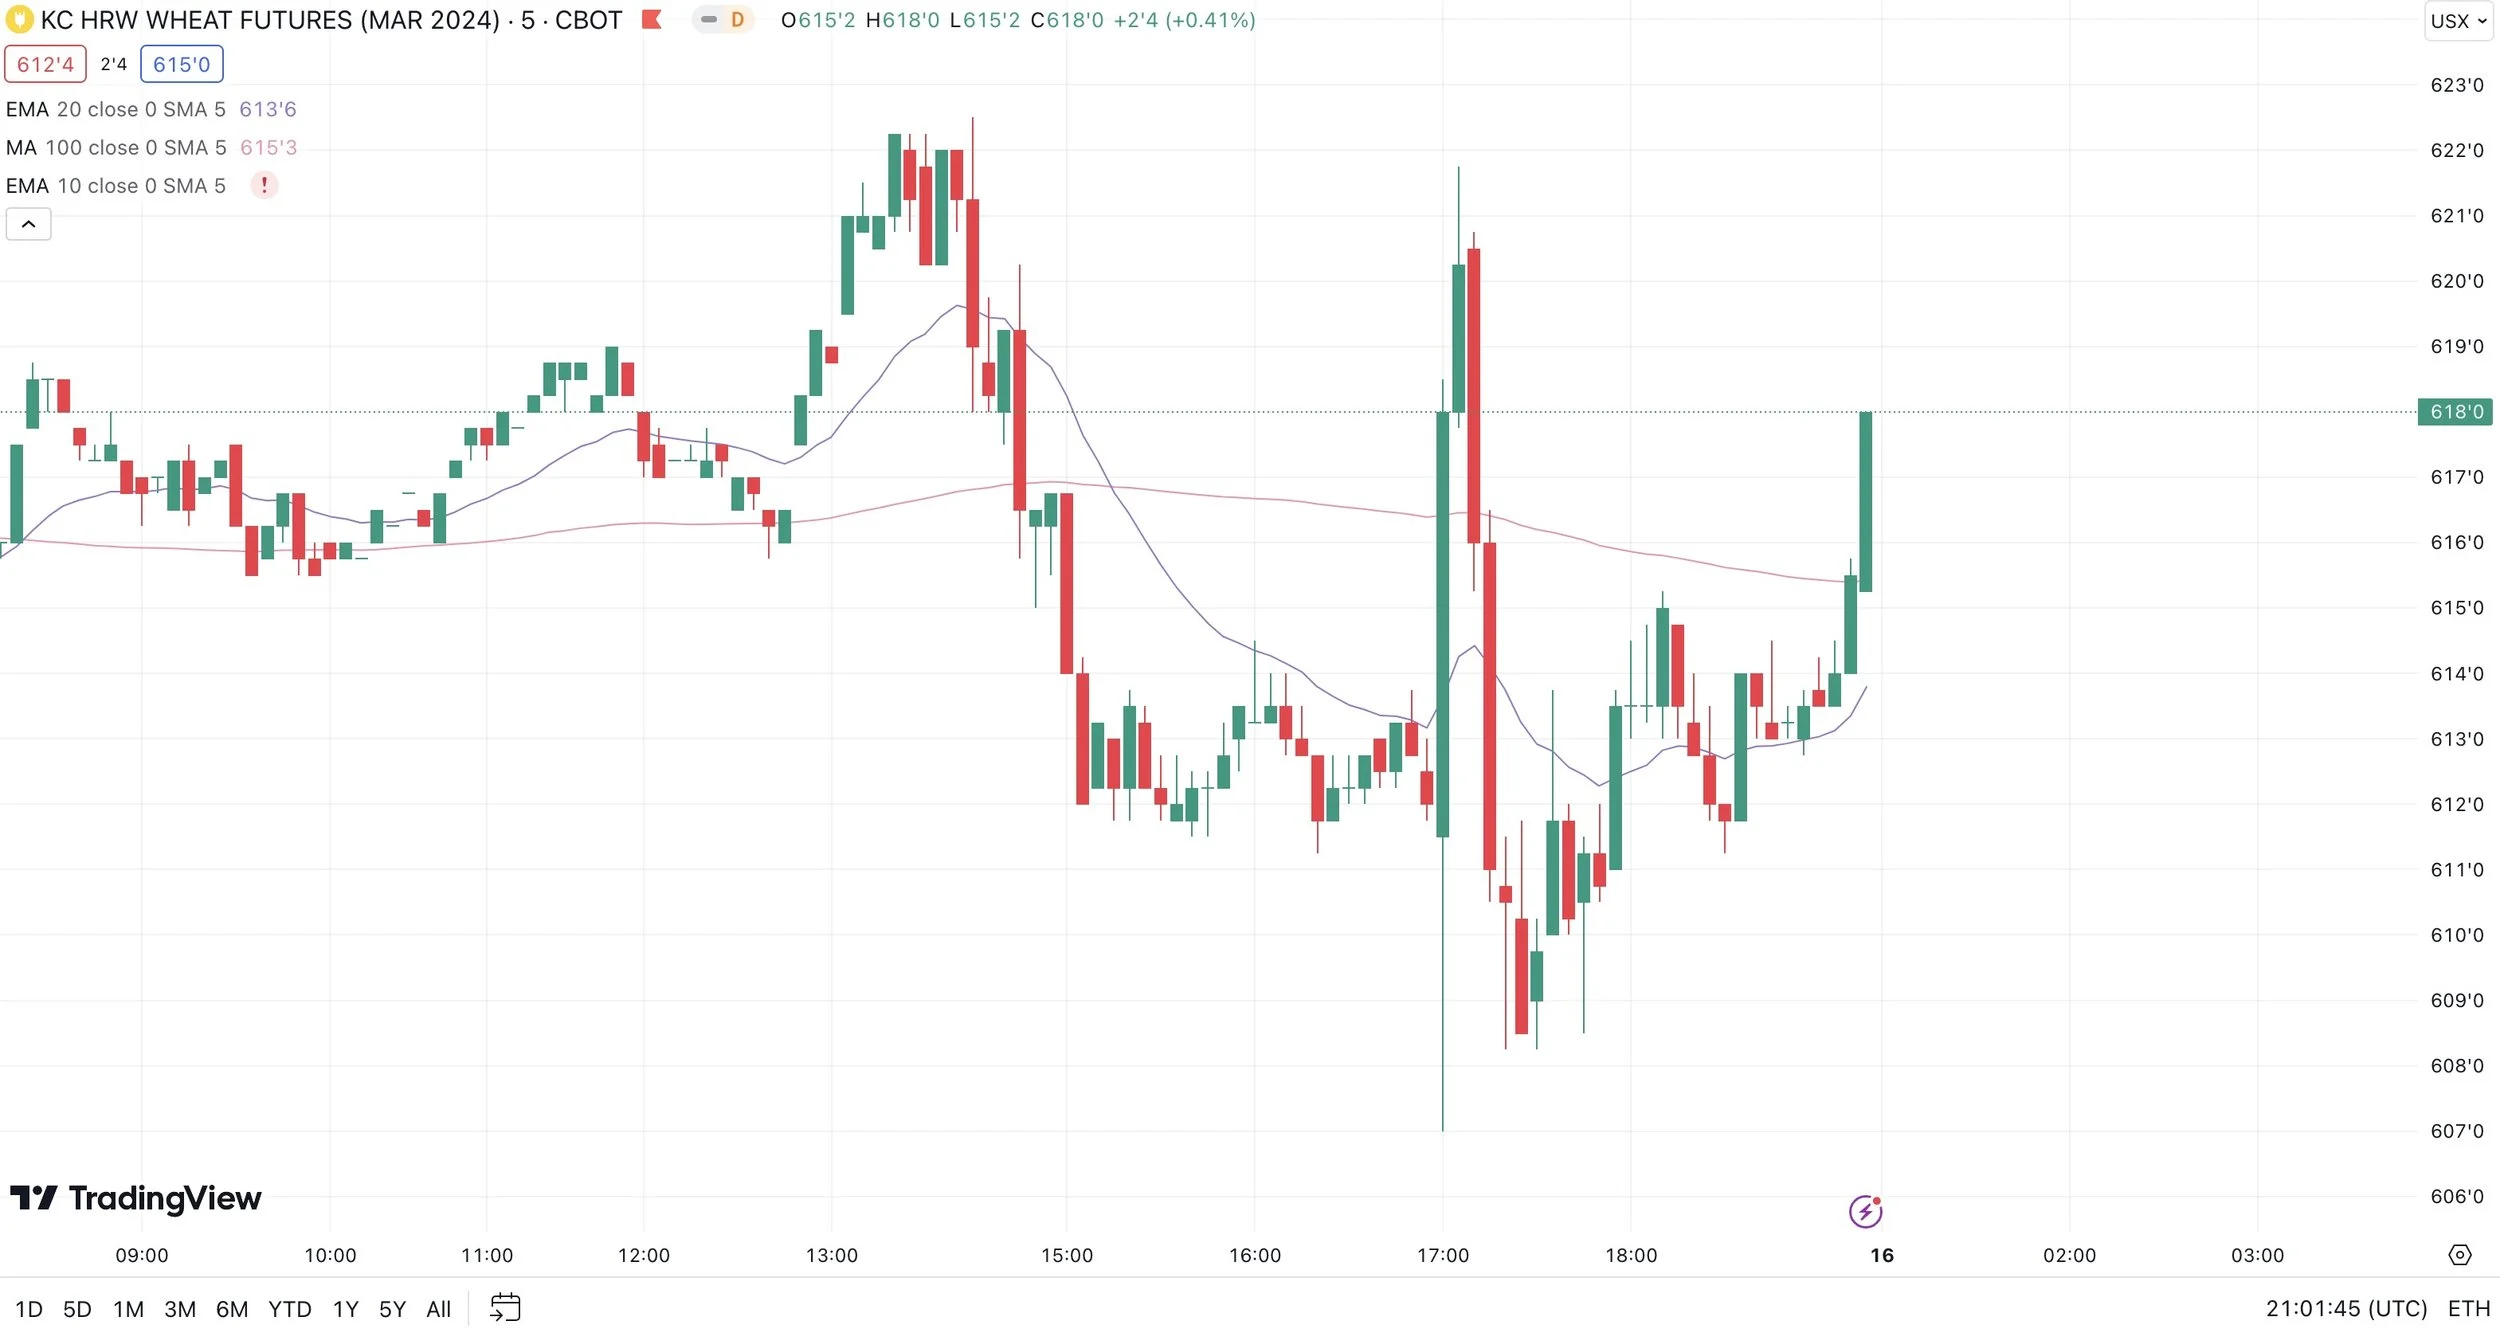
KC March-23 (1-Day & 5min)
Want to Talk?
Our phones are open 24/7 for you guys if you ever need anything or want to discuss your operation.
Hedge Account
Interested in a hedge account? Use the link below to set up an account or shoot Jeremey a call at (605)295-3100 or Wade at (605)870-0091
Check Out Past Updates
1/11/24
USDA REPORT TOMORROW. ARE YOU PREPARED?
1/10/24
PREPARING FOR THE USDA
1/9/24
TURNAROUND TUESDAY & USDA PREVIEW
1/8/24
HOW TO GET COMFORTABLE AHEAD OF USDA REPORT
1/5/24
FIRST WEEK OF NEW YEAR FLOPS
1/4/24
REALIZING POTENTIAL UPSIDE BUT BEING AWARE OF RISKS
1/3/24
RAINS & BRAZIL ESTIMATES
1/2/24
UGLY DAY: BRAZIL, RISKS, & MARKETING STRATEGIES
Read More
12/29/23
SHORT TERM RISK & LONG TERM UPSIDE
12/28/23
BRAZIL RAINS?
12/27/23
EFFECTS OF US DOLLAR COLLAPSE ON GRAINS & STRATEGIES TO CONSIDER
12/26/23
GETTING COMFORTABLE WITH ALL POSSIBILITIES
12/22/23
BEAN BASIS RECOMMENDATION TO TAKE BACK CONTROL FROM BIG AG
12/21/23
COMMODITIES ARE DIRT CHEAP VS STOCKS
12/20/23
ARE YOU COMFORTABLE WITH $3 CORN OR $6 CORN?
12/19/23
CORN FIGHTING NEW LOWS & BRAZIL RAINS
12/18/23