
CROP TOUR SO FAR & COMPARISON TO USDA

Overview
So so day for the grains, wheat led us higher while corn gave back some of yesterday's gains and beans closed unchanged but well off their initial highs.
First things first, the crop tours.
I just wanted to note that no, the crop tour typically does not have a huge effect on the actual prices of the markets.
However, it does help us get a better understanding of how the actual crops look.
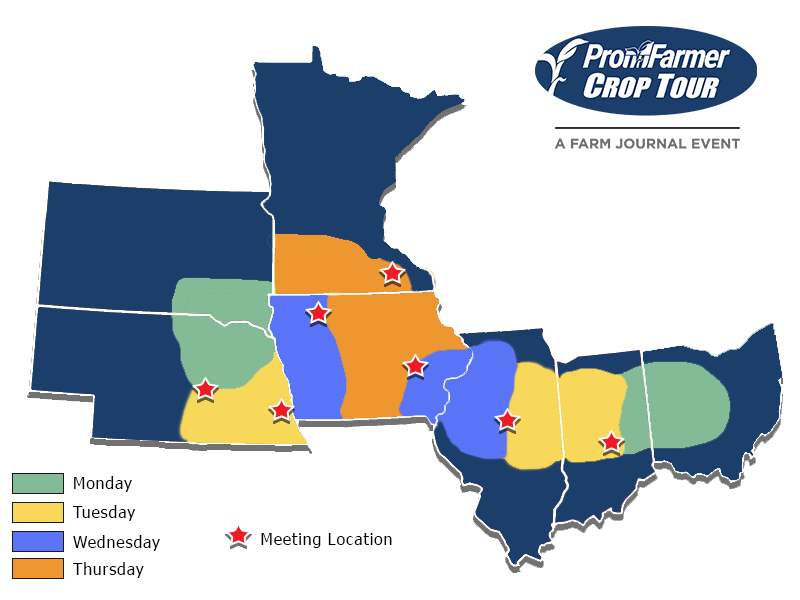
Here is a map of the tours.
Day 1: South Dakota & Ohio
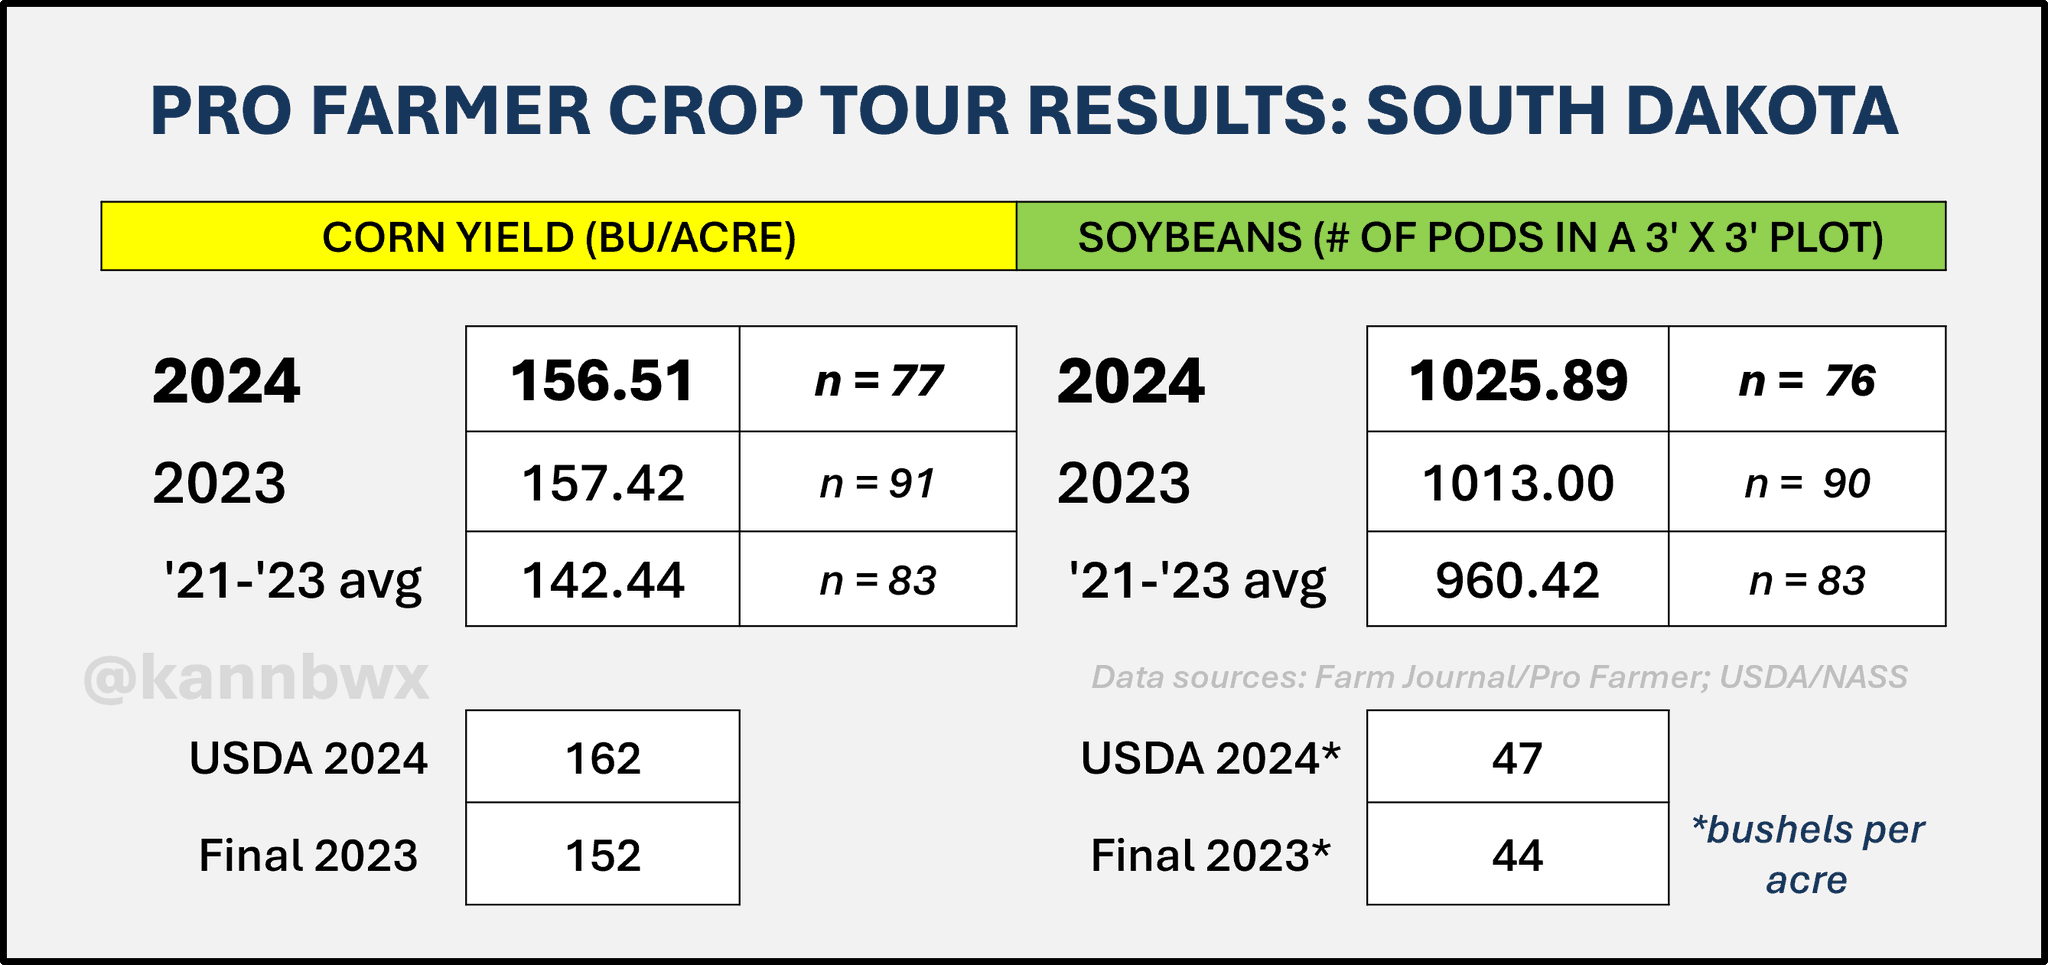
South Dakota
Corn:
The tour sees SD corn down slightly from last year, while the USDA sees corn yield up +7% (+10 bpa) vs last year.
Tour 2024: 156.51
Tour 2023: 157.42
USDA 2024: 162
USDA Final 2023: 152
So overall, the tour thinks South Dakota the corn crop will be worse than last year while the USDA thinks they will be a lot better than last year.
Beans:
The tour sees pod counts up +1.3% from last year, while the USDA projects soybean yield up +7% from last year.
USDA has a 47 bpa this year vs 44 last year. A +7% increase. While the tour only sees a +1% increase from last year. (Image below)
The tour thinks beans will be slightly better, while the USDA thinks beans will be a lot better.
Overall the tour thinks South Dakota will be worse than the USDA does for both crops.
From Karen Braun:
"Soybeans have potential. Need more rain to reach it and the forecast looks dry ish. Corn is showing sins of excessive rain during/just after planting."
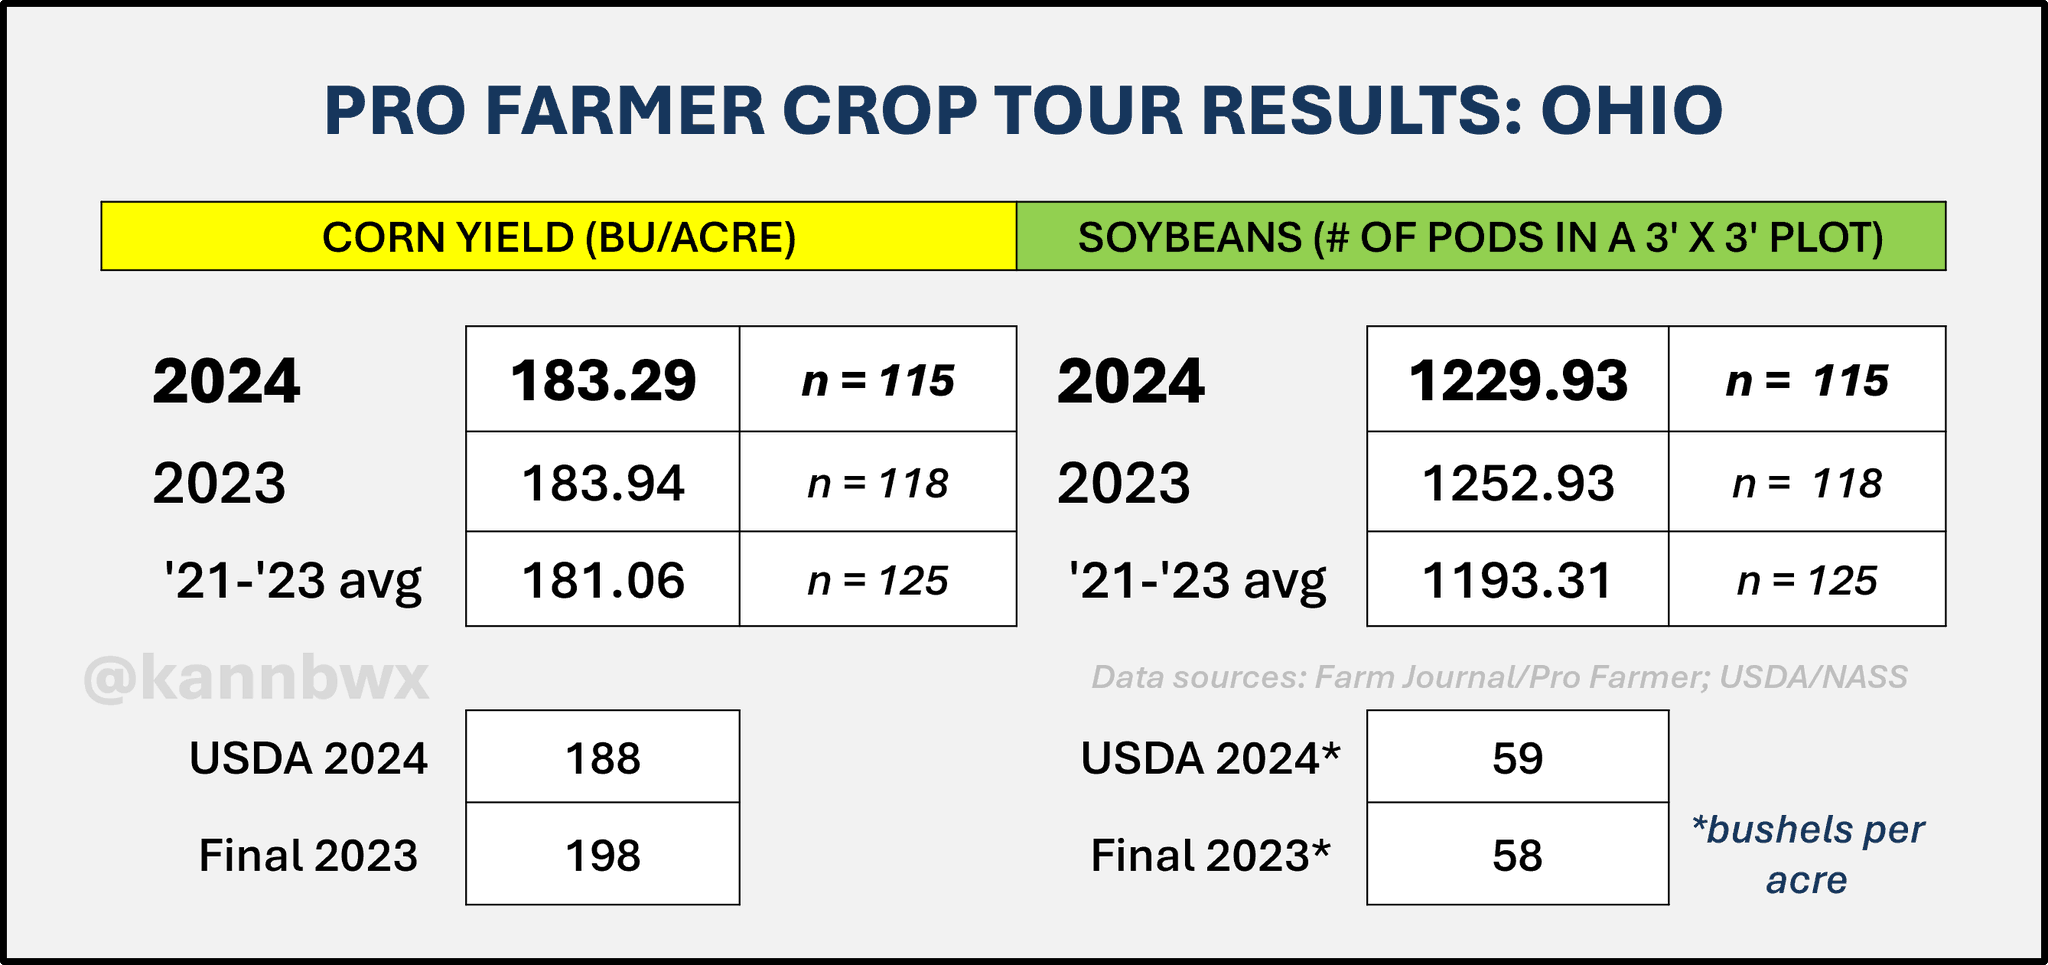
Ohio
Corn:
The tour sees Ohio corn down just slightly from last year's tour, while the USDA sees corn yield down -5% from year.
Tour 2024: 183.29
Tour 2023: 183.94
USDA 2024: 188
USDA Final 2023: 198
The tour thinks Ohio corn is in better shape than the USDA does. The tour sees Ohio corn being on par with last year, while the USDA expects Ohio corn to be down -10 bpa.
However, one thing to note is that the tour took place in the Western part of Ohio so it did miss some of those drought stricken areas farther east.
Beans:
The tour sees soybeans down -2% from last year, while the USDA expects an increase from 58 to 59 bpa (+1.7%).
So overall the tour sees beans worse than the USDA, while they see corn better than the USDA.
Overall, the day 1 for both states was friendly for beans. As the tour doesn’t see the bean crop being quiet as good as the USDA projects.
For corn it was a mixed bag. The South Dakota tour was friendly as the findings relative to the USDA were worse, while the Ohio one was not friendly as the findings relative to the USDA were better.
Today they will get into some areas where most are expecting massive record crops such as central Illinois & Indiana.
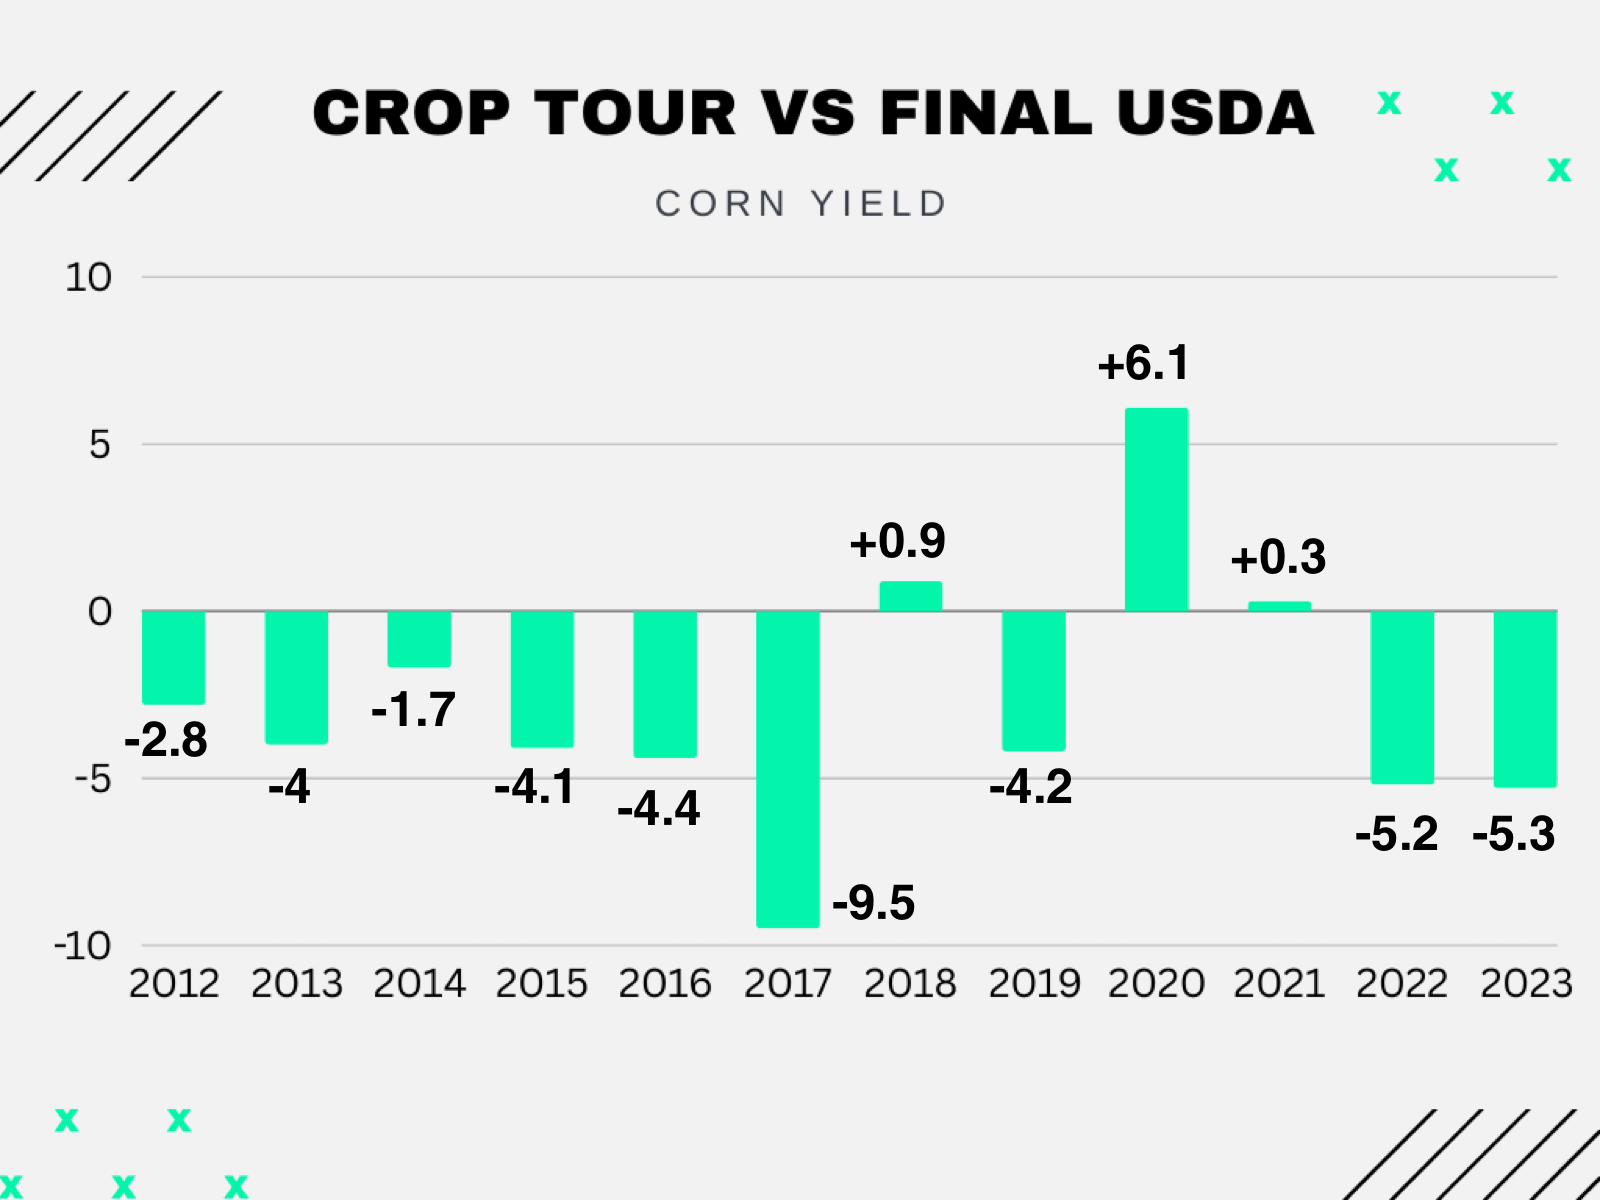
How accurate has the crop tour been in the past?
It is hard to compare the actual yield numbers when it comes to the crop tour. It makes more sense to compare how the crop tour vs USDA sees yield changing year over year rather than the crop tour vs USDA's actual yield numbers.
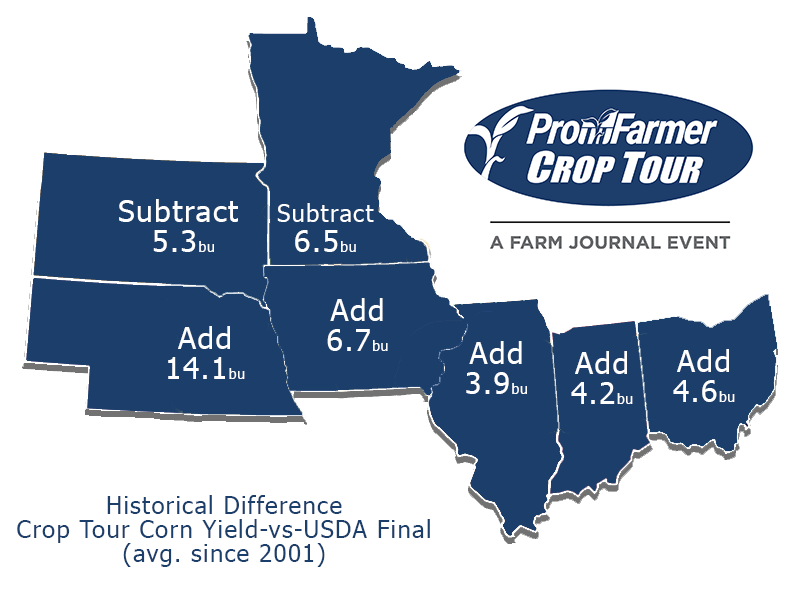
But if we take a look at the tours corn yield vs the USDA's final yield since 2001, here are the numbers:
Minnesota: -6.5 bpa
South Dakota: -5.3 bpa
Illinois: +3.9 bpa
Indiana: +4.2 bpa
Ohio: +4.6 bpa
Iowa: +6.7 bpa
Nebraska: +14.1
Based off past years, this would give us:
South Dakota: (156.51 - 5.3) 151.21 vs USDA's 162
Last year the tour had 157.42 and the USDA's final was 152. A -5.4 bpa difference.
Ohio: (183.29 + 4.6) 187.89 vs USDA's 188
Last year the tour had 183.94 and the USDA's final was 198. A big -14 bpa difference.
Historically, the crop tour does underestimate total US yield.
The past 2 years they have been -5 bpa too low on the corn crop.
So based on other years, whatever total yield they find this year, you might be able to add +4 to +5 and that could be accurate to this year's final yield. Unless we get a year like 2020 where the tour was 6 bpa too high.
So even if the crop tours project for example a 178 yield, historically we might actually be closer to the USDA's 183.
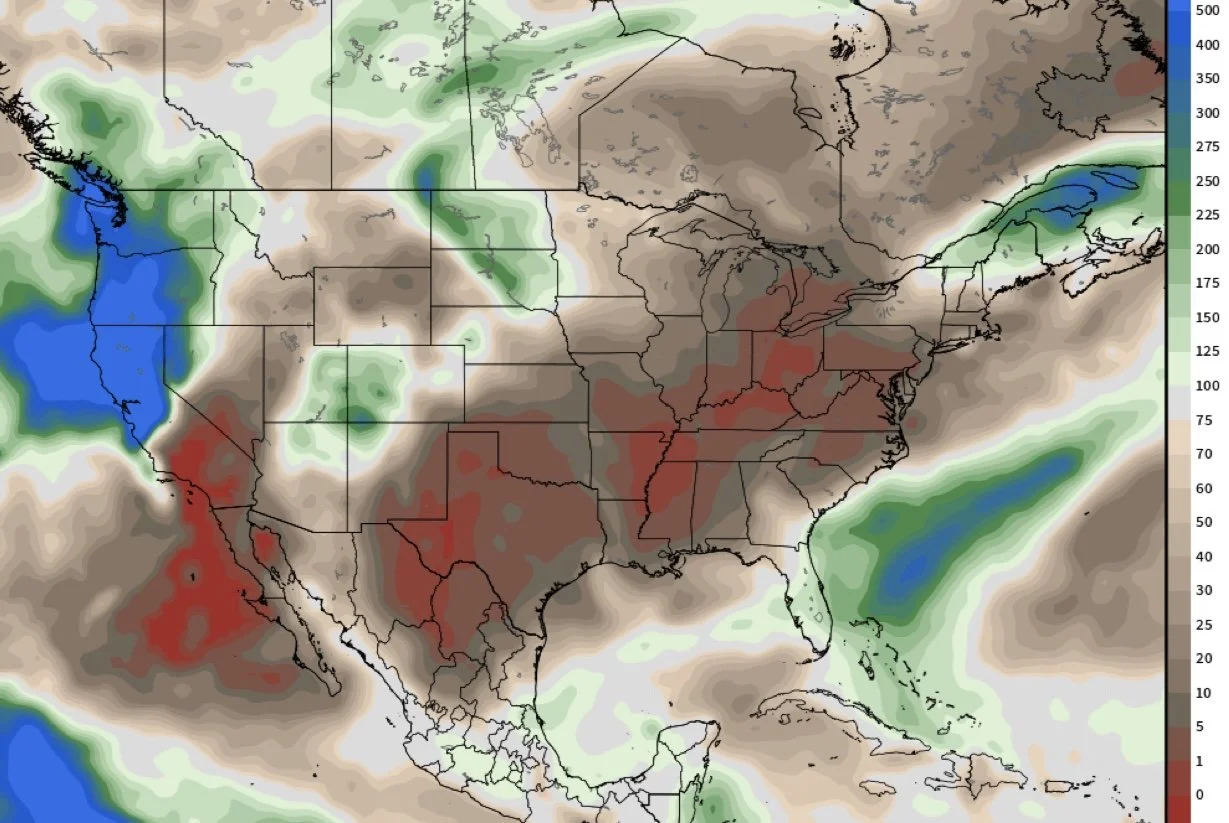
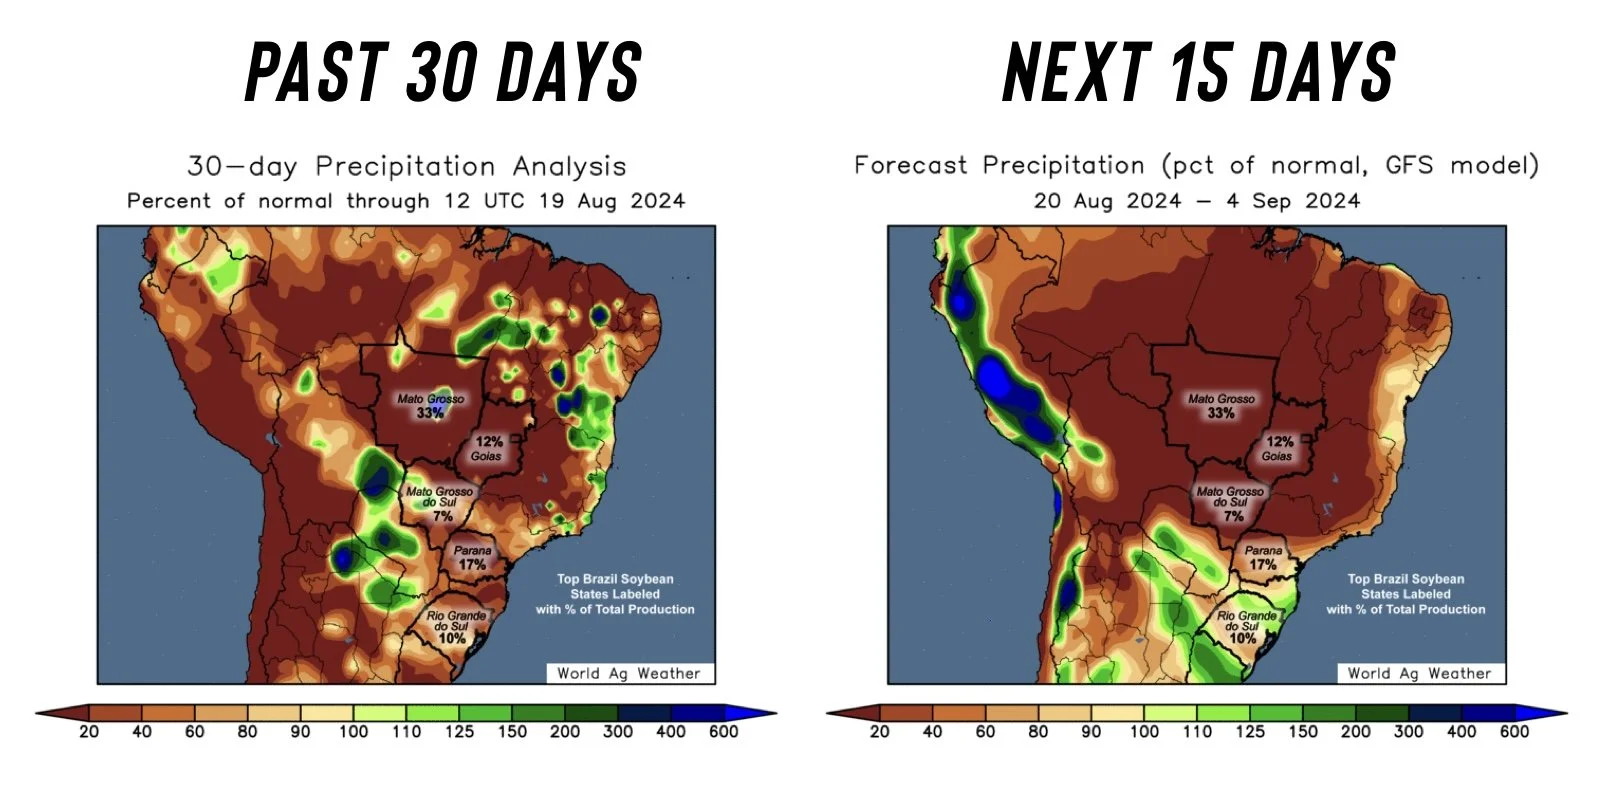
Weather
Weather is seen as a slight supportive factor as we finish out the crops, as the outlook for the rest of August has turned dry and the summer heat looks to come back in the next 2 weeks.
So this has some thinking that perhaps the crops aren’t going to get much bigger the current USDA projections.
As some of the crop tour participants noted that a lot of the soybeans have great potential, but could use some rain to reach that potential.
1-5 Day % of Normal Precip
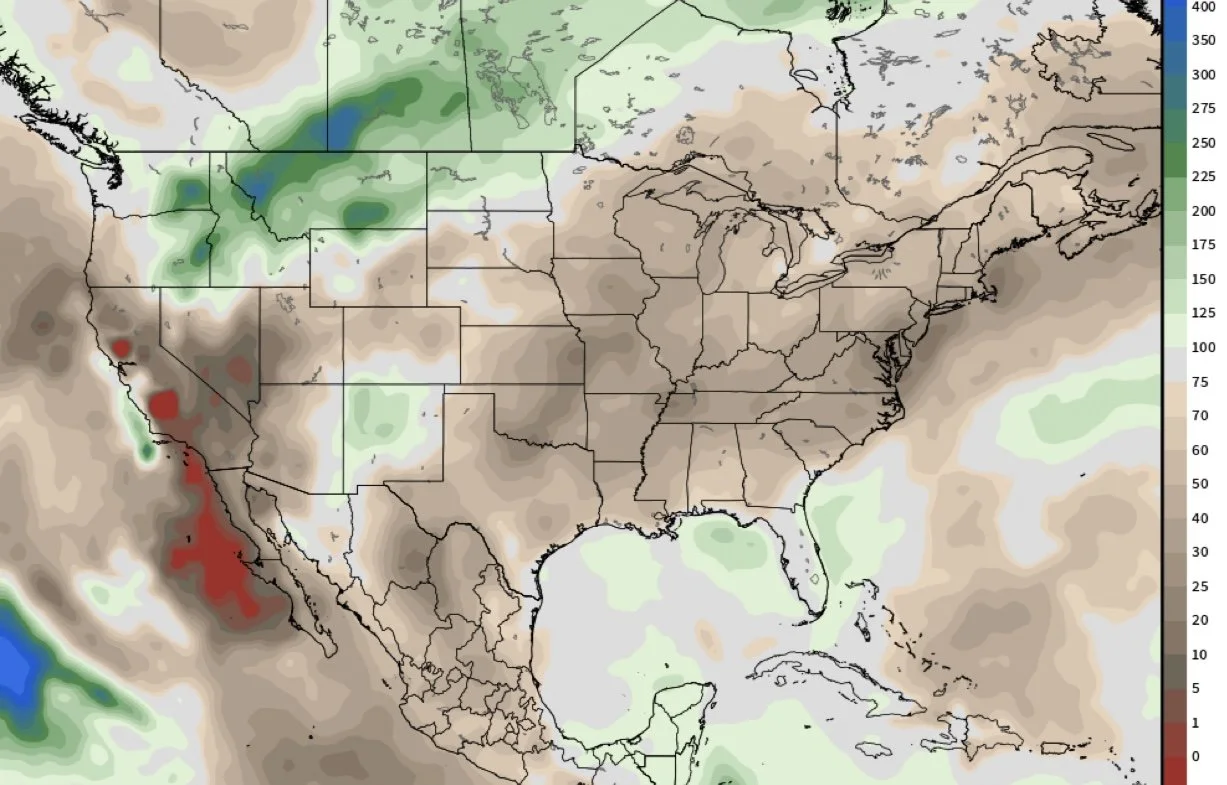
6-10 Day % of Normal Precip
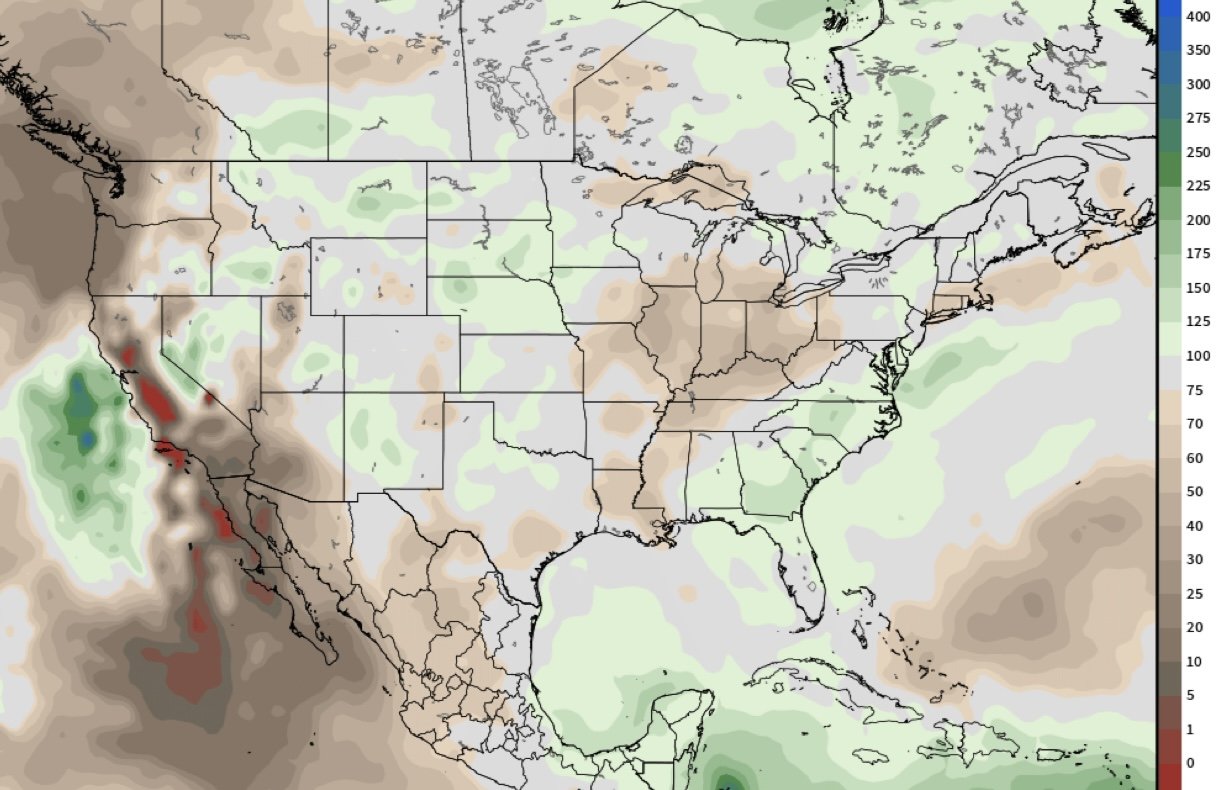
11-15 Day % of Normal Precip
1-5 Day Departure of Normal Temp
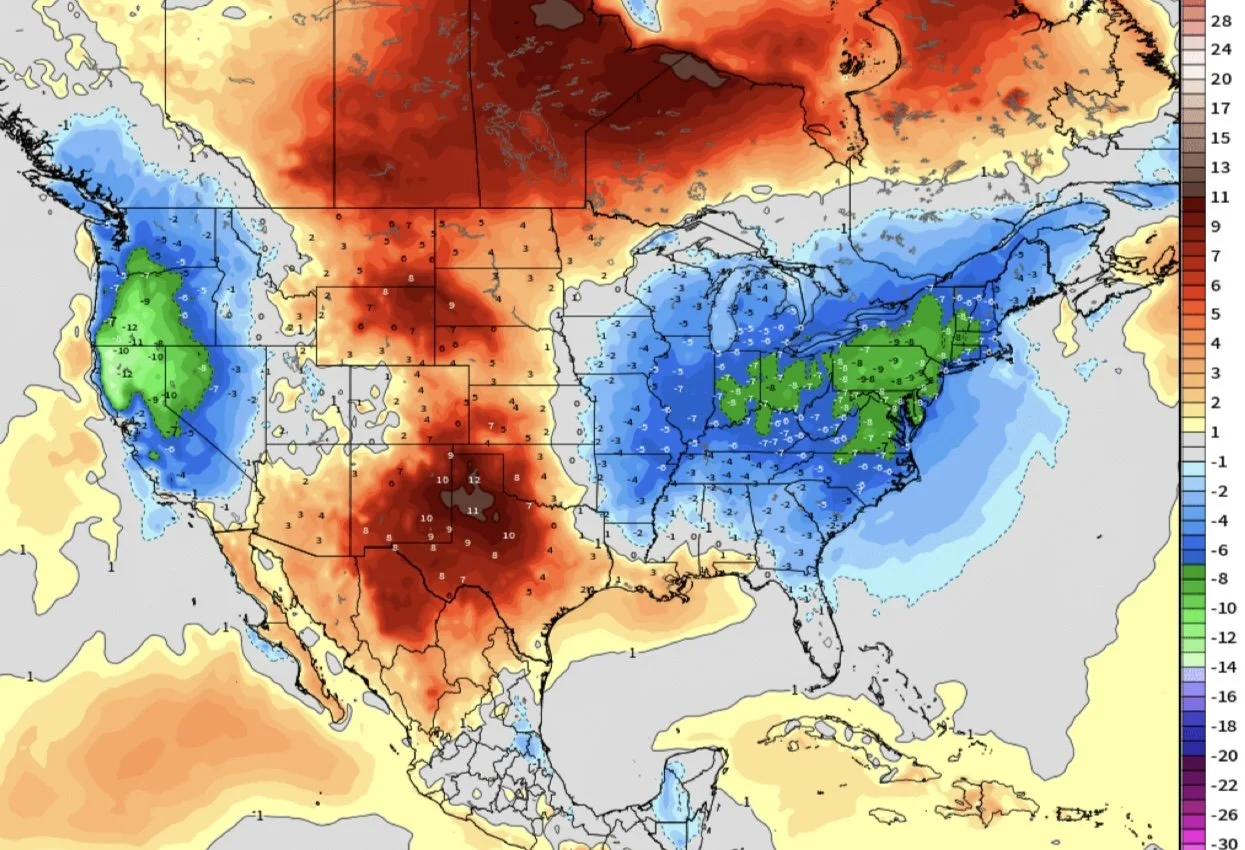
6-10 Day Departure of Normal Temp

Today's Main Takeaways
Corn
Corn gives back a portion of yesterday’s gains.
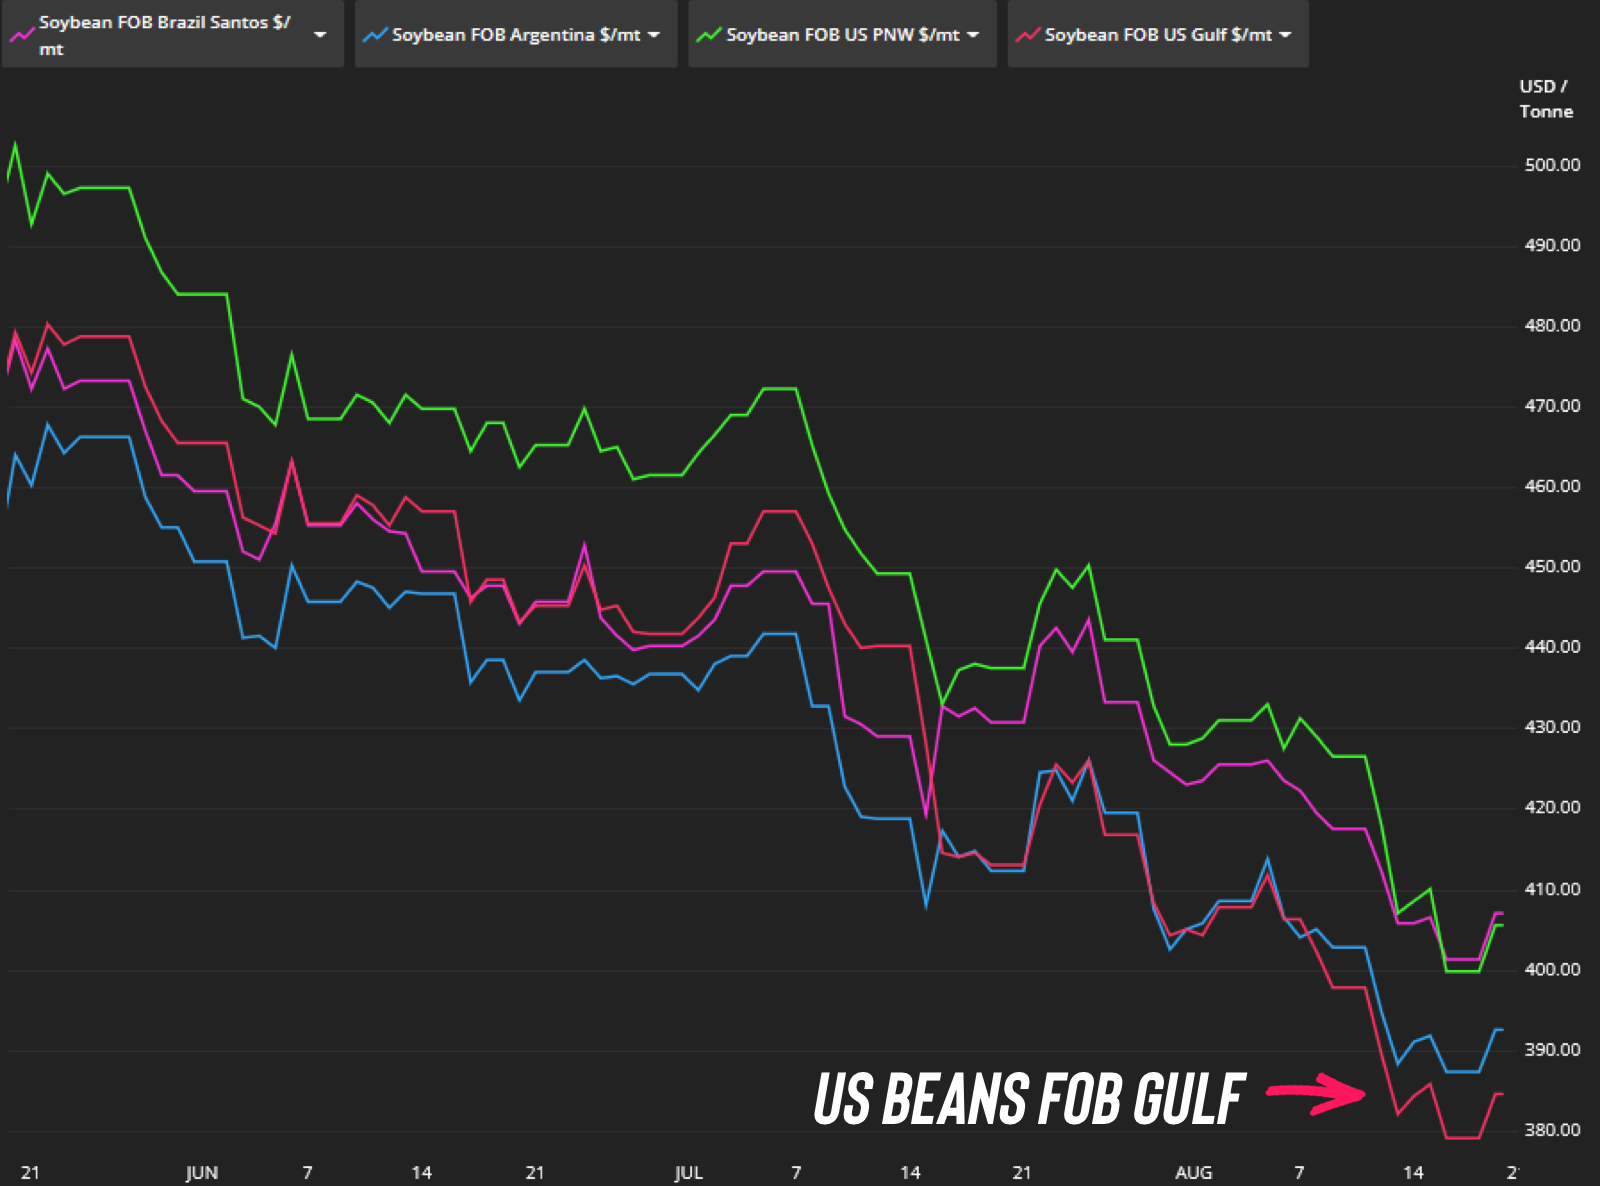
Corn is competitive globally. Which is great. As we have the cheapest corn in the world out of the US Gulf.
However, we haven’t seen a big spike in sales. Which we need. That alone would be enough to stop lower prices. We have had some daily announcements here and there, but not enough. I do think these lower prices will help create that much more demand. The USDA also believes this, as in the USDA report they raised their export projections.
Looking at the crop tour, there have been some individuals pointing out the effects of the wet planting. Stating that just because the crop looks good from the road, doesn’t mean it's this perfect crop. Once you get into the actual field you see some of the issues such as nitrogen loss.
If our yield winds up coming down to even 180, the market is not expecting that. So that would make our balance sheet look a lot better. Remember, last report they raised yield to 183 yet our carryout shrunk. What happens if yield comes down at the same time we start finding all this demand? Well it's the potential for higher prices.
I am not saying we are going to scream higher here. In fact, I am still not ruling a test of $3.80. Heck, even $3.50 corn is not impossible as we went there plenty of times in other bear market years.
But long term, these lower prices will help us go higher via demand. We also have fertilizer prices so high to the point where we could be looking at a lot less acres next year. High prices cure high prices, low prices cure low prices.
Long term I see higher prices, short to medium term I am very cautious.
It comes down to where your risk is. There is still plenty of downside risk, so if you are undersold or need to move something off the combine then keep some downside protection in case this is one of those years where we continue lower until harvest and don’t find a bottom until $3.50.
It will likely be hard to muster a major rally until we get past harvest, as we are going to have a lot of supply hitting the market. Seasonally, corn doesn’t turn higher until October 1st.
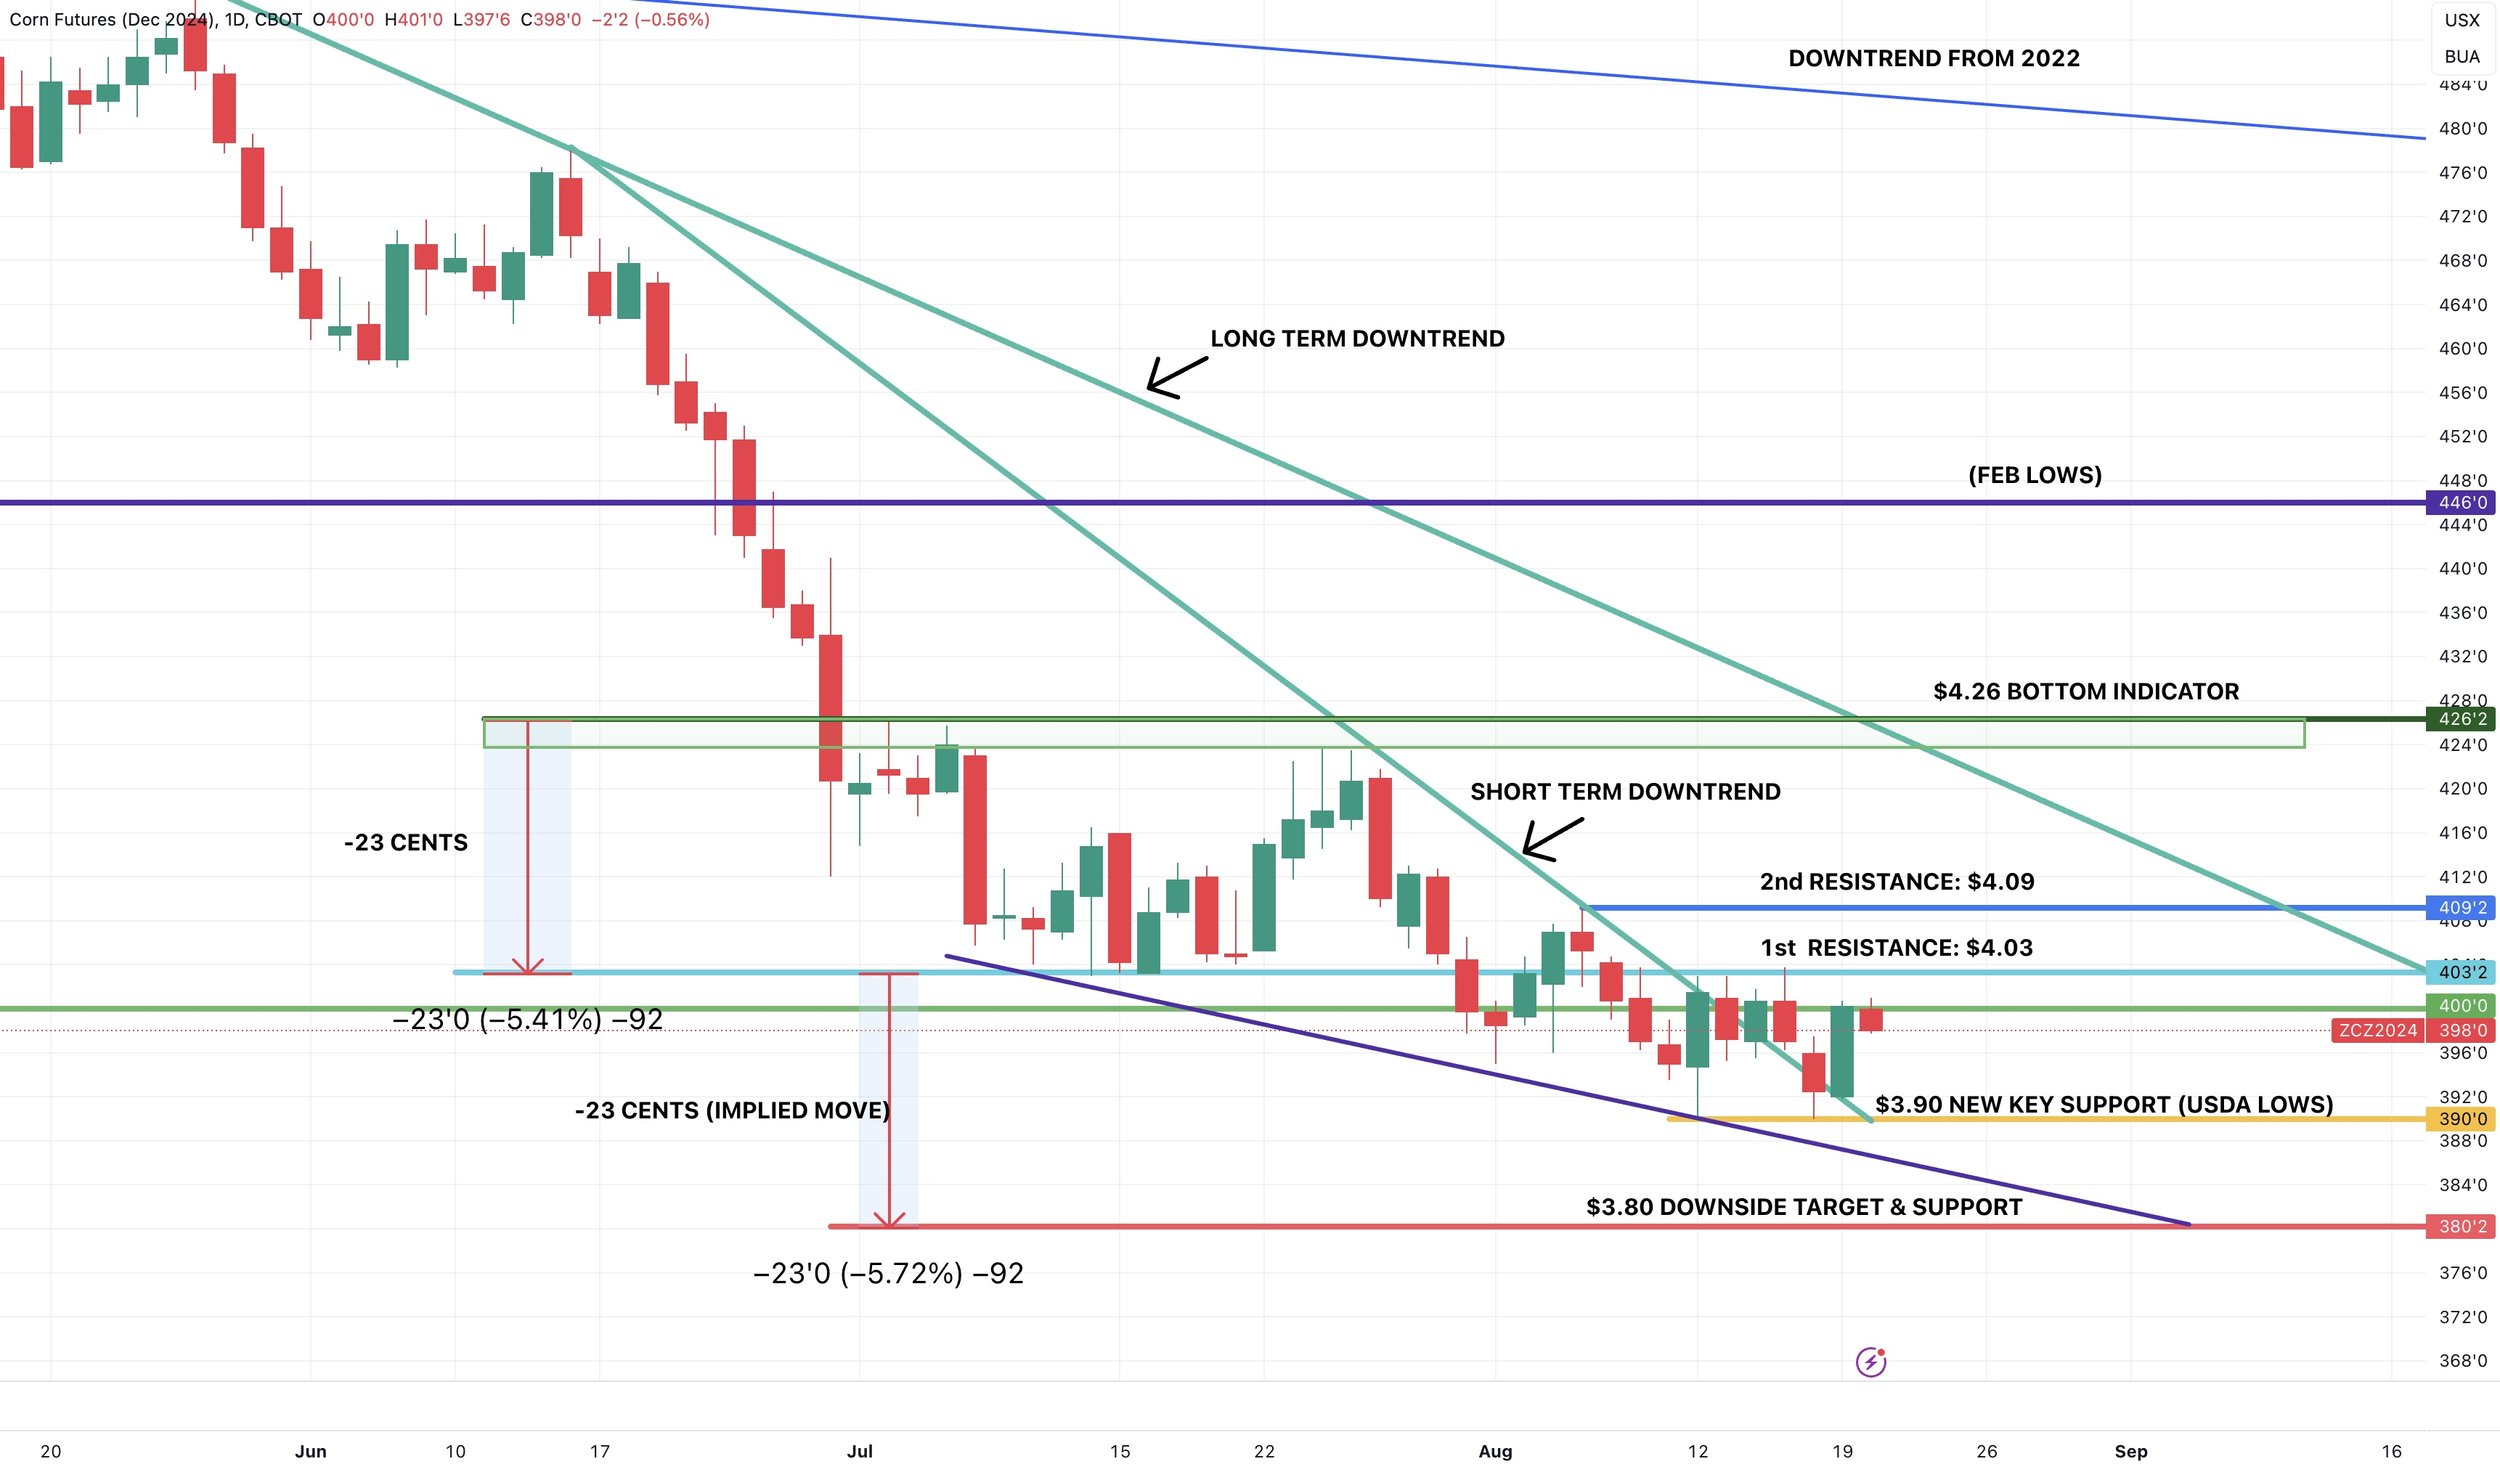
Looking at the chart, our first resistance is $4.03. Once we clear $4.09 the chart will look friendly. To be confident the bottom is in, I need $4.23. Until then, I am not ruling out the $3.80 downside target I've had the past few months.
If you want to go over your specific operation shoot us a call or text at (605)295-3100.
Daily Dec Corn
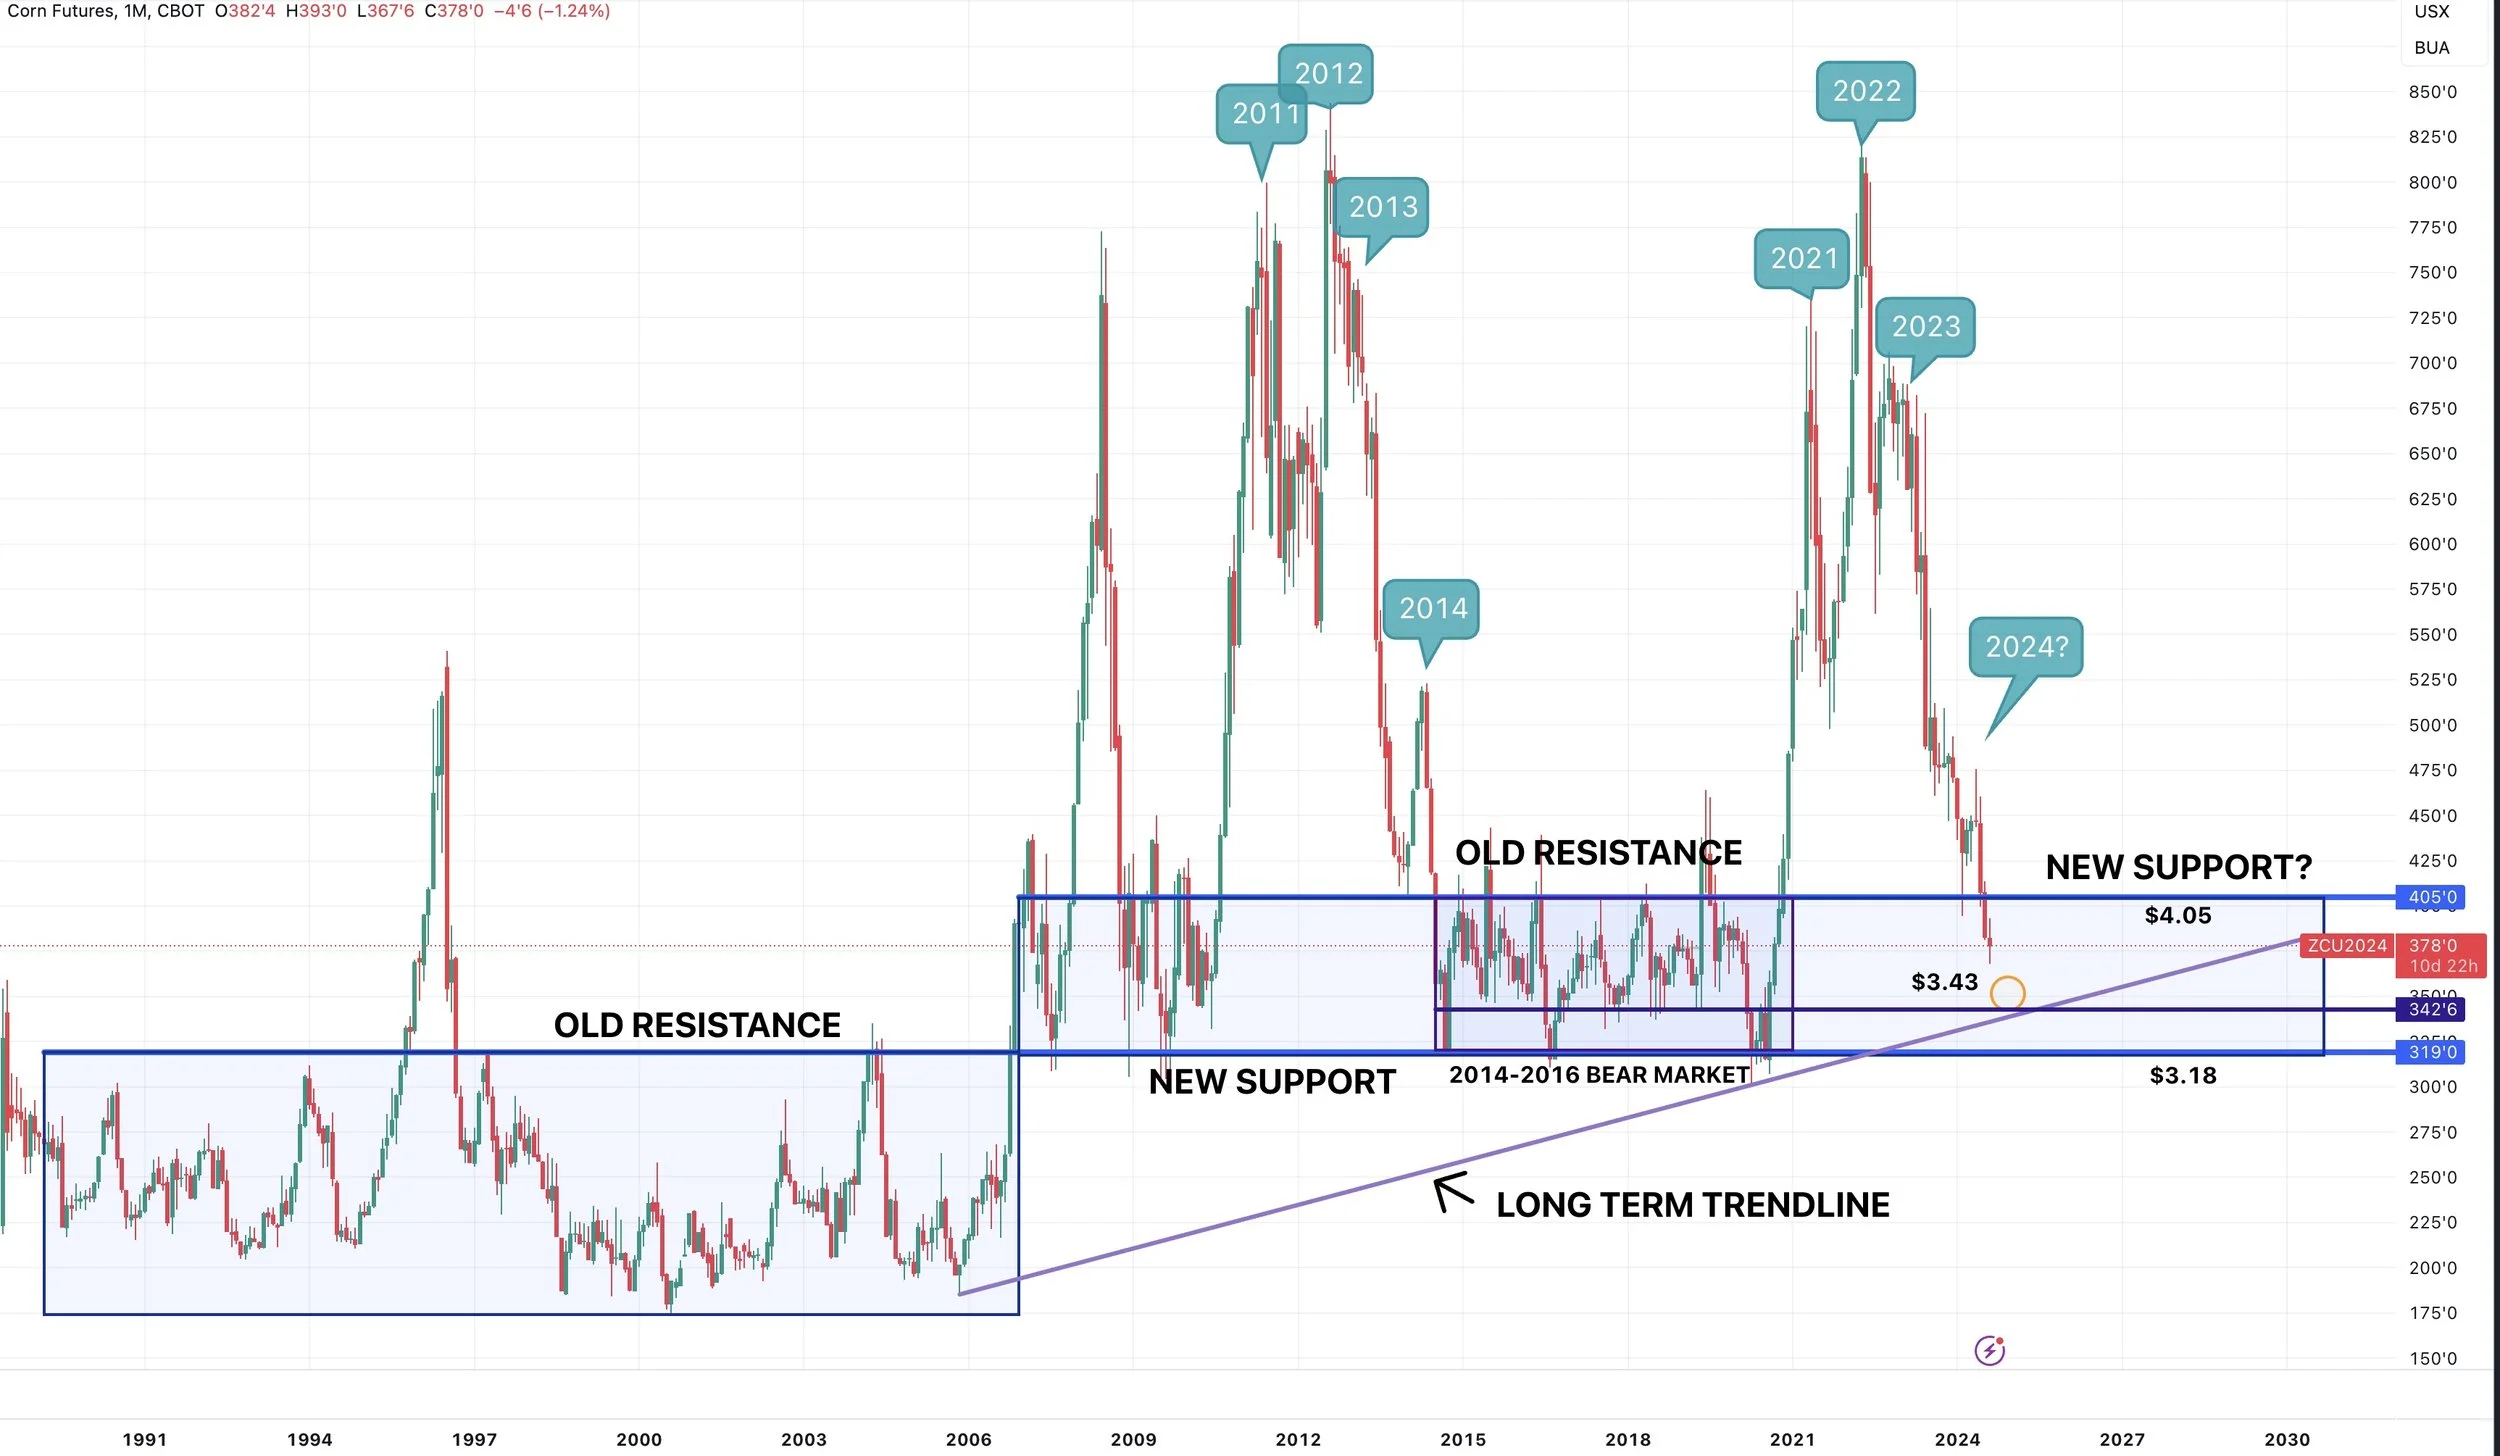
Monthly Front Month Corn
Soybeans
Not a good day on the charts for soybeans following yesterdays nice rally.
I am going to be short & straight forward with beans.
Until China starts to come in heavy, the risk is still lower.
There is no telling where the bottom is until China does so. When China starts to buy, you will know the bottom is in.
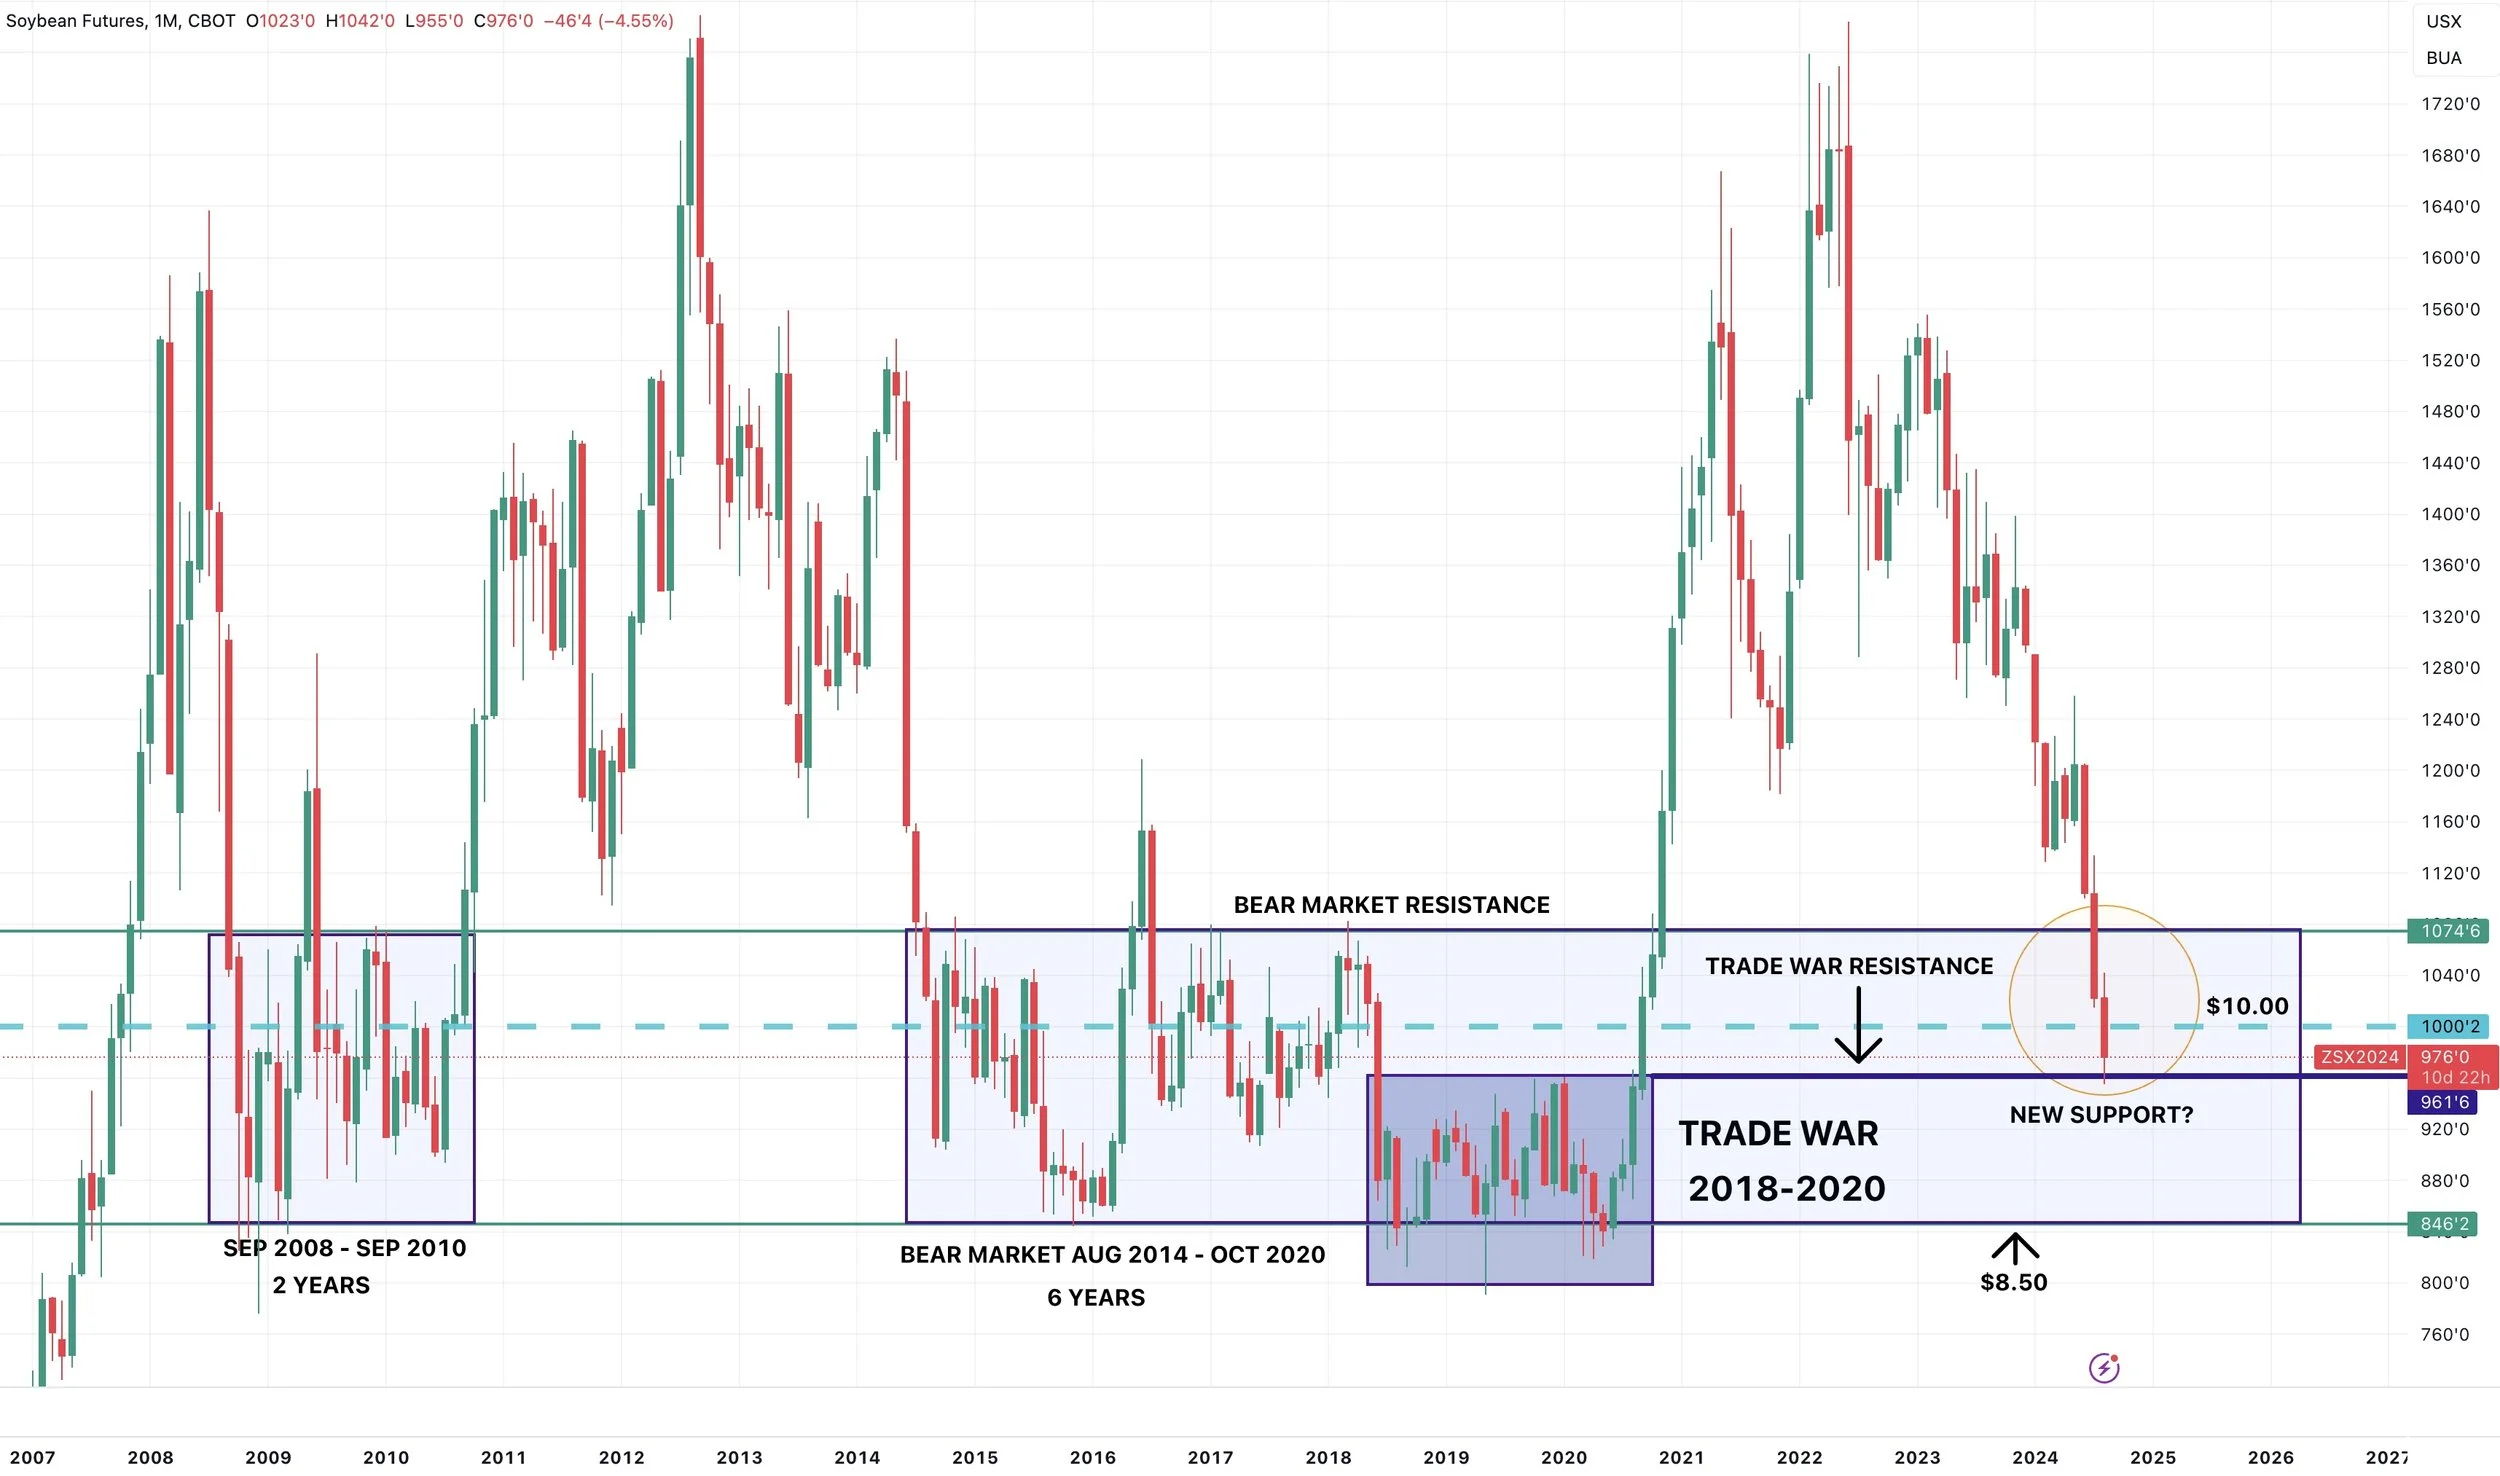
The USDA report provided a bearish shock where we now have a massive bean carryout. The only thing that can eat into that carryout is either demand or a problem in South America.
Demand from China can happen fast. If we were going to get a supply shock from South America, it will not be for another few months.
From a well respected soybean trader:
"Don’t look at price. Look at timing. Mid-October, after the WASDE when harvest is near 50%, China comes in hot and heavy. Regardless of price level. The market balances."
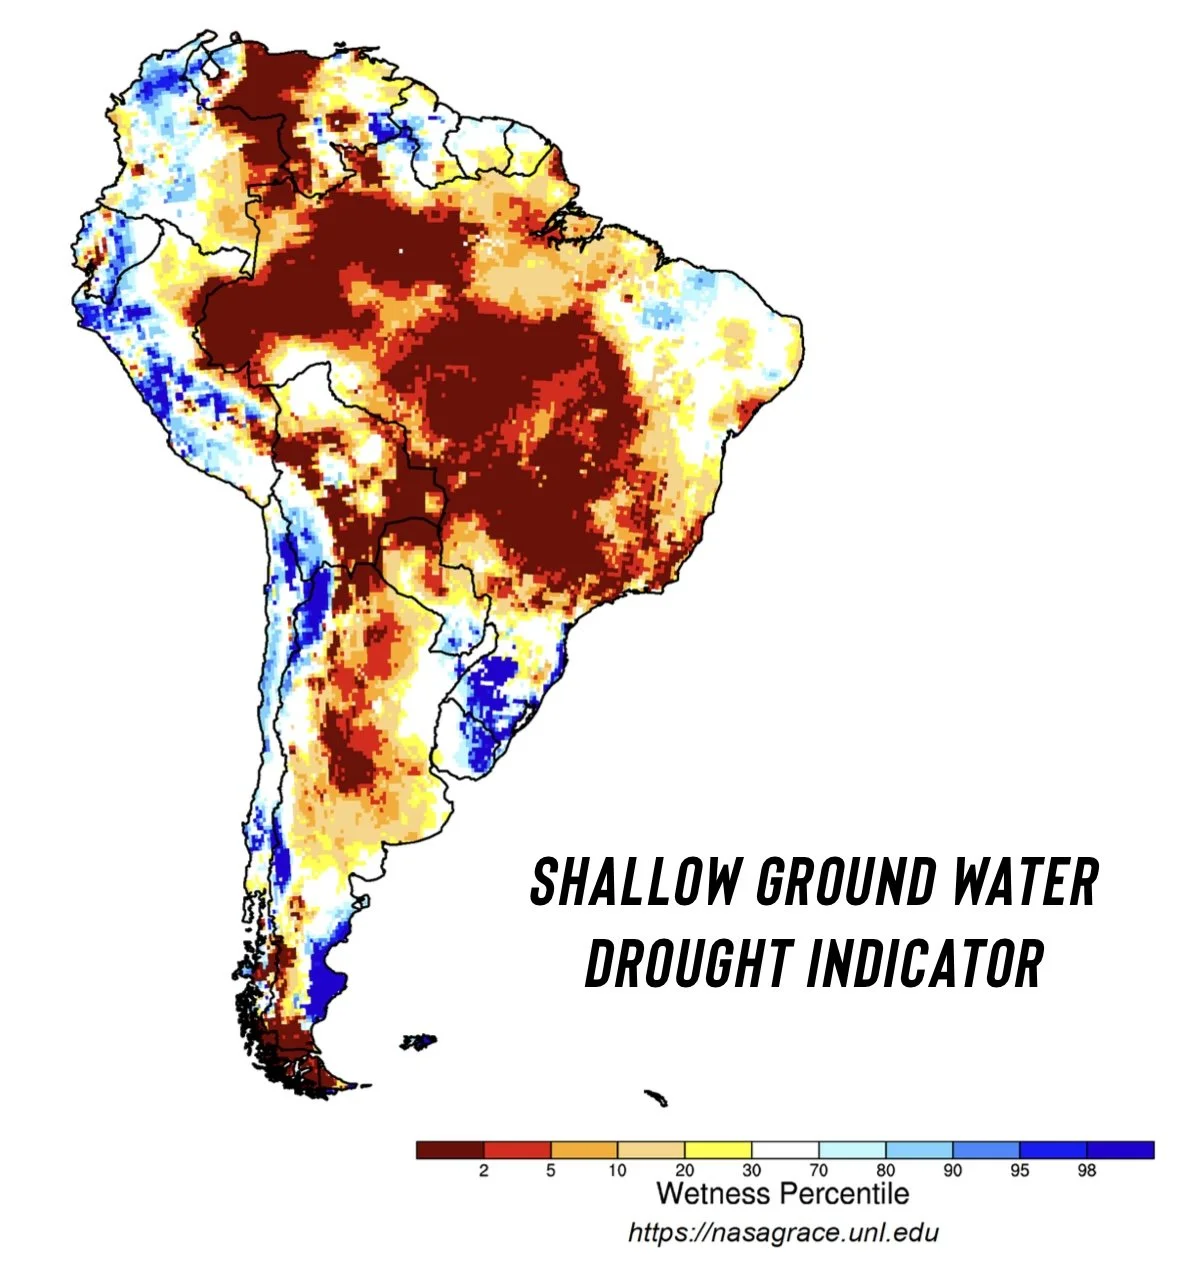
Looking at South America. They are having their driest dry season on record. This does NOT matter today. As even though it's record dry, it is suppose to be dry.
BUT, if it continues it could certainly lead to bigger issues. Brazil will also be entering their planting season with record low sub soil moisture. One monsoon rain could fix all of this. But if that rain doesn’t come is when things get interesting.
Don’t rely on this, but keep an eye on it.
Long term we will find demand. As US gulf beans are now by far the cheapest in the world. The biggest risk is how low can we go before China shows up.
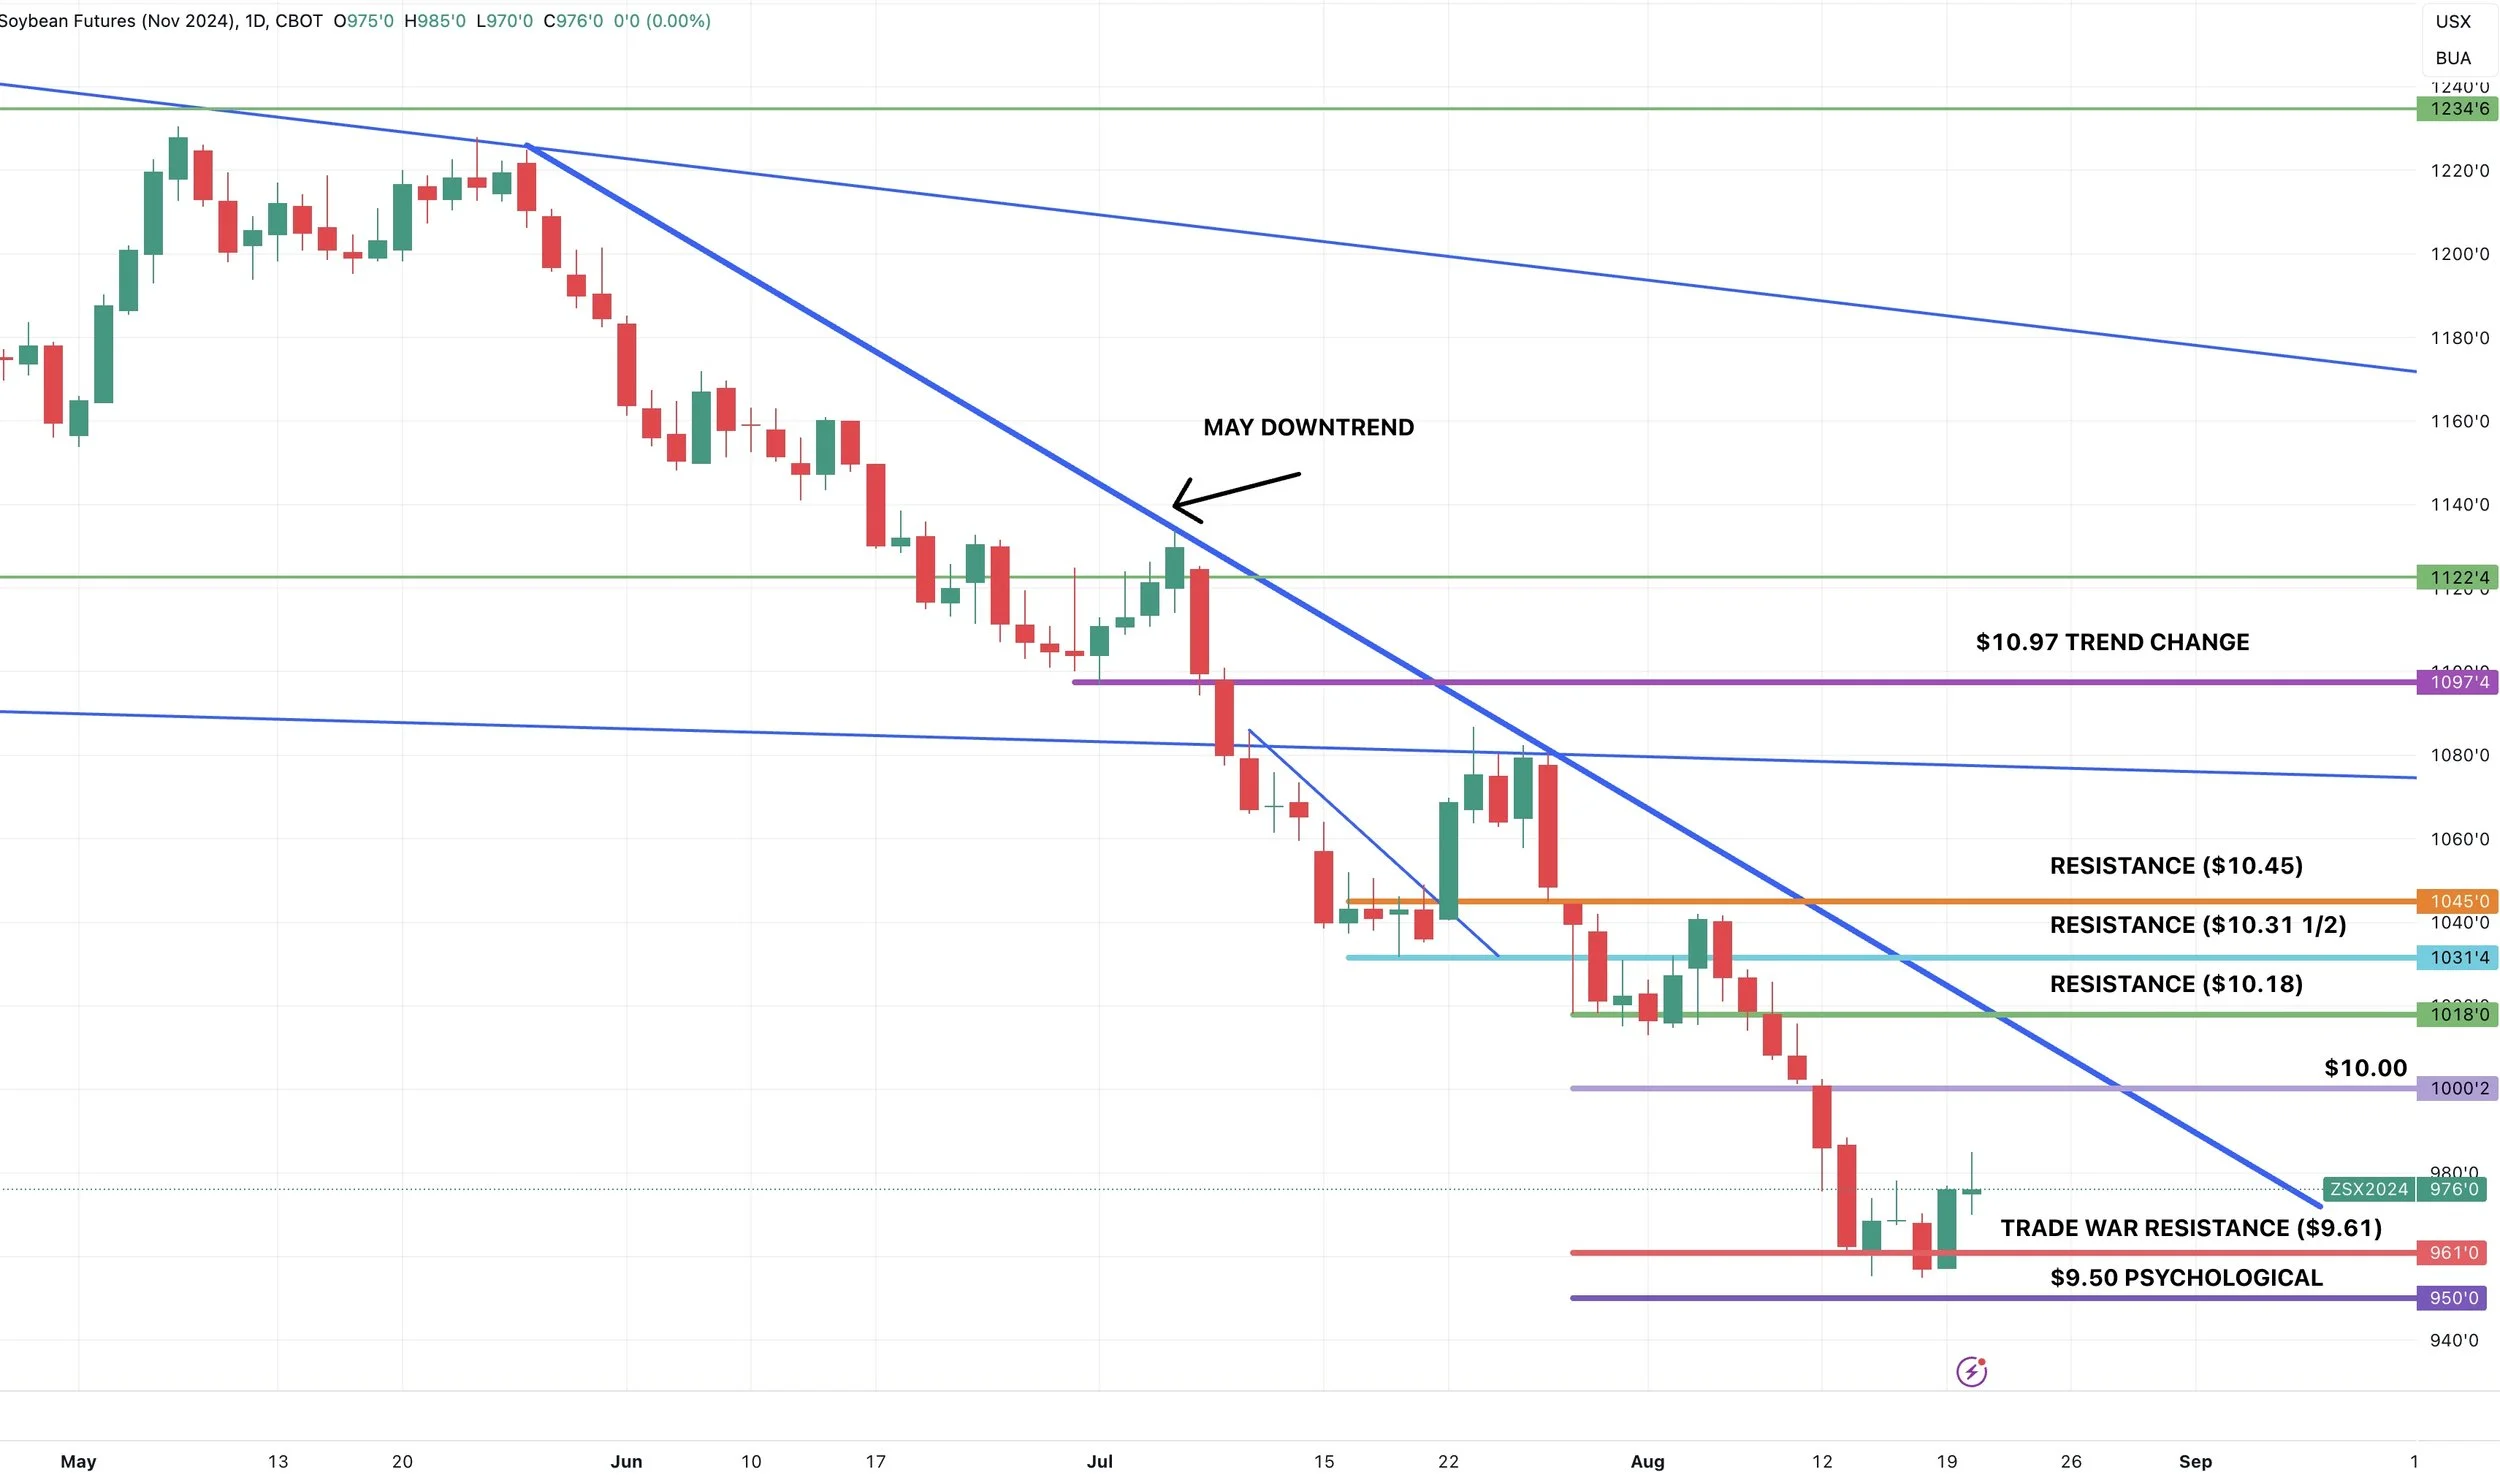
Looking at the charts, we are still in a clear downtrend.
If your risk is lower, get some downside protection.
Until China steps in, there is no telling how low is low enough to create enough demand to justify higher prices.
Daily Nov Beans
Monthly Beans
Wheat
Wheat leads the way today.
Overall not a ton of news surrounding wheat as the main focus is the crop tours.
We did see some reports that suggest the heavy rains in North Dakota the past week negatively impacted the spring wheat crops but so far we haven’t seen prices reflect that.
There are still plenty of factors that could lead to higher wheat prices the next few months. One being that we will probably be looking at less wheat acres with the suppressed prices.
There is still issues globally in Russia, France, India etc. But none of that matters today.
I still think we are at the very least near the lows, carving out a bottom.
If you are undersold or didn’t make sales on the Russia rally, I still like protecting the downside until you make a sale.
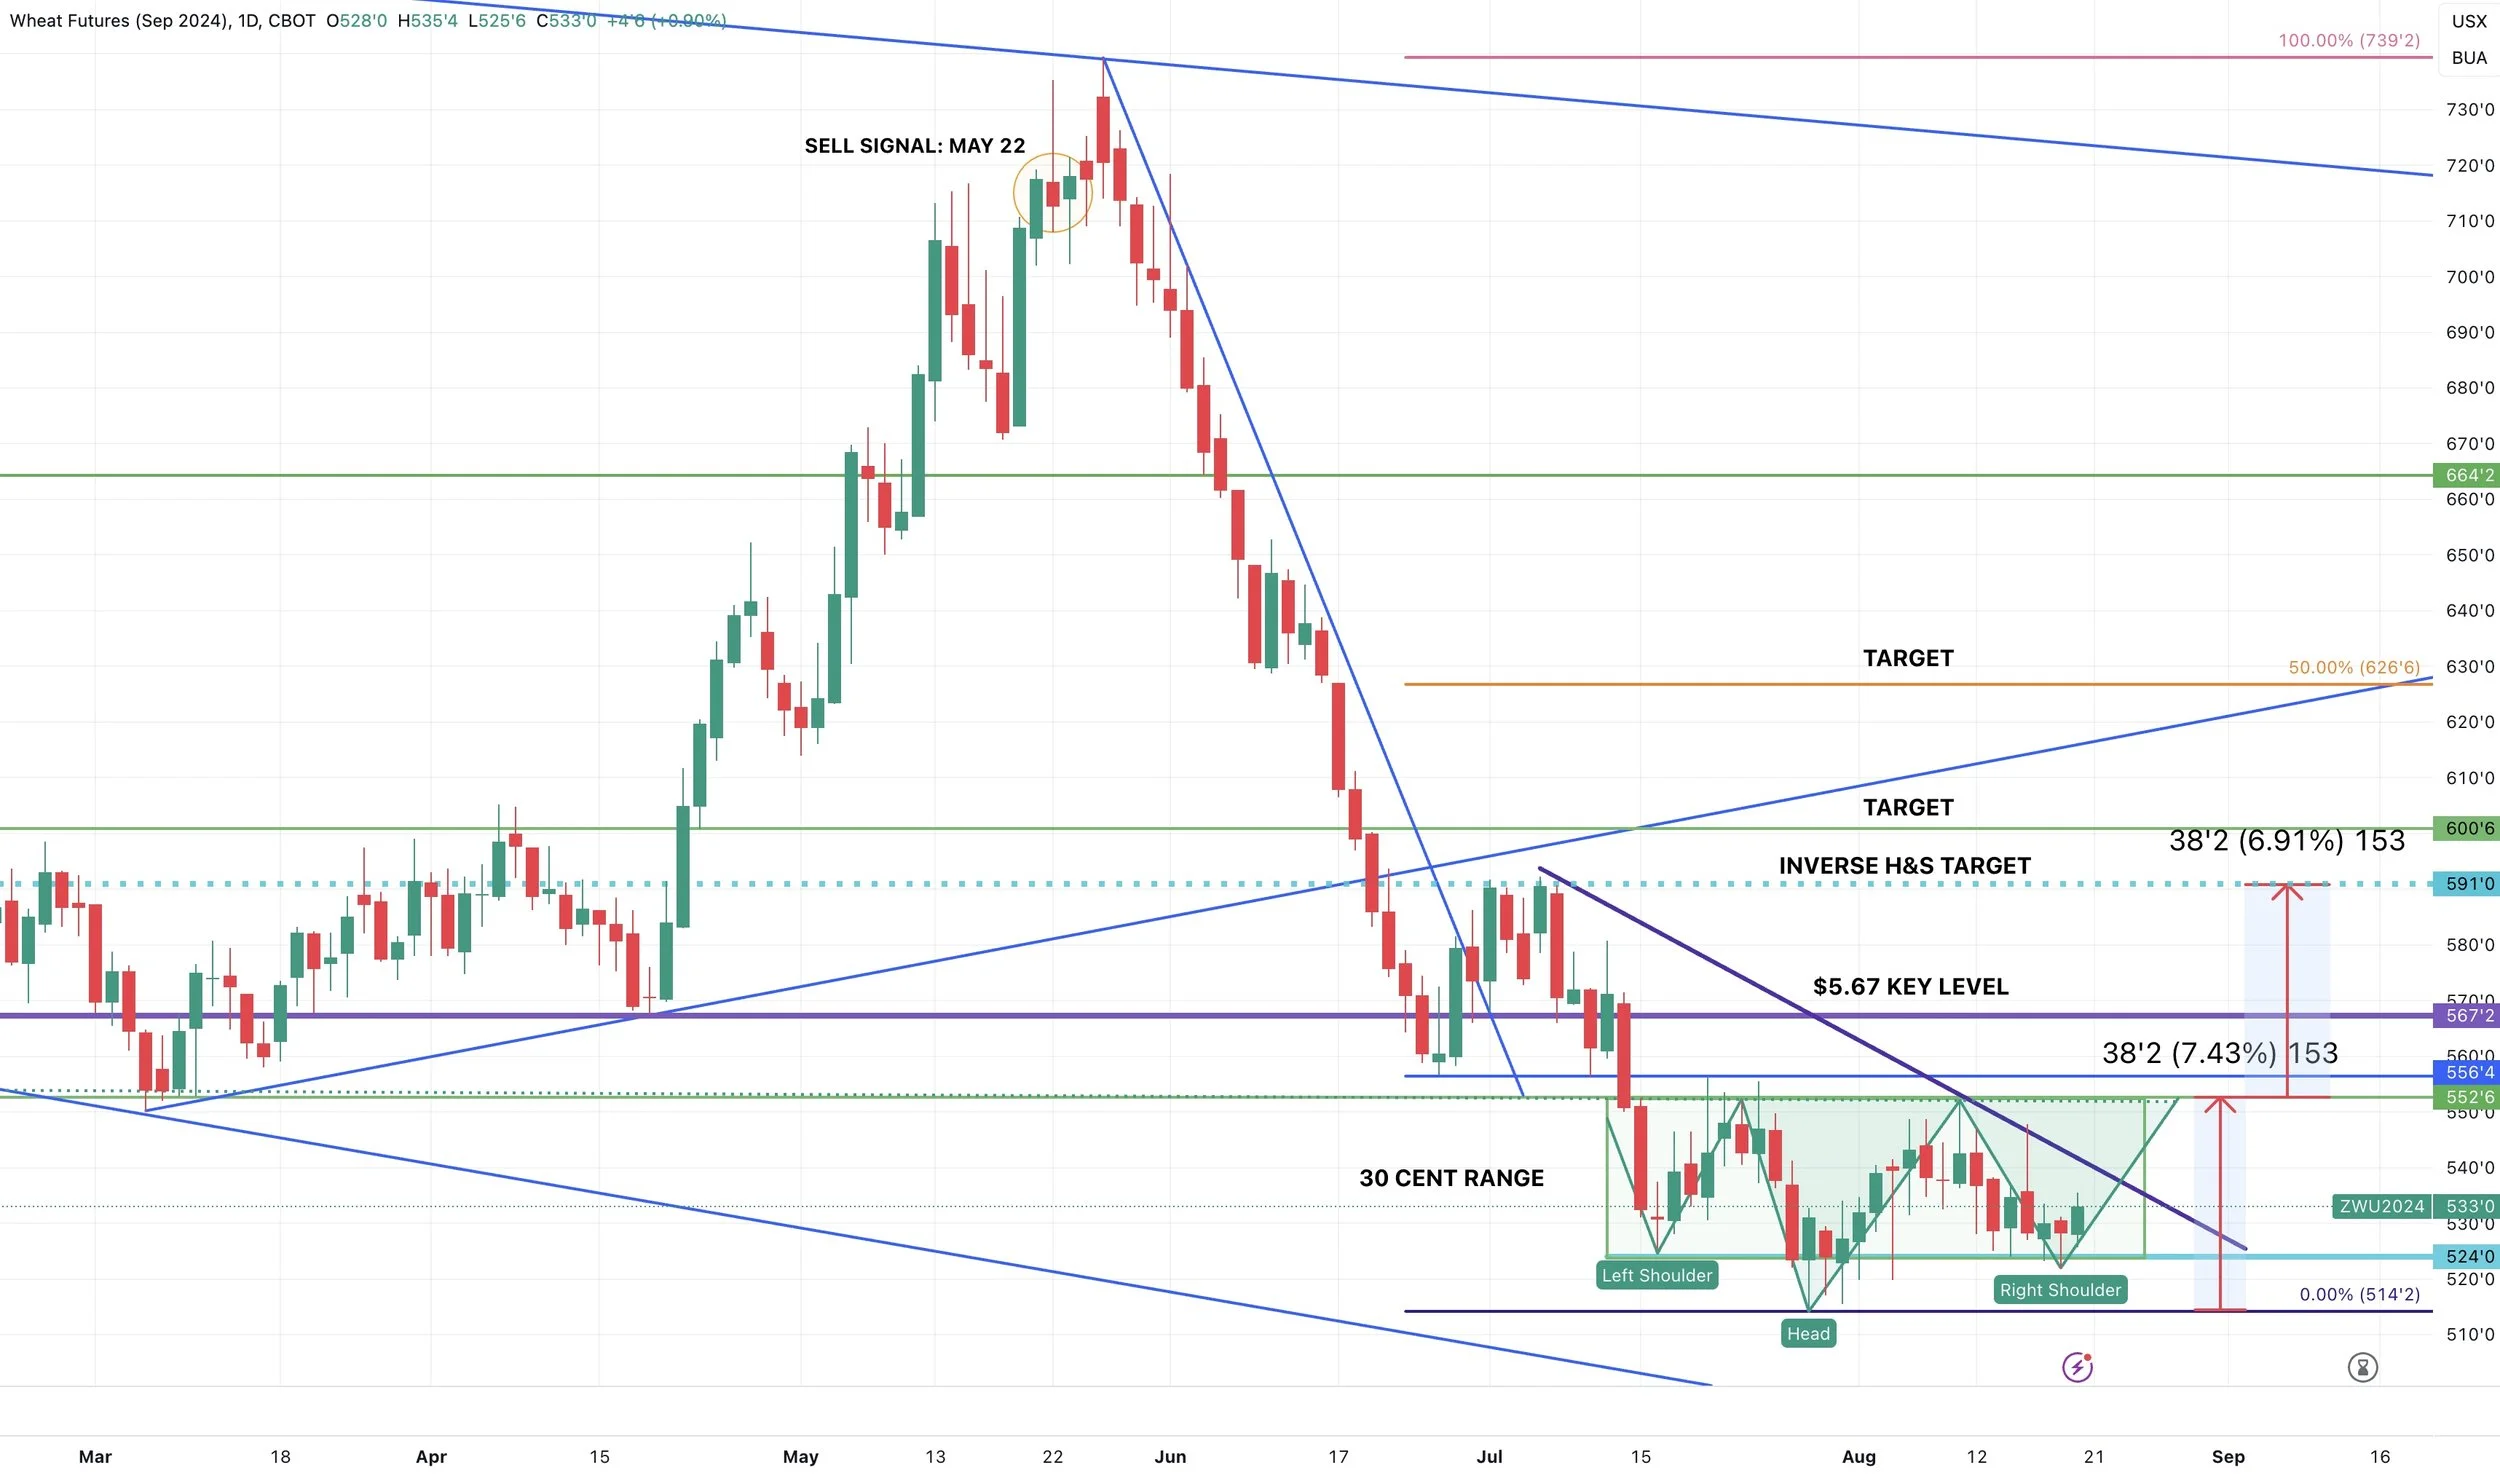
Looking at the chart, we continue to be in no mans land in this 30 cent range. A break out of this green box would indicate higher prices, a break below it would indicate another leg lower.
We do have a potential inverse head & shoulders pattern forming (bullish). The implied target for this move would bring us to our late June/early July highs of $5.90. (Blue dotted line).
So that is a good target for those that need to catch up. After that I have targets at $6.00 and $6.25 (our 50% retracement from our May highs).
Daily Sep Chicago
Daily Sep KC

Want to Talk?
Our phones are open 24/7 for you guys if you ever need anything or want to discuss your operation.
Hedge Account
Interested in a hedge account? Use the link below to set up an account or shoot Jeremey a call at (605)295-3100.
Check Out Past Updates
8/19/24
CROP TOUR BOUNCE
8/16/24
RISK REMAINS LOWER. MANAGE YOUR RISK
8/15/24
DEMAND, BIG US CROPS & BRAZIL DROUGHT
8/14/24
DEAD CAT BOUNCE
8/13/24
POST USDA SELL OFF
8/12/24
USDA REPORT: BEARISH BEANS. SMALLER CORN CARRYOUT & RECORD YIELDS
8/9/24
USDA REPORT MONDAY
8/7/24
HUGE USDA REPORT MONDAY
8/6/24
WHEAT UNDERVALUED? CORN YIELD? WHAT TO DO WITH GRAIN OFF COMBINE
8/5/24
GRAINS STRONG WHILE WORLD PANICS
8/2/24
GRAINS RALLY, YIELD ESTIMATES, CHINA STARTS TO BUY
8/1/24
MARKET EXPECTS A PERFECT CROP?
7/31/24
CORN BREAKS $4.00, FAVORABLE WEATHER & CHARTS
7/30/24
GRAINS FAIL REVERSAL BACK NEAR LOWS
7/29/24
GRAINS SHOW SIGNS OF REVERSALS
7/26/24
BLOOD BATH IN GRAINS: EPA REVERSAL & WEATHER
7/25/24
CHINA, DROUGHT, FUNDS & RISK
7/24/24
BEANS LOWER DESPITE DROUGHT TALK
7/23/24
BACK TO BACK GREEN DAYS FOR CORN & BEANS: MARKETING DECISIONS
7/22/24
BEST DAY FOR GRAINS IN A LONG TIME
7/19/24
DULL MARKETS: STRATEGIES TO USE IN GRAIN MARKETING
7/18/24
DEMAND, CHINA, POLITICAL PRESSURE, & TECHNICALS
7/17/24