SEASONALS, CORN DEMAND, BRAZIL REAL & MORE
MARKET UPDATE
You can still scroll to read the usual update as well. As the written version is the exact same as the video.
Want to talk? (605)295-3100
Futures Prices Close
Overview
Grains mixed as beans lead the way higher. Posting some reversal type action following 4 straight red days.
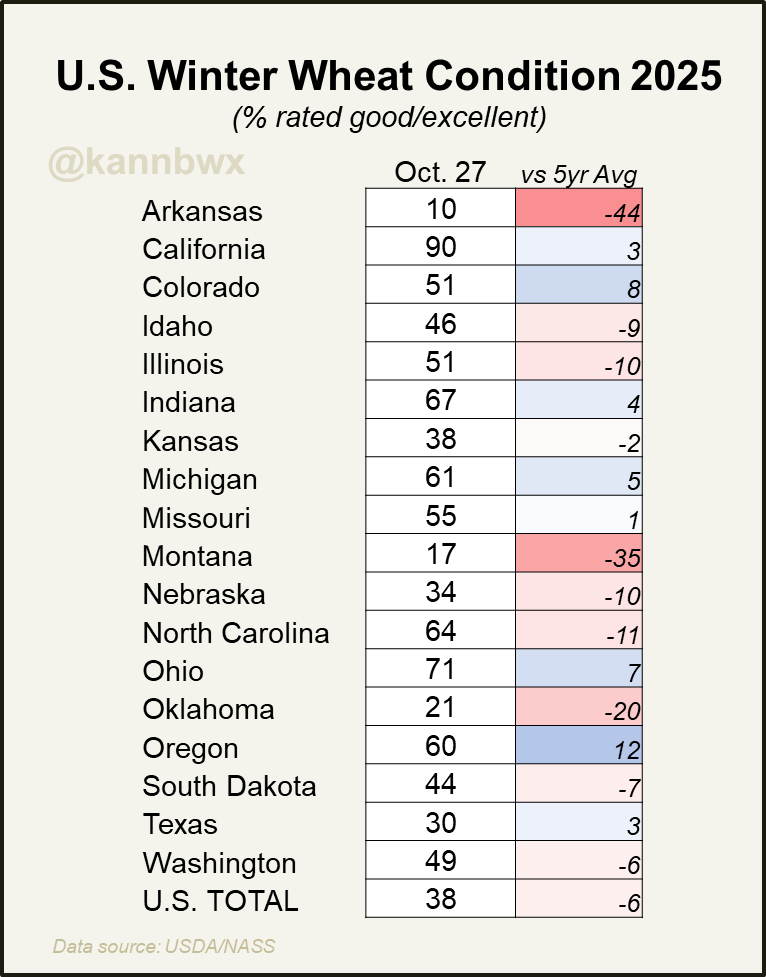
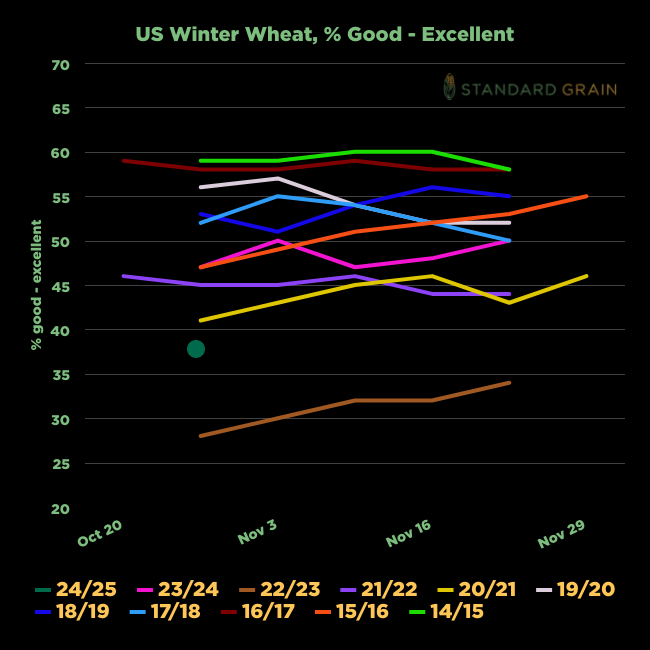
Wheat found some strength off of winter wheat crop ratings showing the 2nd worst ratings on record for this time of year. Rated just 47% G/E.
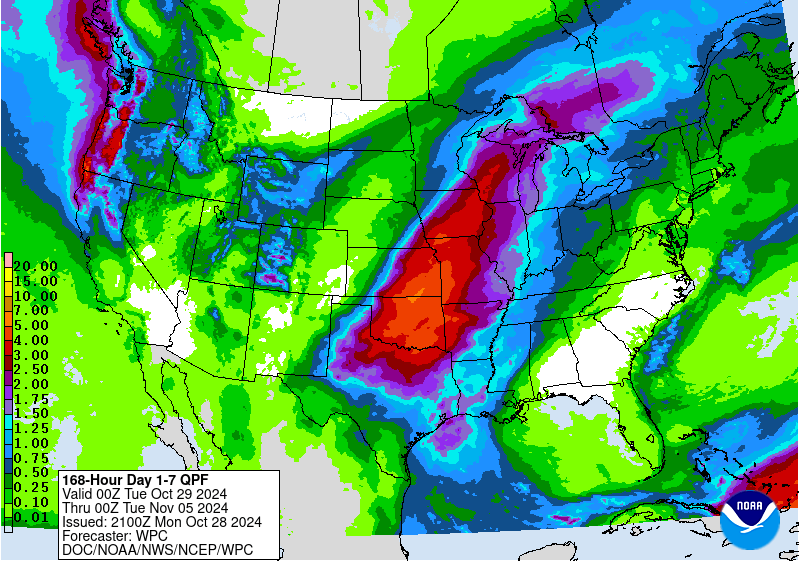
However, there is rain scheduled to fall in the plains for the first time in a long time. So that will likely ease some of those drought concenrs.
Another thing to keep in mind is that usually the very first ratings do not have a major correlation to the final ratings for winter wheat. They can completely change.
Ratings vs Avg from Karen Braun
Chart from Standard Grain
Next 7 Days Rain
Soybeans are still stuggling for a bullish story.
As we have both the US harvest & Brazil planting adding some pressure.
US harvest is basically complete. So we should get less harvest pressure now.
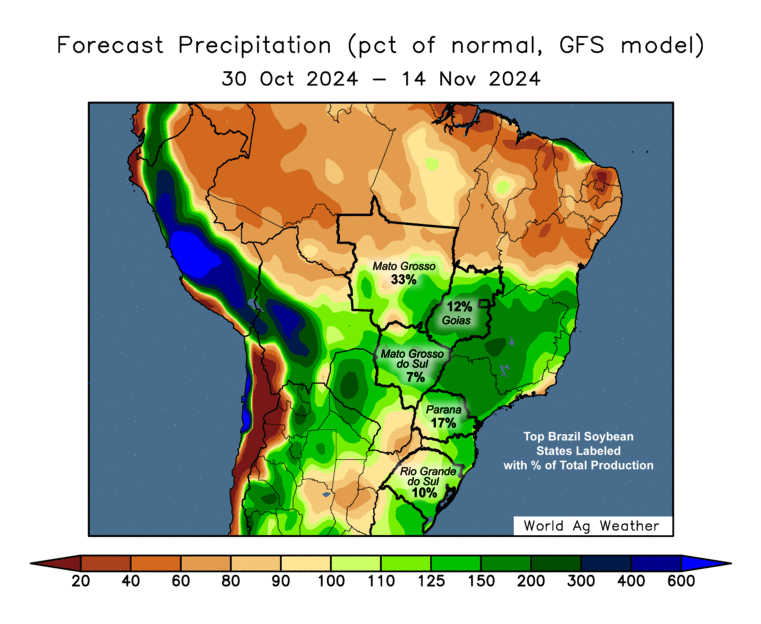
Brazil bean planting is essentially completely caught up now after behind far behind. There is still rain in the forecasts for Brazil. So no threat there yet.
Next 2 Weeks Rain vs Normal
China Stimulus
One headline we did see is that China is considering a $1.4 trillion fiscap package to boost their economy.
This package equates to 8% of China's total GDP.
The market didn’t get a huge reaction to this, but certainly has the potential to be a market mover later.
This is 1 of 3 things that could save the bean market. The others being China buying a lot more beans or Brazil getting a scare.
First Notice Day
Tomorrow is first notice day.
Often times in a carry market we see this pressure futures leading into it.
We likely saw nearly all of the basis contracts rolled or priced on Monday & Tuesday, hence why the bean market was so weak to start the week.
Now that first notice day selling is gone, maybe it will allow beans to perhaps find some footing until the next market moving factor comes along.
Election Update
The election is next week.
Currently, the betting markets have Trump favored 67% vs Kamala’s 33% to win.
I would like to think the market mostly has a Trump win priced in for now.
So if Trump wins, no I do not think beans fall out of the sky the next day.
If anything, I could see the election being a sell the news buy the fact event and lead to soybeans actually bouncing a little.
The long term effects of the tariffs etc the next few years is obviously still an unknown however and ultimately still has the chance to be very bearish for beans long term.
Going into the election I do not see the markets making any major moves with the uncertainty. Most traders are going to be on the sidelines until then.
Outside of that, not a big news day.
So today we will mainly just look at some charts & give short vs long term thoughts.
First seasonals.
Seasonals
Corn 🌽
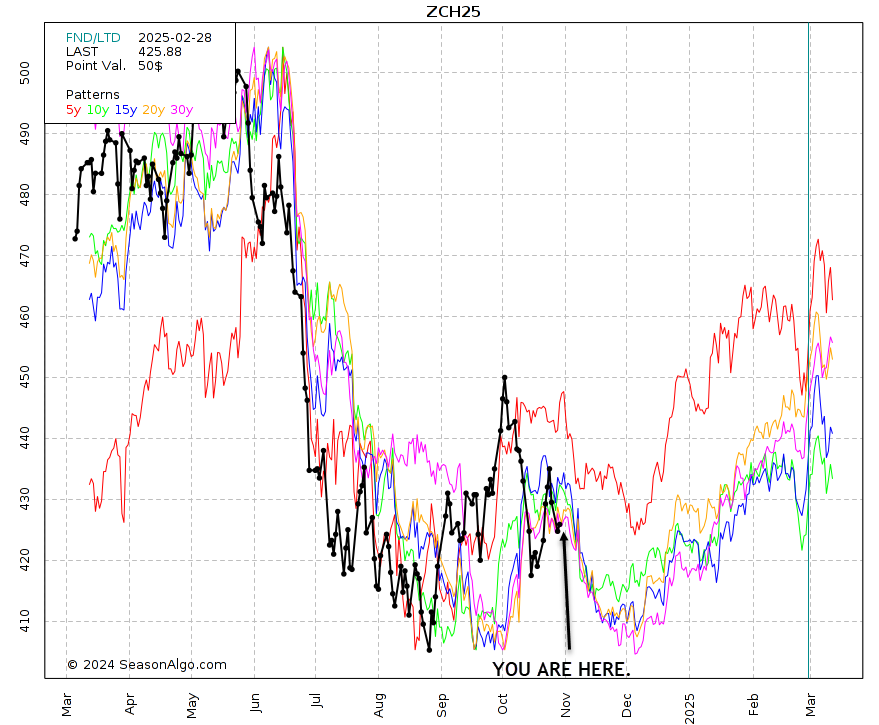
If you look at this seasonal chart, we almost always bottom twice. The first comes in August to early October.
Which we also did this year. (This year is the black line)
After the first bottom, we usually rally a little until around mid-October to November 1st.
Which we also did this year.
After that rally, we usually make a secondary bottom around December 1st.
In the 10, 15, and 20 year seasonals that second bottom says we will test that first August low. (all color lines except black & red).
In the 5 year seasonal (red line) we do not test that August low but do also make our low around December 1st. The 5 year seasonal would have us bottoming right around here at $4.00 based purely on price level. But timing would say we do not bottom until December 1st.
However something to keep in mind is we did have a faster harvest this year. Which could lead to us bottoming slightly earlier than normal.
Regardless, the real move usually doesn’t start until December.
And in every seasonal we do wind up taking out those highs from the Sep-Oct rally.
Seasonals are not perfect, for example last year. We were supposed to rally going into January and did not.
But they currently predict us bottoming by December between $4.00 and $3.85 before starting the move higher into the next year.
My guess is we chop around $4.00 to $4.20 for November then start the move higher in December.
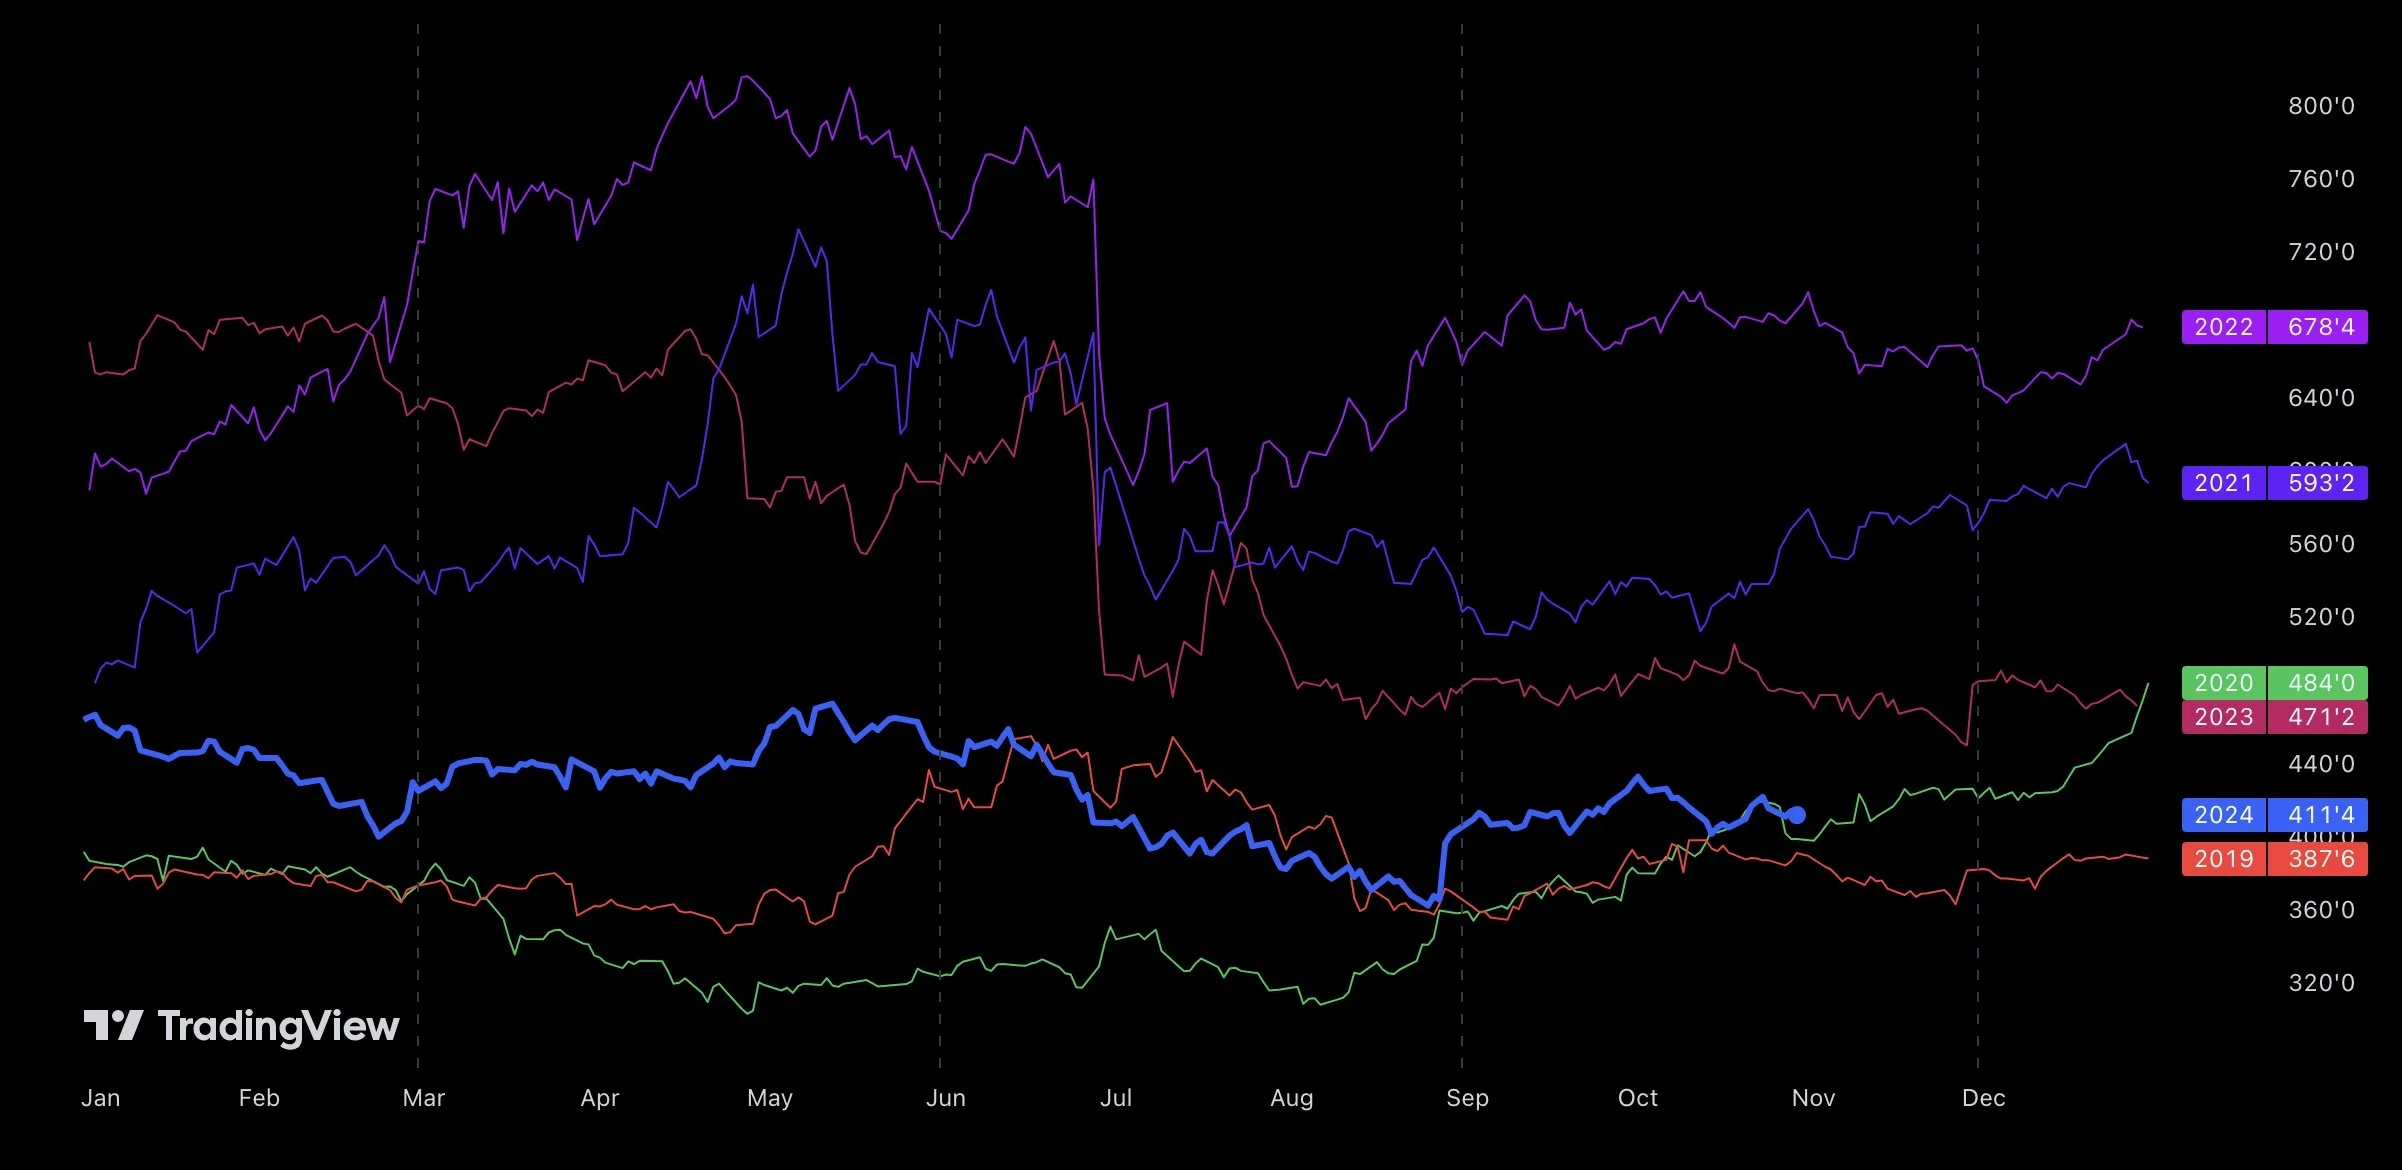
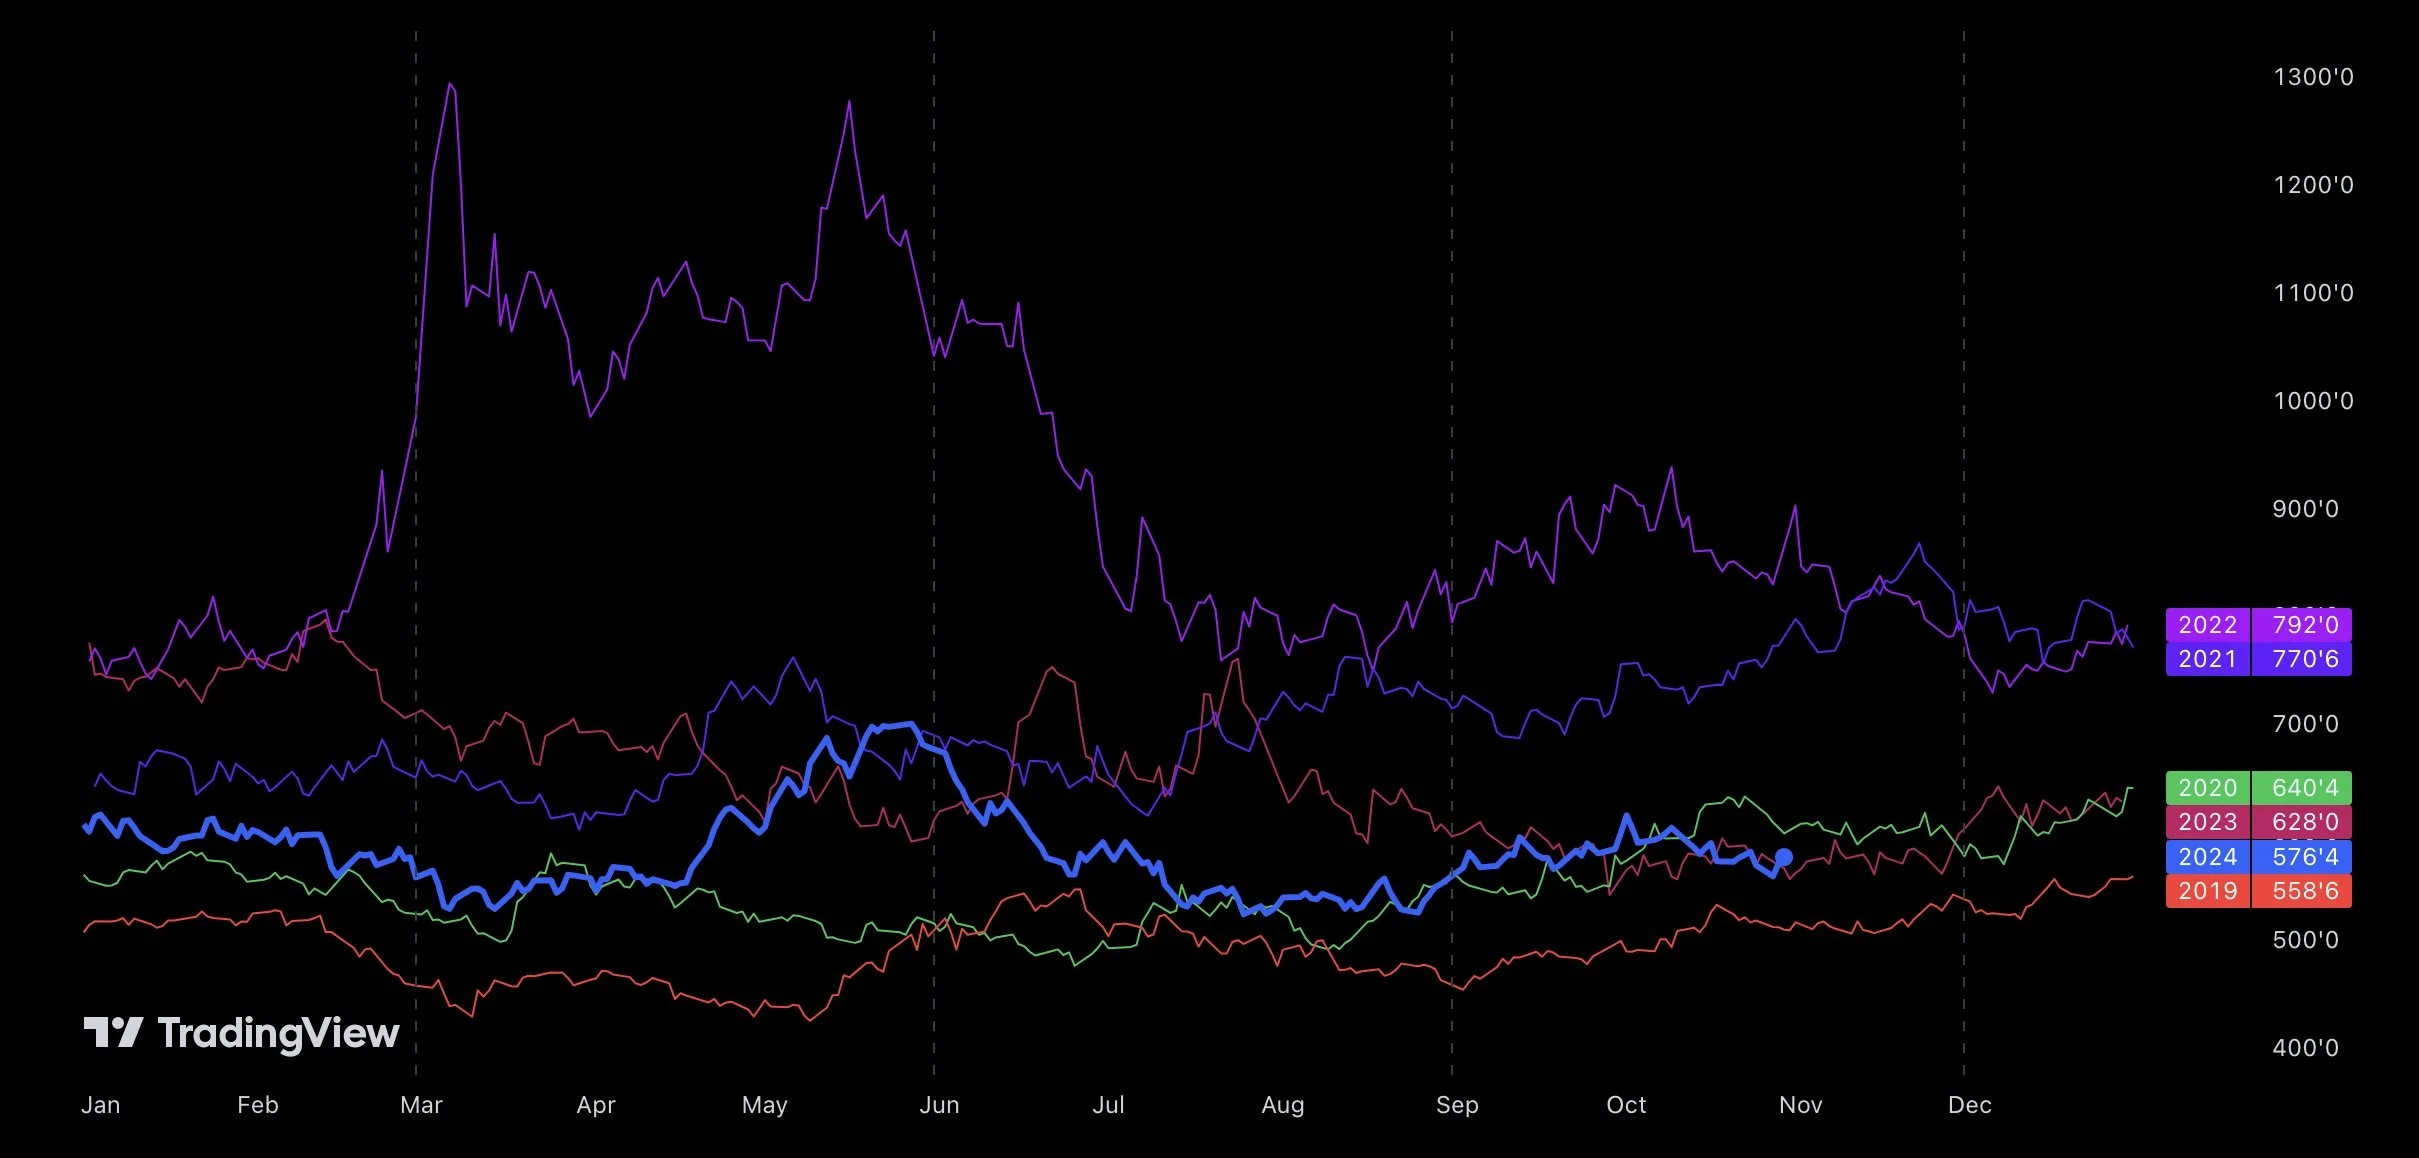
Past 5 Years Price Action
Soybeans 🌱
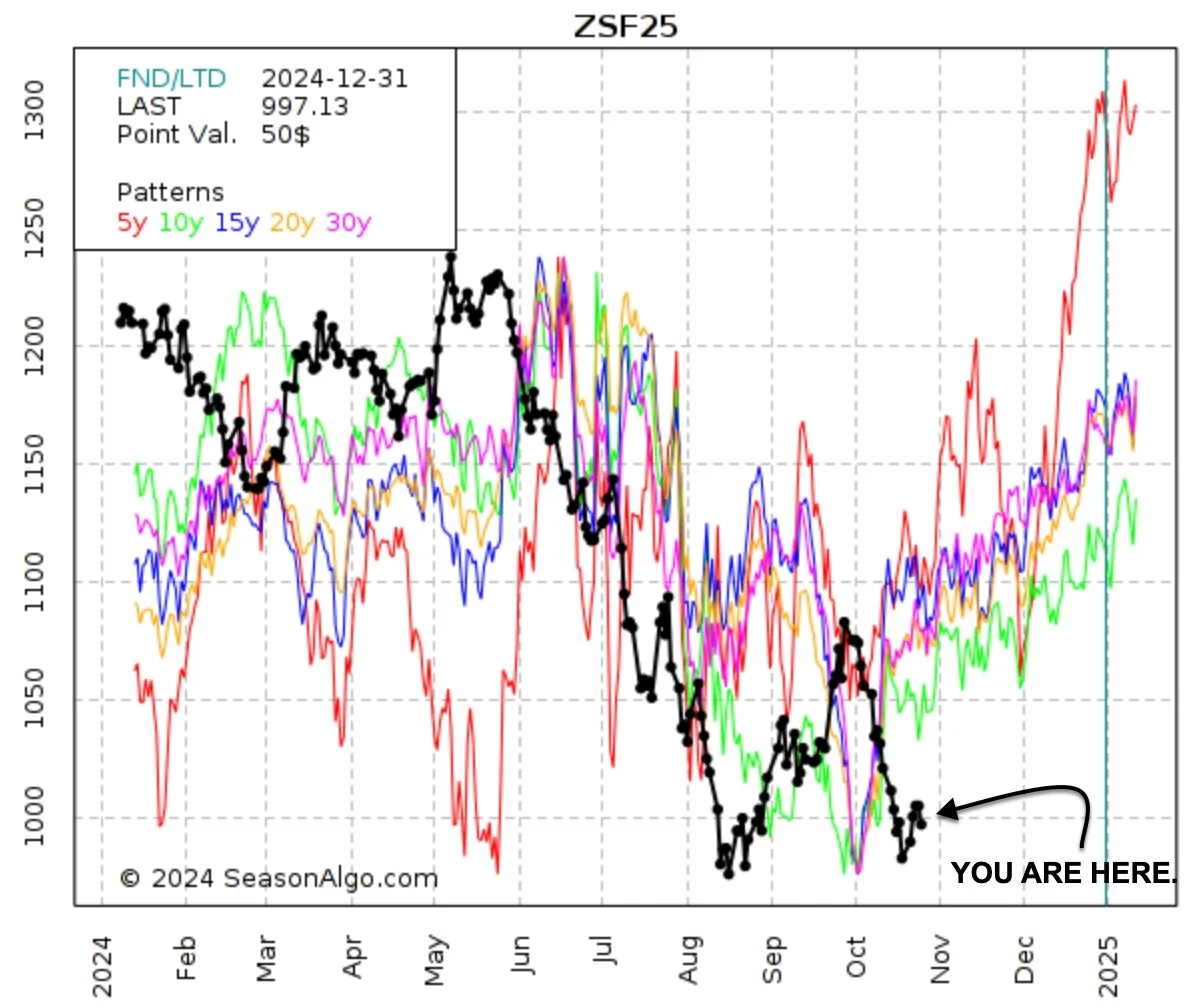
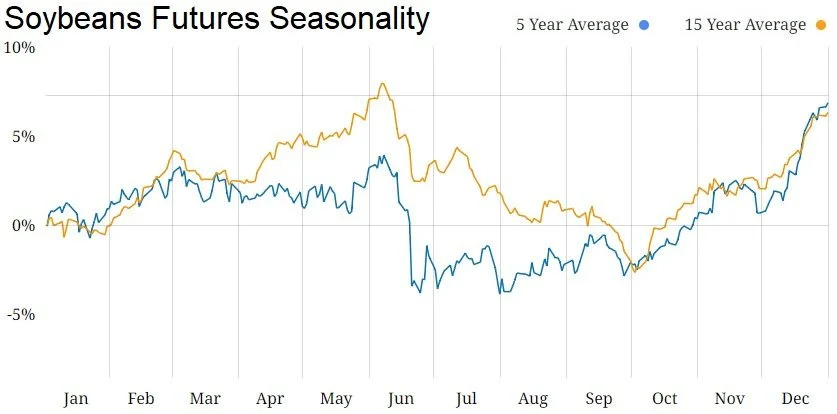
This seasonal gives bulls some hope.
However, one thing you have to keep in mind is that seasonals do not work as well with soybeans as they do corn.
Why is that?
The US is the number one driving factor in the corn market. So the price action revolves around our growing season.
The past few years, Brazil surpassed the US in soybean production. So they are now the #1 player in the bean market.
So beans now have 2 major growing seasons to revolve around now, with Brazil's arguably being more impactful to price action. This wasn’t the case 10 years ago.
Regardless, seasonals suggest we start moving higher on October 1st and into the next year. But we are currently behind that pace as it is almost November.
It will ultimately come down to Brazil. If they get a weather scare we will follow this seasonal.
If they do not see any scare at all, then we have a good chance of going lower from here.
Past 5 Years Price Action
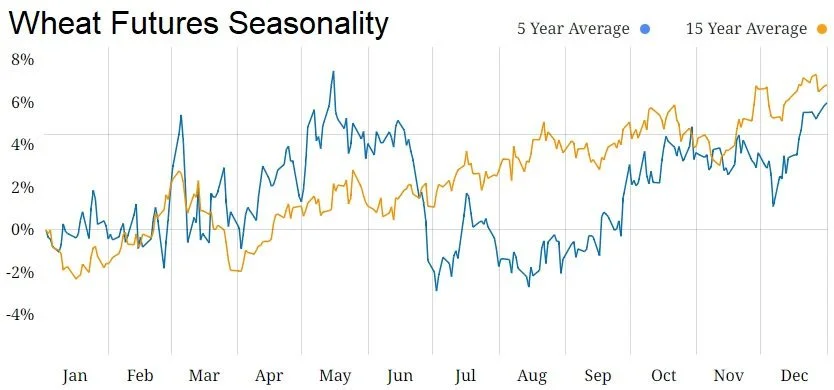
Wheat 🌾
Now seasonals for wheat work even worse than they do for soybeans.
Seasonals for wheat are the most unreliable out of all 3 grains.
This is because wheat is grown globally. So there is always some country going through harvest or a growing season at a different time that can move the market.
Similar to soybeans & Brazil. Wheat has countries like Russia.
For example the Russia & Ukraine war two years ago. The Russia weather scare back in May. A crop scare here in the US. Simply too many factors for wheat to follow a seasonal that revolves around one growing season.
But if you had to blindly pick a month to sell, it has came in May/June. But again, this is skewed due to the war & Russia drought.
Past 5 Years Price Action
Today's Main Takeaways
Corn
Inside day for corn, as we did not take out yesterdays highs or lows.
So not much to add here.
Short term, my personal opinion is that we will likely be range bound for a while between $4.00 and $4.26.
Everything in the middle is simply noise. Break above or below those levels and we will know if we are done going sideways.
Long term, I still believe demand is going to lead us higher.
Looking at timing, I think the move higher probably starts around December as I mentioned in the seasonals.
Reason A:
High prices cured high prices. Low prices will cure low prices.
Reason B:
Here are two charts from GrainStats.com.
This first one shows exports.
There is a decent chance the USDA is going to have to advised these higher.
So far we are well above last year & the 5-year average.
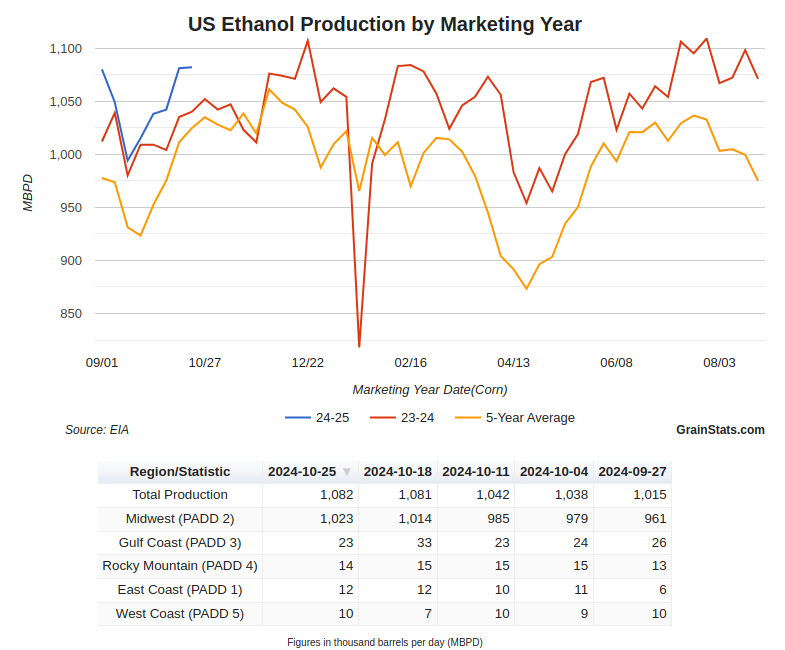
This next chart is ethanol production.
Currently we are well ahead of last year.
The USDA expects us to actually be below last year.
If this continues it'll add a lot of demand.
So that's my thoughts as of today.
If you are someone who needs to add a floor, or is looking to re-own for whatever reason.. the recent grinding action in corn has made the options premium deteriorate fast. So this gives you a more affordable chance to do so.
Looking at the chart, simply stuck in this 25 cent range.
$4.00 is a must hold. $4.26 is the level to break to confirm higher prices.
Soybeans
Today's price action was promising.
Our first day higher in 4 days.
Now that all of the basis contracts for first notice day has been priced or rolled, I think soybeans might be able to catch their breath.
Not much on beans today.
I don’t think the election is going to make beans fall out of the sky. But we also do not have much for bulls to chew on unless something changes.
Brazil has no threats. We still are projected to have the most bearish global balance sheet on record if Brazil produces what the USDA says they will.
So obviously still plenty of downside risk in beans.
The big things to watch are going to be if the China stimulus story gains more steam, or if the rains shut off in Brazil.
Without either of those, I find a major rally being tough.
Looking at the chart, I need a close above $10.14 (I switched to Jan instead of Nov) to even consider we have put in a bottom.
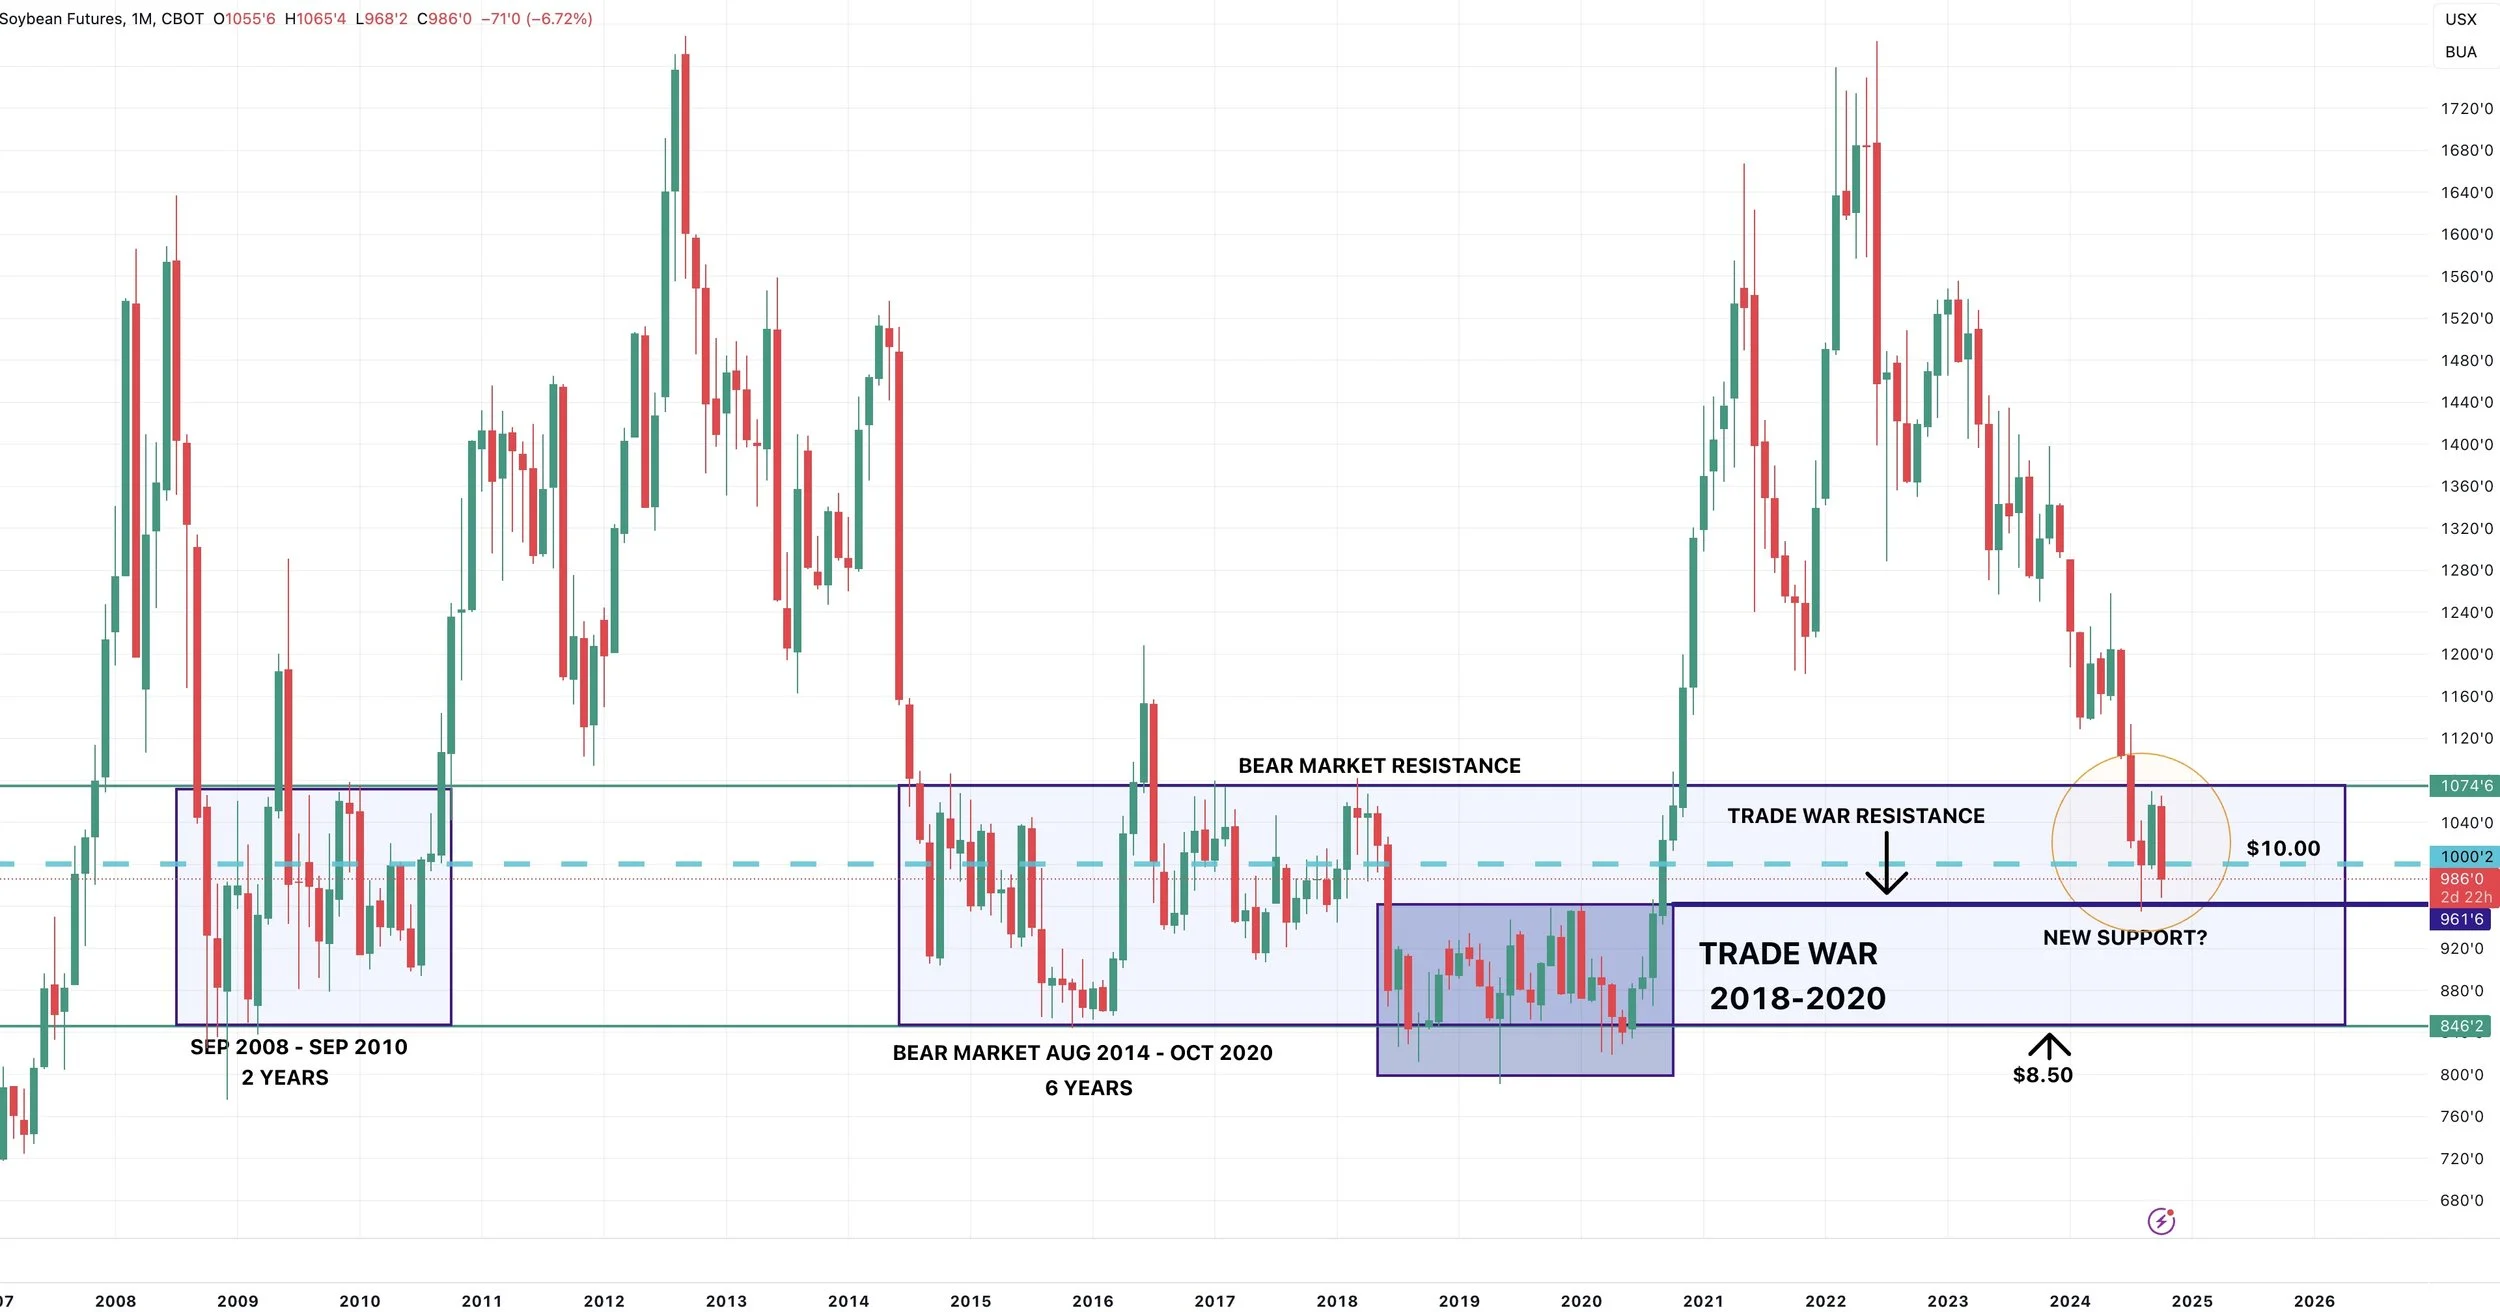
Here is another look at the monthly chart.
You can see how important that $9.60 level is. It was the trade war resistance. Now it is support.
Ideally we'd like to see front month beans hold that. If not, we could go right back to those trade war ranges.
Brazil Real
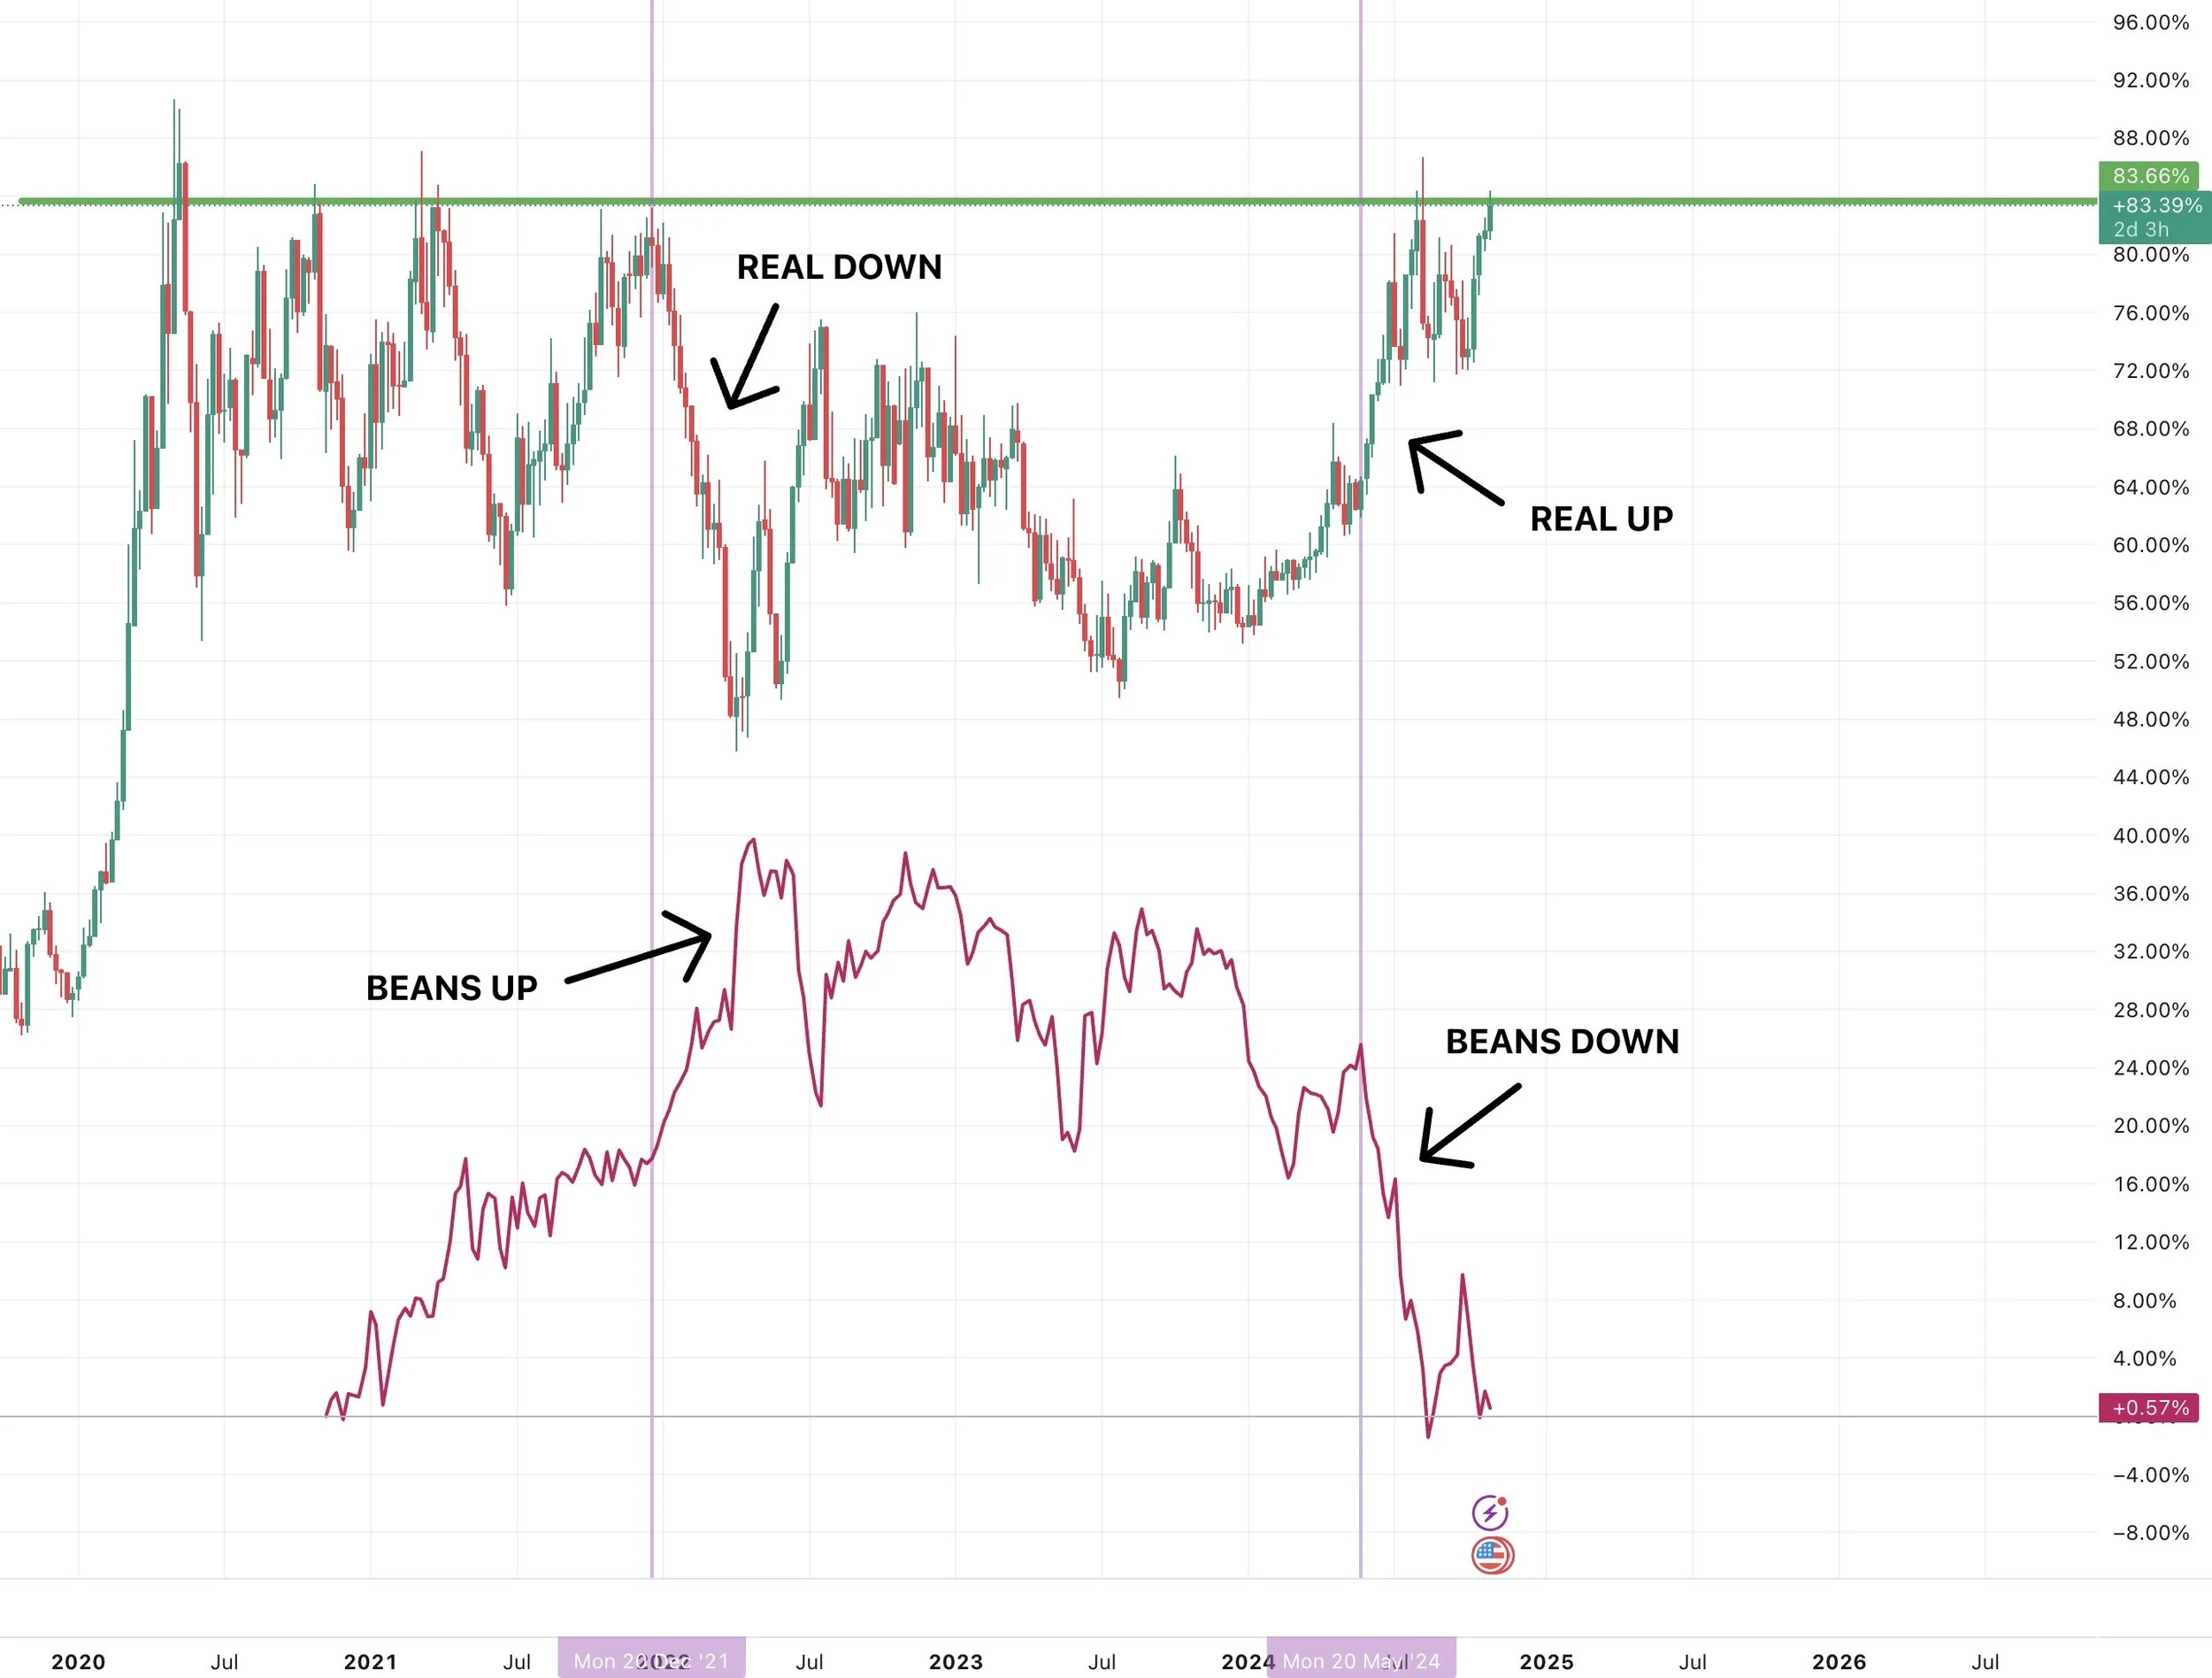
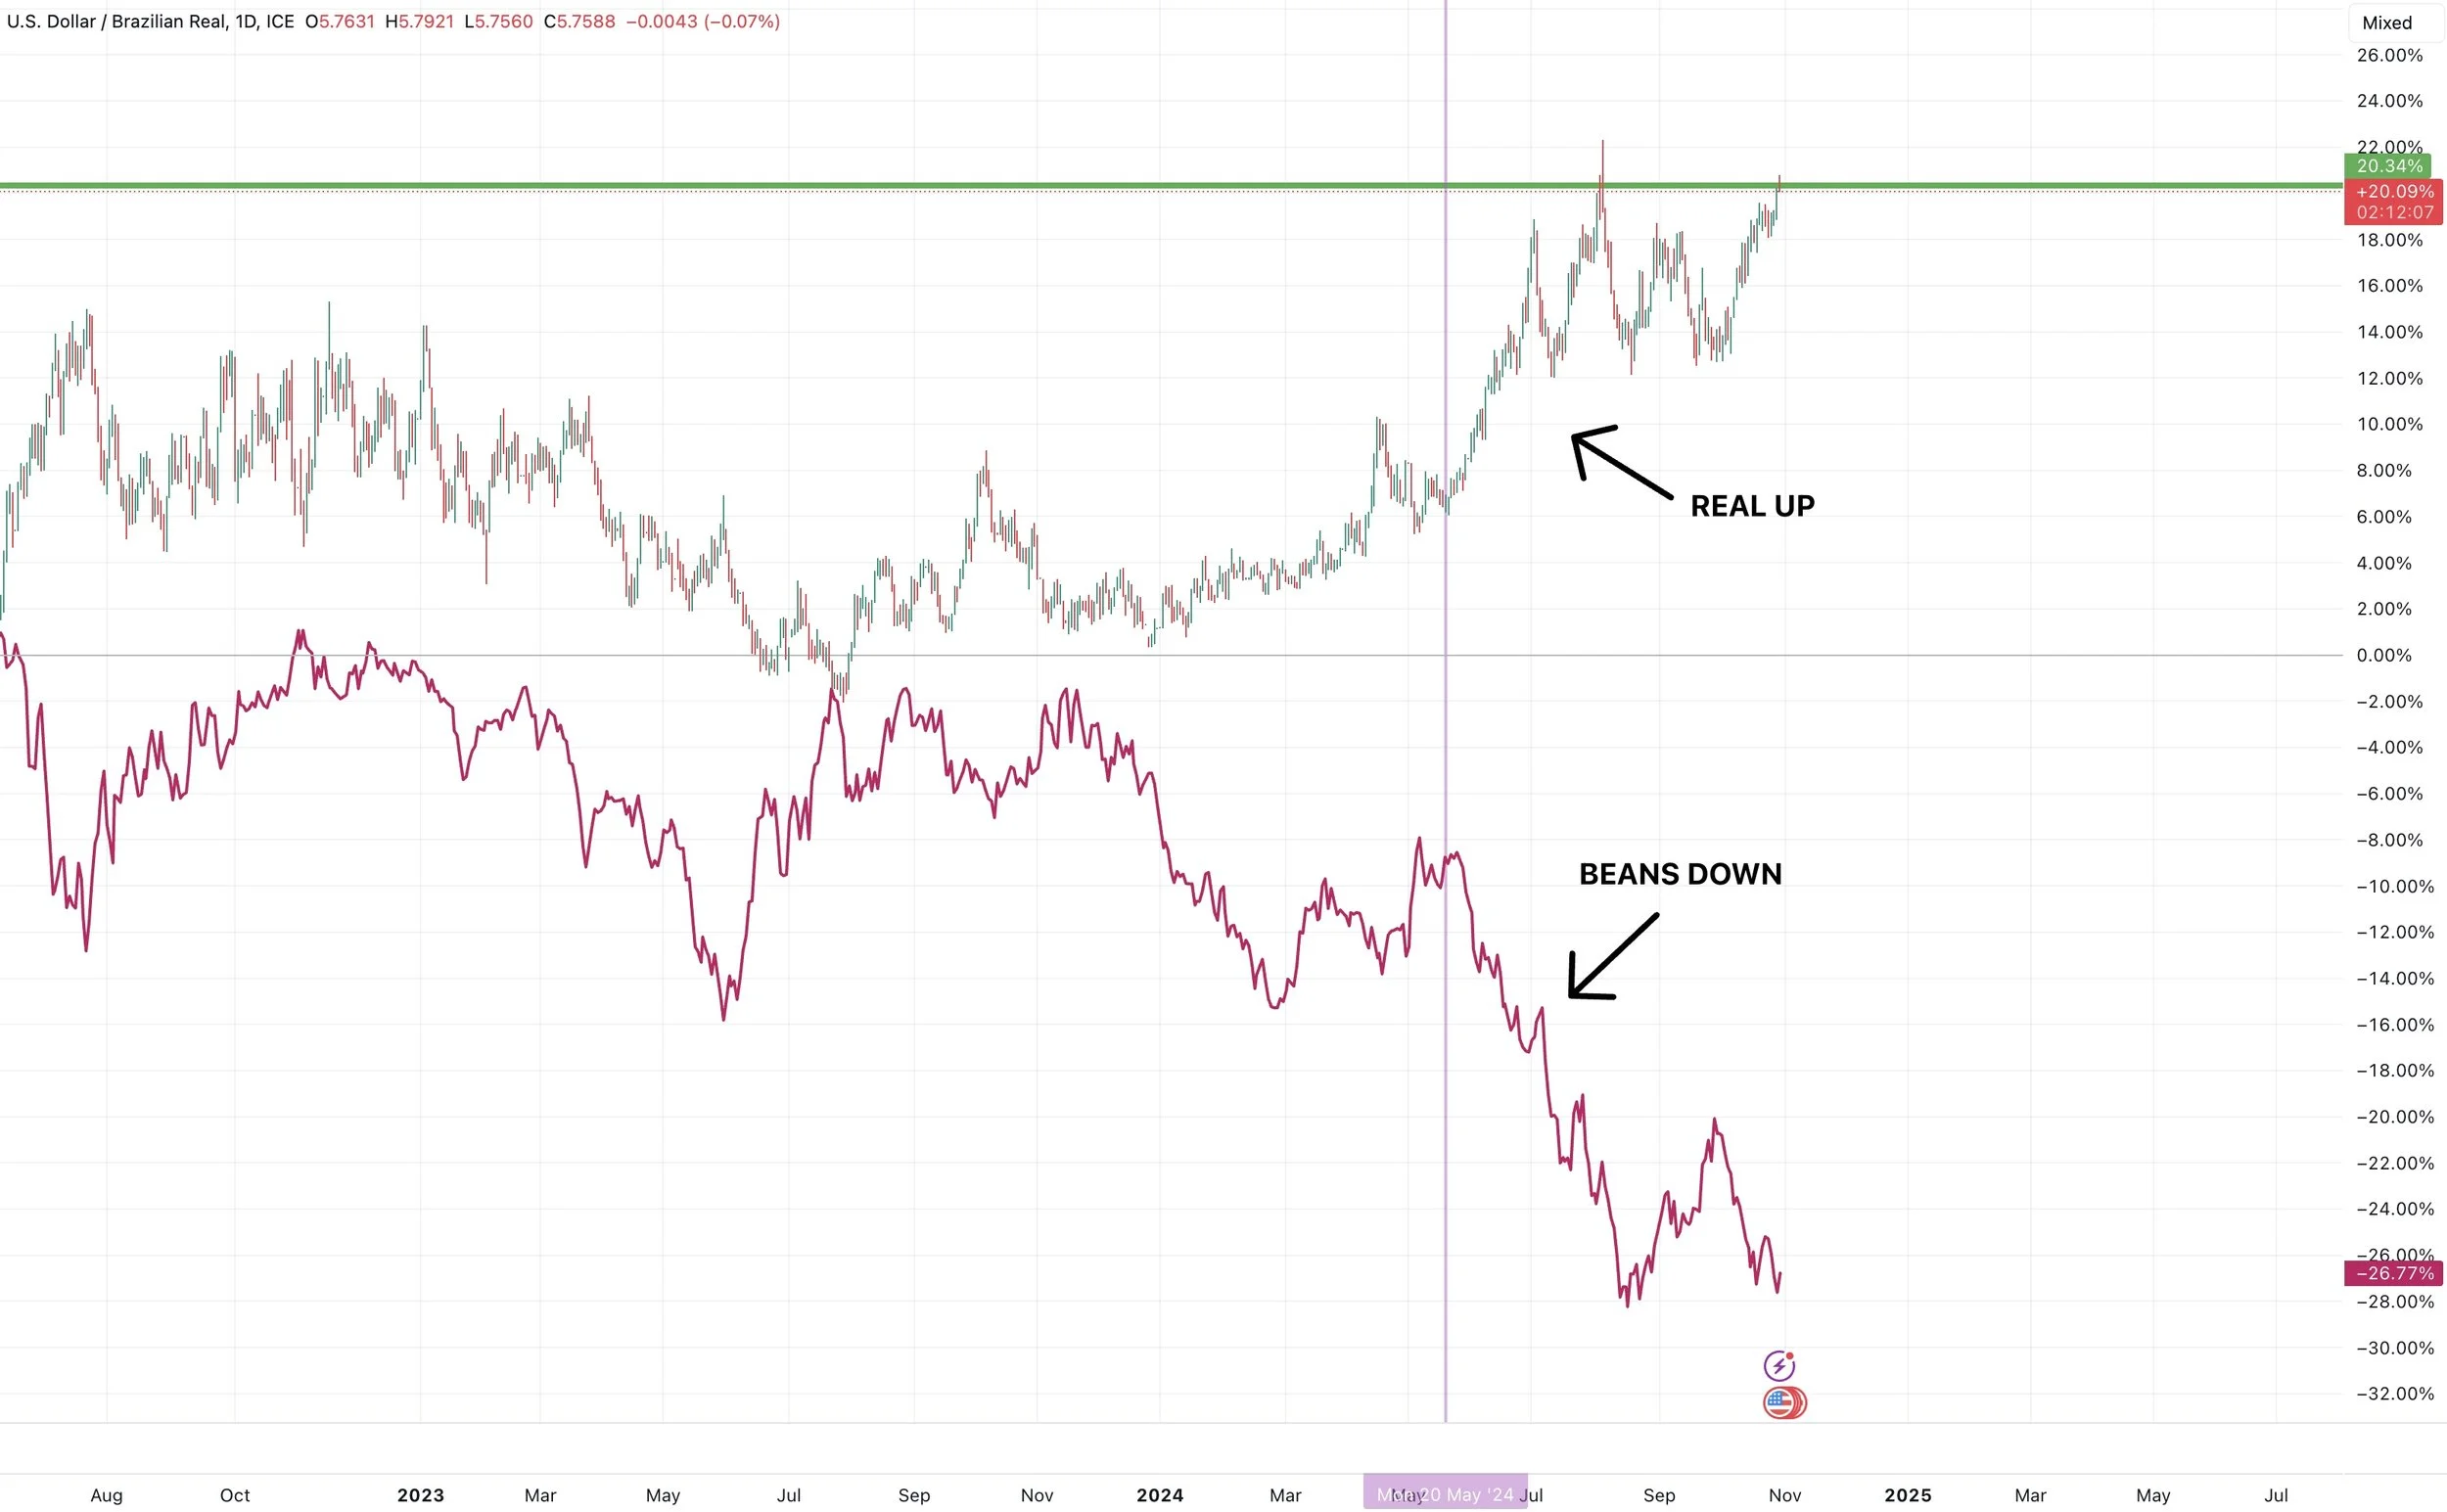
Here is a chart that shows Brazil real vs soybean prices.
(Brazil real is bars) (Beans are purple line)
They do not always correlate, but when the real falls it is friendly for soybeans.
When the real rallies, it is negative for soybeans.
Something to watch, as the real is approaching a spot of resistance where it has rejected off of several times before.
So potential friendly factor IF we reject once again.
Weekly Chart
Daily Chart
Wheat
Very wide price action in wheat today. At one point we were down -7, then up +9, but ultimately closed just +3 higher.
Short term, it really comes down to price action.
On Chicago wheat, if we bust above $5.80 I'd say we are going higher. If we break below the recent $5.57 low I'd say we are going lower.
The rains heading to the US plains could add a little pressure.
Russia is also expected to get rains which could pressure.
Long term, I still think we have a very good chance of seeing a wheat story.
Not many are talking about the fact that the stocks to use ratio for major exporters is the smallest since 2008 and the carryout for major exporters is the smallest since 2012.
Wheat is a global grain, so these are both big deals in my opinion.
When will it matter? Tough to say. But long term I think it leads us higher.
Looking at the chart, $5.57 and $5.80 are the levels to watch.
Like I mentioned the other day, $5.57 was the 61.8% retracment from those recent highs. That is usually a great spot to bounce and we got it. But we still need above $5.80.
(Make sure to scroll to check out KC wheat chart)
Looking at KC wheat, looks like we have a potential double bottom here.
If we bust above $5.84 it would look pretty friendly.
Need to hold those $5.61 lows, as there isn’t much support beneath.
Past Sell or Protection Signals
We recently incorporated these. Here are our past signals.
Oct 2nd: 🌾
Wheat sell signal at $6.12 target
Sep 30th: 🌽
Corn protection signal at $4.23-26
Sep 27th: 🌱
Soybean sell & protection signal at $10.65
Sep 13th: 🌾
Wheat sell signal at $5.98
May 22nd: 🌾
Wheat sell signal when wheat traded +$7.00
Want to Talk?
Our phones are open 24/7 for you guys if you ever need anything or want to discuss your operation.
Hedge Account
Interested in a hedge account? Use the link below to set up an account or shoot Jeremey a call at (605)295-3100.
Check Out Past Updates
10/29/24
WHAT’S NEXT AFTER HARVEST?
10/25/24
POOR PRICE ACTION & SPREADS WEAKEN
10/24/24
BIG BUYERS WANT CORN?
10/23/24
6TH STRAIGHT DAY OF CORN SALES
10/22/24
STRONG DEMAND & TECHNICAL BUYING FOR GRAINS
10/21/24
SPREADS, BASIS CONTRACTS, STRONG CORN, BIG SALES
10/18/24
BEANS & WHEAT HAMMERED
10/17/24
OPTIMISTIC PRICE ACTION IN GRAINS
10/16/24
BEANS CONTINUE DOWNFALL. CORN & WHEAT FIND SUPPORT
10/15/24
MORE PAIN FOR GRAINS
10/14/24
GRAINS SMACKED. BEANS BREAK $10.00
10/10/24
USDA TOMORROW
10/9/24
MARKETING STYLES, USDA RISK, & FEED NEEDS
10/8/24
BEANS FALL APART
10/7/24
FLOORS, RISKS, & POTENTIAL UPSIDE
10/4/24
HEDGE PRESSURE
10/3/24
GRAINS TAKE A STEP BACK
10/2/24
CORN & WHEAT CONTINUE RUN
10/1/24
CORN & WHEAT POST MULTI-MONTH HIGHS
9/30/24


