SINK OR SWIM TIME FOR SOYBEANS
MARKET UPDATE
You can still scroll to read the usual update as well. As the written version is the exact same as the video.
Want to talk? (605)295-3100
Futures Prices Close
Overview
Grains smacked across the board as soybeans post new contract lows and wheat posts a new low close.
However both soybeans and corn bounced nicely off the lows into close.
Off the lows:
Corn: $4.41 1/4 to $4.43 1/2 (+2 1/4 cents)
Beans: $9.70 1/2 to $9.76 3/4 (+6 1/4 cents)
Although soybeans posted a new contract low, they managed to close above that key support. Just barely..
I'll go over the chart later in the soybean section of today’s update.
Why have soybeans taken it on the chin the past 2 days?
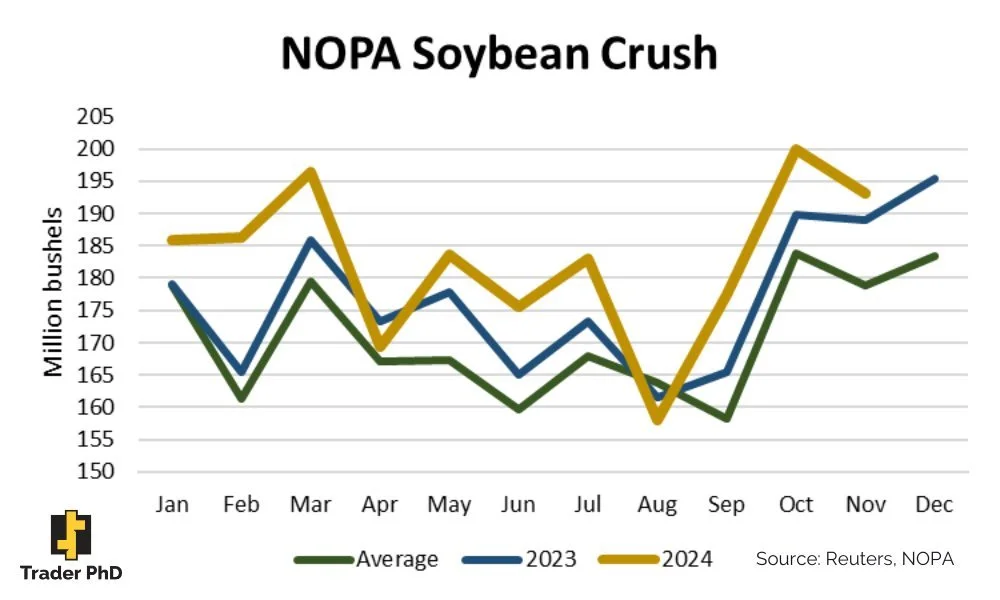
One argument floating around is the disappointing NOPA crush yesterday.
As crush came in at 193.2 million bushels. (Estimates were 196.7 million). Which is down 6.8 million bushels (-3.4%) from October's record but still up +2.2% from last year and a record for November.
Although that didn’t help prices, that is likely not the main reason.
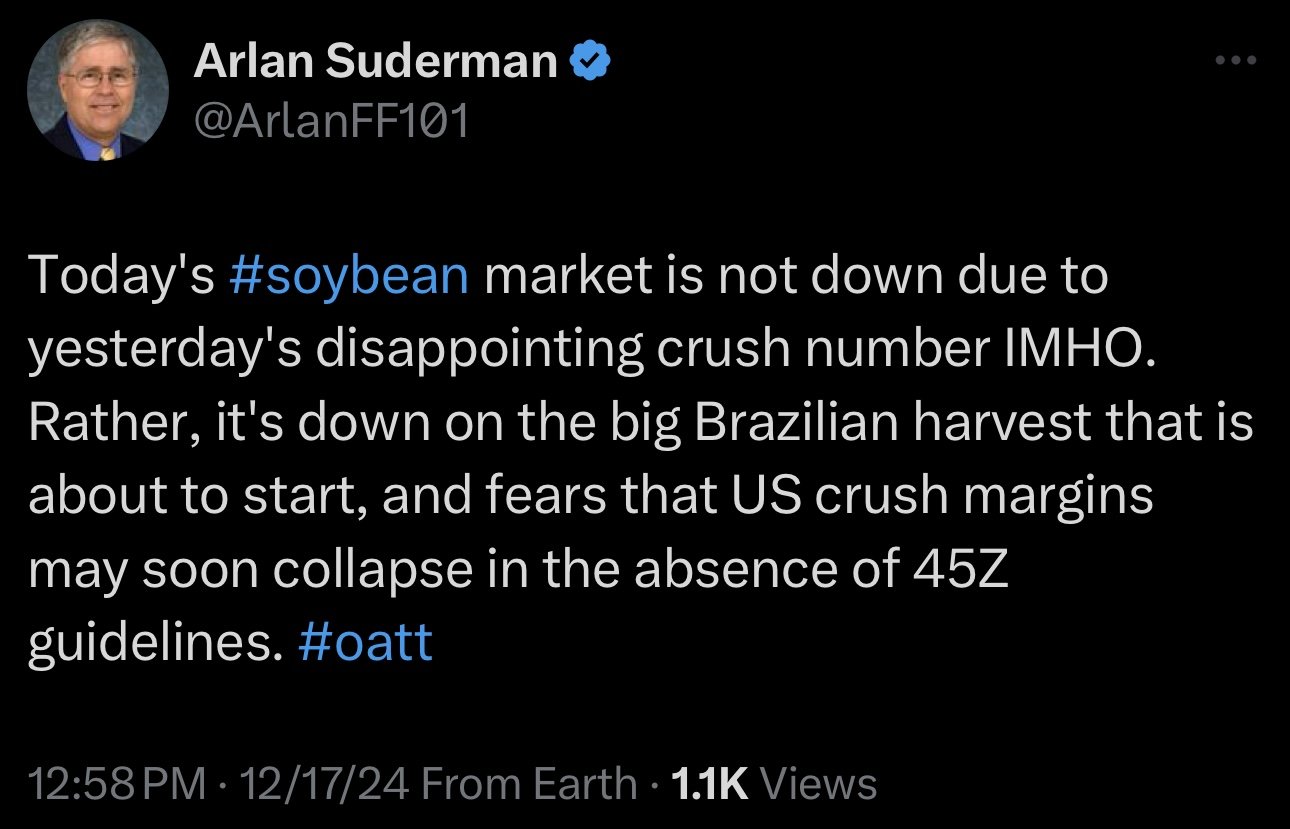
One main reason is Brazil's record crop, highlighted by StoneX's Arlan Suderman and Reuters:
However, this monster crop is nothing new.
Hedge Plus makes a good argument here.
Another reason is China. Their economy is spiraling.
Check out the headlines surrounding China's economy.
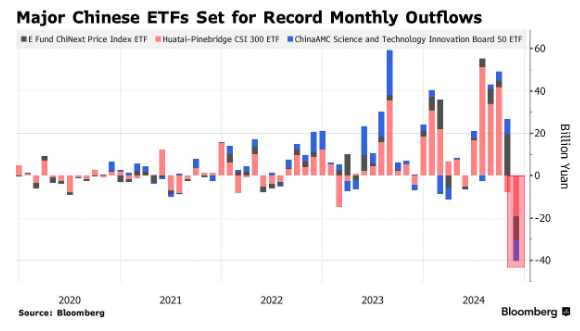
Here is another chart that shows just how bad China's economy is.
Their ETF's set a record for monthly outflows.
Not a good look for their economy.
The last reason, and in my personal opinion the biggest reason today was the Brazilian Real.
It reached all-time highs today.
Meaning the Real is currently at it's lowest value vs the US Dollar ever.
This is not good for soybeans. It makes it that much harder to compete against Brazil and their monster crop.
Have a Marketing Plan
With harvest over, this is the time where you need to be proactive and have a marketing plan.
So if you'd like to talk through your operation, please feel free to reach out to us. It doesn’t cost you anything. We'd be happy to help.
(605)295-3100
Today's Main Takeaways
Corn
Fundamentally, there is still a lot going for corn.
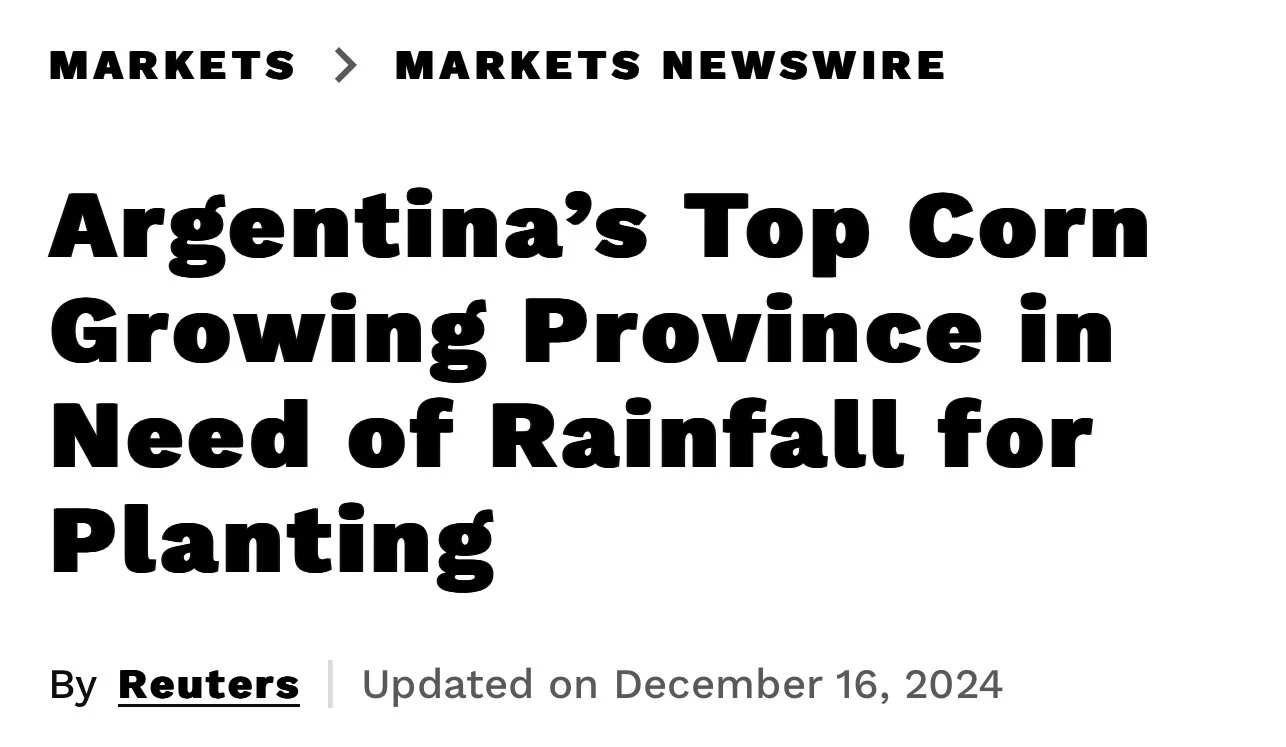
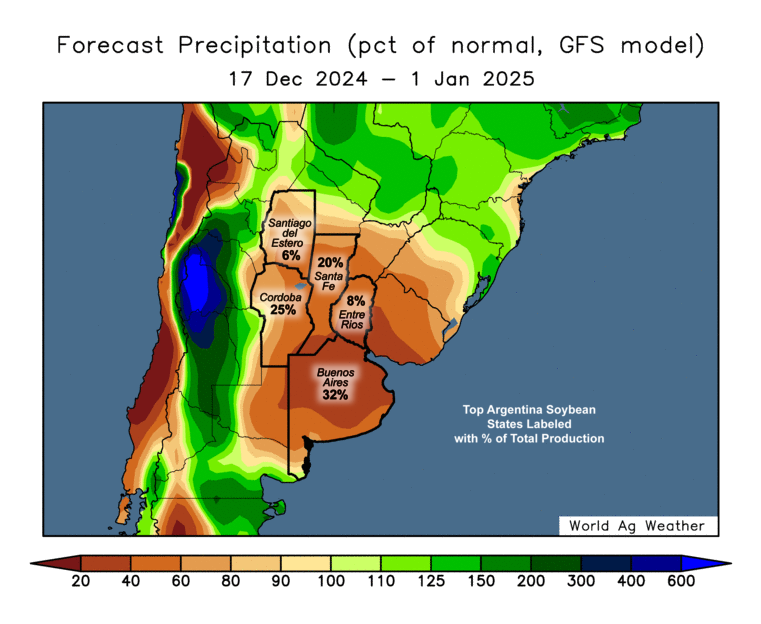
One possible friendly wild card is Argentina.
As their top growing state needs rain for planting. If they do not get rain, it could push back that crop into a less favorable growing window.
Something to watch. Nothing major yet however.
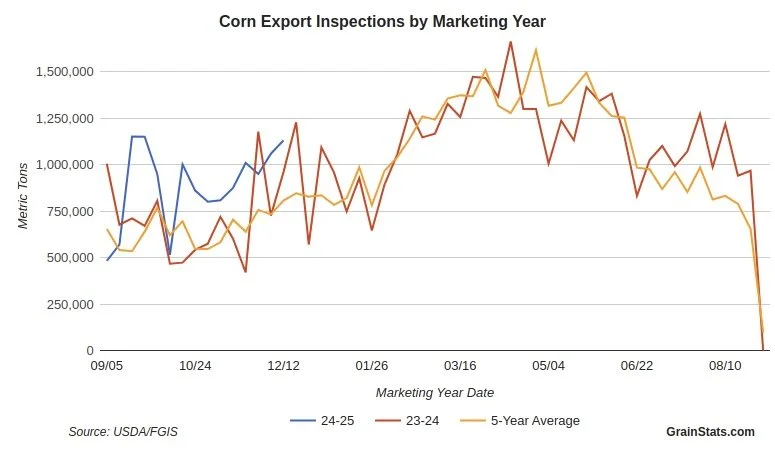
Demand remains solid. The USDA rarely makes changes in December yet they bumped export demand by +150 million bushels. The USDA wouldn’t have done that if they weren’t confident in this demand.
Current Export Sales from GrainStats
Ethanol also still remains well ahead of pace.
The global balance sheet is friendly.
What are the biggest hurdles corn faces?
1. We do not know how the entire Trump situation will play out. Will it hurt demand?
2. Will weak soybeans drag corn lower?
3. We will very likely be looking a bunch of extra corn acres next year due to soybean prices being in the dump.
These unknown factors along with the technicals are why we alerted a sell signal last week.
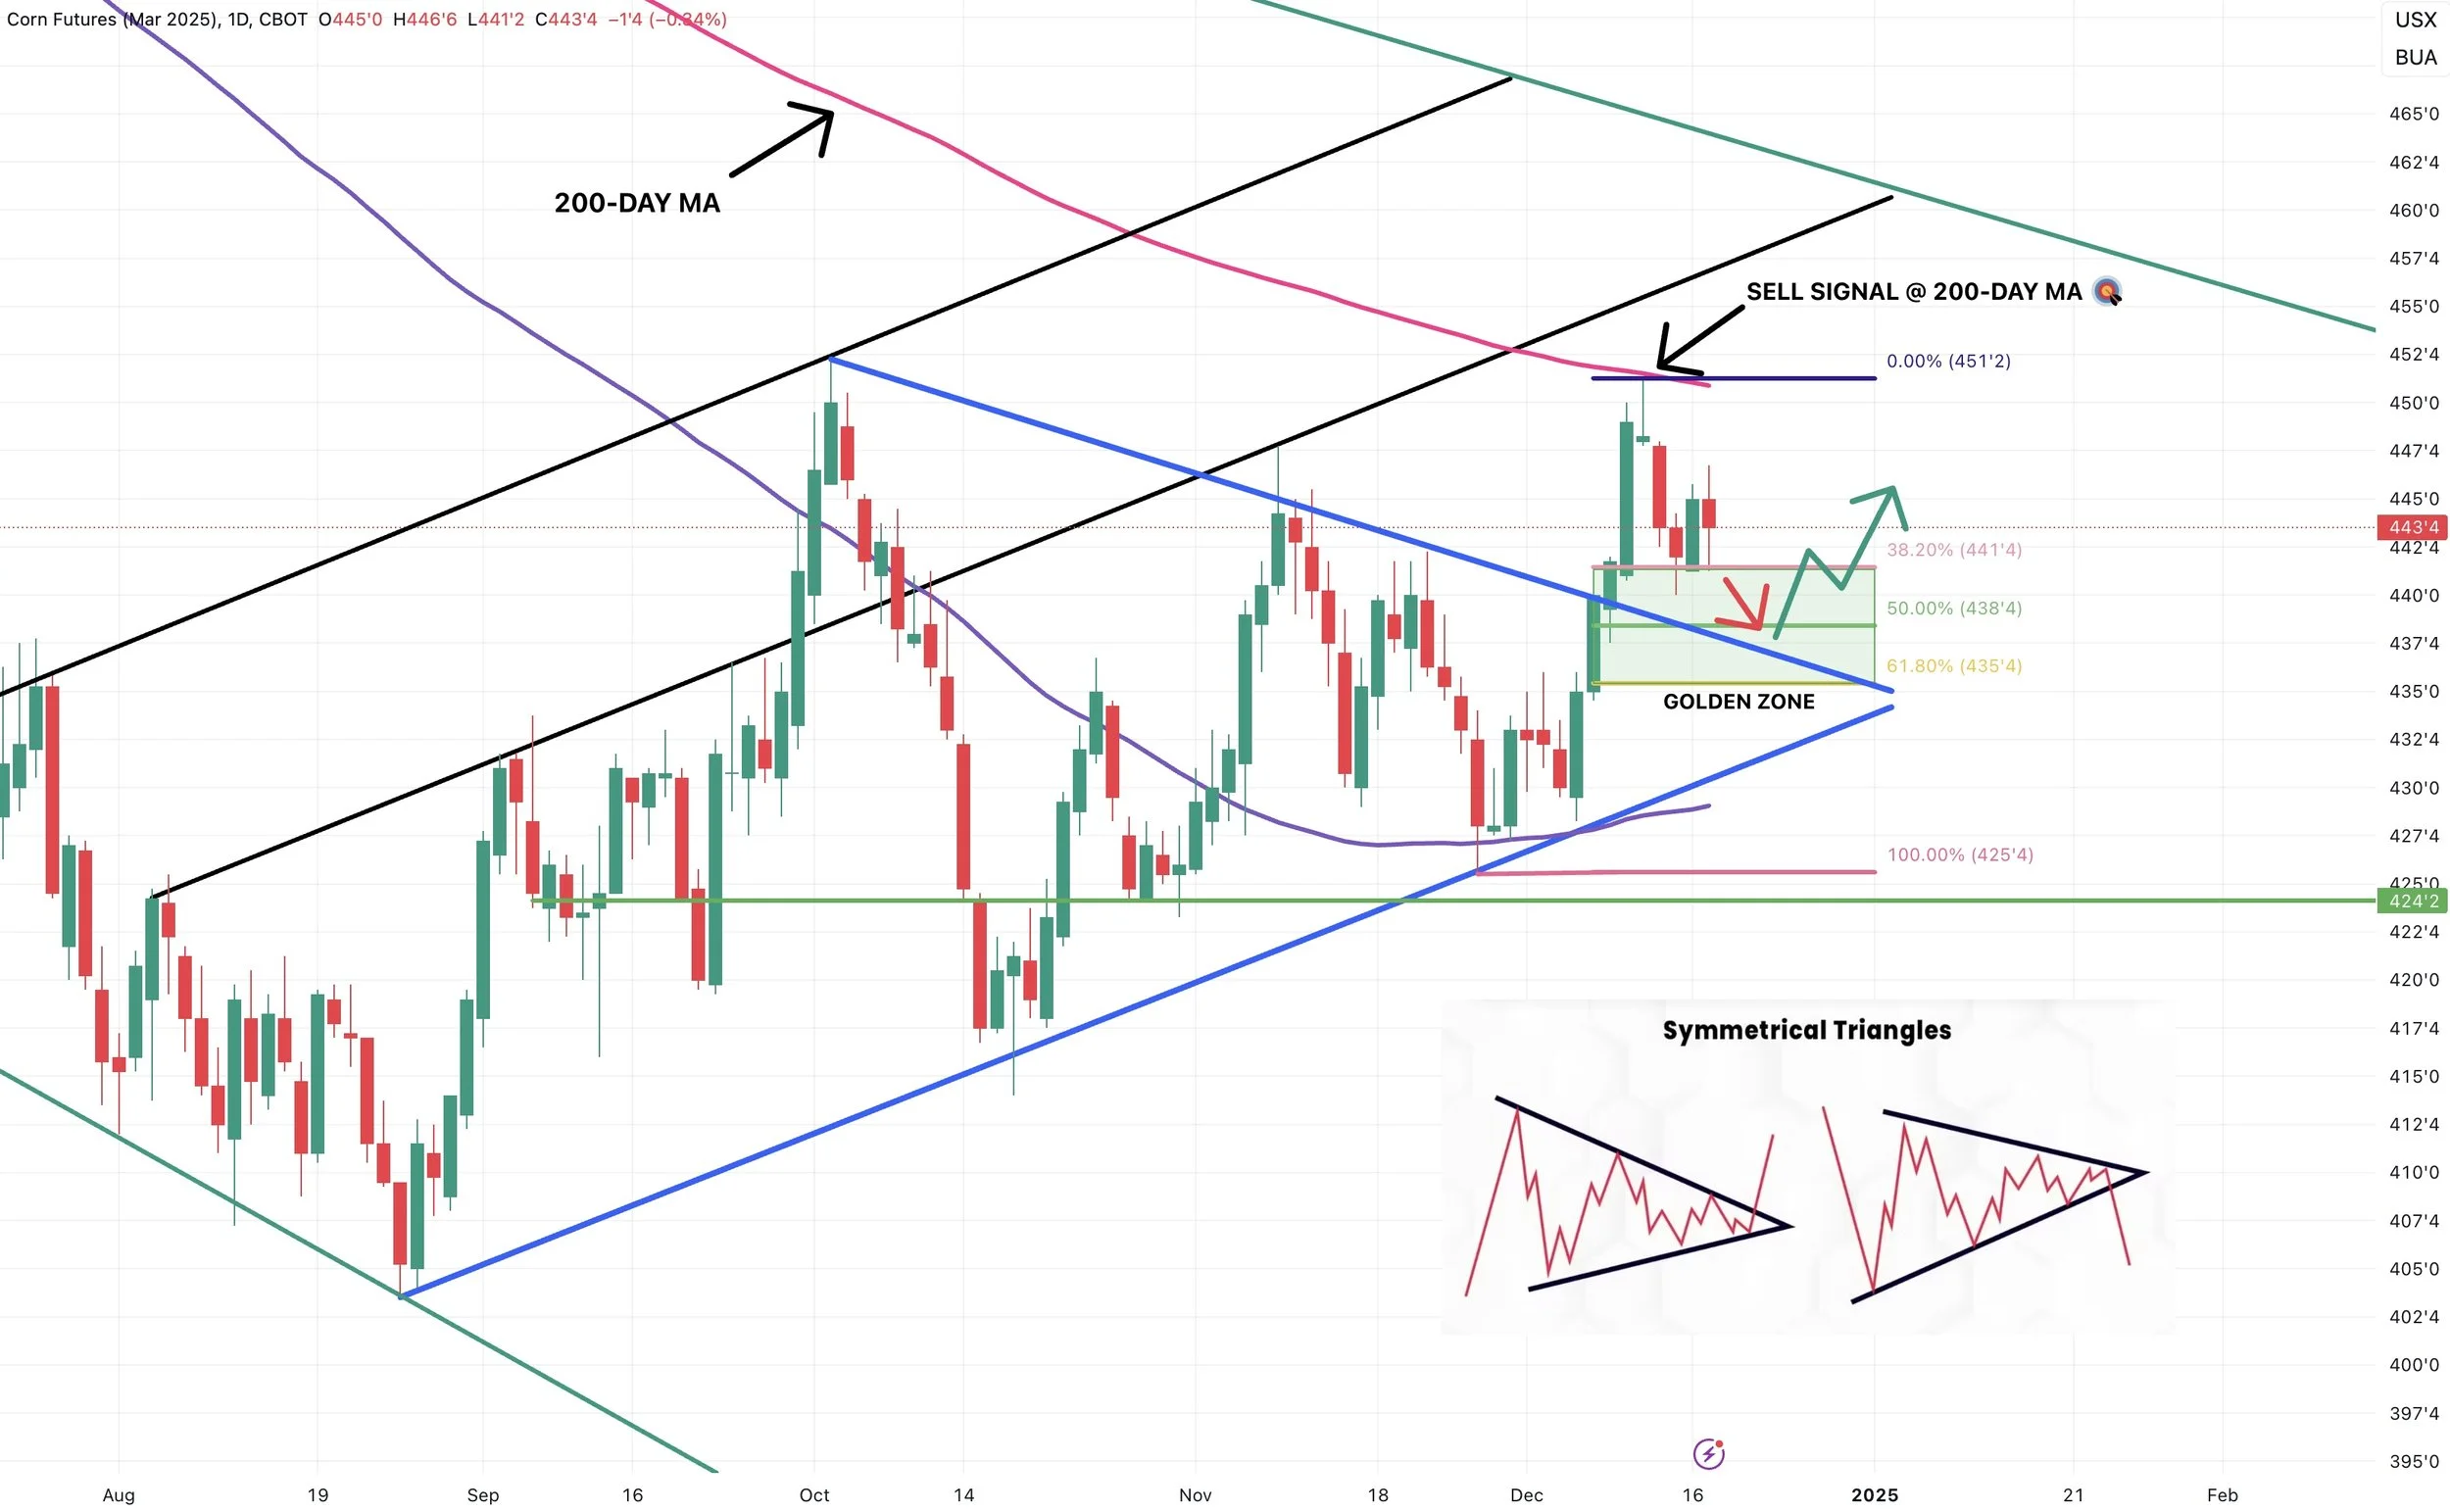
Short term, we are simply still in a technical correction in my opinion. After rejecting off the 200-day MA target.
This is due to the fact that that big bump in demand was priced in on the recent rally.
The algos ran us up before the report, as they were very aware of the export figures we had been seeing.
Then we got confirmation of demand and the moment we hit that 200-day MA which has acted as resistance since 2022, the algos hit the sell button.
Here is another look at how significant of a lid the 200-day MA has been.
If we look at the stochastic, they still have a ways to come down. Signaling corn is losing momentum and this correction likely is not over yet.
That correction does not have to be massive by any means.
I still believe there is a good chance we come down and test that golden zone between $4.35 to $4.38 (the 50% to 61.8% retracment from the recent rally)
This would also go hand in hand with a back test of this symmetrical triangle we broke out of.
As I have been saying, often times during a break out, you will come back to re-test the point of break out to confirm it as new support.
(If you missed Wednesday's sell signal: Click Here)
Soybeans
Soybeans continue to struggle.
As I have said for months now there is very little reason to get bullish soybeans here outside of an unforeseen weather scare in South America. But for now, there is no signs of that.
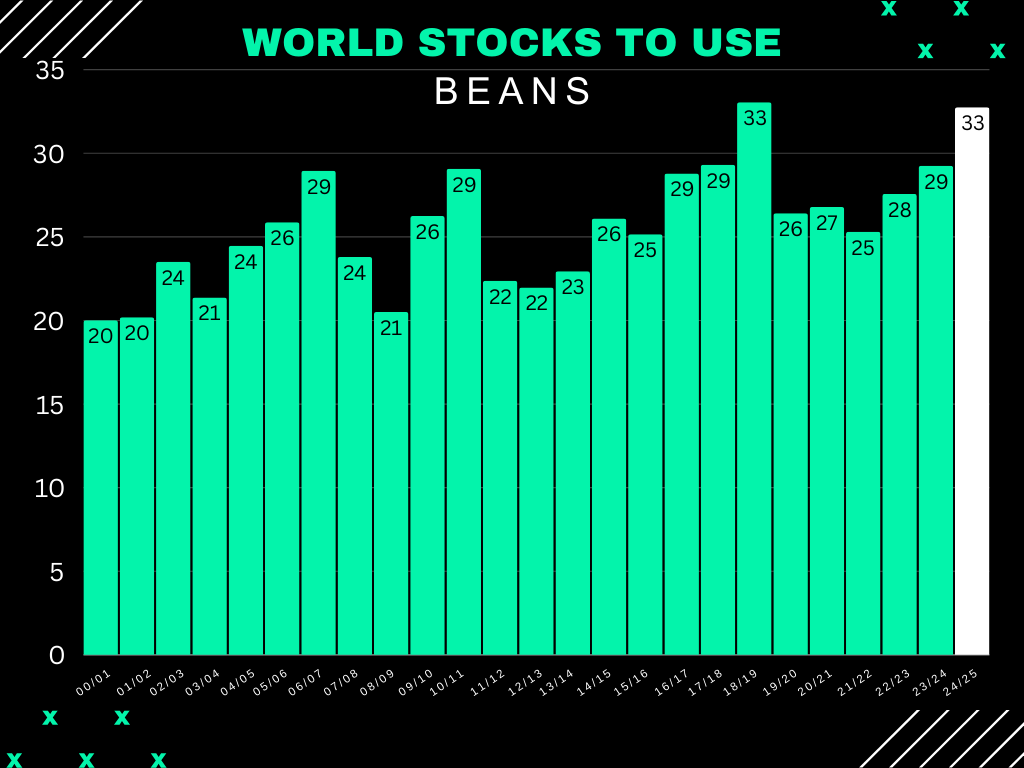
We have the 2nd most bearish global balance sheet of all-time only behind the trade war.
Almost entirely due to the sheer size of the Brazil crop.
Our number one buyer aka China is having a financial crisis.
It is just going to be hard for soybeans to steal any business away from Brazil once their crop becomes available early next year.
Do soybeans have to go to $9 or lower? No they do not have to. But that is a very very real risk you have to be aware of.
Because as of right now, there is very little supportive news suggesting beans go screaming higher unless we get a wild card.
If we look at the chart, we posted new contract lows. Not a great look.
However, on the bright side we rallied back and closed above that key support (marked "NEED TO HOLD" on my chart).
This is do or die time for soybeans.
Either today was a head fake otherwise known as a bear trap, and we reverse out of here the next 1-2 days.
Or from a technical standpoint, if we break these lows it likely gives the algos the green light to push this lower.
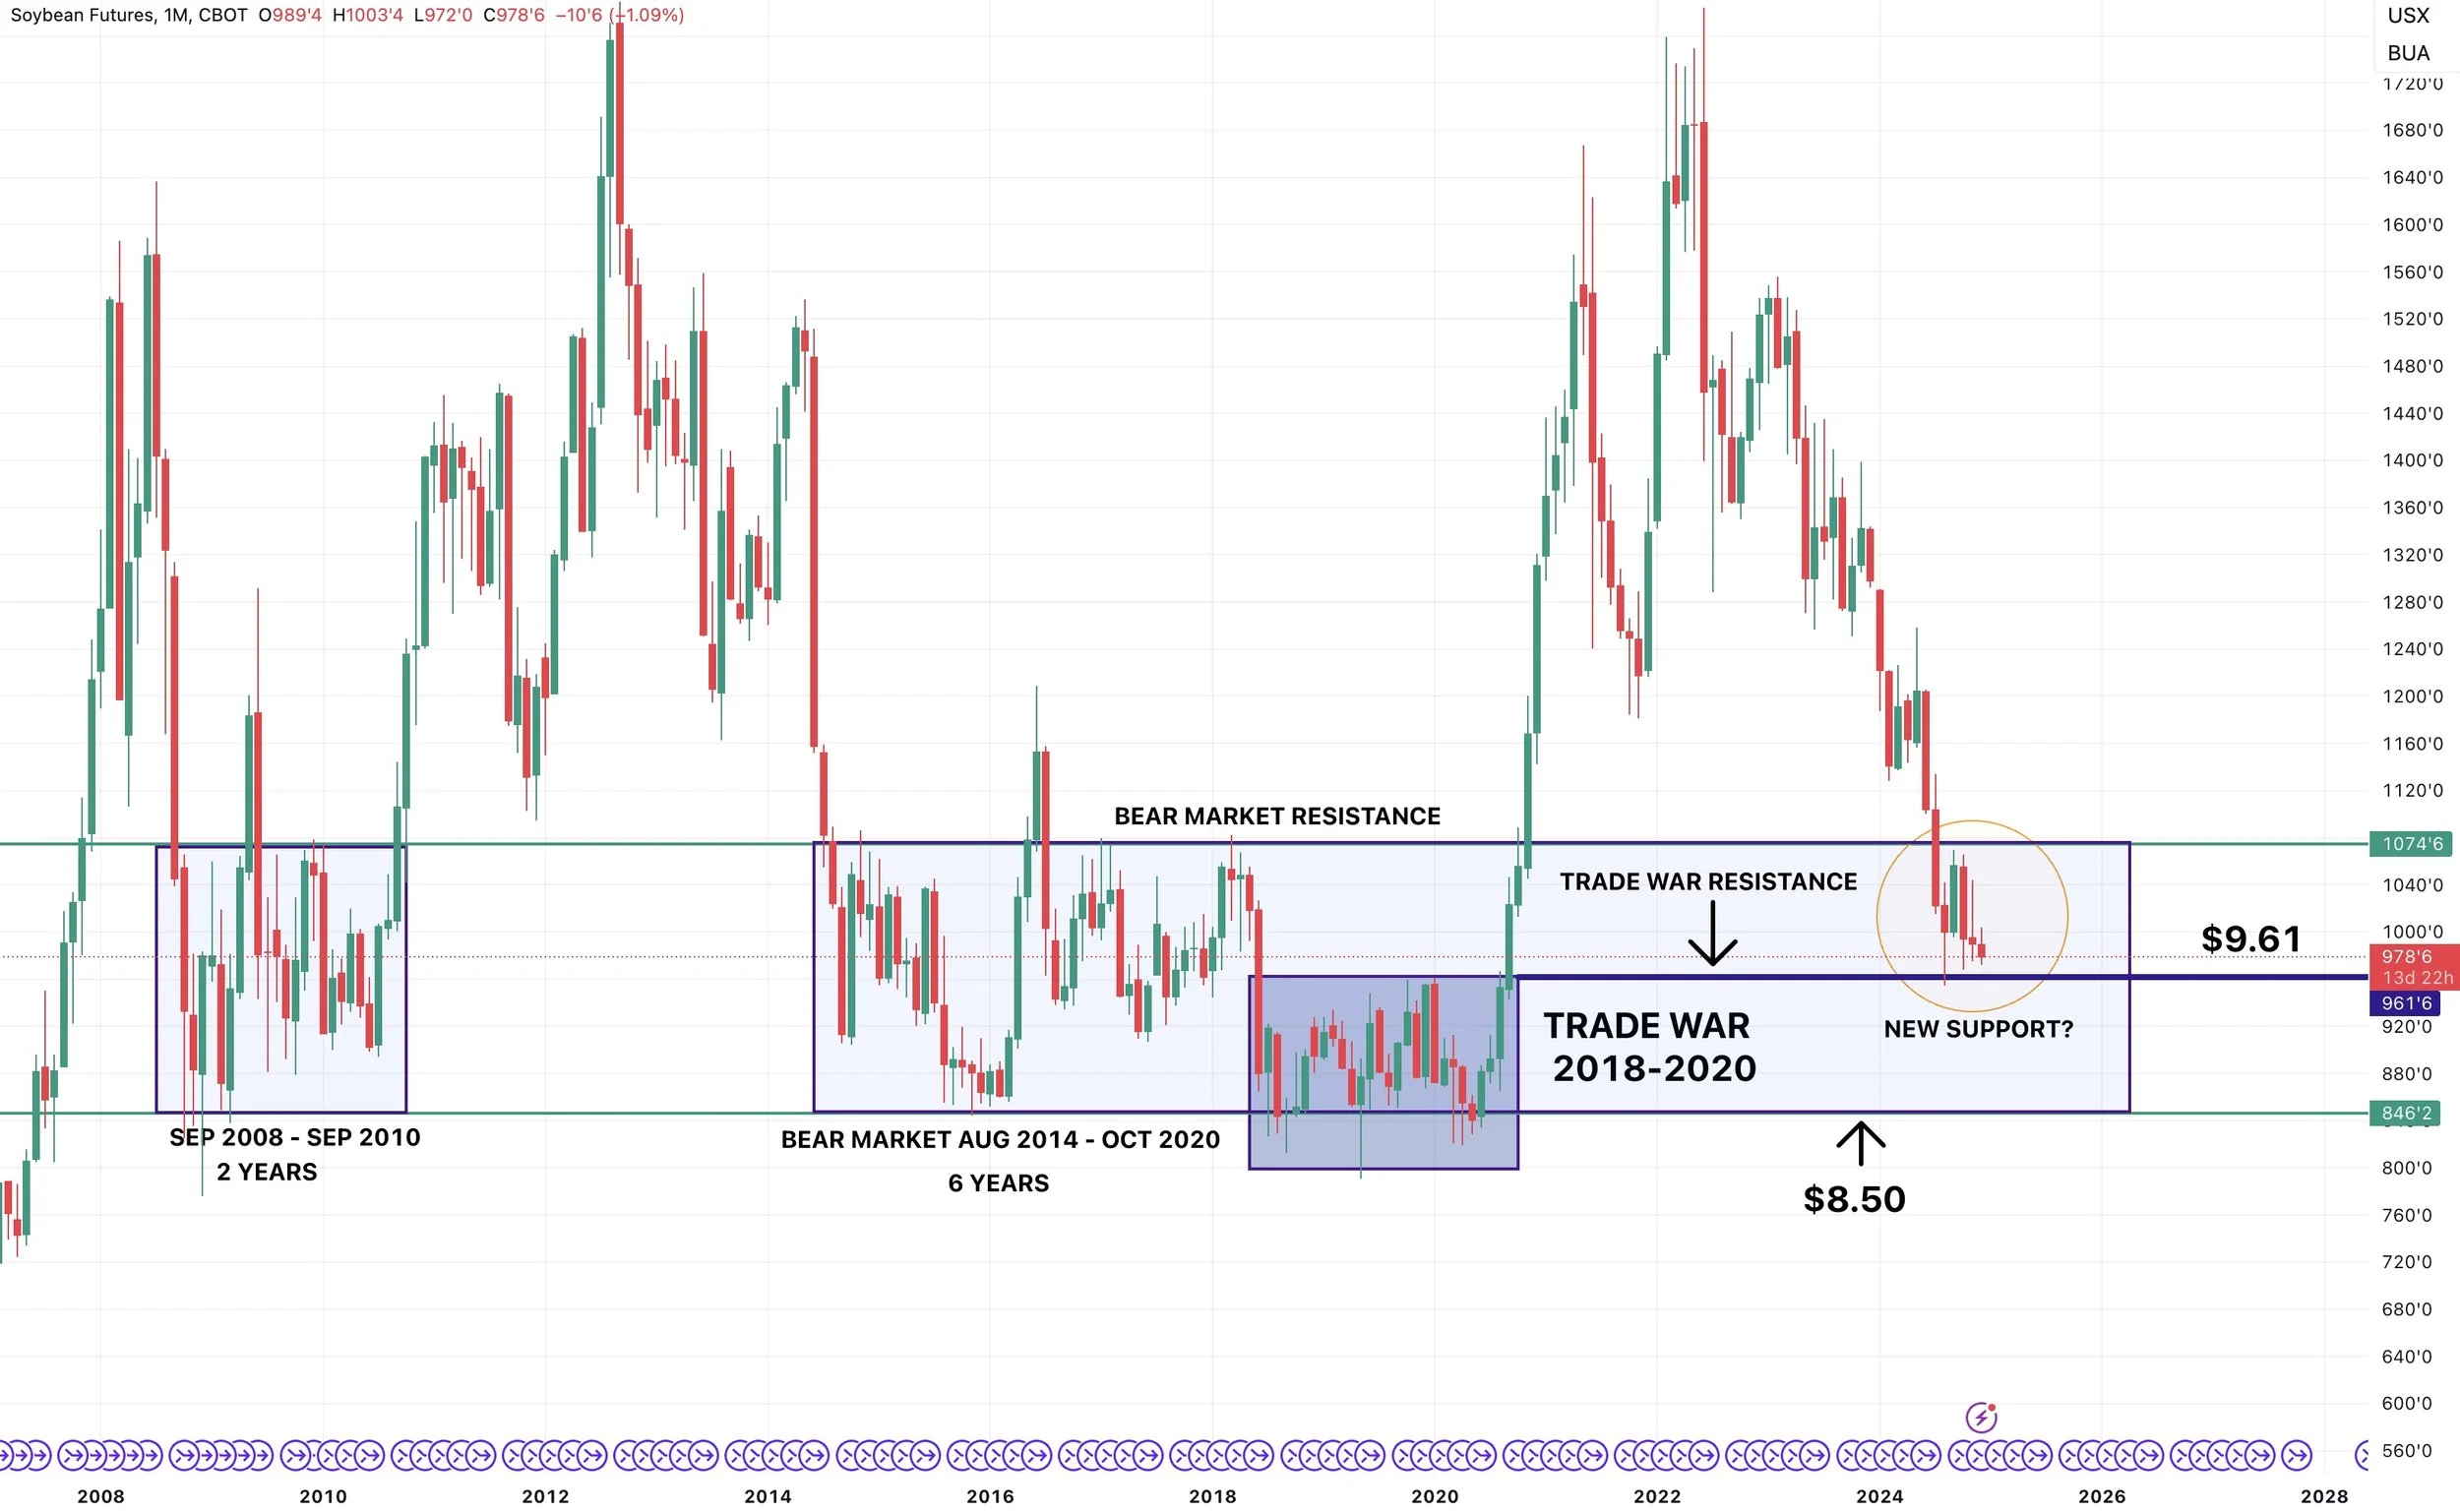
The implied move to the downside IF we do not hold these lows is still $8.63. That move is calculated by taking the range from the top of this descending triangle to the bottom ($1.12) and substracting it from the bottom of the triangle ($9.74)
$9.75 - $1.12 = $8.63
We have held these lows for a whopping 4 months. Meaning this is very strong support. IF it gives out, it could open the flood gates lower. As all of the algos will hit the sell button.
Risk Management:
I hope today's action was a head fake, but I really like keeping a floor here for many of you simply due to the possible +$1.00 downside risk.
Especially if you have to move something within the next few months.
The worst case scenario for you would be that you do no get a floor put in, we drop $1.00 and you are stuck selling your grain at mutli-year lows with zero profit from a hedge.
If we look at this continuous chart for soybeans that shows years of price action, that implied downside move of $8.65 is right around the absolute lows we made during past bear markets.
If we did continue to fall from here, I would think that is about as low as we could go.
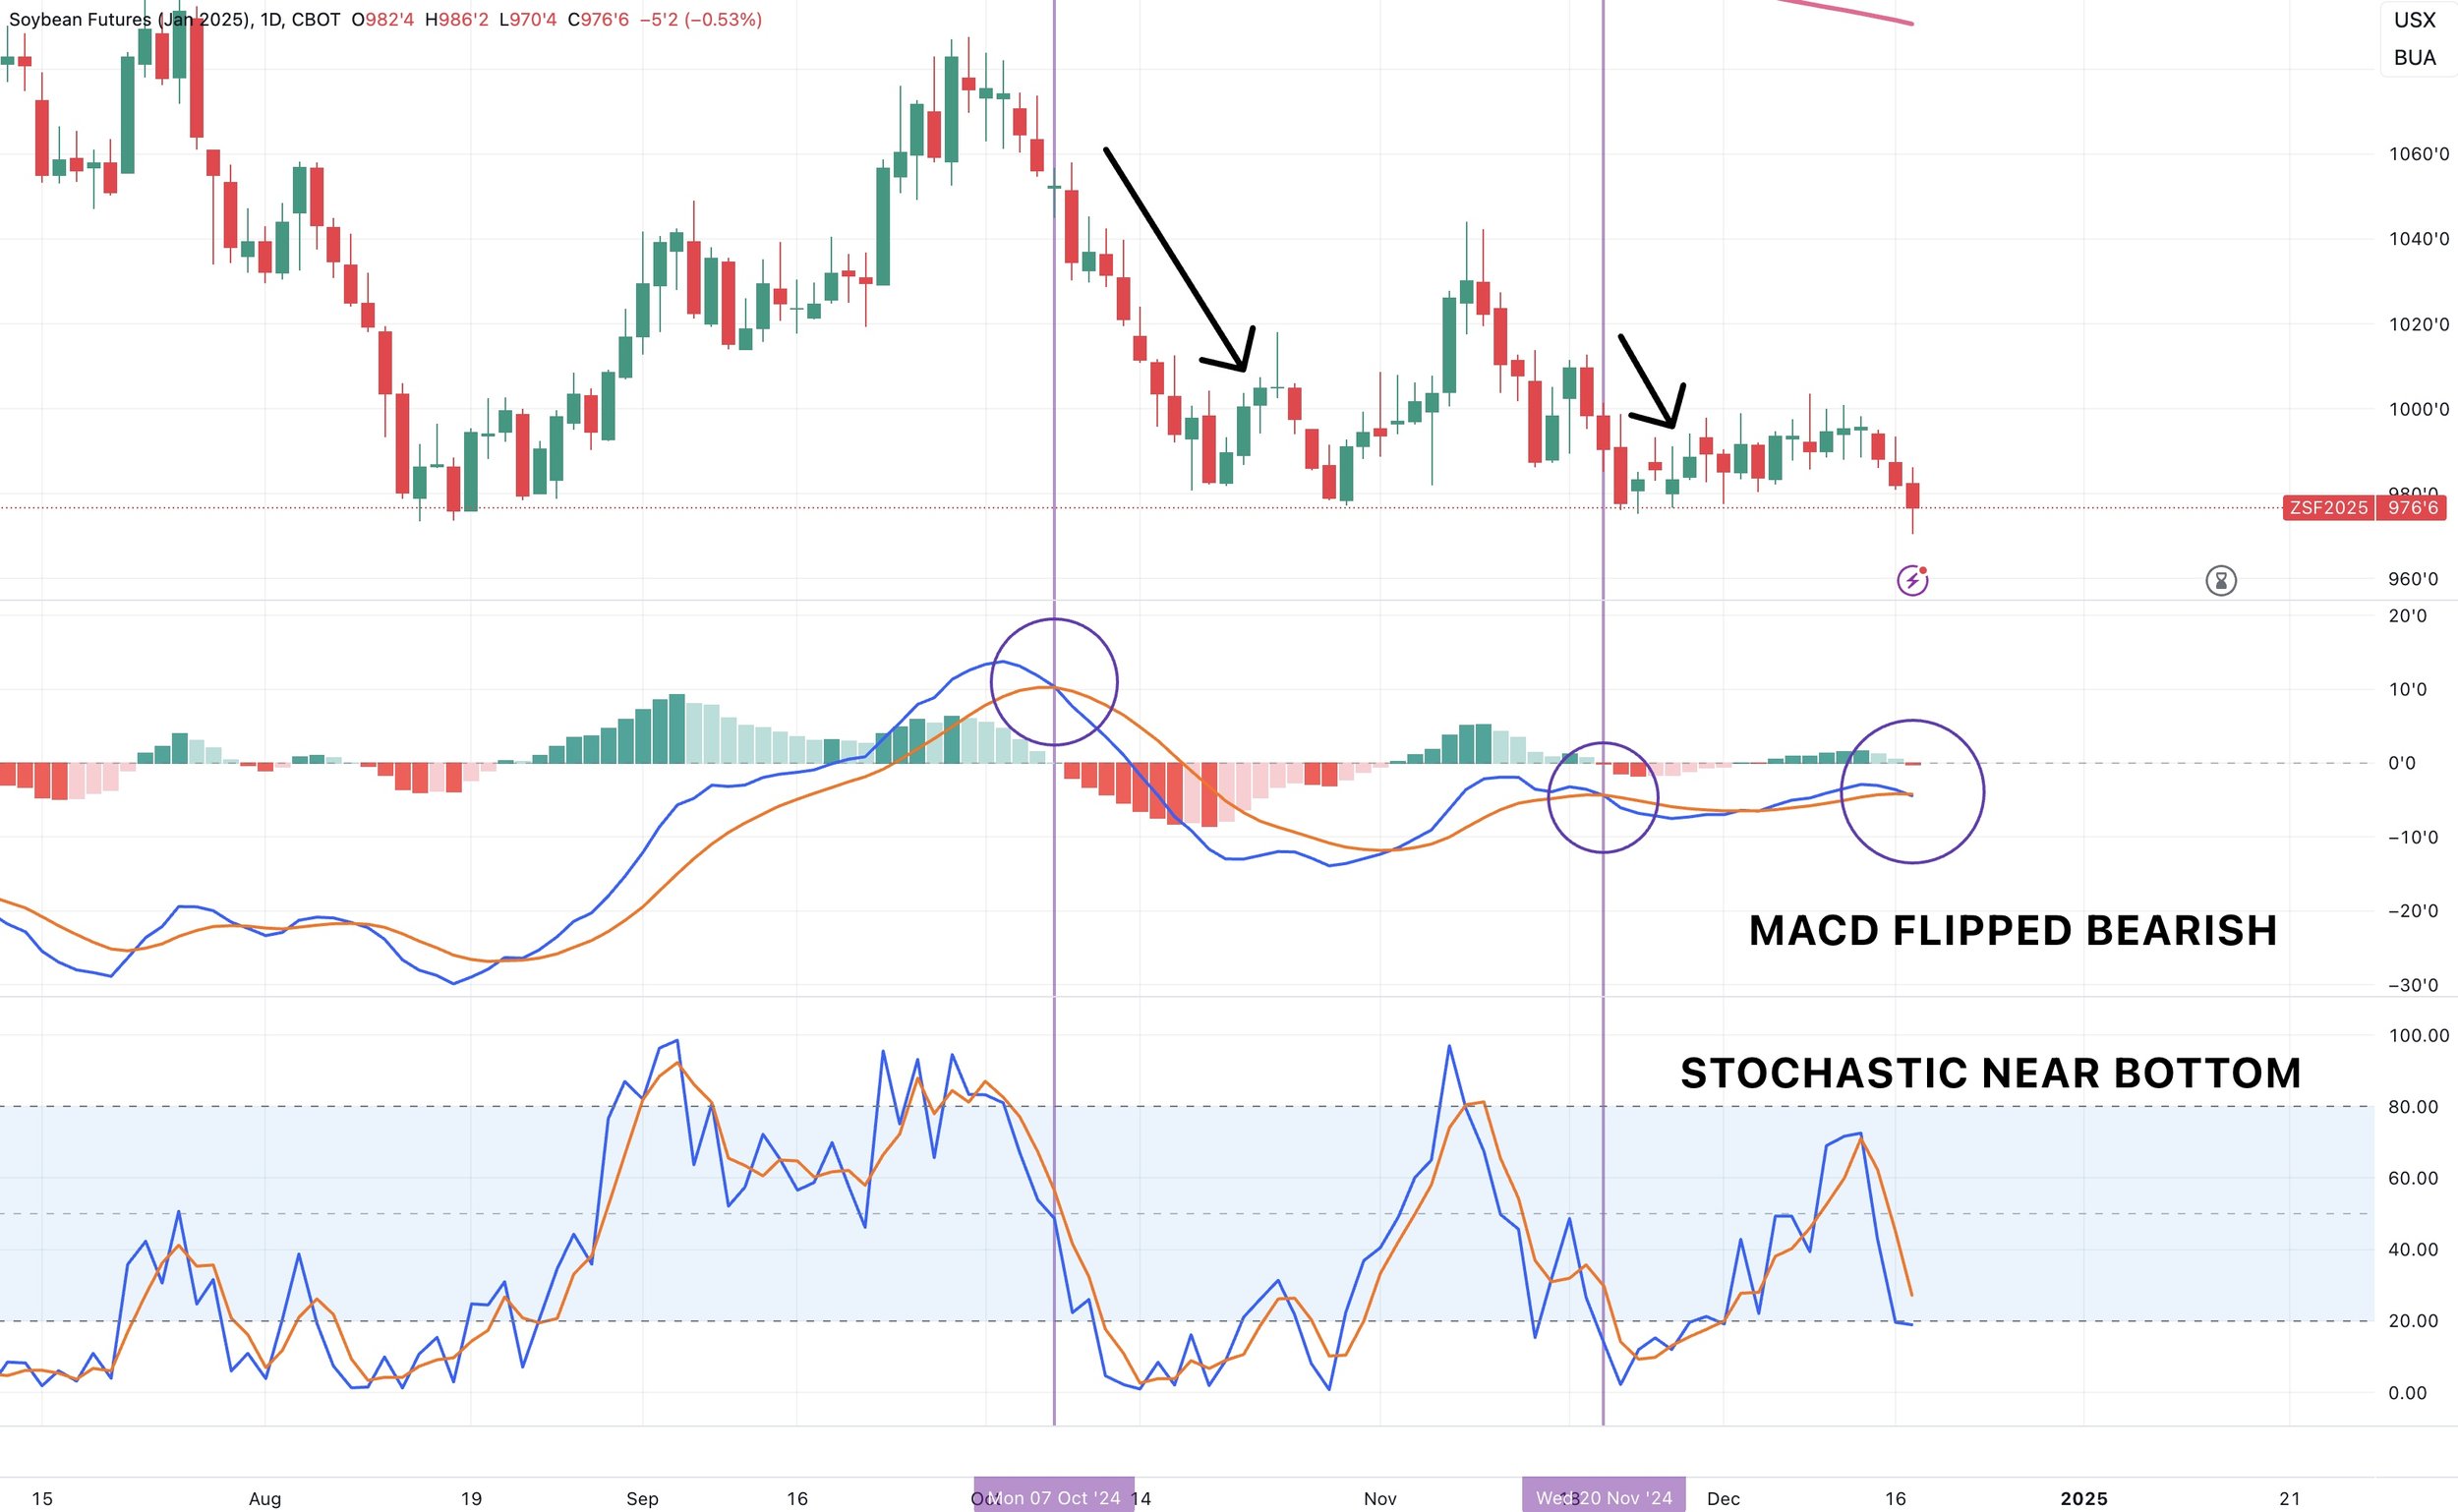
Looking at the indicators, the MACD flipped bearish.
The MACD has been fairly accurate at predicting the next move for soybeans.
The past 2 times it flipped bearish it led to these corrections (marked with purple vertical lines):
Oct 7th to Oct 21st: -70 cents
Nov 20th to Nov 22nd: -15 cents
This does not have to happen, but something to keep in mind.
Wheat
Wheat approaching new lows once again.
As I have been stating for weeks, I think wheat has potential LONG TERM.
This does not mean we cannot go lower first.
There is very little reasons for wheat to rally right here short term.
Long term however, the global balance sheet is still friendly.
Russia still has massive issues with their winter wheat crop.
Headline from Reuters today:
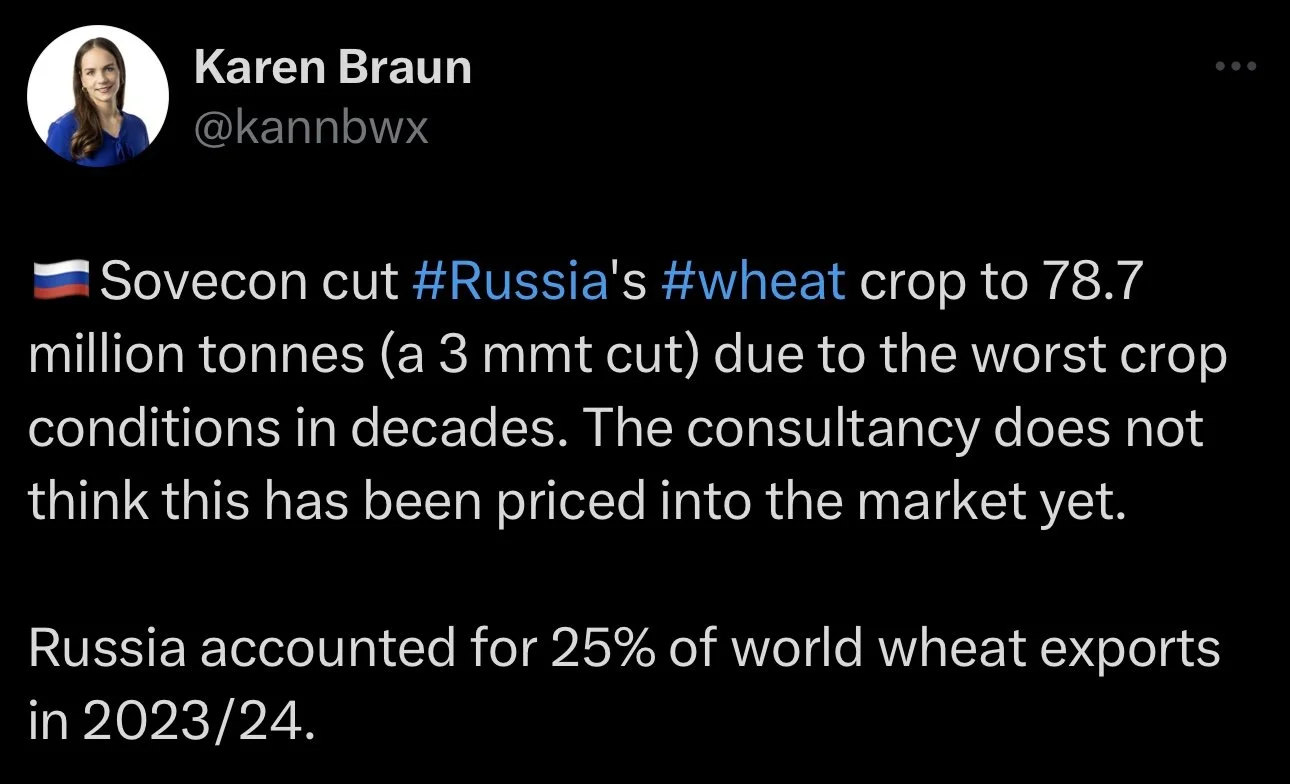
"SovEcon cuts the 2025 Russian wheat crop forecast sharply on the worst winter wheat crop conditions in decades."
The founder of SovEcon Andrey Sizov responded by saying:
"CBOT March wheat down -9 cents. Something doesn’t add up here, for now...."
SovEcon does not think the market has priced this in yet.
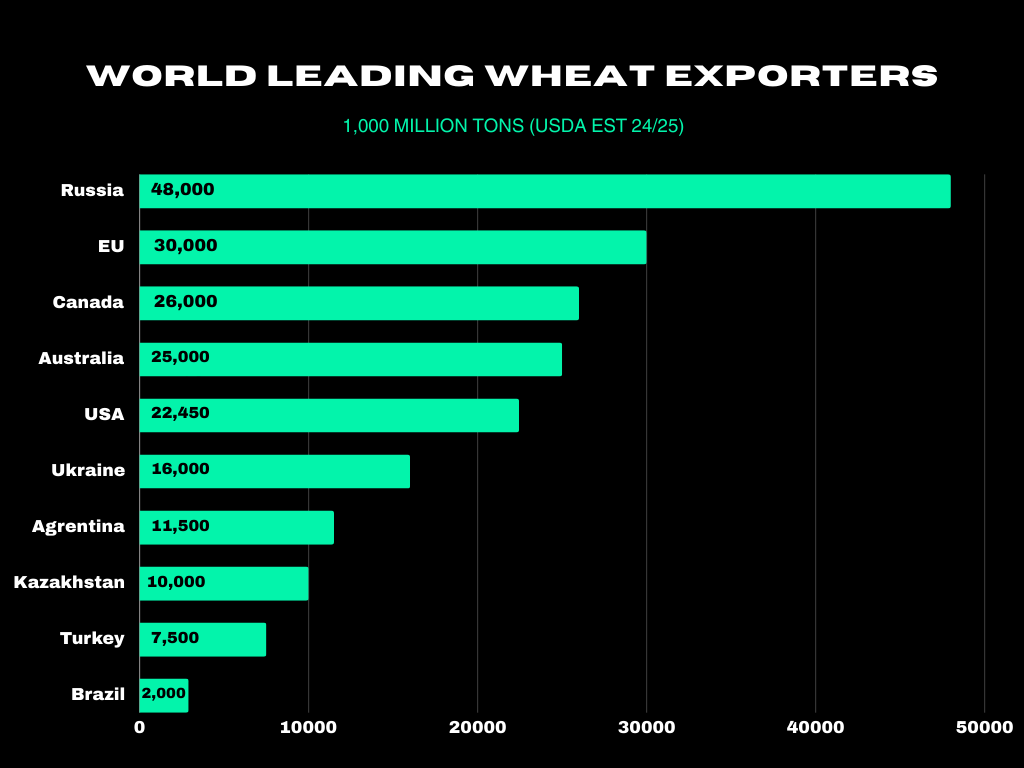
Here are two good charts that show why this could be such an important factor down the road.
This first one I have shown several times.
Russia accounts for 25% of the world's exports. A massive number.
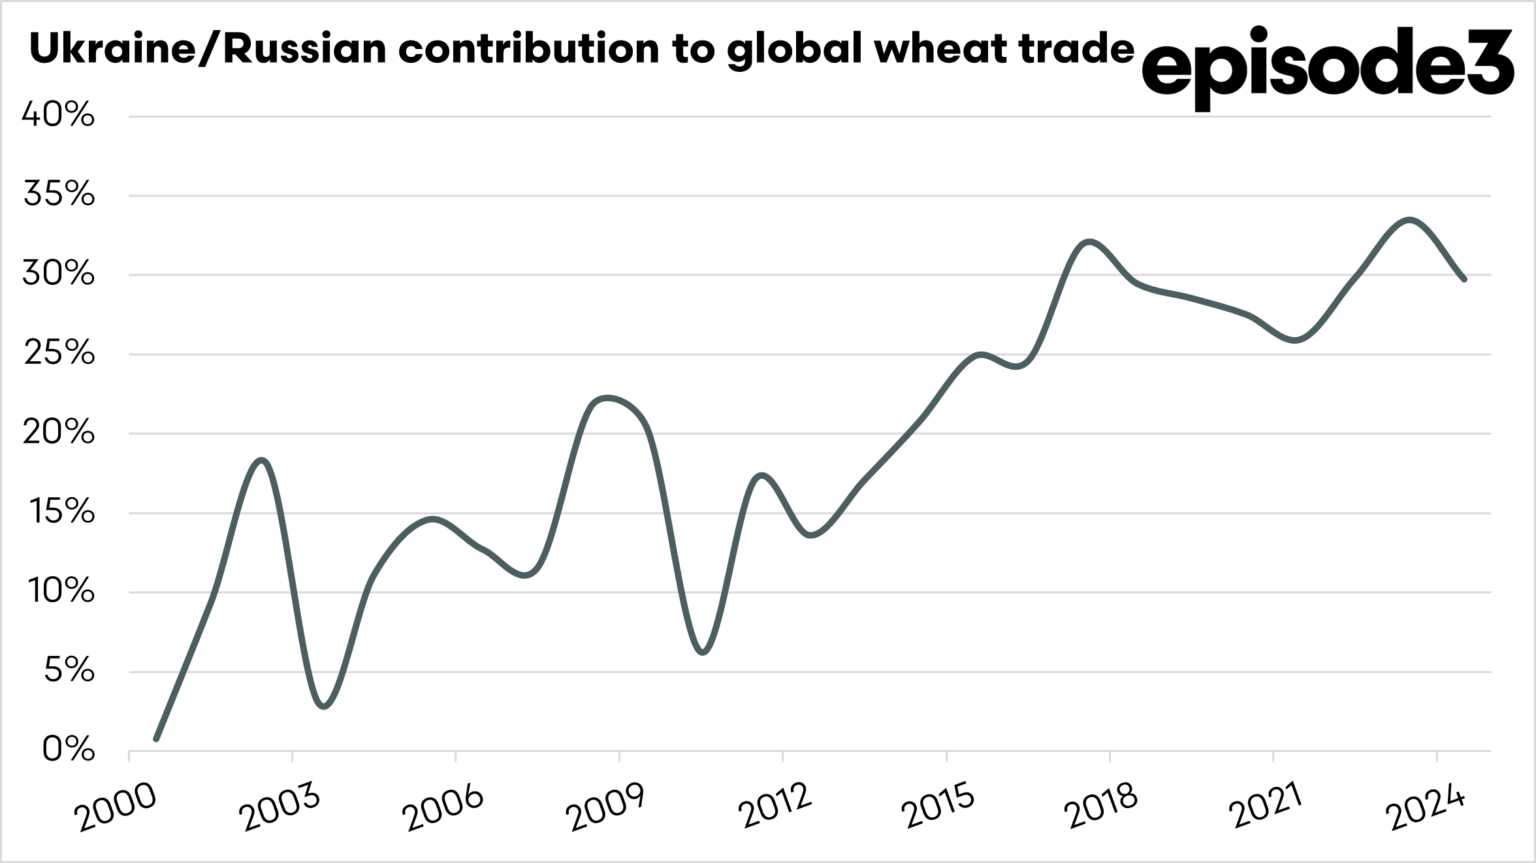
Here is a chart from "Episode 3" that shows Ukraine and Russia's contribution to global wheat trade.
They account for 33% of all wheat trade. Again, a large number.
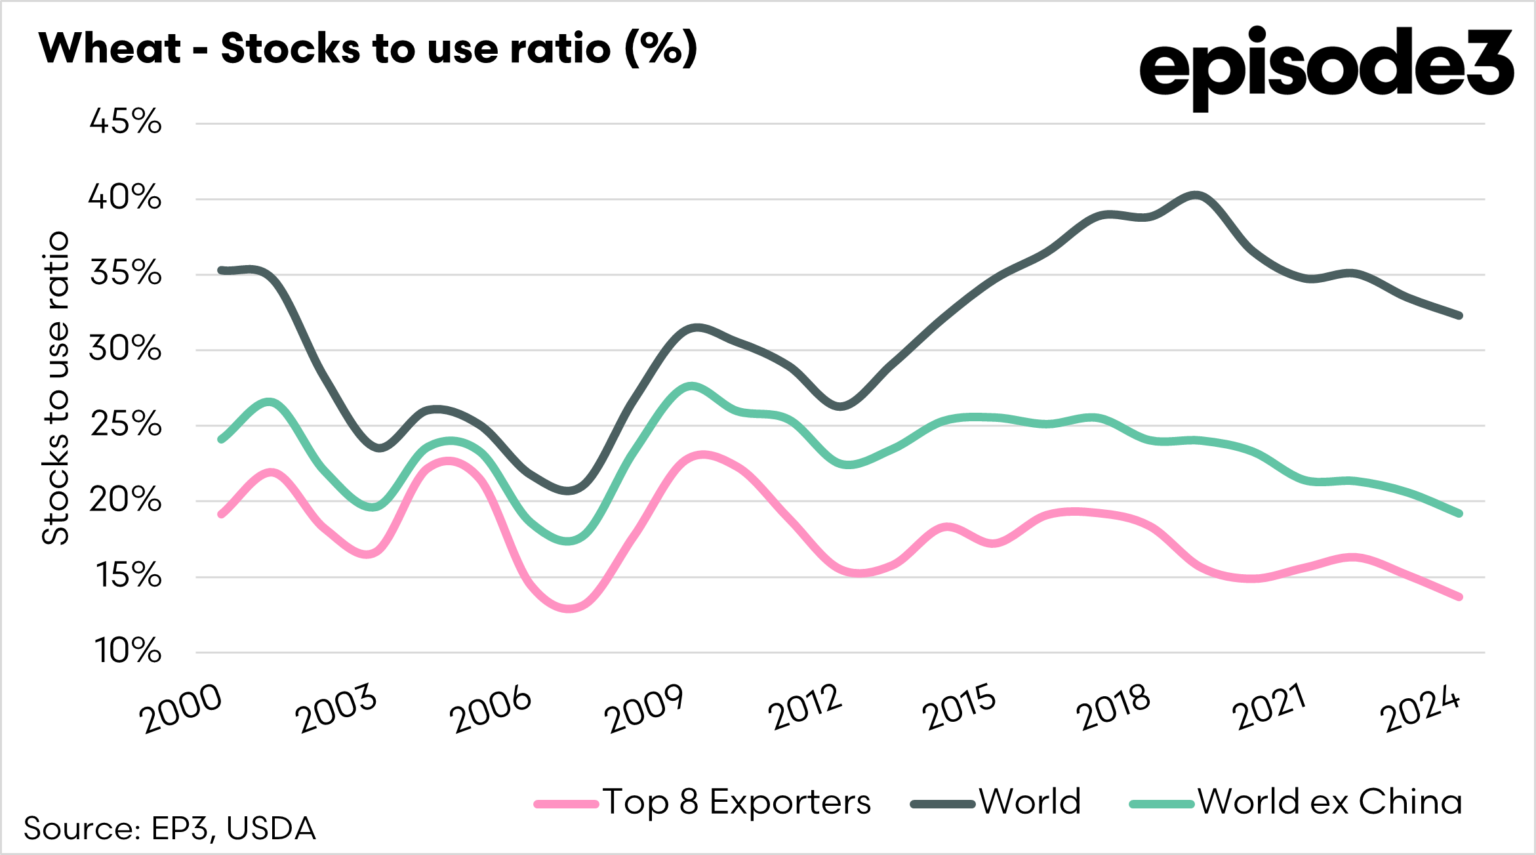
Lastly, here is another good chart from "Episode 3" that shows 3 different stocks to use ratio's for wheat.
The pink is the world's top 8 exporters of wheat. This stocks to use ratio is near all-time lows, rivaling 2008.
The grey line is the world stocks to use ratio. Not as tight as the pink line, but the lowest in a decade.
The green line is the stocks to use ratio excluding China. The lowest since 2008.
Stocks to use ratio for wheat measures how much wheat is available in storage compared to how much is expected to be consumed or exported in a given period.
It pretty much just shows how many days or months of supply are in reserve.
A high stocks to use ratio means there is plenty of wheat available to relative demand. Which typically keeps prices stable or lower.
A low stocks to use ratio indicates tighter supplies, which often leads to higher prices.
Prices are driven by supply and demand.
This is why I think wheat has potential long term.
Short term, the charts do not look great.
We posted a new low close. If we do not bounce here soon, it could very easily open the door to lower prices.
Wheat around $5 is very possible if this support fails.
The KC chart looks a little less burdensome.
Same concept however. Range bounce until $5.45 or $5.89 gives out.
Past Sell or Protection Signals
We recently incorporated these. Here are our past signals.
Dec 11th: 🌽
Corn sell signal at $4.51 200-day MA
CLICK HERE TO VIEW
Oct 2nd: 🌾
Wheat sell signal at $6.12 target
Sep 30th: 🌽
Corn protection signal at $4.23-26
Sep 27th: 🌱
Soybean sell & protection signal at $10.65
Sep 13th: 🌾
Wheat sell signal at $5.98
May 22nd: 🌾
Wheat sell signal when wheat traded +$7.00
Want to Talk?
Our phones are open 24/7 for you guys if you ever need anything or want to discuss your operation.
Hedge Account
Interested in a hedge account? Use the link below to set up an account or shoot Jeremey a call at (605)295-3100.
Check Out Past Updates
12/16/24
SOYBEANS & WHEAT FIGHTING LOWS. WILL CORN DEMAND CONTINUE
12/13/24
POST USDA COOL OFF
12/12/24
CORN CORRECTION. WHY WE ALERTED SELL SIGNAL YESTERDAY
12/11/24
USDA PRICED IN? FAIR VALUE OF CORN? BEAN BREAKOUT?
12/11/24
CORN SELL SIGNAL
12/10/24
USDA BREAKDOWN
12/9/24
USDA TOMORROW
12/6/24
CORN TRYING TO BREAKOUT. MAKING MARKETING DECISIONS
12/5/24
OPTIMISTIC BOUNCE IN GRAINS
12/4/24
WHEAT UNDERVALUED? MOST RISK IN BEANS. HAVE A GAME PLAN
12/3/24
BEANS HOLDING DESPITE LACK OF BULLISH STORY
12/2/24
TRUMP & BRAZIL HURDLES
11/27/24
CORN SPREADS, CRUCIAL SPOT FOR BEANS, SEASONALITY SAYS BUY
11/26/24
TARIFF TALK PRESSURE
11/25/24
HOLIDAY TRADE, SEASONALS, TARGETS & DOWNSIDE RISKS
11/22/24
CORN TARGETS & CHINA CONCERNS
11/21/24
BEANS NEAR LOWS. CORN NEAR HIGHS. 2025 SALE THOUGHTS
11/19/24
WHAT’S NEXT FOR GRAINS
11/18/24
WHEAT LEADS THE GRAINS REBOUND
11/15/24
BIG BOUNCE, FUNDS LONG CORN, DOLLAR & DEMAND
11/14/24
3RD DAY OF GRAINS FALL OUT
11/13/24
GRAINS CONTINUE WEAKNESS & DOLLAR CONTINUES RALLY
11/12/24
ANOTHER POOR PERFORMANCE IN GRAINS
11/11/24
POOR ACTION IN GRAINS POST FRIENDLY USDA
11/8/24
USDA FRIENDLY BUT GRAINS WELL OFF HIGHS
11/6/24
GRAINS STORM BACK POST TRADE WAR FEAR
11/5/24
ALL ABOUT THE ELECTION & VIDEO CHART UDPATE
11/4/24
ELECTION TOMORROW
11/1/24
GRAINS WAITING ON NEWS
10/31/24
ELECTION & USDA NEXT WEEK
10/30/24
SEASONALS, CORN DEMAND, BRAZIL REAL & MORE
10/29/24
WHAT’S NEXT AFTER HARVEST?
10/25/24
POOR PRICE ACTION & SPREADS WEAKEN
10/24/24
BIG BUYERS WANT CORN?
10/23/24
6TH STRAIGHT DAY OF CORN SALES
10/22/24
STRONG DEMAND & TECHNICAL BUYING FOR GRAINS
10/21/24
SPREADS, BASIS CONTRACTS, STRONG CORN, BIG SALES
10/18/24
BEANS & WHEAT HAMMERED
10/17/24
OPTIMISTIC PRICE ACTION IN GRAINS
10/16/24
BEANS CONTINUE DOWNFALL. CORN & WHEAT FIND SUPPORT
10/15/24
MORE PAIN FOR GRAINS
10/14/24
GRAINS SMACKED. BEANS BREAK $10.00
10/10/24
USDA TOMORROW
10/9/24
MARKETING STYLES, USDA RISK, & FEED NEEDS
10/8/24
BEANS FALL APART
10/7/24
FLOORS, RISKS, & POTENTIAL UPSIDE
10/4/24
HEDGE PRESSURE
10/3/24
GRAINS TAKE A STEP BACK
10/2/24
CORN & WHEAT CONTINUE RUN
10/1/24
CORN & WHEAT POST MULTI-MONTH HIGHS
9/30/24


