THE HISTORY OF THE JAN USDA & MORE
MARKET UPDATE
You can scroll to read the usual update as well. As the written version is the exact same as the video.
Want to talk? (605)295-3100
Futures Prices Close
Overview
Grains mixed but all bounced nicely off the early lows. So decent price action across the board.
We included a lot in today's update as it's a longer one so here is a breakdown of everything we cover today in order:
USDA estimates
The history of the Jan USDA report
What is the corn spread story?
The funds. Now long +229k corn
Argentina dry Jan & yield correlation
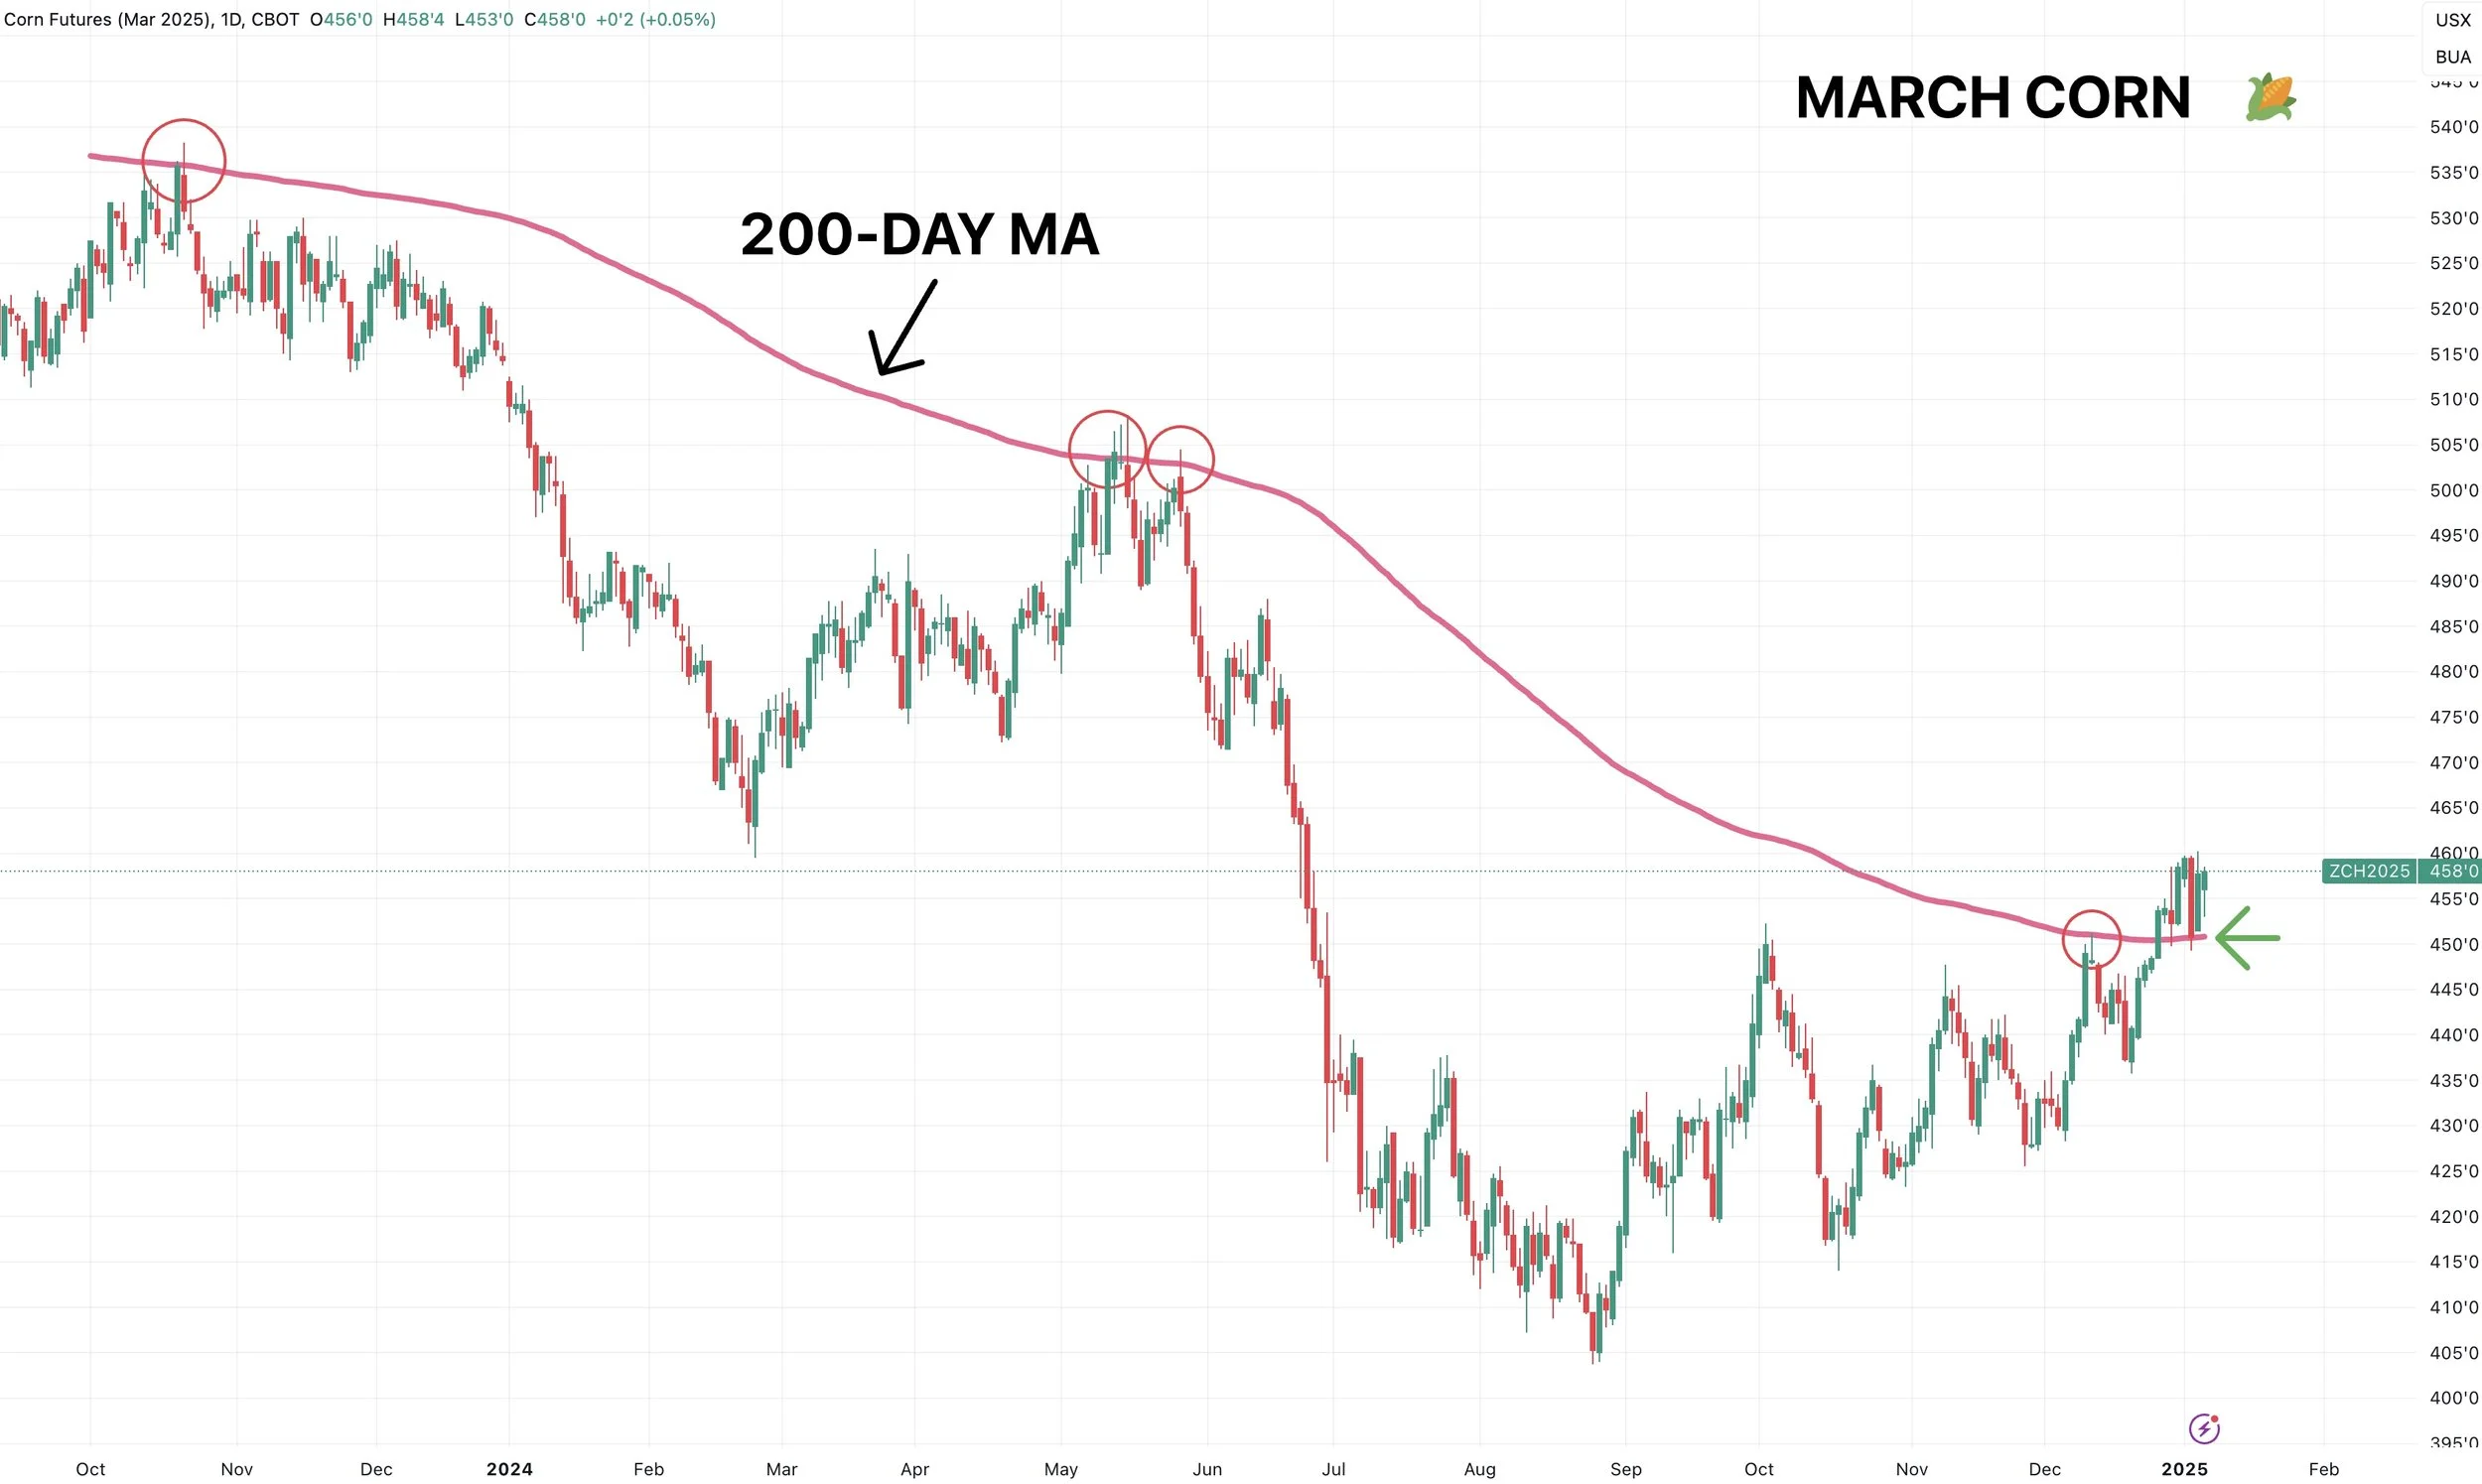
Corn chart breakdown
Why aren’t beans sub $9 already?
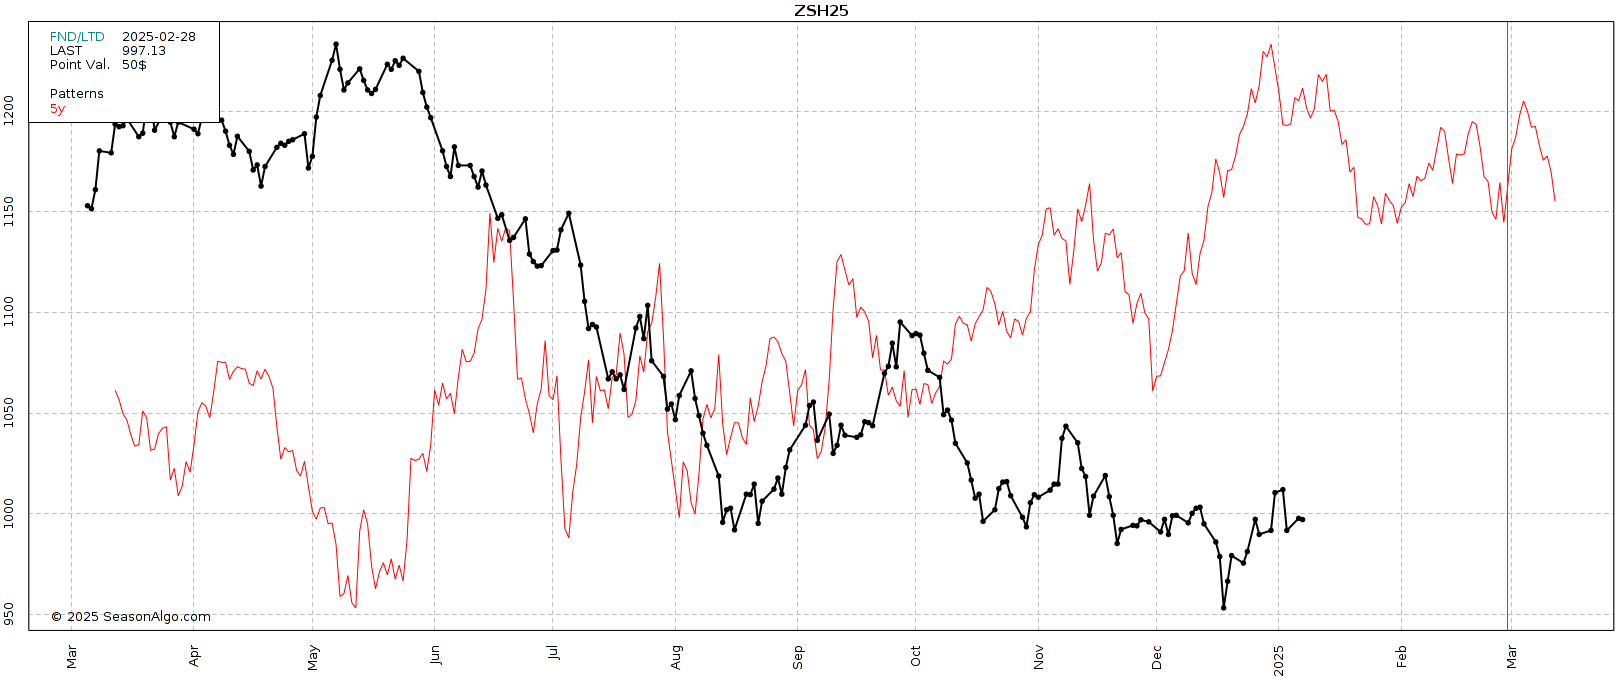
Bean seasonal suggests mid-Jan drop
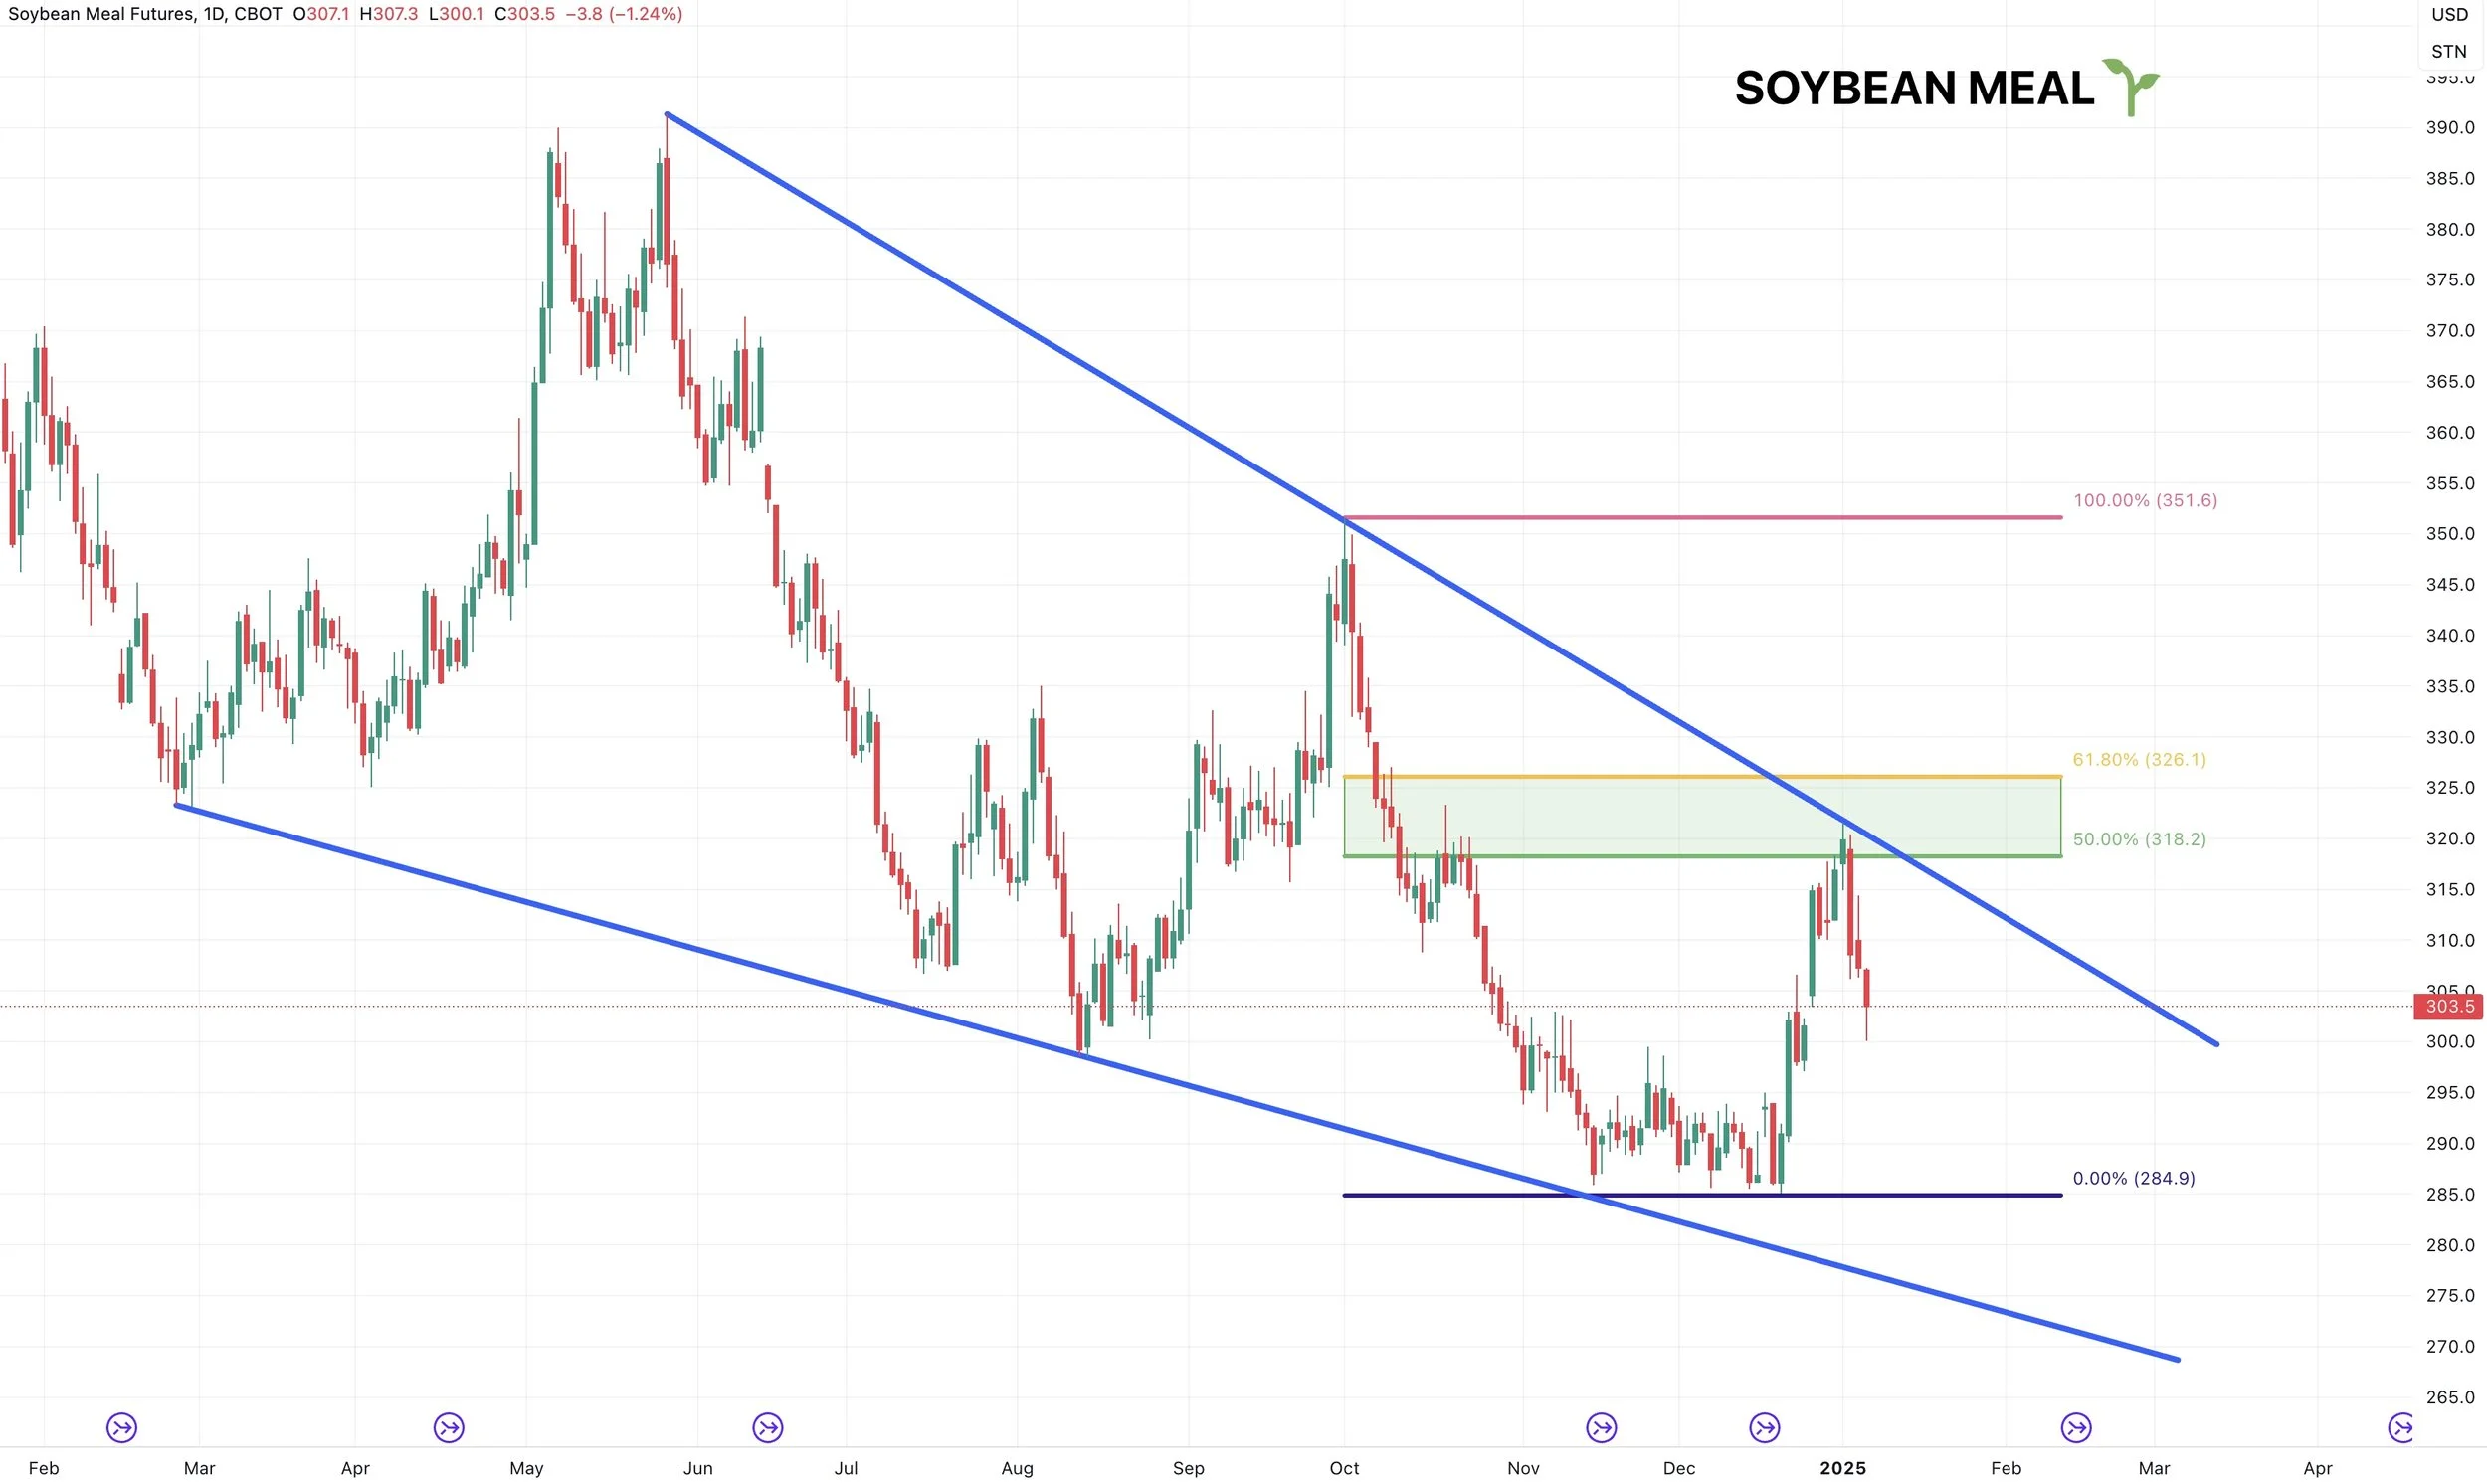
Meal chart concerns
Why wheat is undervalued
USDA Report Estimates
Report is out Friday. The trade is looking for very slight cuts to yields for both corn & soybeans.
Estimates
Corn: 182.7 bpa (183.1 last month)
Bean: 51.6 bpa (51.7 last month)
The actual yield moves are almost larger than the trade is expecting, hence why this report can be such a big market mover.
Trade Range Estimates
Corn: 181.3 to 183.7
Bean: 51.1 to 52.6
This estimate for corn is historically narrow while the bean range is wider than normal.
Corn and beans have both fallen outside of their estimate ranges 3 of the past 6 years.
History of this Report
How has this report shaped up in the past?
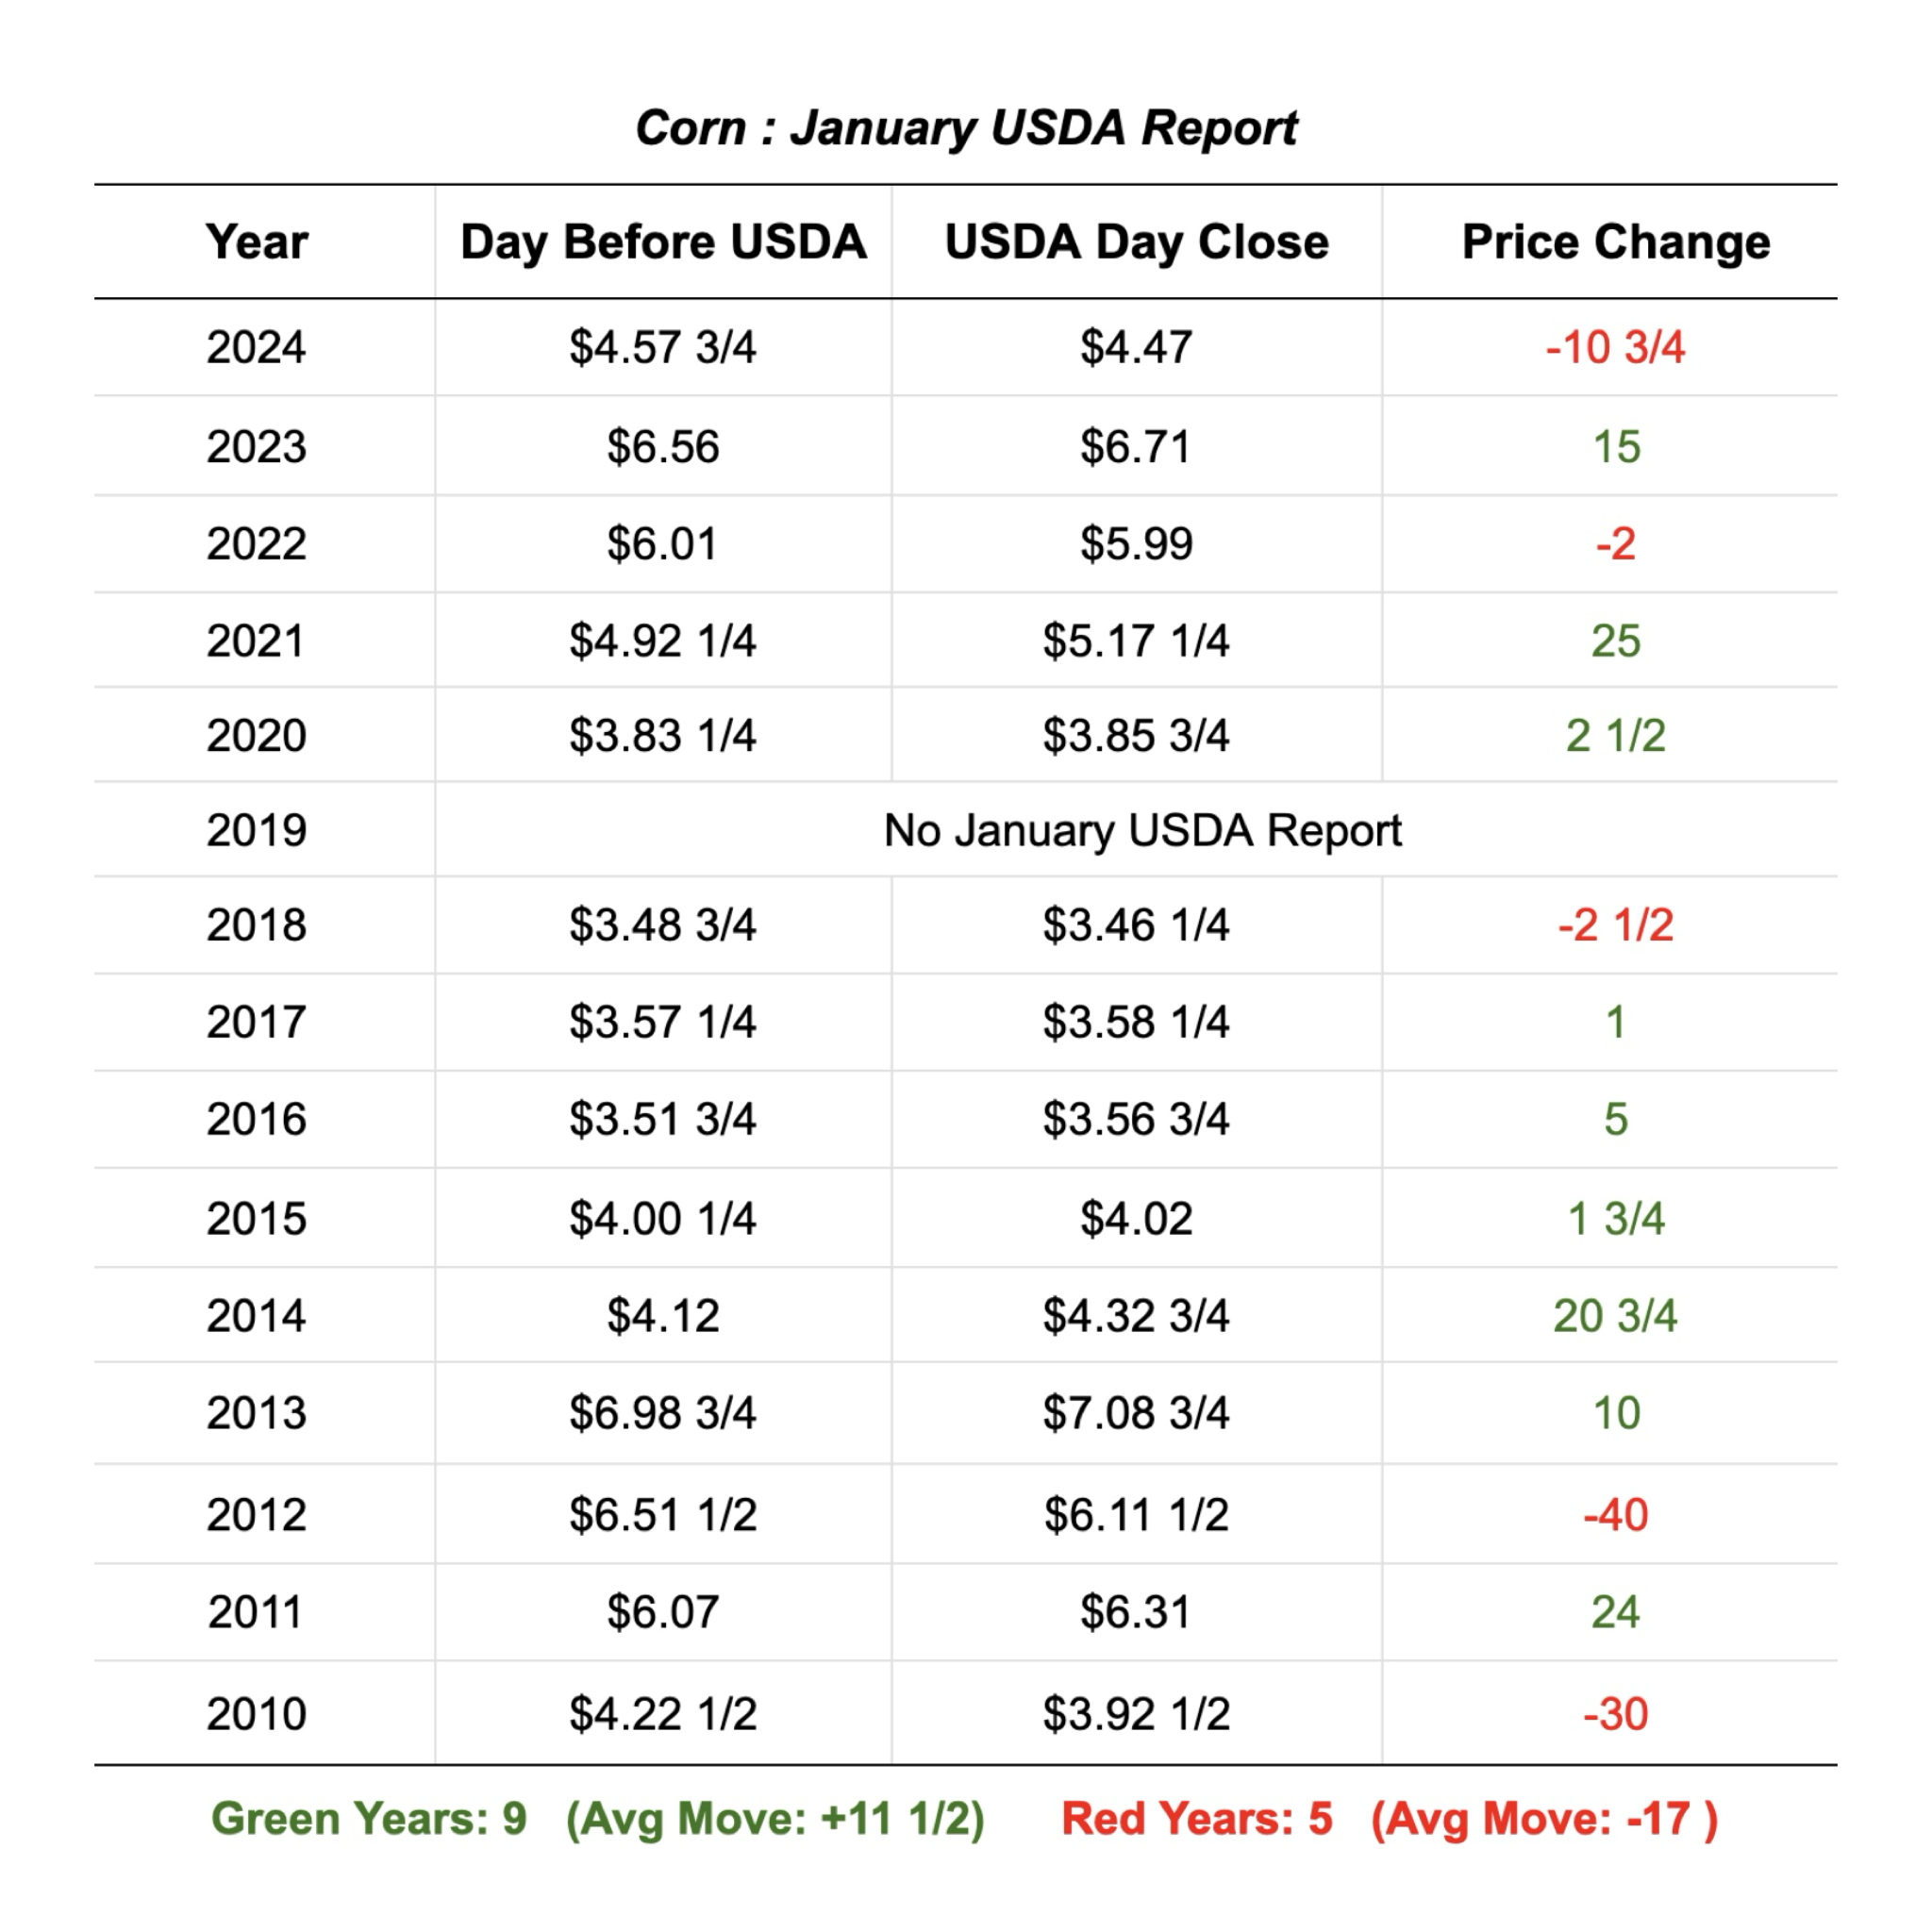
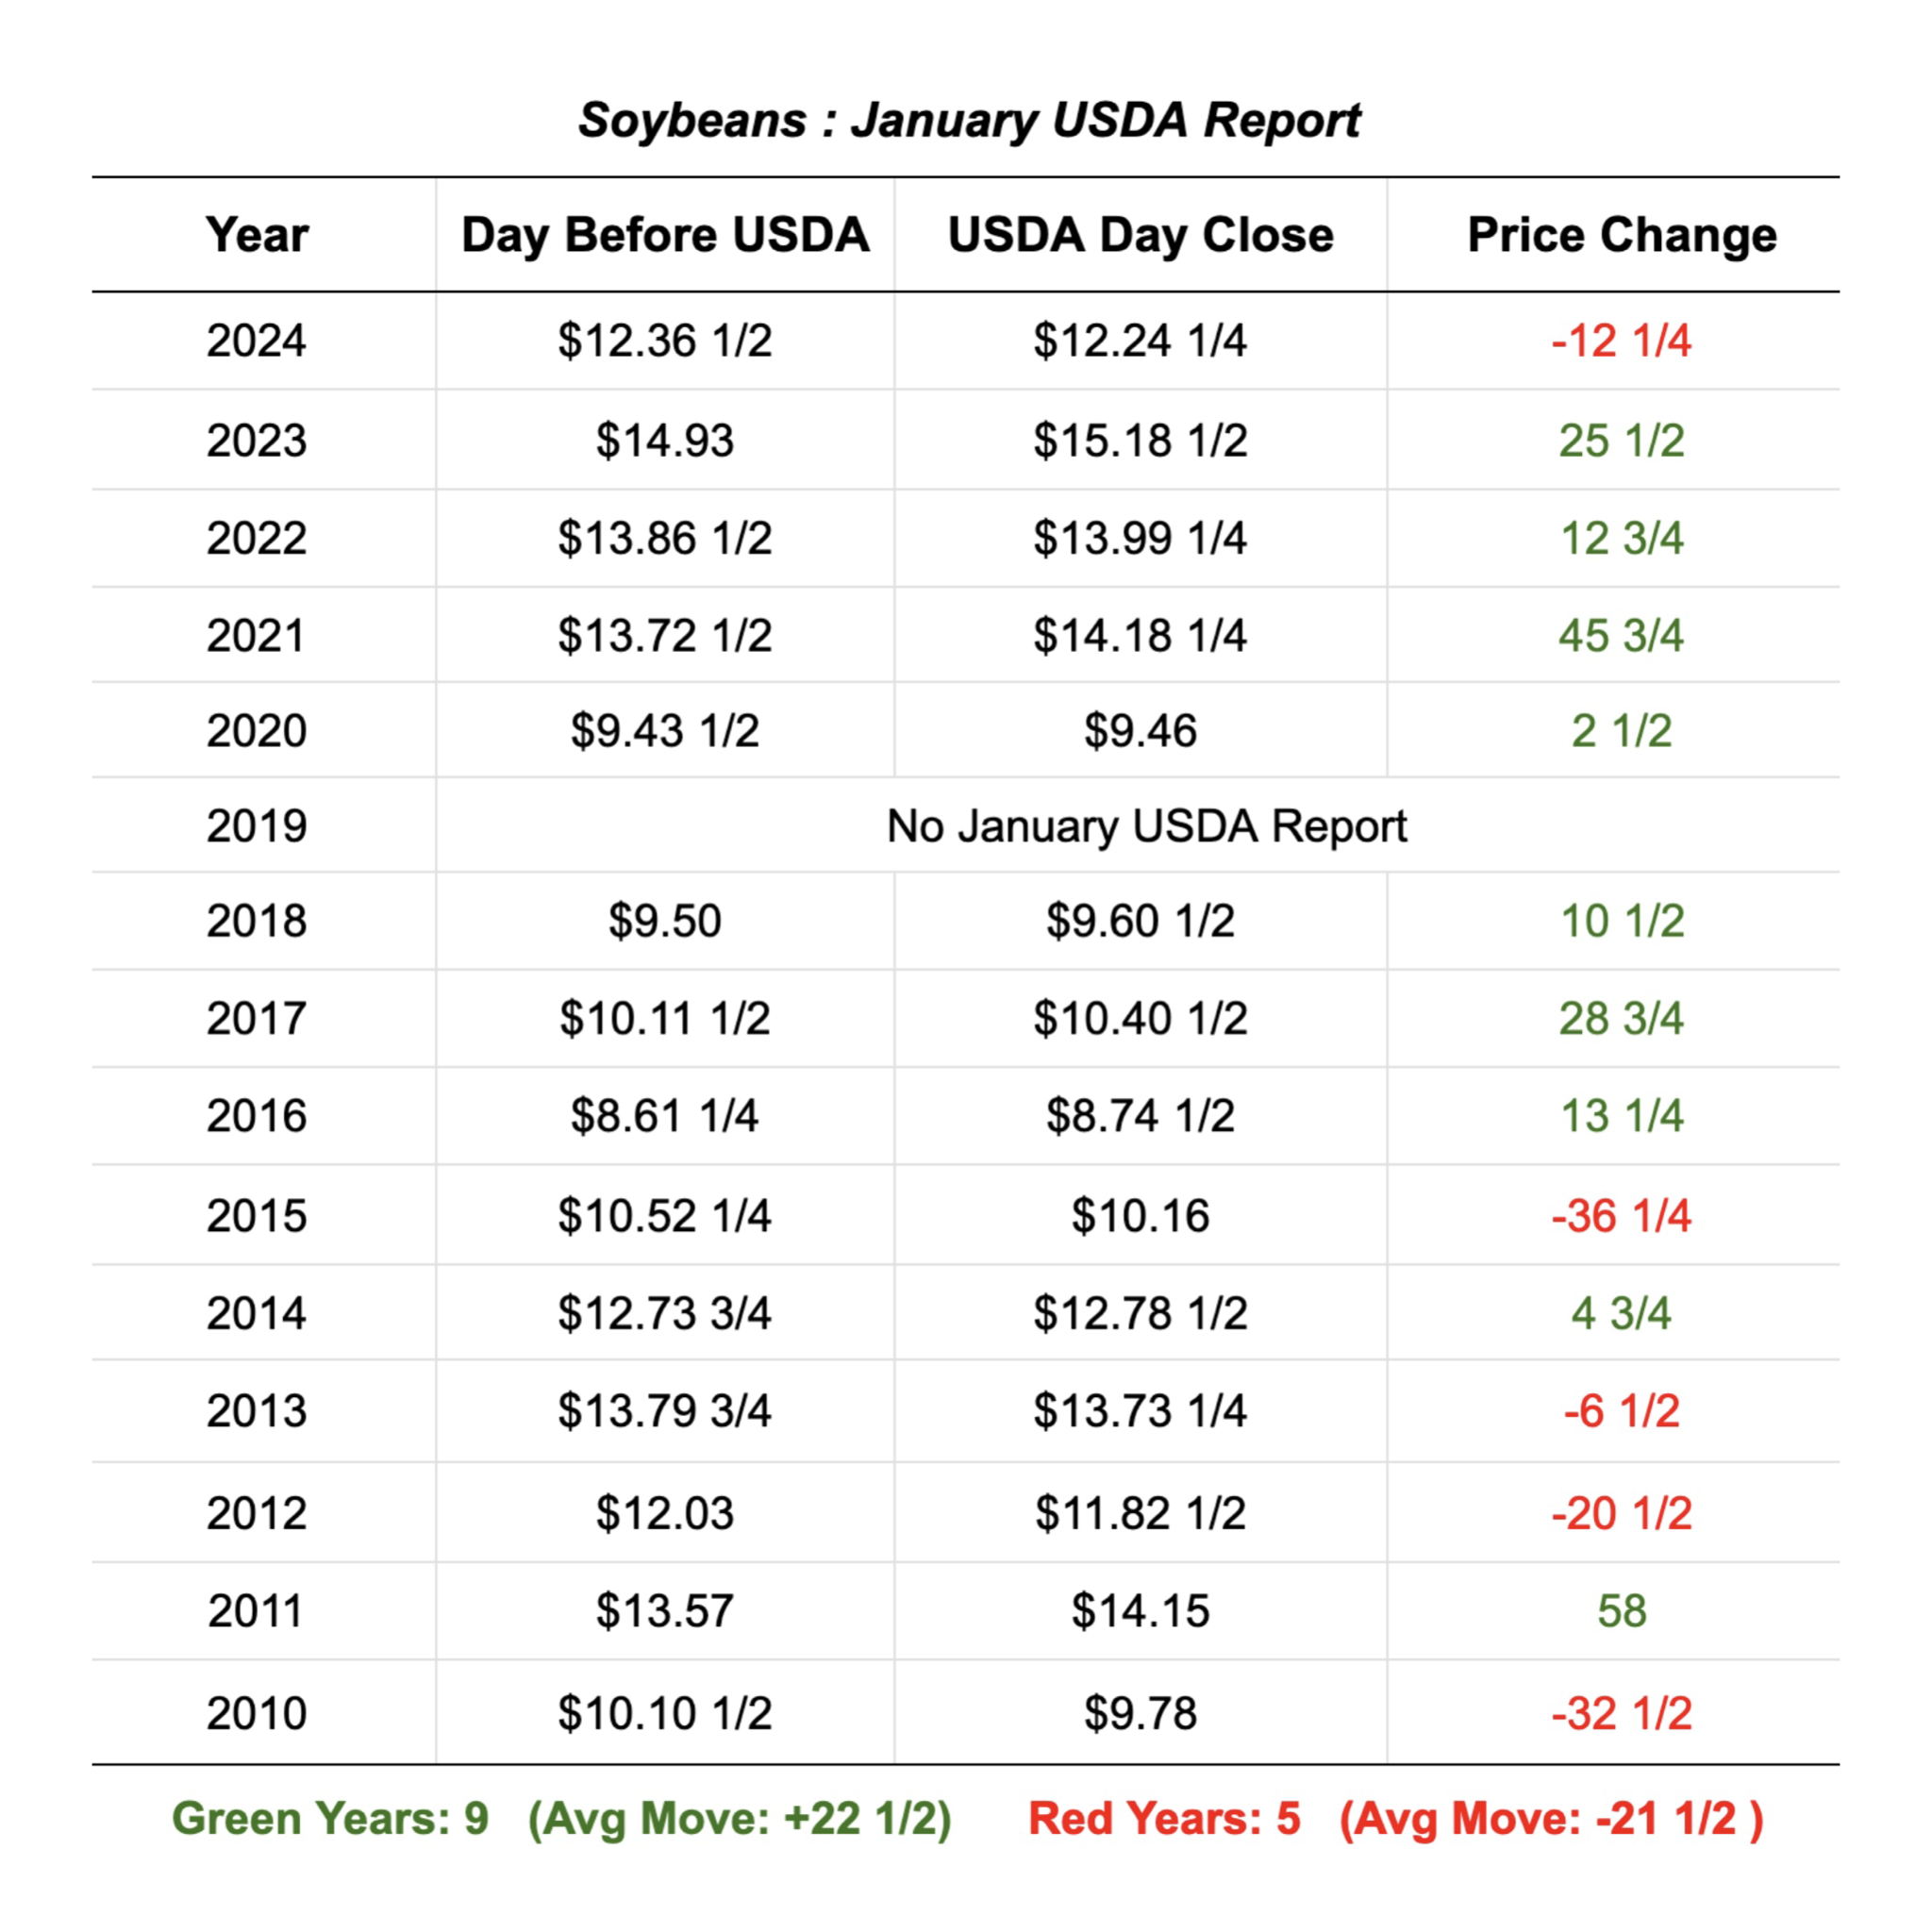
First let's look at price action.
This report is often a big market mover.
On average corn moves over double digits, while beans move over 20 cents.
For the past 14 years, both corn and beans have closed green on the day of the report 9 times while closing in the red 5 times.
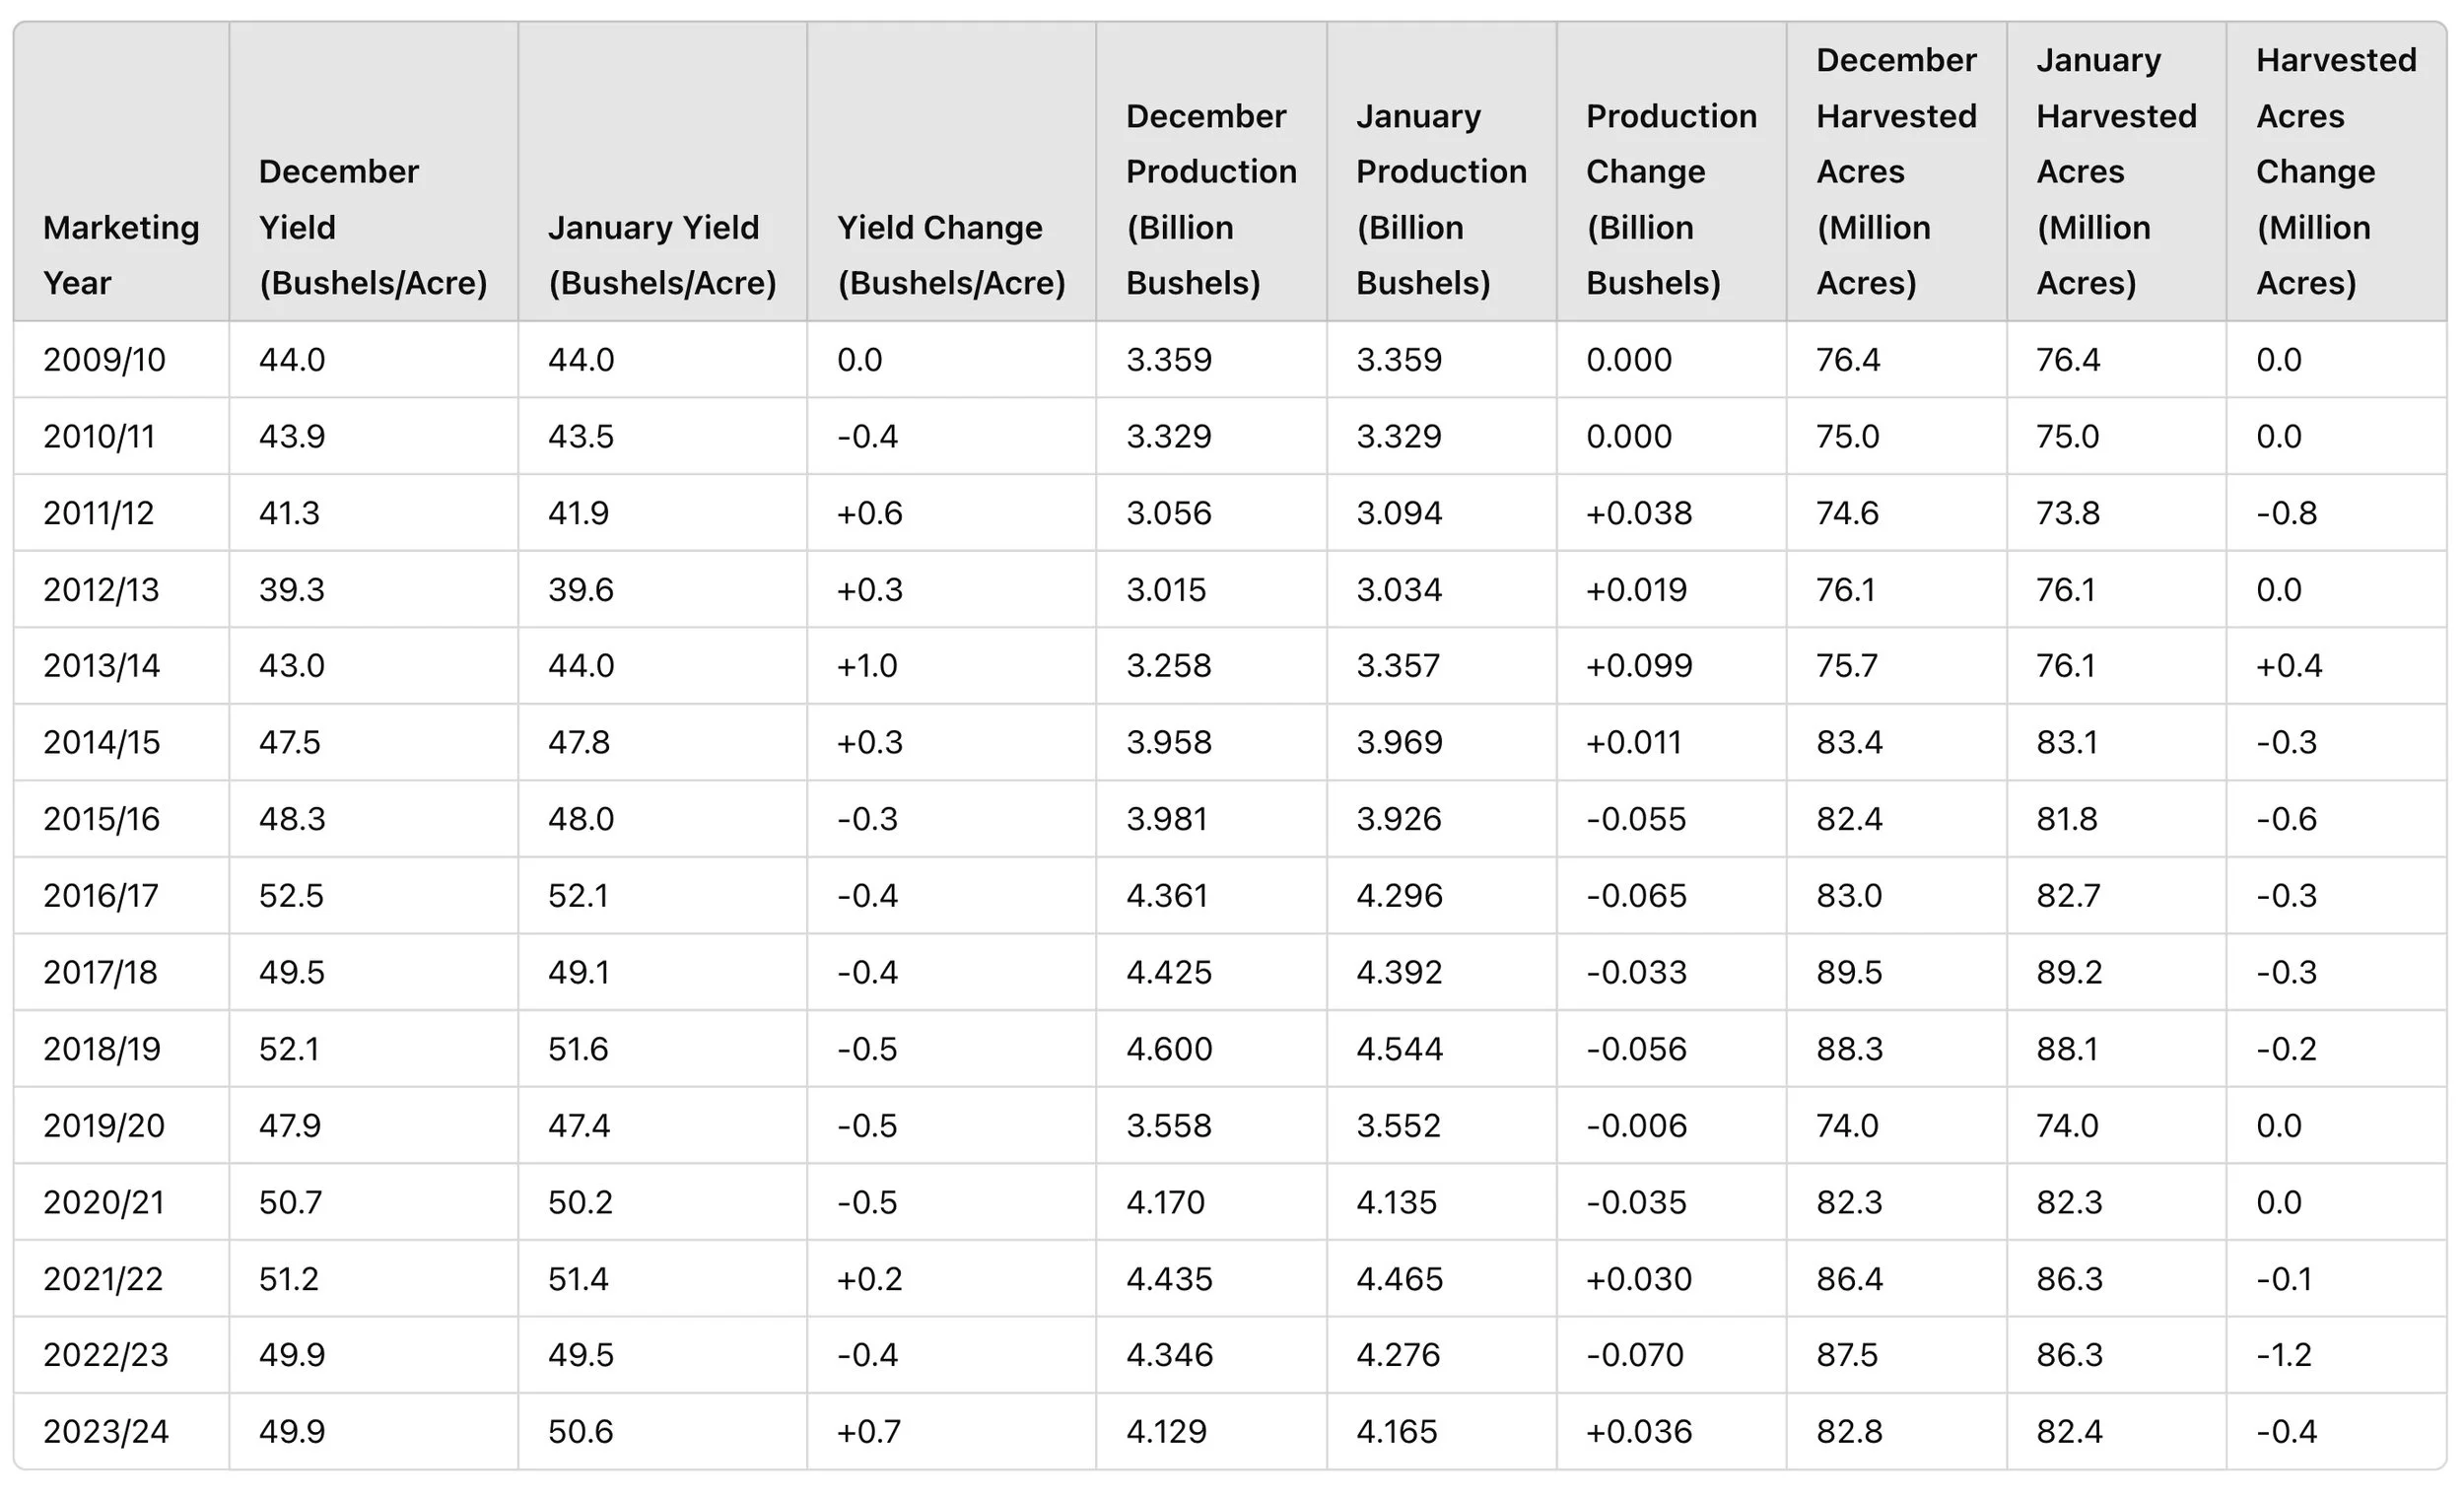
Now let's take a look at the actual numbers.
First for corn.
Yield has came in higher or unchanged vs the previous month 5 of the past 7 years (71%)
However, corn yield has only come in higher or unchanged 8 of the past 15 years. (53%)
Past 15 years of corn yield change:
Unchanged: 2 years (13%)
Raised Higher: 6 years (40%)
Cut Lower: 7 years (47%)
Something to keep in mind is that harvested acres can negate changes in yield. An example of this would be last year where yield was bumped +2.4 bpa but harvested acres dropped -0.6 which led to production only increasing +108 million.
For the past 15 years harvested acres have:
Unchanged: 4 years (27%)
Raised Higher: 4 years (27%)
Cut Lower: 7 years (47%)
Now looking at soybeans.
For the past 15 years yield has been:
Unchanged: 1 year ((7%)
Raised Higher: 6 years (40%)
Cut Lower: 8 years (53%)
The past 2 of 3 years yield was bumped higher, but since 2015/16 yield has came in lower the past 7 of 9 years.
Harvested acres change:
Unchanged: 5 years (33%)
Raised Higher: 1 year (7%)
Cut Lower: 9 years (60%)
We have only seen bean acres bumped 1 time in 2013/14.
Have a Plan Before USDA
With the major report in a few days and the recent uptick in volatility, those that are uncomfortable should prices drastically move one direction or another should strongly give us a call or text so we can help you with a marketing plan before the report. It doesn’t cost you anything.
(605)295-3100
Corn Spreads Story
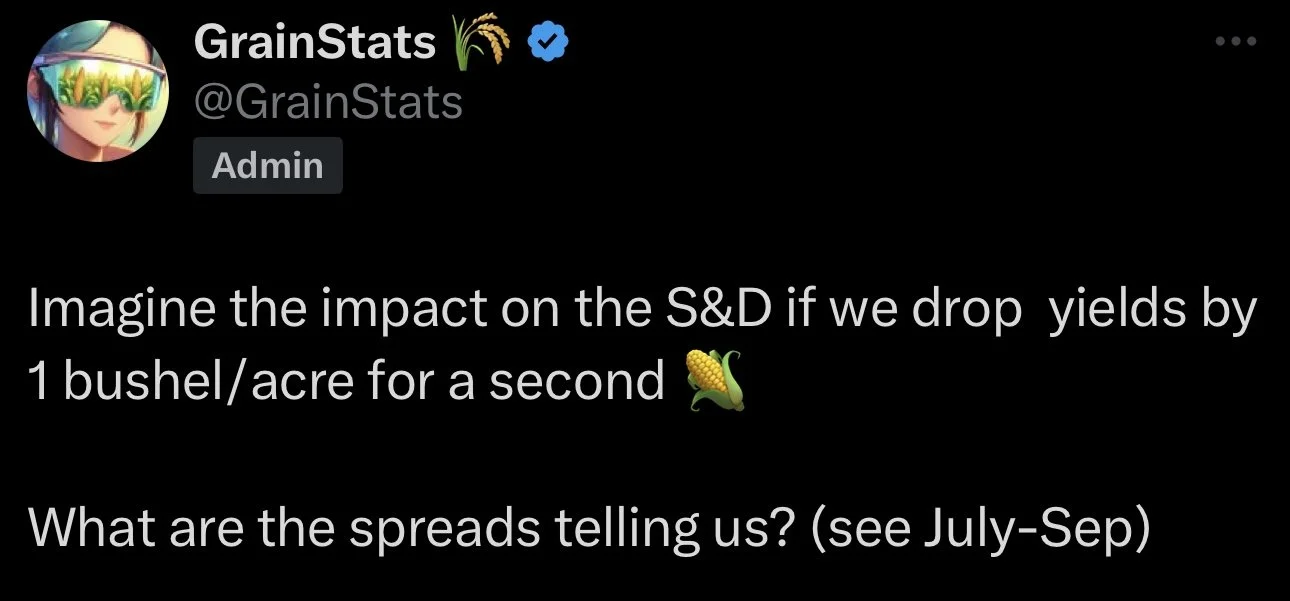
Often times people will say "the spreads tell a story".
Well what is the story?
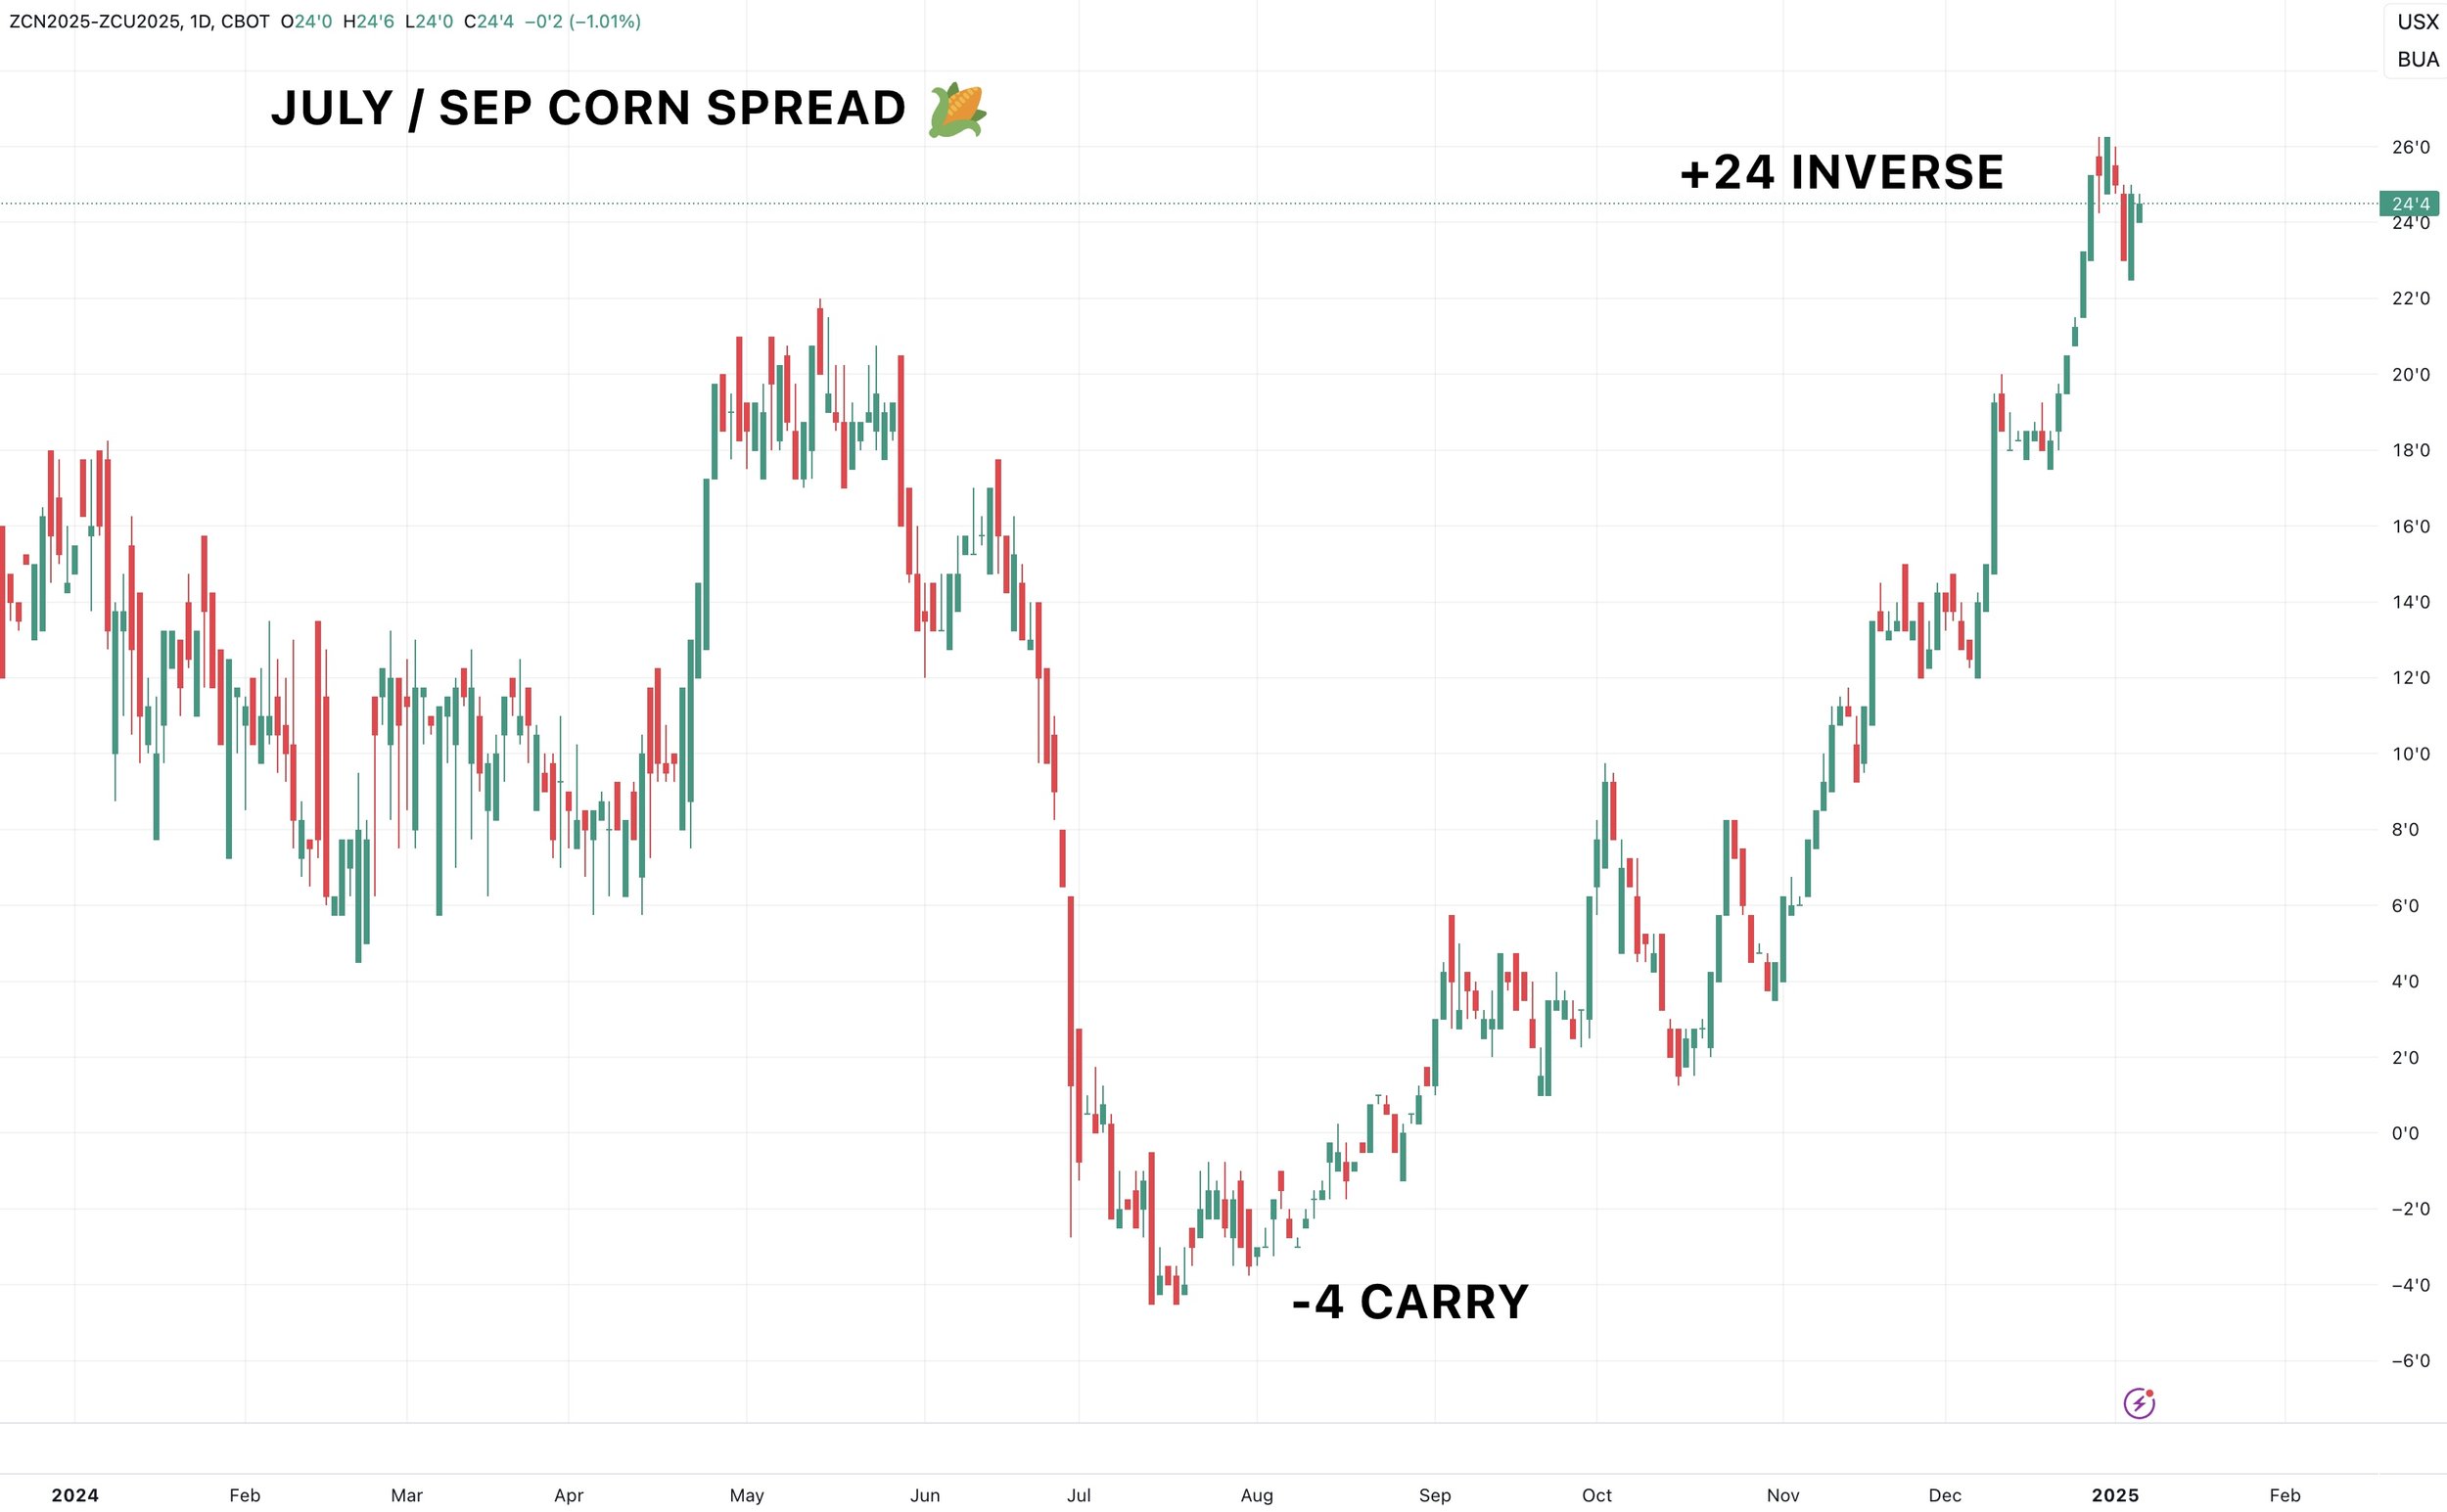
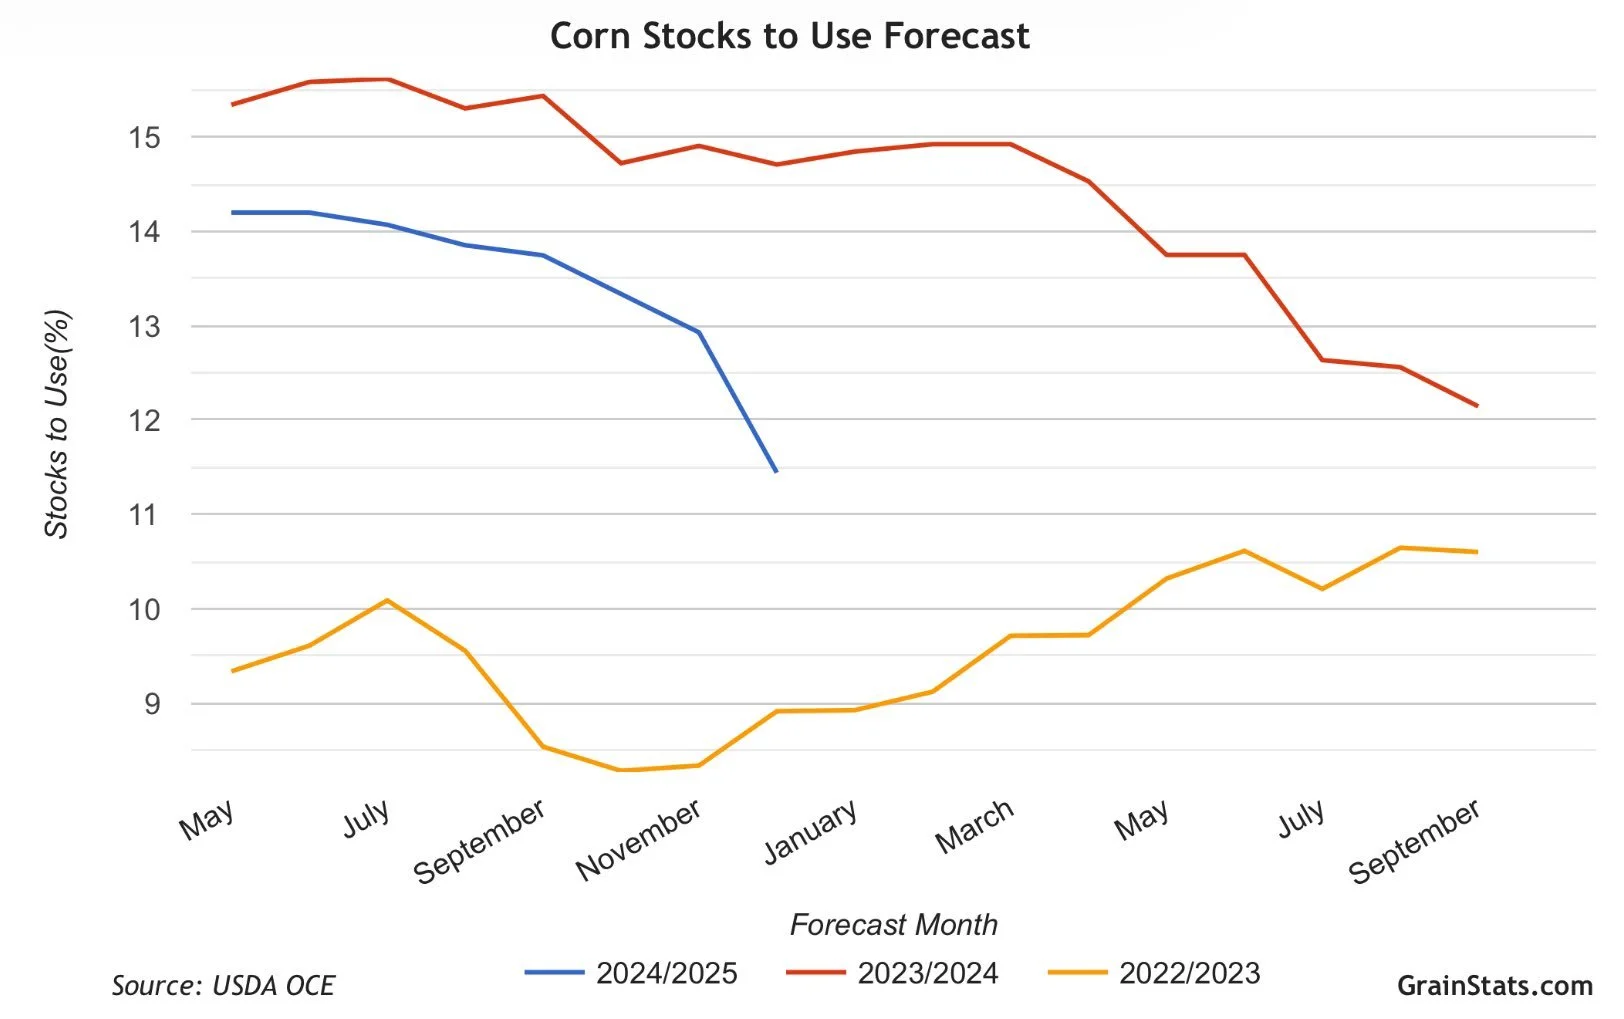
Look at the July to Sep corn spread.
When a market is going from a carry to a huge inverse like this one, it signals that demand is currently out weighing supply.
One theory some have is that corn yield might not be as large as currently advertised.
Whether it be yield, carryout, a bump in demand. Something isn’t quiet adding up.
Here is a good thought from GrainStats:
It's an even bigger deal when you realize the world ending stocks aren’t at a record like they are on soybeans. The world supply & demand balance sheet can’t necessarily handle a US crop problem.
Here are some more thoughts from the highly respected trader Darrin Fessler:
The Funds
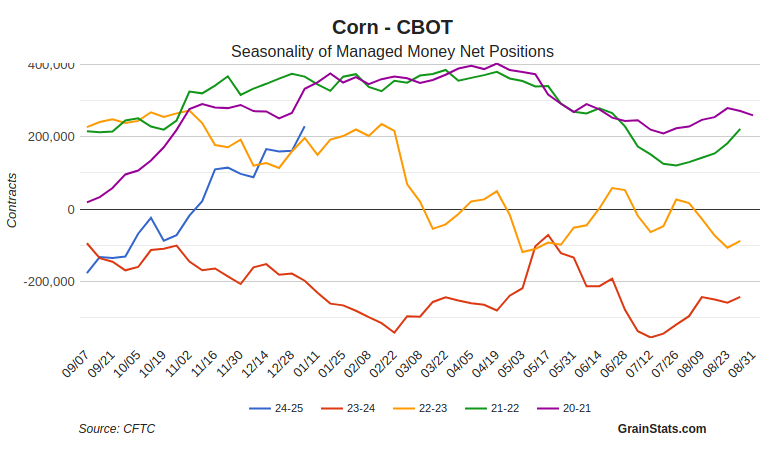
The funds are now long 229k contracts of corn.
Their largest long position since February 2023.
They added +68k contracts over the holiday week alone to end the year.
Chart from GrainStats
The absolute longest the funds typically go is around 400k.
However in bear market years that number is usually closer to 200k.
With some outlier years such as 2015 where they got long 280k and in 2017 where they barely got long 100k.
But this is something we have to be aware of here. If we are still in a bear market the funds usually top somewhere around here.
Unless the corn bull continues to get fed, there is the chance the funds start to take profit on their corn position.
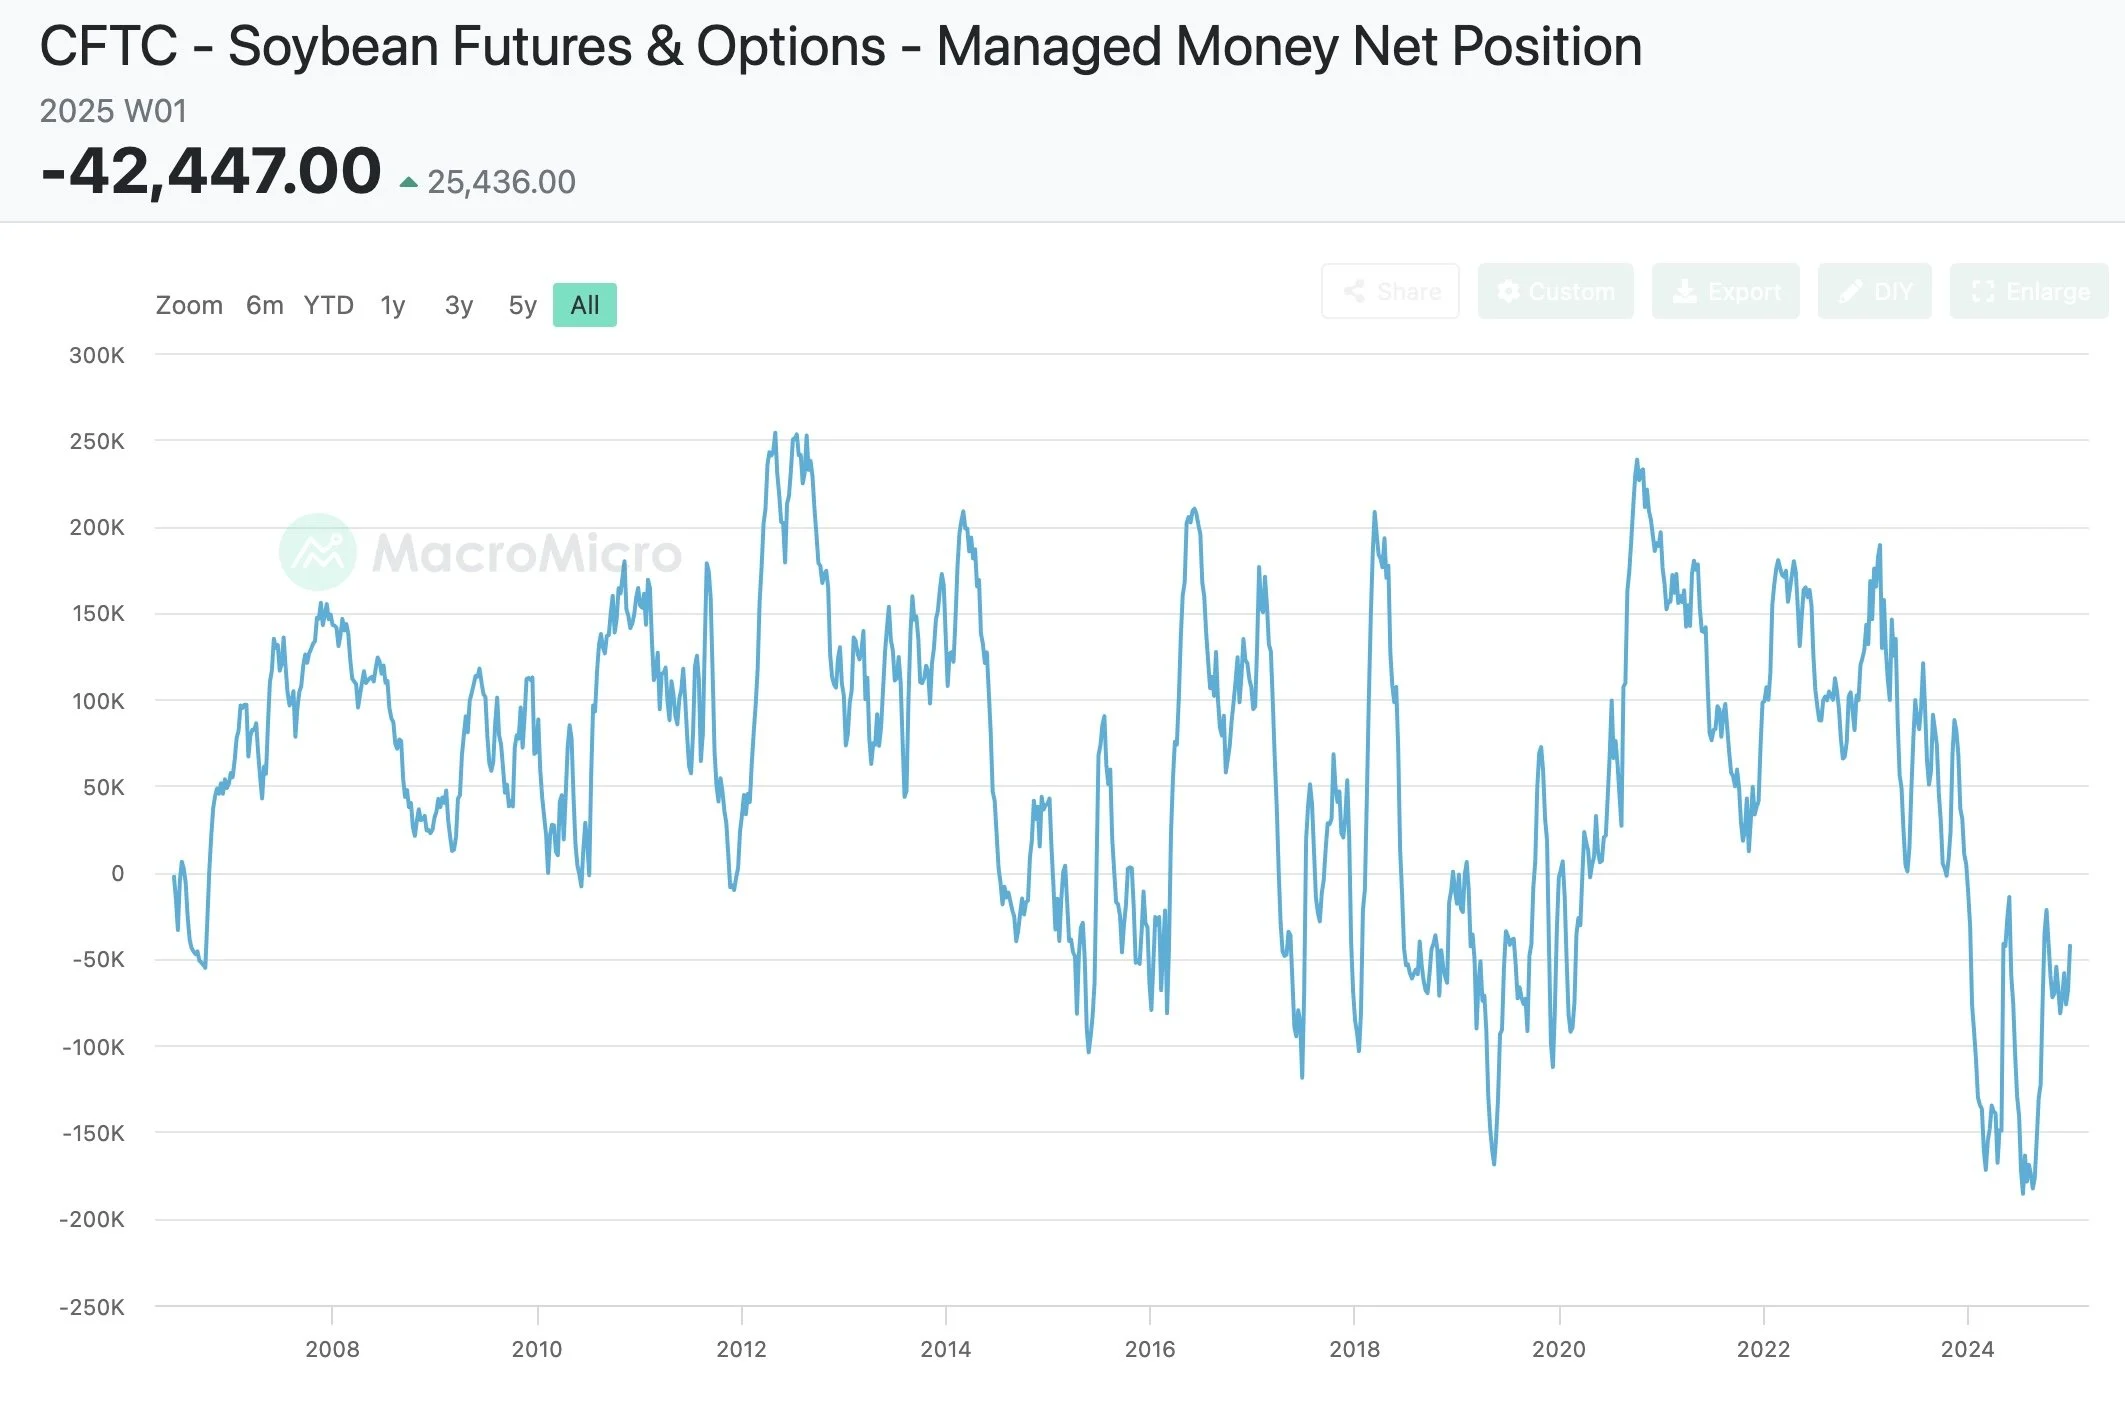
The funds are short -43k contracts of soybeans.
It isn’t a massive short position like last year's record.
Usually the max the funds get short on beans is -100k, until last year where they went short -180k.
Argentina Rain
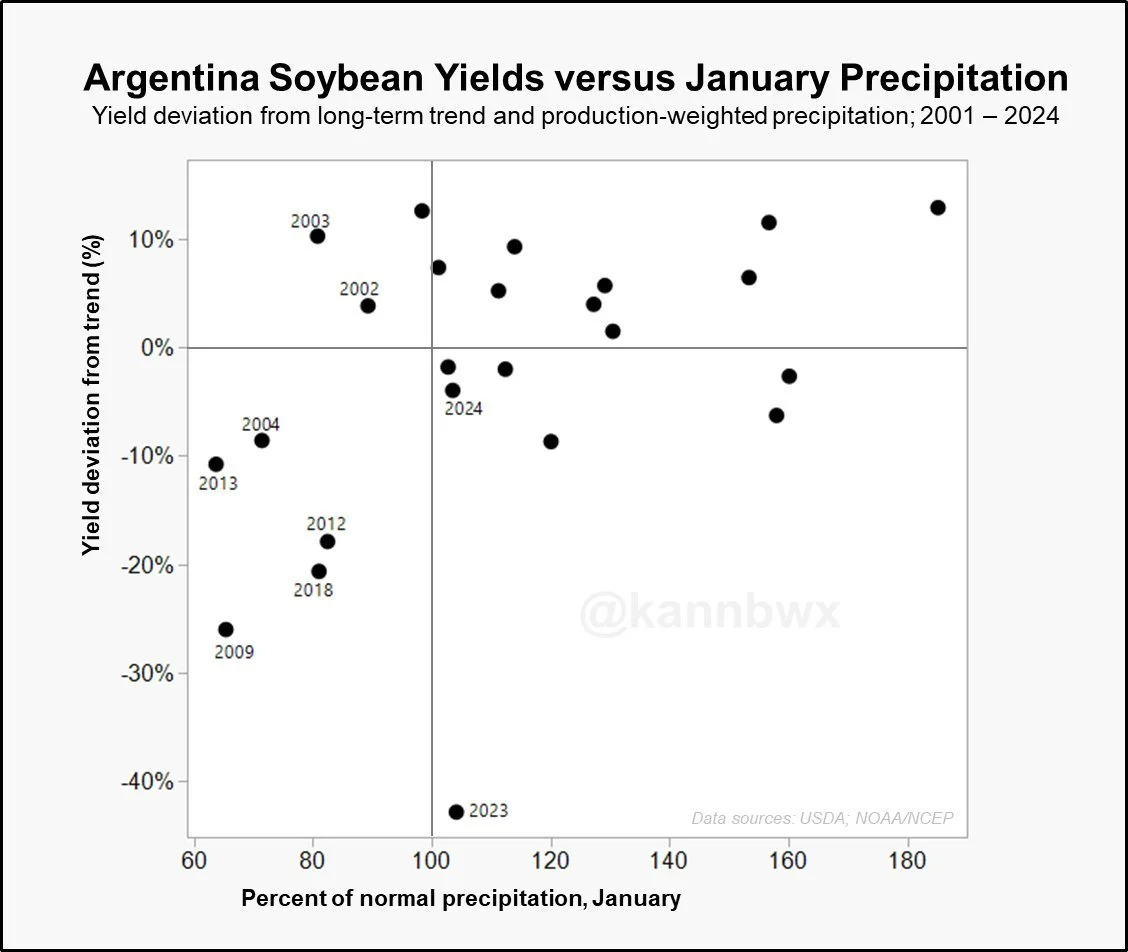
From Karen Braun:
"This chart and the current forecasts are concerning.
Models currently suggest January precipitation at best may only be 33% of normal by Jan 22nd.
To say this is not a winning recipe for soybeans is putting it mildly."
Her chart below shows that a dry January can have big impacts on yield.
Something to watch if Argy stays dry.
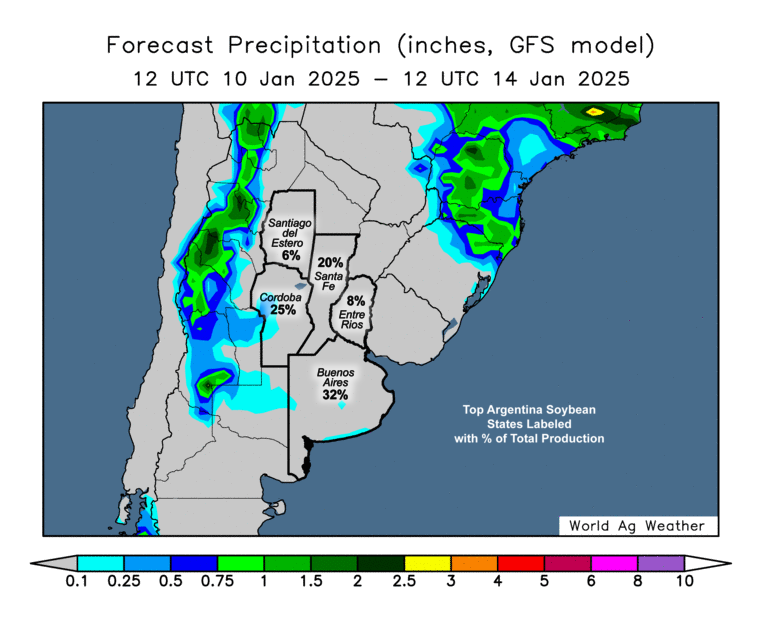
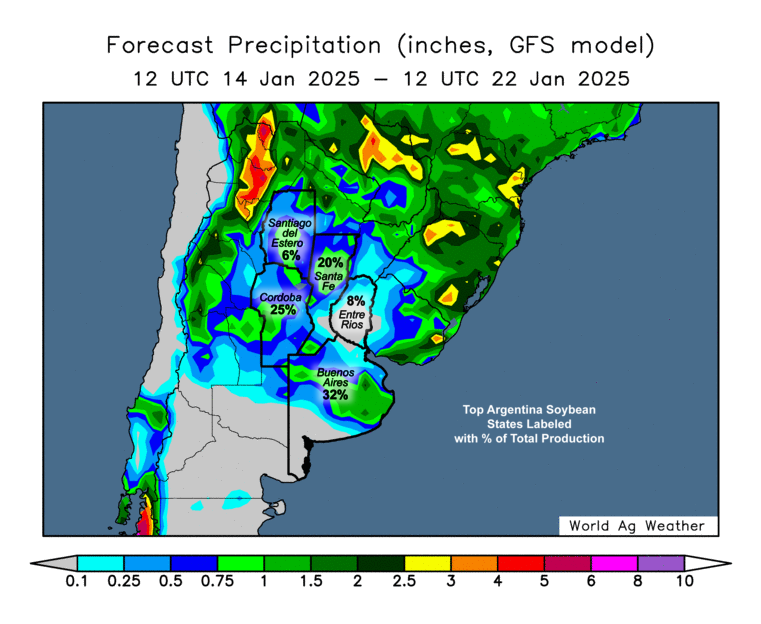
Here is the forecasts.
It is dry for at least another week but rain is expected to return in the 8-15 day.
If these rains miss, we likely get a weather scare. If they hit, then I don't think we see much story here.
7 Day Forecast
8-15 Day Forecast
Today's Main Takeaways
Corn
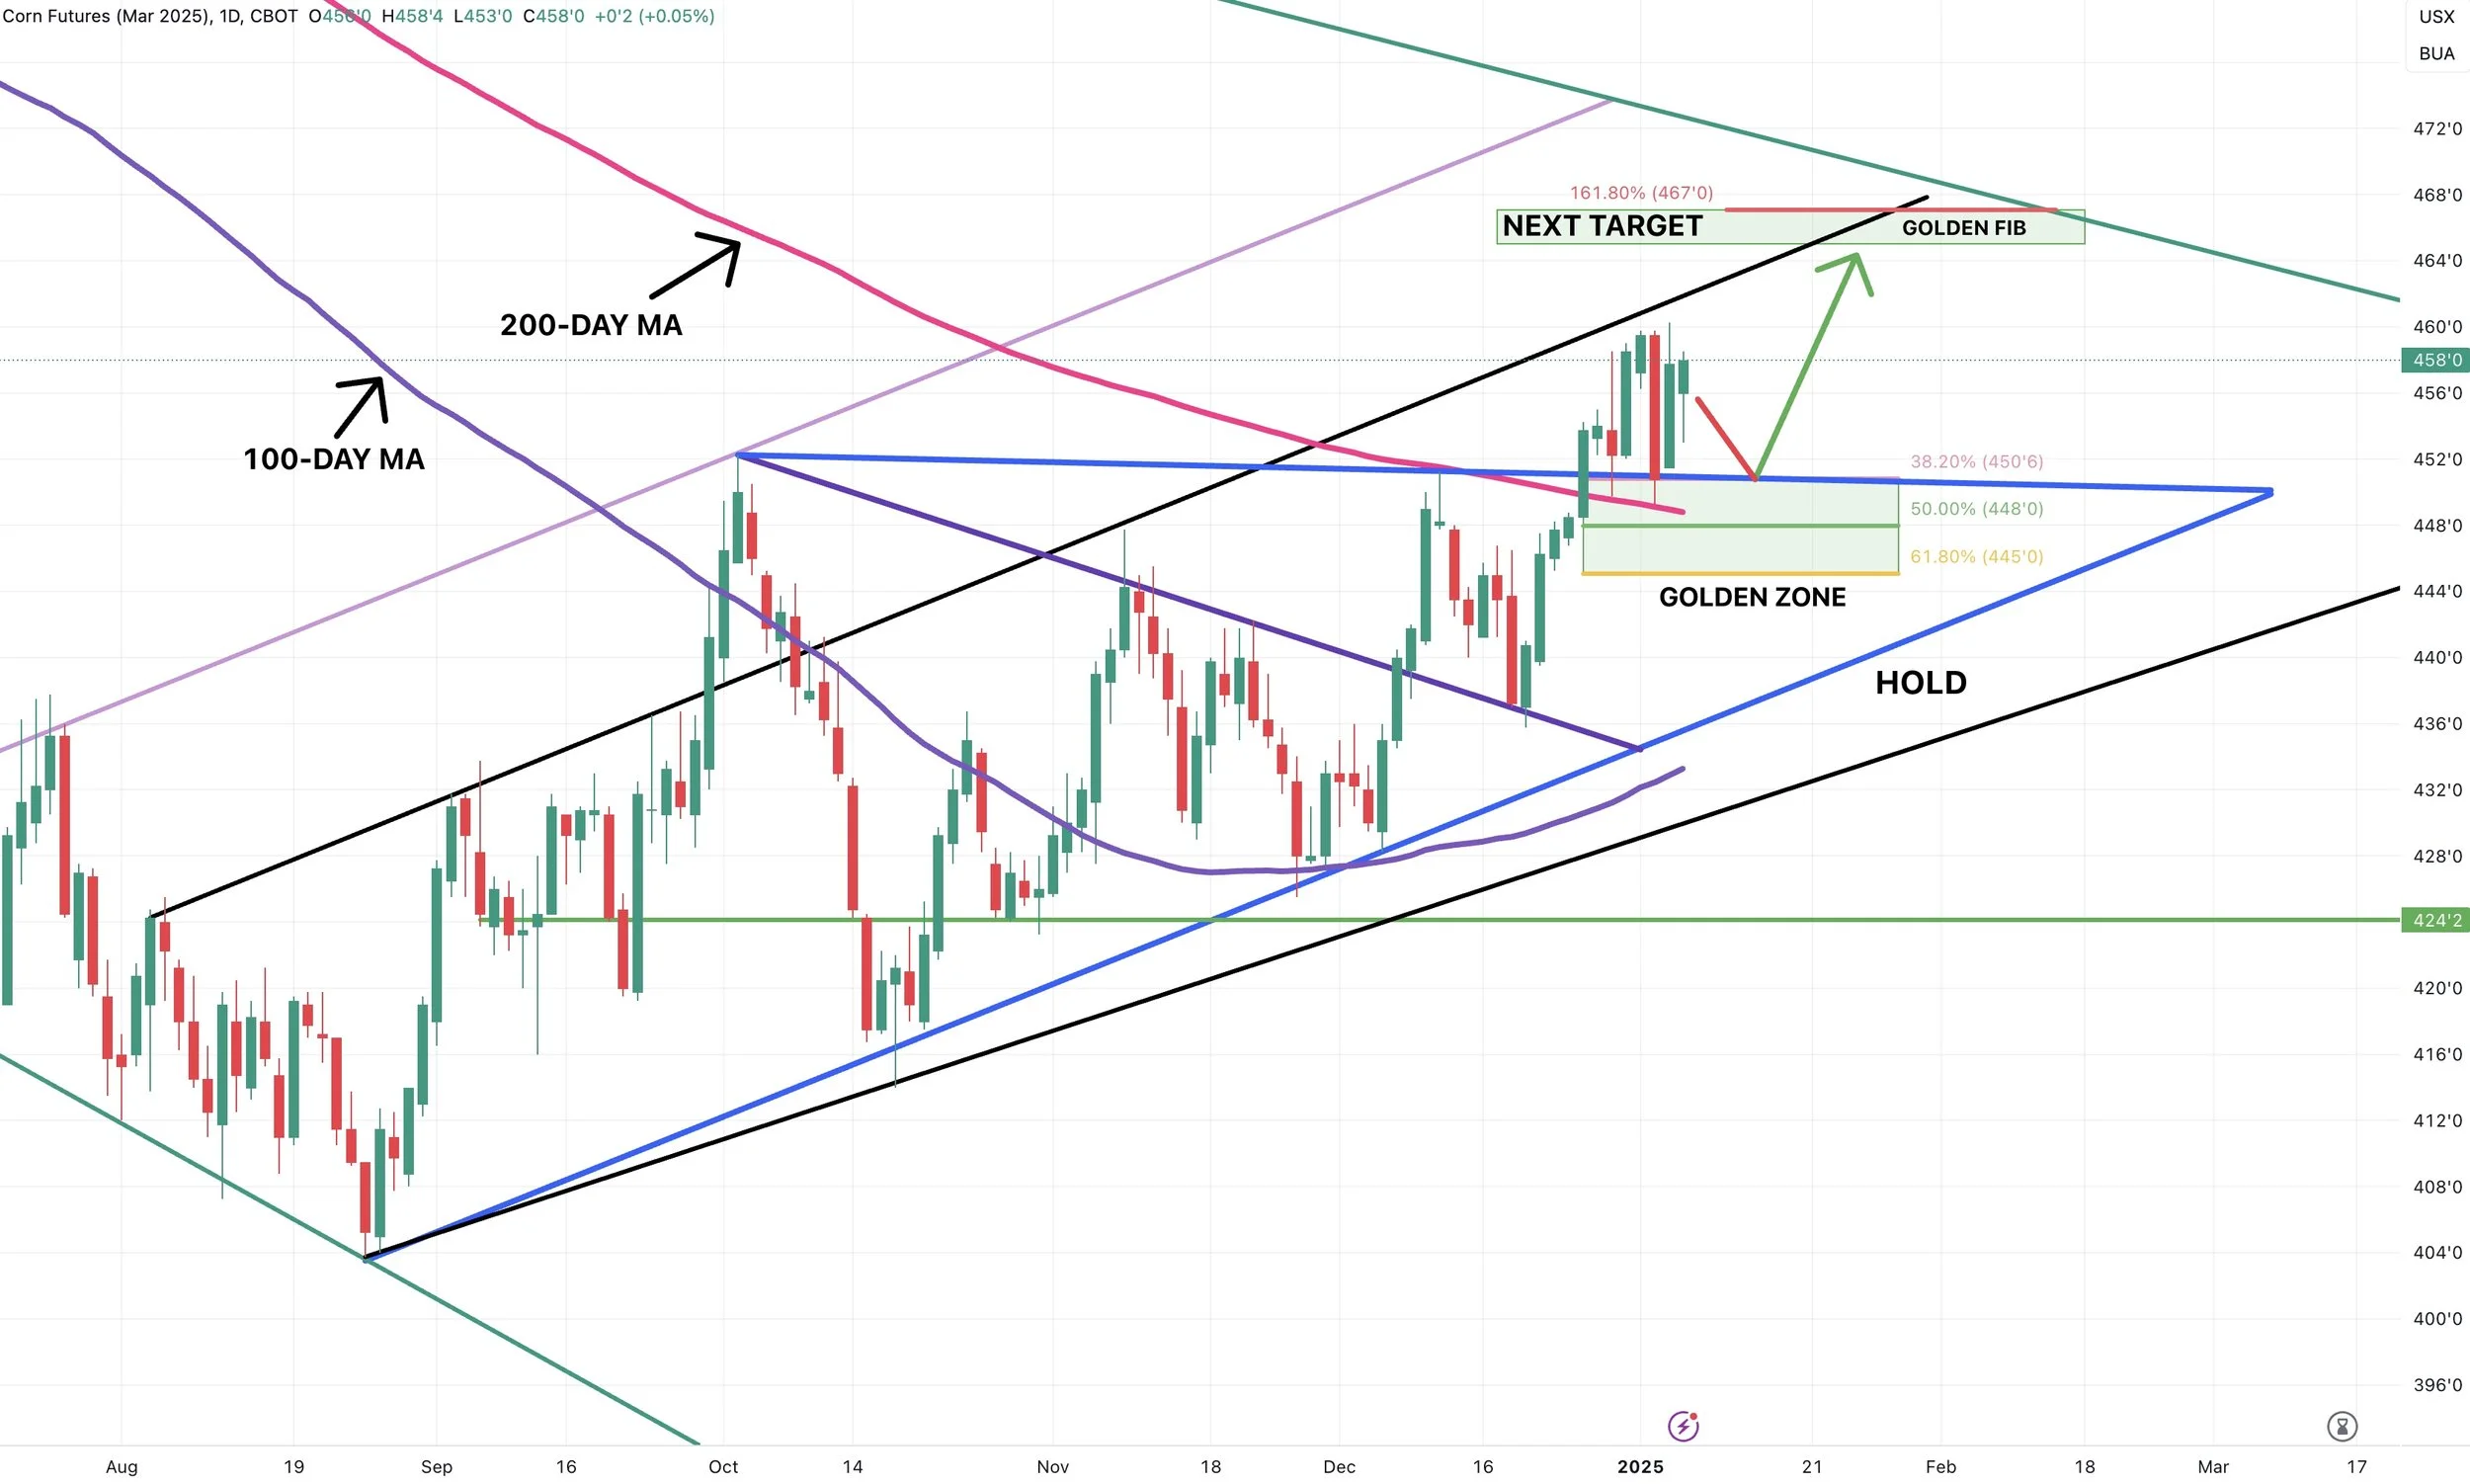
Overall my bias still leans higher for corn based on the friendly fundamentals and a bullish technical situation, but a lot will of course ride on the USDA report.
Given the spreads action I'd like to think we continue to see carryout decline but I am smart enough to outguess what the USDA will do.
Bottom line, nothing has changed. My next target for March-25 corn is still $4.67 (as our last target was $4.51)
Ideally I want to see us continue to find support at the 200-day MA but as long as we stay above that uptrend (2nd blue line) my bias leans higher.
We do not have to come all the way down to the green box but it is simply there to let you know that is where I think we bounce if we get a correction.
(If you missed Dec 11th's signal: Click Here)
Here is the significance of that 200-day MA and why I would like to see us hold us it.
It was once massive resistance, acting as a lid for corn since late 2022.
We are now trading above it for the first time then.
Hoping prior resistance will be new support.
Soybeans
The only real potentially bullish story out there is Argentina.
If they get rain within the next 2 weeks it likely doesn’t wind up being a massive issue. But if it stays dry until the end of January then we could be looking at a bigger problem.
On the bearish side of things we also have the trade war, we have the monster Brazil crop, and a world balance sheet that is the 2nd most bearish of all time.
Even without the trade war potential, the world situation is enough to spark debate about soybeans potentially being $9 or lower.
But I watched a podcast from Standard Grain this morning. He made a very interesting argument.
"Why aren’t we there already?" (talking about sub $9 beans)
Everyone knows Trump is coming into office and adding tariffs. Everyone knows the bearish world balance sheet.
He also asked if soybeans were going to sub $9 why aren’t the funds shorter than they are?
They went from short -180k contracts last year to now just short -43k. If big money thought we were going THAT LOW why wouldn’t they be shorter?
I don’t know the answer but it's an interesting thought.
5 Year Seasonal
Looking at the seasonal, there is a strong seasonal tendency for beans to fall in mid-January.
But there was also a strong seasonal to rally in December which we didn’t get.
Bottom line, no one can control the markets. But you can control your risk.
If you have something to move in the next few months, keep downside protection.
Looking at the chart, my next spot to de-risk if you want to do so is $10.24 to $10.42 (green box).
Would like to see us continue to hold this support level here. If not, there isn’t much preventing us from retesting those old lows.
Meal Chart
This has me slightly concerned about the bean market.
The funds were record short meal, they then covered 1/3 of that entire short in just a week.
Meal is now falling off again.
Rejecting perfectly off that downtrend and golden retracement zone.
This chart doesn’t look the greatest.
A break above that blue line would spark some hope in bulls.
Wheat
Absolutely zero fresh news surrounding the wheat market. It's simply that time of year.
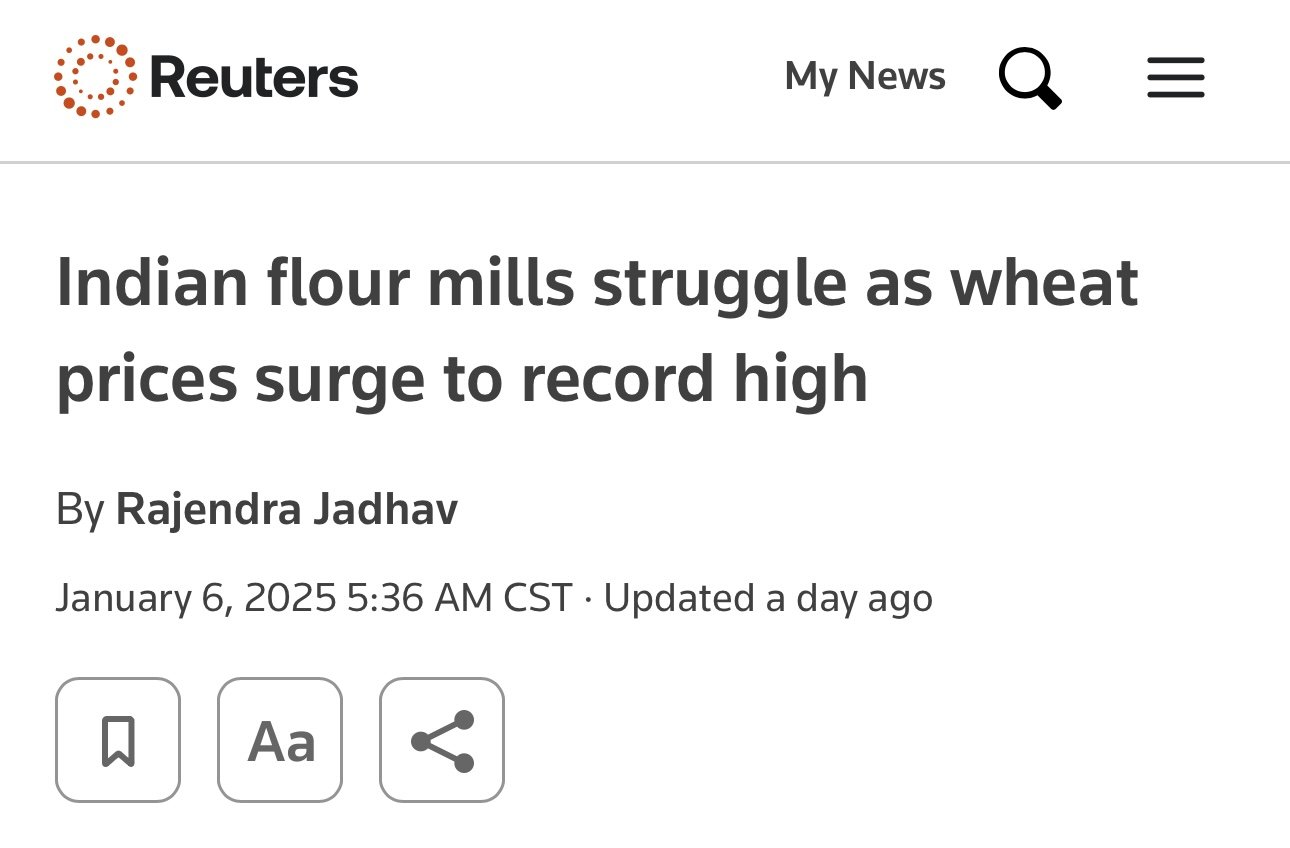
Only piece of recent new is wheat prices in India hit an all-time high which is friendly for us.
Wheat is my opinion is still very undervalued especially looking long term.
I am sorry to beat a dead horse here but there isn’t much else to say.
Why I think wheat is undervalued long term: (unchanged from last week)
Global stocks to use ratio for major exporters is the lowest since 2008
Global carry out for major exporters is the lowest since 2012
The funds are RECORD short MPLS wheat
Russia has one of their worst winter wheat crops on record. (Russia is the worlds leading wheat exporter)
Russia already started implementing price floors late last year
Prices are low. Undervalued in my opinion
Doesn’t mean we will go higher tomorrow or a month now.
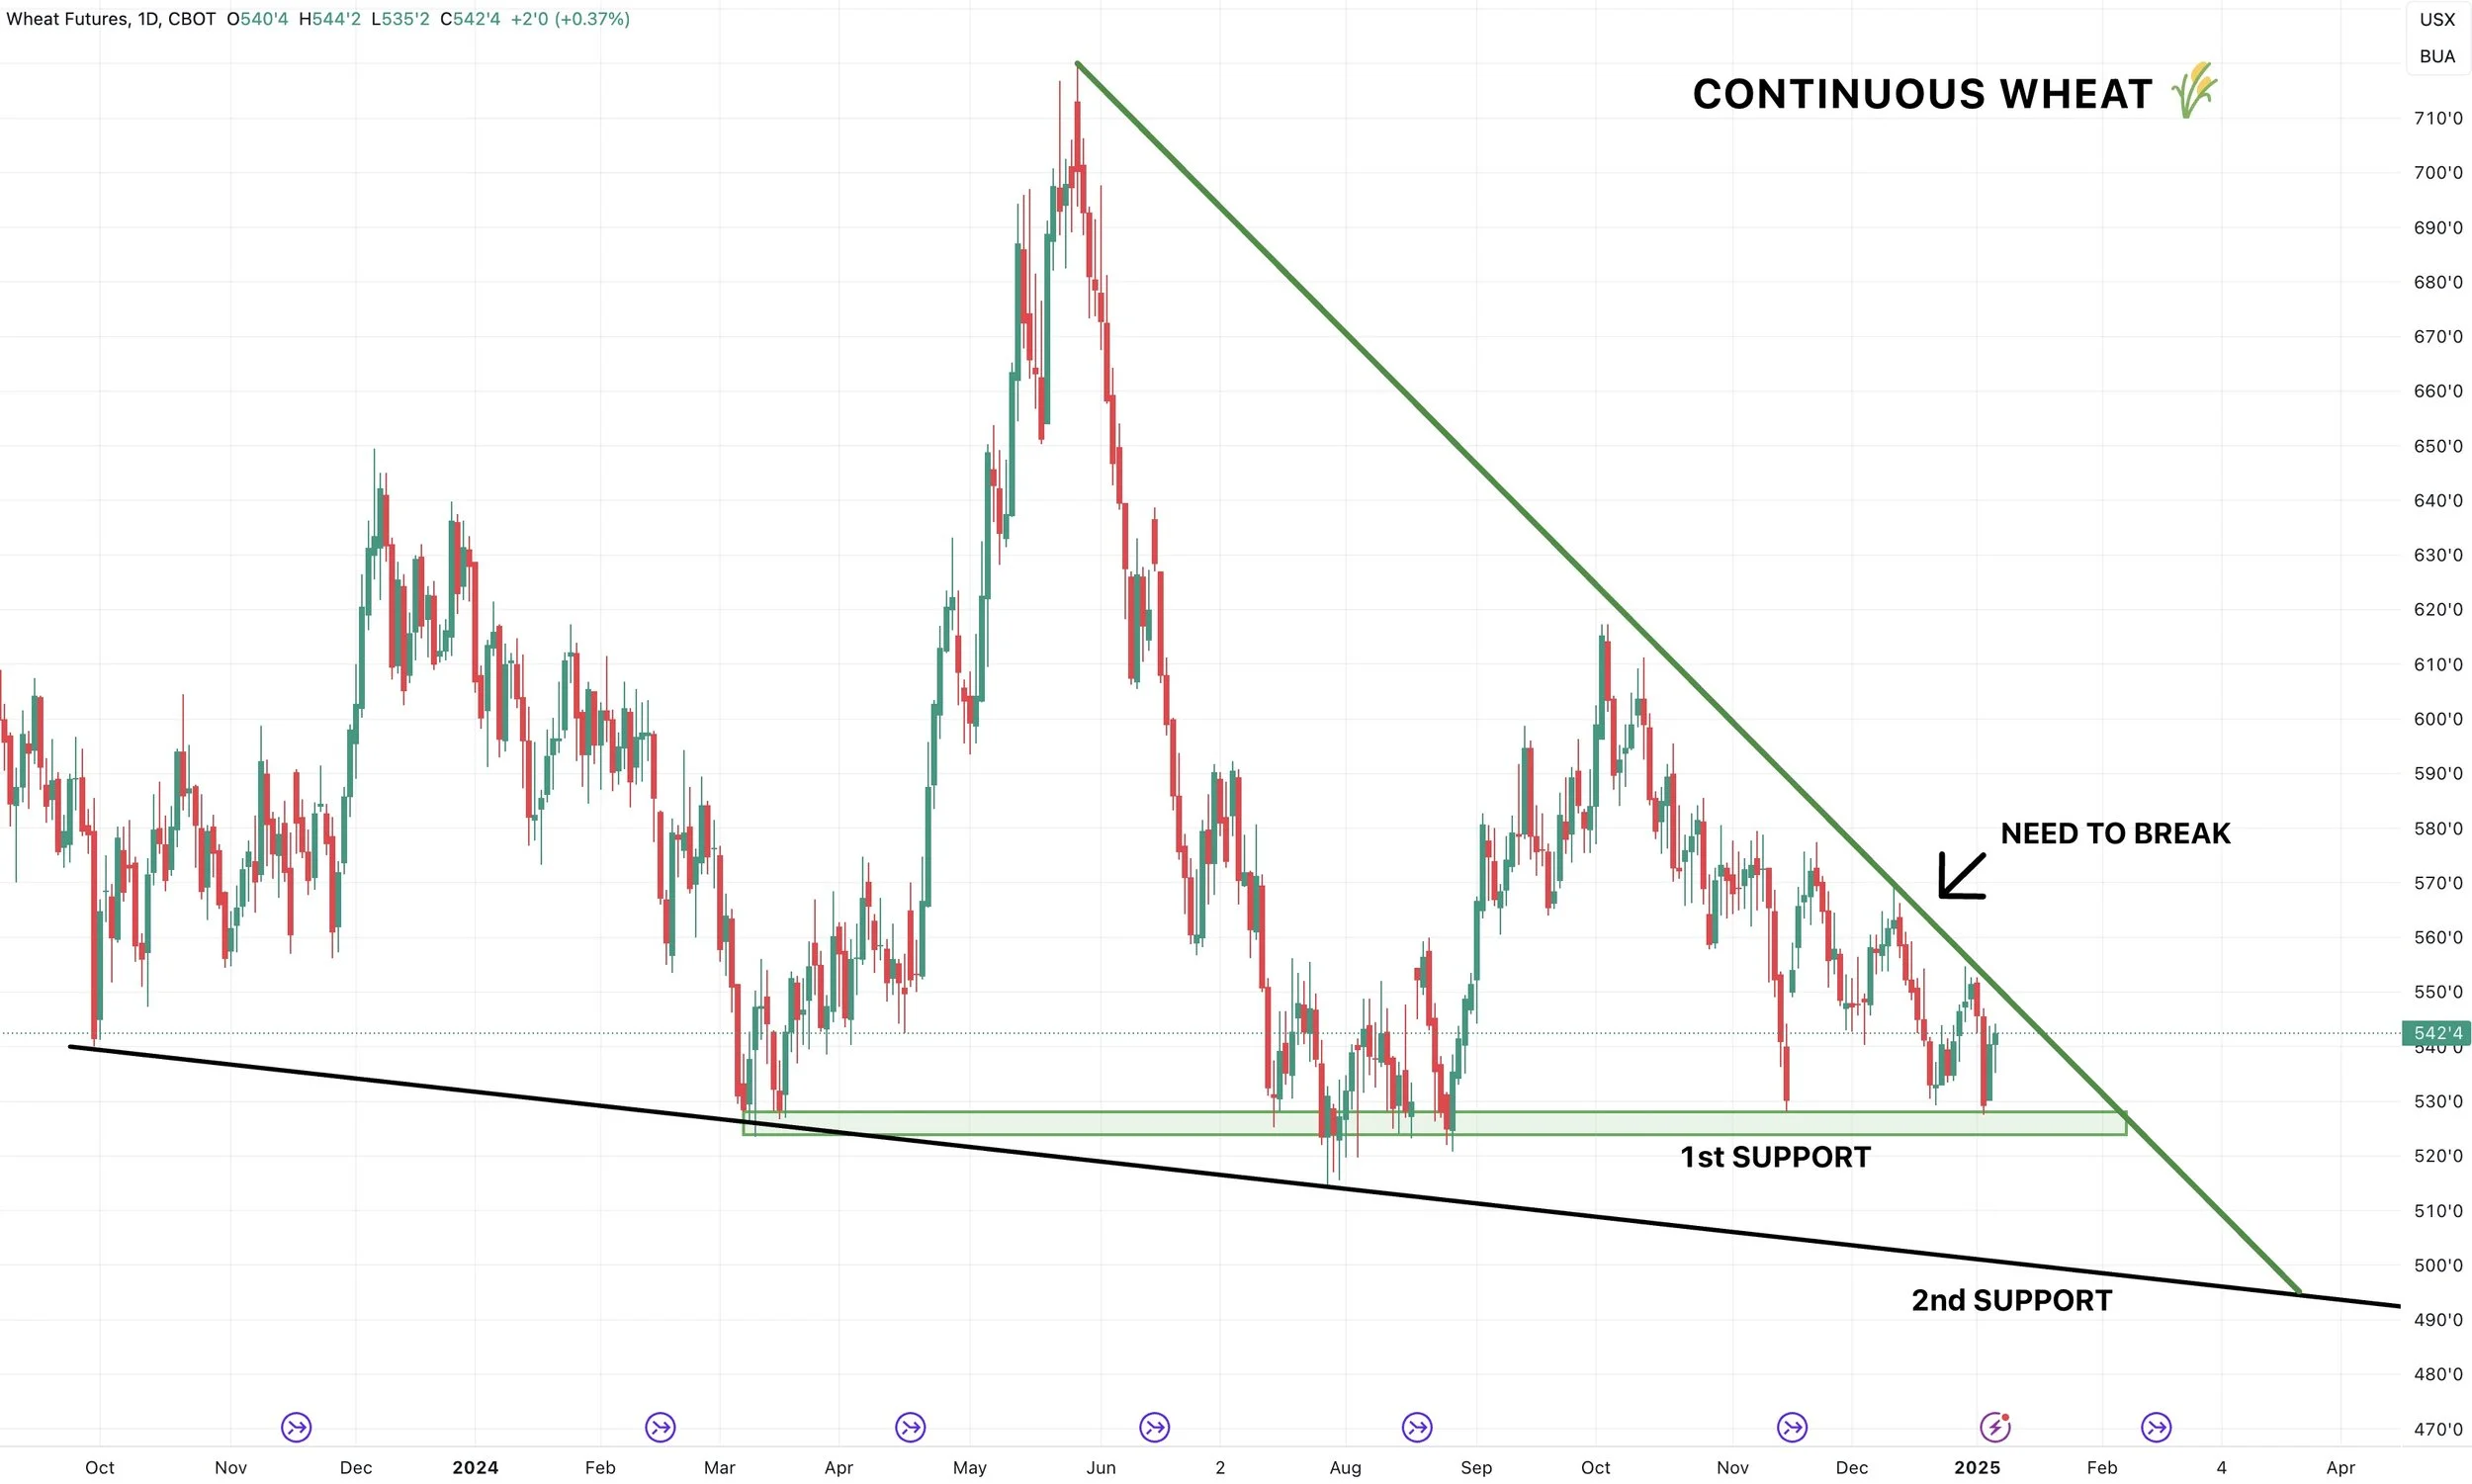
Looking at continuous wheat, we continue to find support in this support zone (green box).
Would like to see us hold this or our next stop could be the long term downward support (black line).
Bulls have been battling to break that green downward trend line since our May highs.
Breaking that would be the first step in securing a win for the bulls.
Little different pattern in March wheat.
I still think this is a possible friendly pattern (falling wedge)
Just like the continuous chart, simply waiting to break this downtrend for confirmation.
KC continues to hold it's lows.
First step for bulls is to break downward trend from November (red line).
Past Sell or Protection Signals
We recently incorporated these. Here are our past signals.
Jan 2nd: 🐮
Cattle hedge alert at new all-time highs & target.
Dec 11th: 🌽
Corn sell signal at $4.51 200-day MA
CLICK HERE TO VIEW
Oct 2nd: 🌾
Wheat sell signal at $6.12 target
Sep 30th: 🌽
Corn protection signal at $4.23-26
Sep 27th: 🌱
Soybean sell & protection signal at $10.65
Sep 13th: 🌾
Wheat sell signal at $5.98
May 22nd: 🌾
Wheat sell signal when wheat traded +$7.00
Want to Talk?
Our phones are open 24/7 for you guys if you ever need anything or want to discuss your operation.
Hedge Account
Interested in a hedge account? Use the link below to set up an account or shoot Jeremey a call at (605)295-3100.
Check Out Past Updates
1/6/25
MAJOR USDA REPORT FRIDAY
1/2/25
LONG TERM CORN UPTREND? JANUARY DROP OFF IN BEANS? LONG TERM WHEAT FACTORS
1/2/25
CATTLE HEDGE ALERT
12/31/24
MASSIVE DAY FOR GRAINS. FLOORS? 2025 SALES? GAME PLAN? CHART BREAKDOWNS
12/30/24
GRAINS FADE EARLY HIGHS
12/27/24
STILL LONG TERM UPSIDE POTENTIAL, BUT TAKE ADVANTAGE OF 6 MONTH CORN HIGH
12/26/24
CORN ABOVE 200-DAY MA. ARGY DRY. BEANS +44 CENTS OFF LOWS
12/23/24
CORN & BEANS TALE OF 2 STORIES. BEANS REJECT OLD SUPPORT
12/20/24
PERFECT BOUNCE IN CORN. SIMPLE BEAN BACKTEST BEFORE LOWER?
12/19/24
THE SOYBEAN PROBLEM. NEW WHEAT LOWS. CORN UPTREND
12/18/24
BEANS BREAK SUPPORT & OPEN FLOOD GATES
12/17/24
SINK OR SWIM TIME FOR SOYBEANS
12/16/24
SOYBEANS & WHEAT FIGHTING LOWS. WILL CORN DEMAND CONTINUE
12/13/24
POST USDA COOL OFF
12/12/24
CORN CORRECTION. WHY WE ALERTED SELL SIGNAL YESTERDAY
12/11/24
USDA PRICED IN? FAIR VALUE OF CORN? BEAN BREAKOUT?
12/11/24
CORN SELL SIGNAL
12/10/24
USDA BREAKDOWN
12/9/24
USDA TOMORROW
12/6/24
CORN TRYING TO BREAKOUT. MAKING MARKETING DECISIONS
12/5/24
OPTIMISTIC BOUNCE IN GRAINS
12/4/24
WHEAT UNDERVALUED? MOST RISK IN BEANS. HAVE A GAME PLAN
12/3/24
BEANS HOLDING DESPITE LACK OF BULLISH STORY
12/2/24
TRUMP & BRAZIL HURDLES
11/27/24
CORN SPREADS, CRUCIAL SPOT FOR BEANS, SEASONALITY SAYS BUY
11/26/24
TARIFF TALK PRESSURE
11/25/24
HOLIDAY TRADE, SEASONALS, TARGETS & DOWNSIDE RISKS
11/22/24
CORN TARGETS & CHINA CONCERNS
11/21/24
BEANS NEAR LOWS. CORN NEAR HIGHS. 2025 SALE THOUGHTS
11/19/24
WHAT’S NEXT FOR GRAINS
11/18/24
WHEAT LEADS THE GRAINS REBOUND
11/15/24
BIG BOUNCE, FUNDS LONG CORN, DOLLAR & DEMAND
11/14/24
3RD DAY OF GRAINS FALL OUT
11/13/24
GRAINS CONTINUE WEAKNESS & DOLLAR CONTINUES RALLY
11/12/24
ANOTHER POOR PERFORMANCE IN GRAINS
11/11/24
POOR ACTION IN GRAINS POST FRIENDLY USDA
11/8/24
USDA FRIENDLY BUT GRAINS WELL OFF HIGHS
11/6/24
GRAINS STORM BACK POST TRADE WAR FEAR
11/5/24
ALL ABOUT THE ELECTION & VIDEO CHART UDPATE
11/4/24
ELECTION TOMORROW
11/1/24
GRAINS WAITING ON NEWS
10/31/24
ELECTION & USDA NEXT WEEK
10/30/24
SEASONALS, CORN DEMAND, BRAZIL REAL & MORE
10/29/24
WHAT’S NEXT AFTER HARVEST?
10/25/24
POOR PRICE ACTION & SPREADS WEAKEN
10/24/24
BIG BUYERS WANT CORN?
10/23/24
6TH STRAIGHT DAY OF CORN SALES
10/22/24
STRONG DEMAND & TECHNICAL BUYING FOR GRAINS
10/21/24
SPREADS, BASIS CONTRACTS, STRONG CORN, BIG SALES
10/18/24
BEANS & WHEAT HAMMERED
10/17/24
OPTIMISTIC PRICE ACTION IN GRAINS
10/16/24
BEANS CONTINUE DOWNFALL. CORN & WHEAT FIND SUPPORT
10/15/24
MORE PAIN FOR GRAINS
10/14/24
GRAINS SMACKED. BEANS BREAK $10.00
10/10/24
USDA TOMORROW
10/9/24
MARKETING STYLES, USDA RISK, & FEED NEEDS
10/8/24
BEANS FALL APART
10/7/24
FLOORS, RISKS, & POTENTIAL UPSIDE
10/4/24
HEDGE PRESSURE
10/3/24
GRAINS TAKE A STEP BACK
10/2/24
CORN & WHEAT CONTINUE RUN
10/1/24
CORN & WHEAT POST MULTI-MONTH HIGHS
9/30/24


