
FIRST NOTICE DAY PRESSURE & CROP TOUR RECAP

Overview
New lows in both corn & wheat, as both post contract lows. With Sep wheat breaking below $5.00 while soybeans bounce +20 cents off their early lows, closing up +8 after being down -13 cents.
The market does not care about the crop tour. If they did, corn would’ve traded higher and beans would’ve traded lower but the exact opposite happened. As the crop tour was somewhat friendly for corn with a 181 bpa yield & very bearish for soybeans as the tour sees a near 55 bpa yield for beans.
Why were corn & wheat lower?
First notice day.
As we have a lot of supply that needs to be sold. As farmers have to decide to price or roll their basis contracts. You see first notice day pressure the markets nearly everytime in a carry market. First notice day selling makes it very hard for those markets to rally.
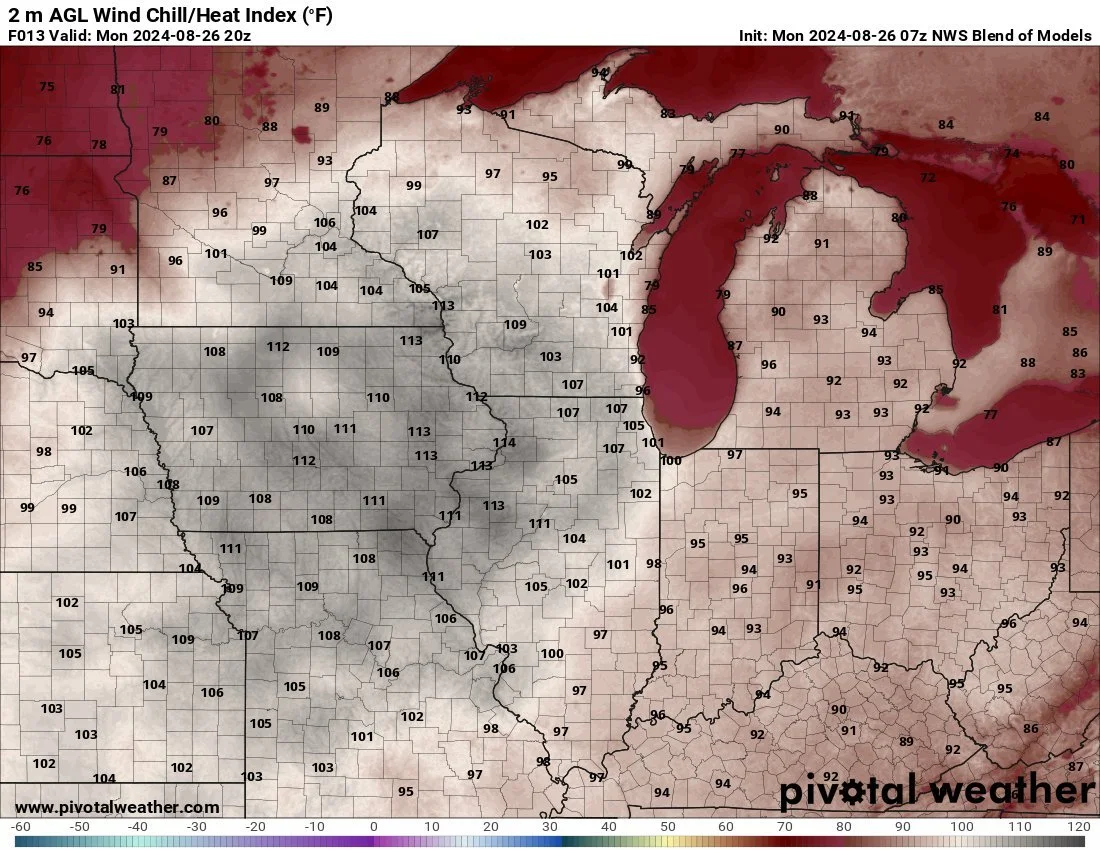
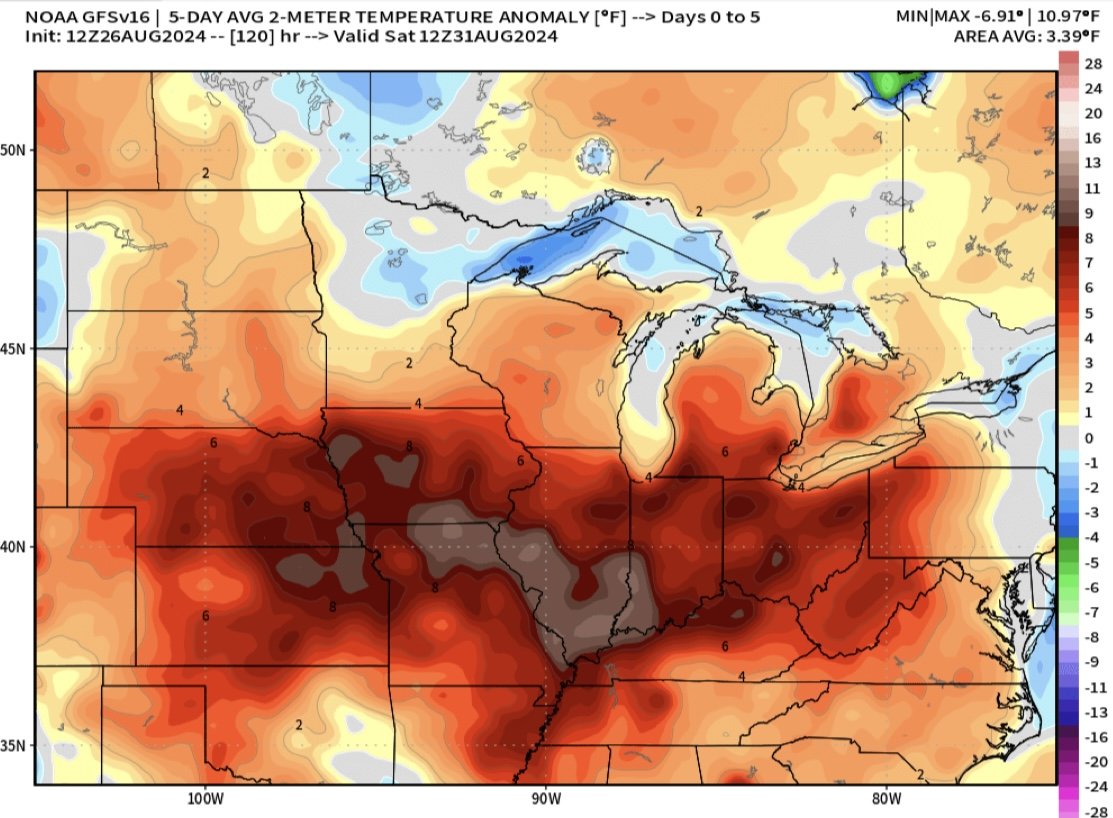
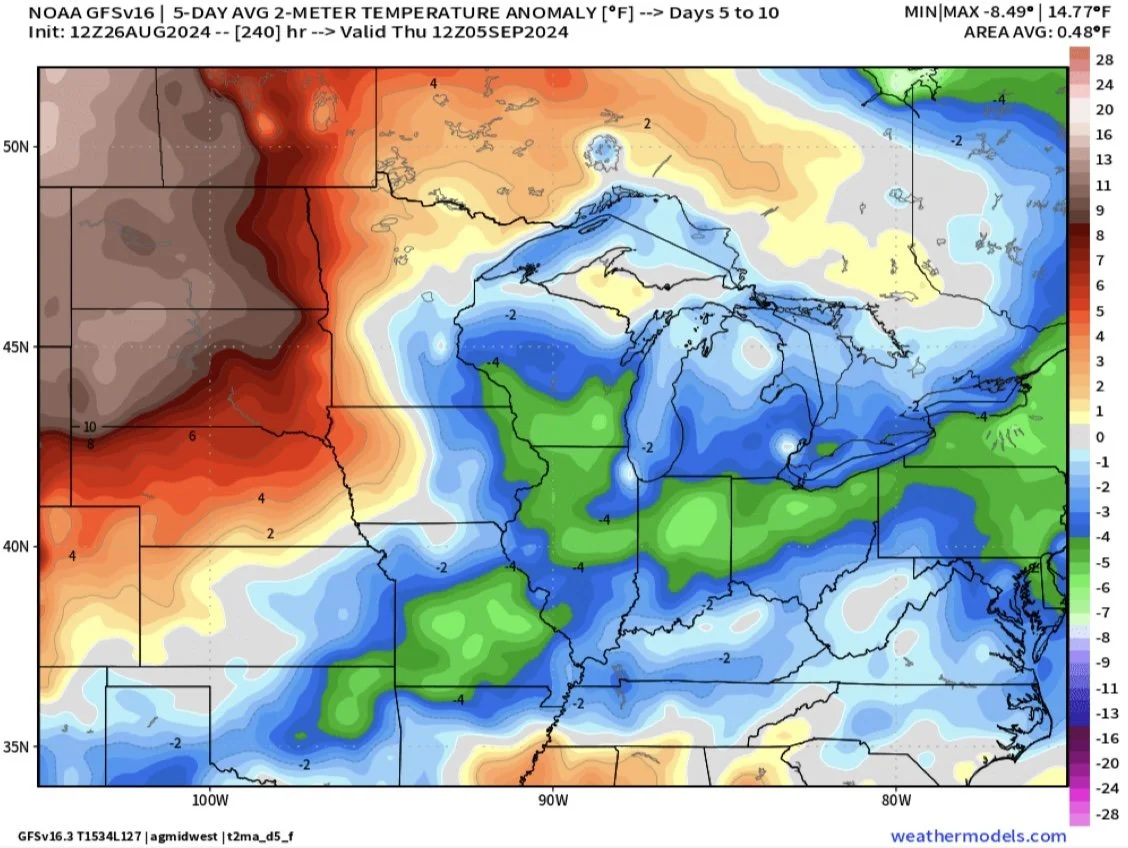
Soybeans saw some support from the weather, as it looks to be brutally hot for a few days this week across the corn belt and will continue until this weekend. Might take a little off the top of the crop but it looks to cool down this weekend.
With the late season weather, StoneX lowered their corn yield by -1.5 bpa to 183.1 bpa but only dropped their bean number by -0.2 to 53.8 bpa.
Quote from an Illinois Farmer:
"This will be the worst finish for crops since 2012. I haven’t seen corn turn this early since that year. It will ding kernel size & prevent really high TW. Pod count is higher on beans but bean size will be very small. Still 178 on corn but beans maybe 51-52."
Todays Heat Index
Temp Days 1-5
Days 6-10
Crop Tour Recap
Pro Farmer National Yield:
Corn: 181.1
Beans: 54.9
Current USDA Yield:
Corn: 183.1
Beans: 53.2
The tours' national yield estimates are not just some math equation where they use the numbers from their state by state tours. They use a bunch of different factors such as maturity, acre changes, areas they didn’t tour, and take into account their historical difference vs the USDA.
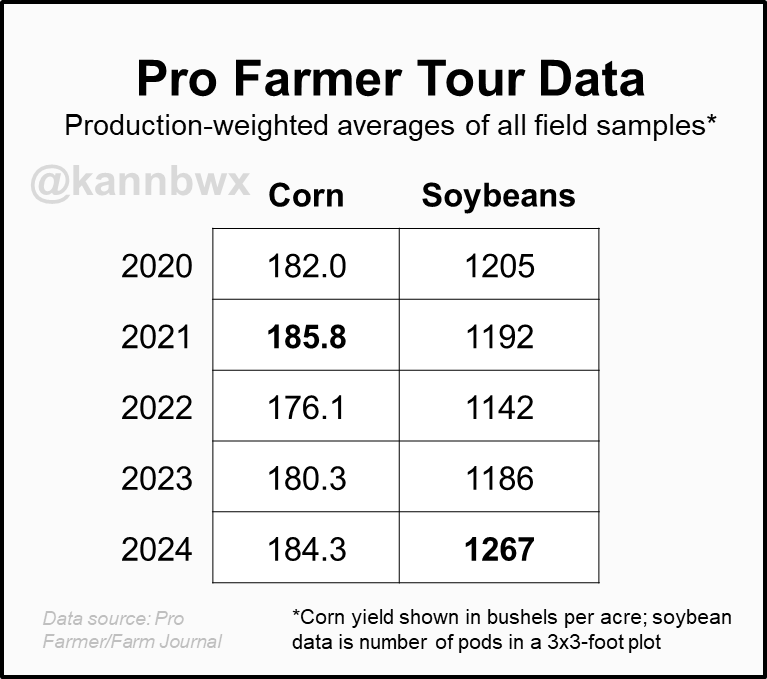
For the actual weighted average of their findings they had 184.3 fro corn. Which is bigger than the actual estimate they came up with. For example last year their weighted average from the findings were 180.3 while their actual estimate was 172.
So they see corn slightly smaller than USDA, while they see this bean crop being a monster one.
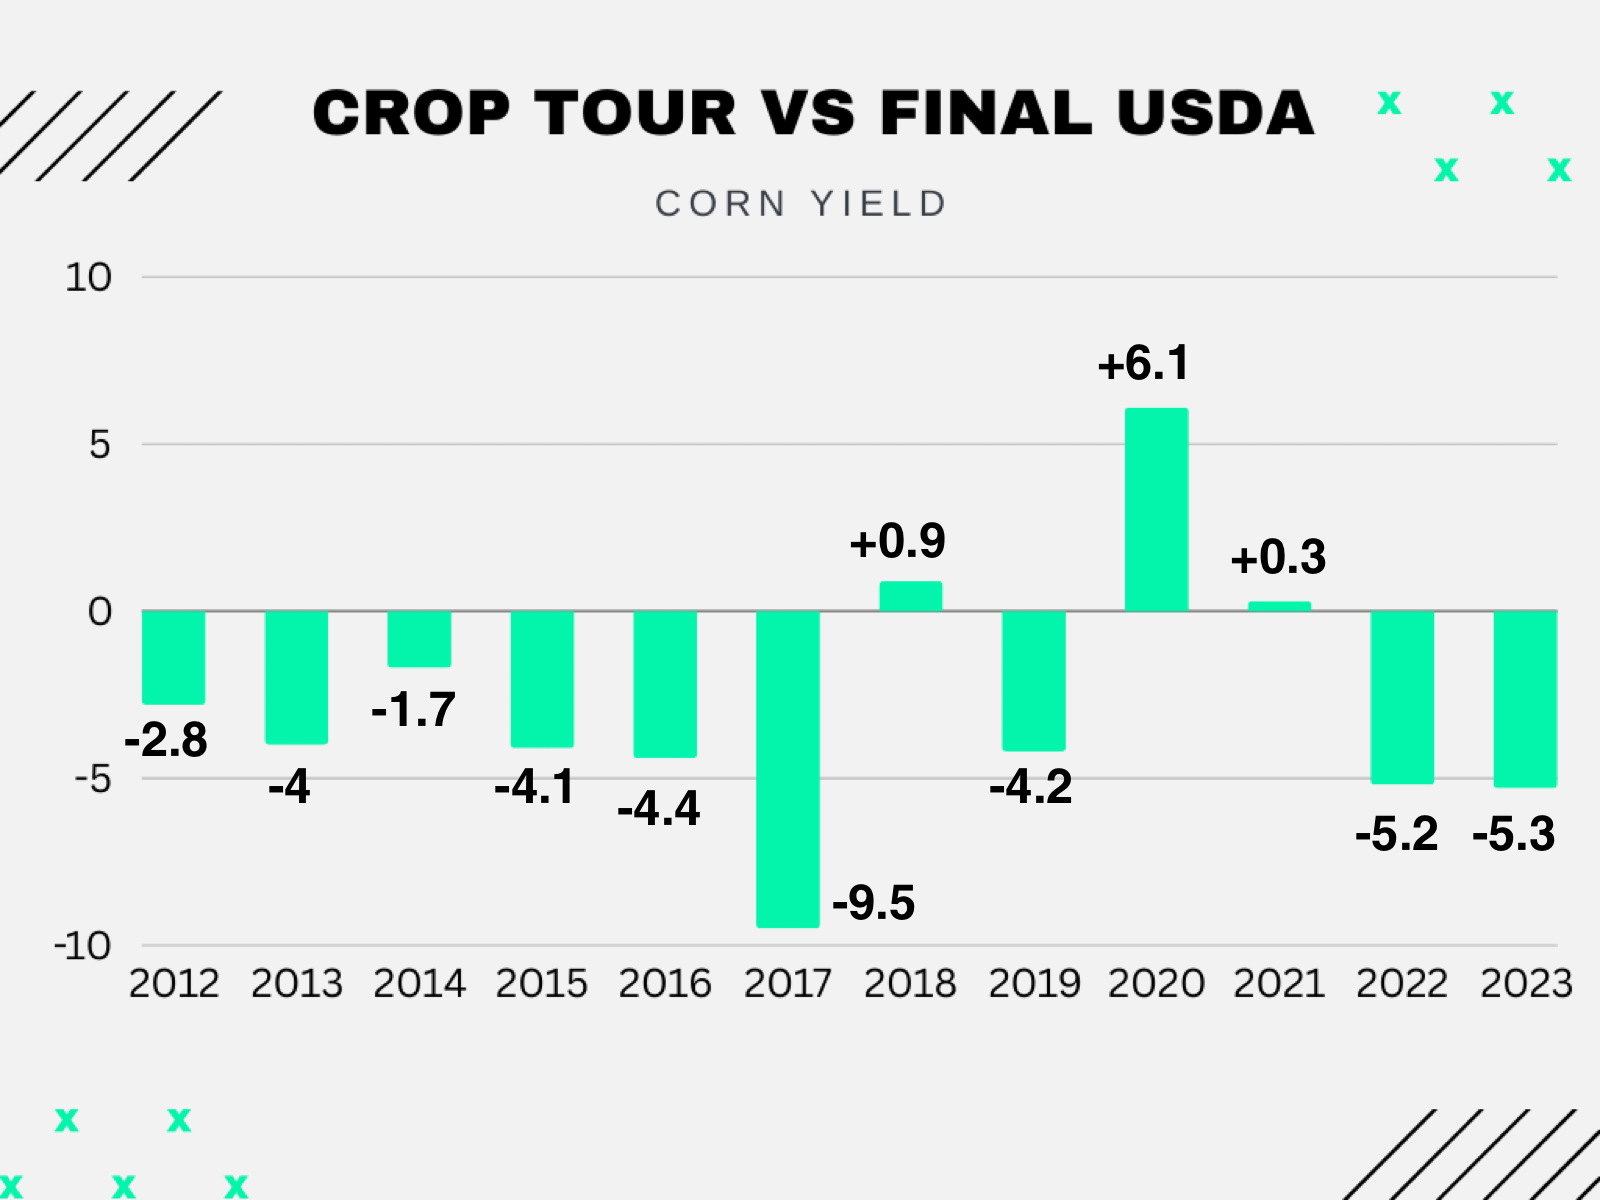
However, let's take a look at the year over year change comparisons rather than the actual yield numbers. The crop tour vs the USDA are always off by a lot. So it makes more sense to gauge just how big or small each of them see the crops growing from last year.
First for corn:
Iowa
USDA: 209 vs 201 (+4%)
Crop Tour: 192.8 vs 182.8 (+5.5%)
Minnesota
USDA: 185 vs 185 (+/-0%)
Crop Tour: 164.9 vs 181.3 (-9%)
Illinois
USDA: 225 vs 206 (+9.2%)
Crop Tour: 204.1 vs 193.7 (+5.4%)
Indiana
USDA: 207 vs 203 (+2%)
Crop Tour: 187.5 vs 180.9 (+3.65%)
Nebraska
USDA: 194 vs 182 (+6.6%)
Crop Tour: 173.25 vs 167.2 (+3.6%)
Ohio
USDA: 188 vs 198 (-5%)
Crop Tour: 183.29 vs 183.94 (-0.35%)
South Dakota
USDA: 162 vs 152 (+6.6%)
Crop Tour: 156.5 vs 157.4 (-0.55%)
National
USDA: 183 vs 177 (+3.4%)
7 State Crop Tour Weighted Avg: 184.3 vs 180.3 (2.17%)
Pro Farmer Guess: 181.1 vs 172 (+4.9%)
So from their findings the only states they see making a bigger jump from last year compared to the USDA are: Iowa, Indiana, & Ohio.
While they see Minnesota, Illinois, Nebraska, & South Dakota all not getting as big year over year compared to the USDA.
Their weighted average sees a smaller increase compared to the USDA, but their actual estimate they came up with is a bigger increase than the USDA had.
Interestingly though, the crop tour usually underestimates this crop on their yield estimate which was 181 this year.
Here are the bean comparisons.
I used USDA yield change while using the crop tour pod count change as the tour uses pod count not yield.
Iowa
USDA: 61 vs 58 (4.9%)
Crop Tour: 1,312 vs 1,190 (+9.3%)
Minnesota
USDA: 49 vs 48 (+2%)
Crop Tour: 1,037 vs 985 (+5%)
Illinois
USDA: 66 vs 63 (+4.5%)
Crop Tour: 1,419 vs 1,271 (+10.4%)
Indiana
USDA:62 vs 61 (+1.6%)
Crop Tour: 1,409 vs 1,310 (+7.6%)
Nebraska
USDA: 59 vs 51.5 (+12.7%)
Crop Tour: 1,172 vs 1,160 (+1%)
Ohio
USDA: 59 vs 58 (+1.7%)
Crop Tour: 1,230 vs 1,253 (+1.87%)
South Dakota
USDA: 47 vs 44 (+6%)
Crop Tour: 1,026 vs 1,013 (+1.3%)
National
USDA: 52.5 vs 50.6 (+3.6%)
7 State Crop Tour Pod Count Weighted Avg: 1,267 vs 1,186 (+6.4%)
So the crop tours sees nearly every state getting bigger year over year compared to the USDA. The only ones they see not getting quite as big comparatively are South Dakota and Nebraska. So overall the tour is expecting quiet a bit bigger bean crop.
Today's Main Takeaways
Corn
New lows in corn today.
After market close, crop conditions dropped -2% to 65% G/E which is friendly, the trade was expecting just -1% decrease.
Let's take a look at the potential balance sheet situation.
For these estimates demand will remain unchanged.
Currently USDA has a 181 yield, +6 bpa over last years record 177.
We are going to have an amazing crop. No doubt. I would be shocked if we don’t have a record.
But the interesting question is: What if we have a record yield but not by this massive amount? What if yield is closer to 180 rather than 183?
With the current demand estimates, a 180 yield would give us a sub 2 billion bushel carryout. A -10% drop from today.


This is not a "bull market" number, but keep in mind there was plenty of talk about a 2.5 billion bushel carryout not long ago.
The market does not have a 177-180 yield priced in at all. If we wind up closer to 180 or last year with all of the small problems we had such as wet planting, excessive rain etc. it could catch the market off guard later.
Now this will not rally us today. Or tomorrow. Probably not even a month from now.
But along with this possibility, these lower prices are creating that much more demand. Which is what this market needs if we want to go higher.
Of course, if this crop is 185 we are going to have some problems. But the point is, even if yield is still a record, but not by this massive amount our balance sheet does not look that awful.
Long term I am optimistic demand will lead us higher. Short term I am very cautious.
Short term this corn market is going to be faced with a TON of supply hitting the market. Which is going to make a huge rally very hard until we get through a chunk of harvest likely. Because we have all of this old crop corn sitting out there still, then we have a record crop also entering the market.
China currently has zero new crop book of sales so far. China is one of the only things that can be a big market mover out of nowhere outside of a potential South America problem.
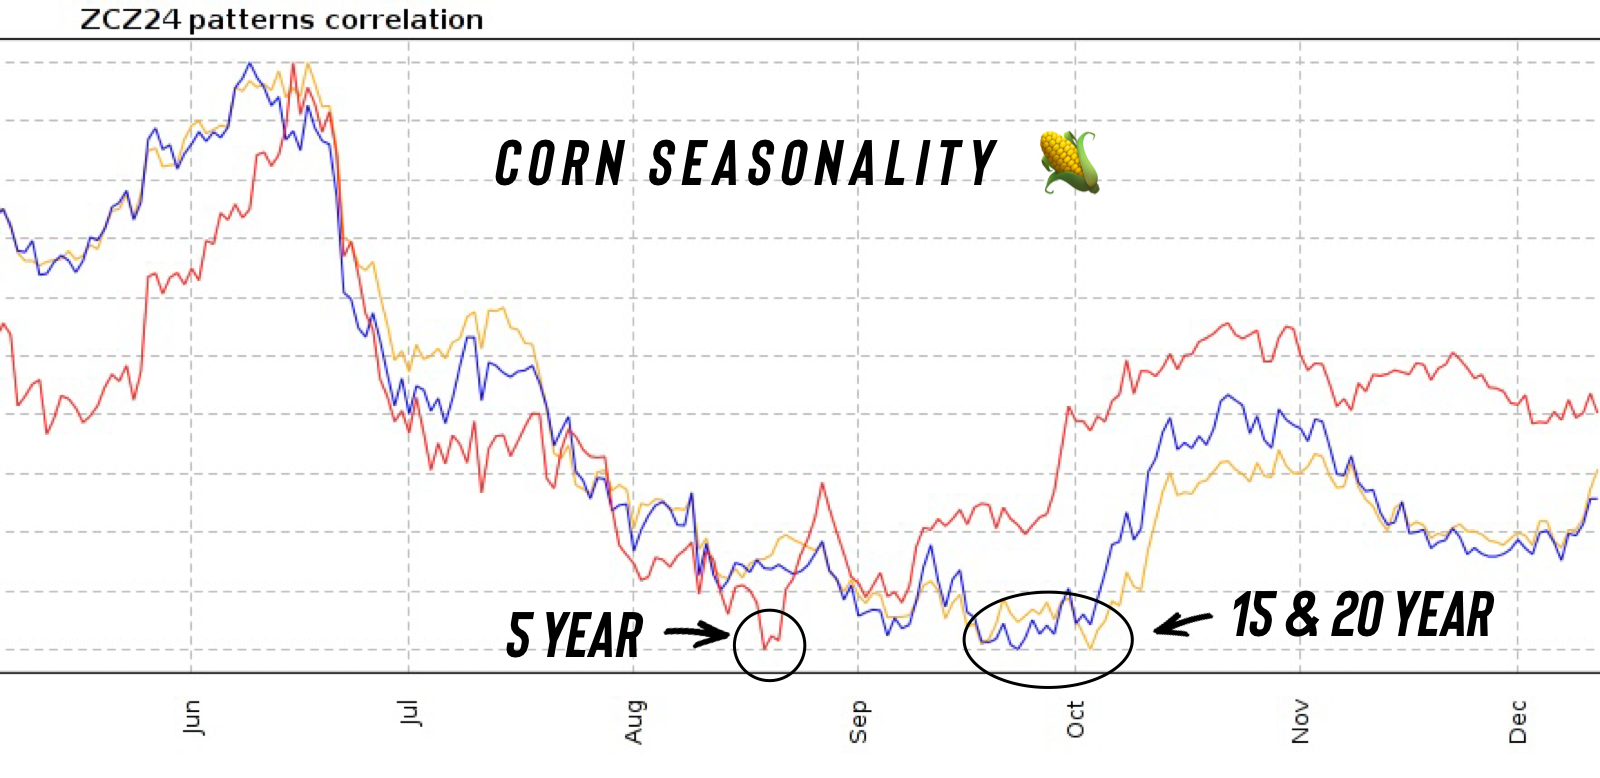
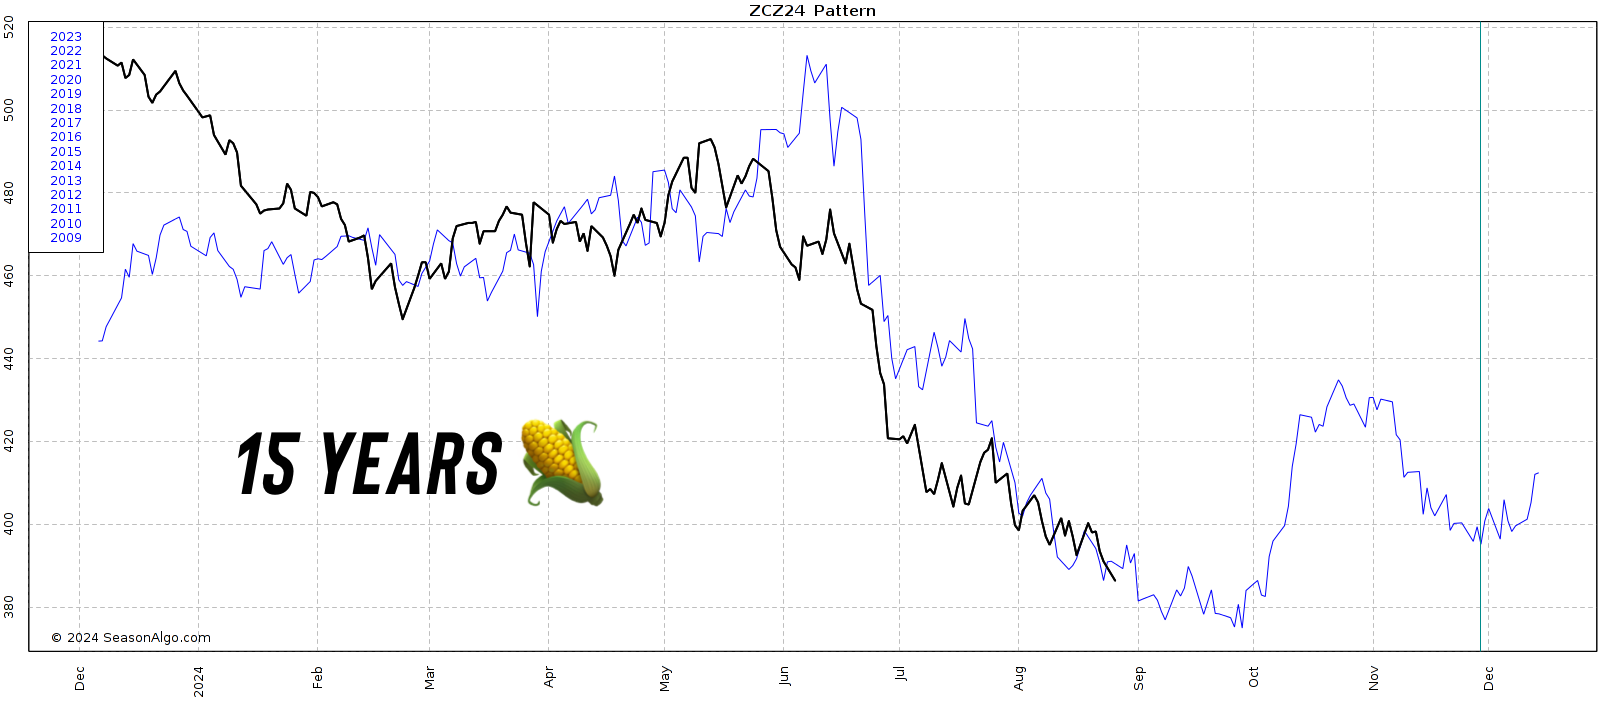
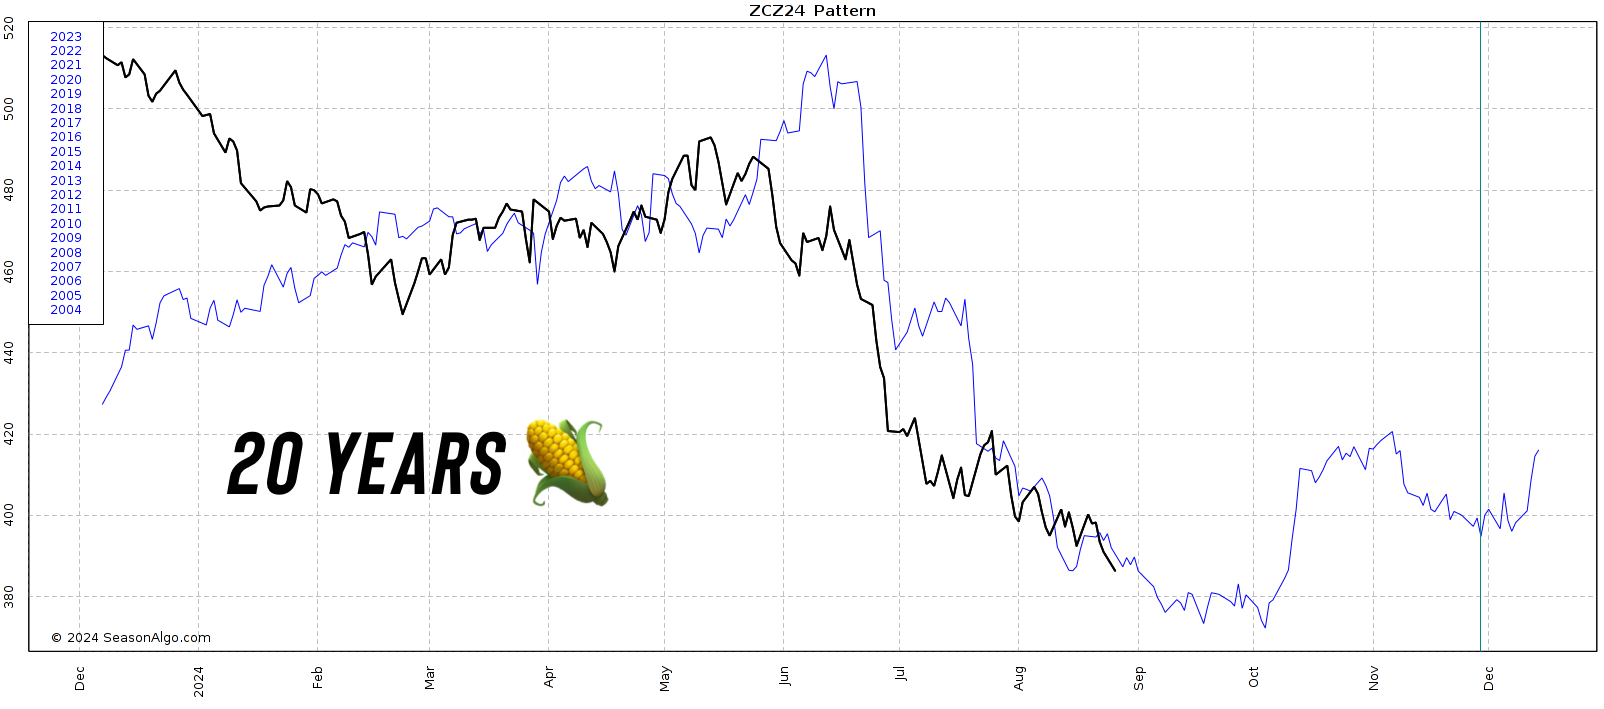
Corn Seasonality:
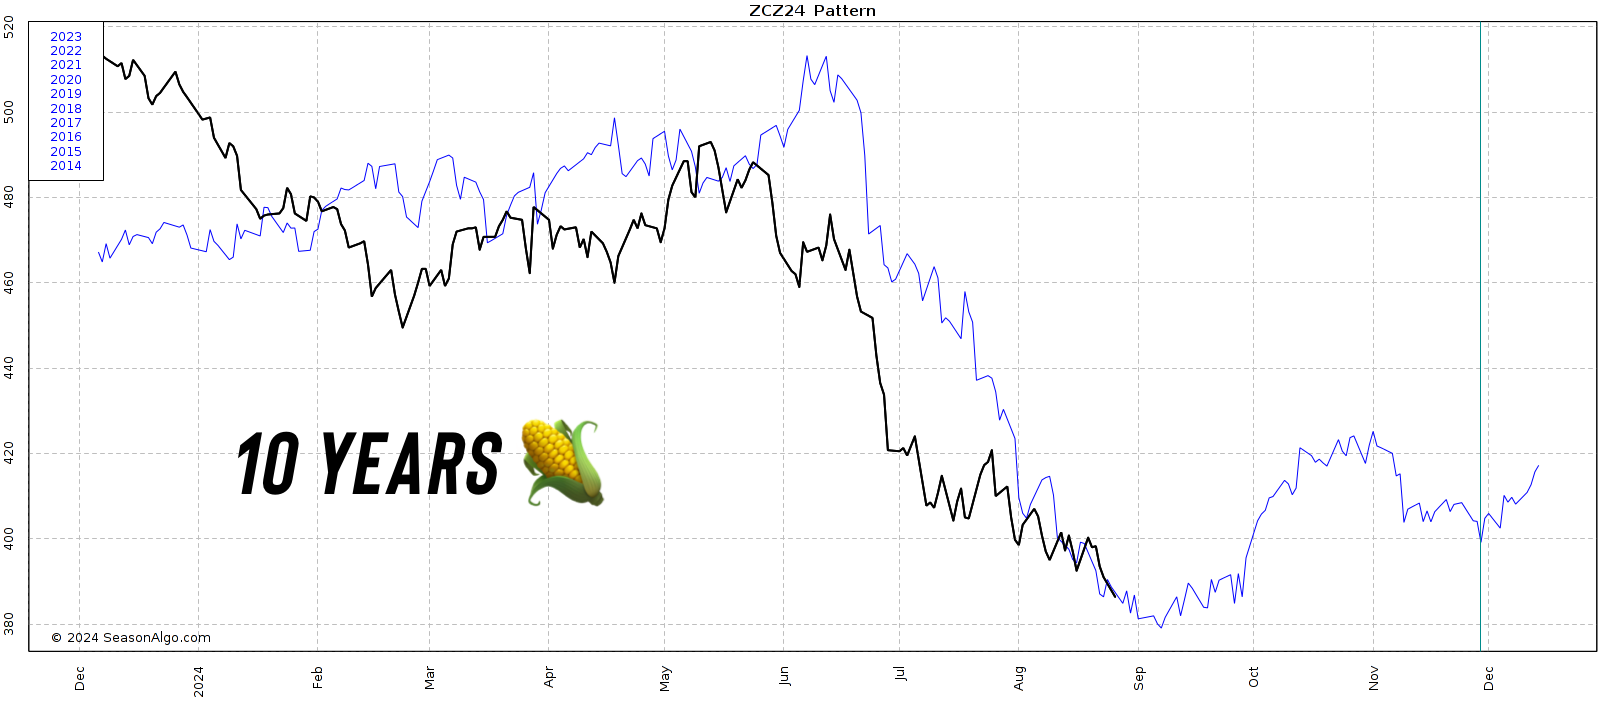
When looking at seasonals, corn typically does not bottom until a good chunk of harvest is out of the way. A key date people like to use for a bottom is October 1st.
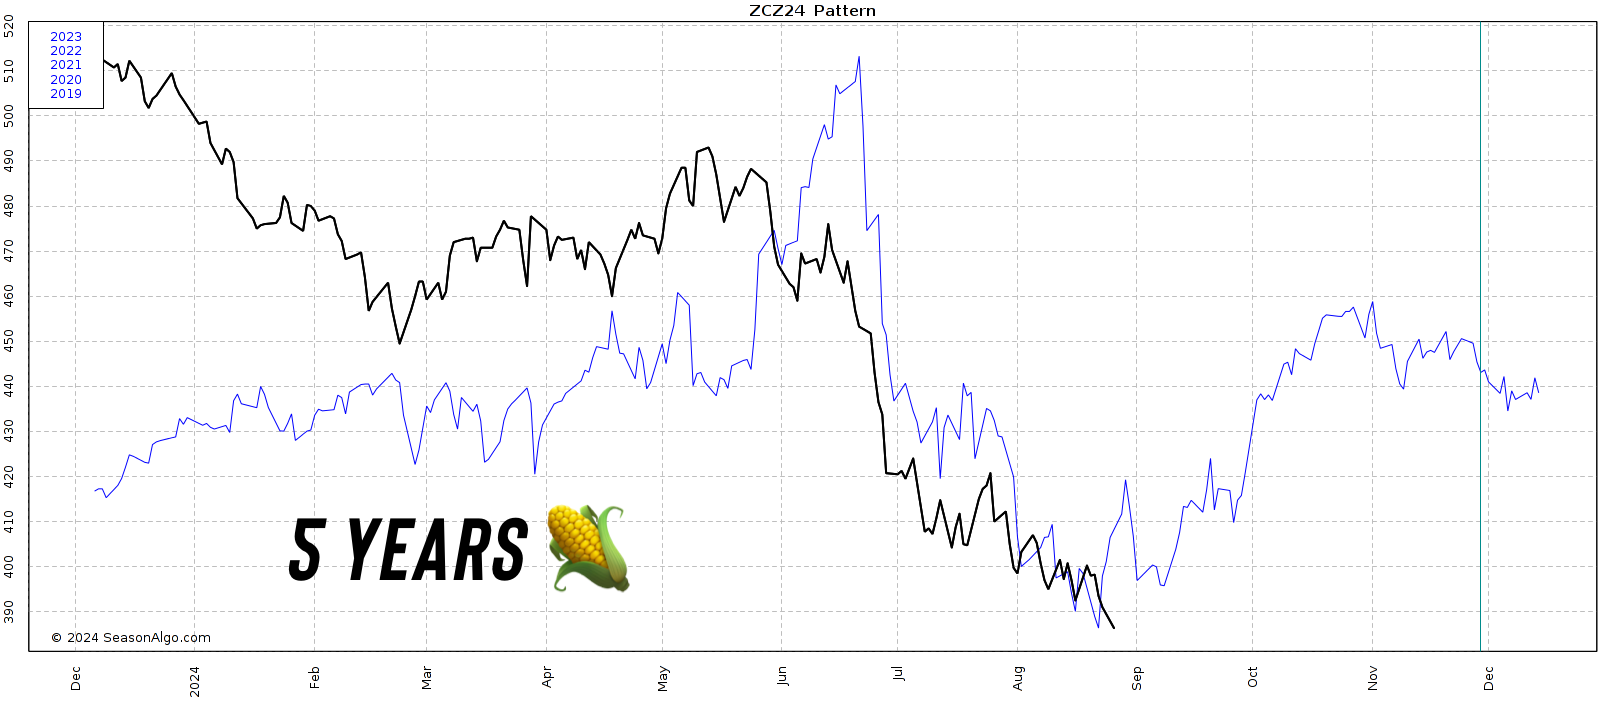
However, the past 5 years have been different than previous years. The past 5 years on average we have bounced right about now.
With all the supply that will hit the markets soon, I see a big rally being hard short term. But that doesn’t necessarily mean we can’t find a bottom.
Once we get past first notice day, maybe this market can try to find some footing. First notice day can often mark bottoms. That is what happened back in February.
Looking at the chart, we took out the $3.90 key support.
My downside target is still $3.80 as it has been for months.
Looking to the upside, if we claw above $4.09 I'd feel somewhat comfortable saying perhaps we found a bottom. But to be certain the bottom is in, I still need $4.23-26.
For Old Crop:
Not doing anything for new crop here. If you are still sitting on old crop you have a few choices. Either just be done with it if you're okay with the final average price you'll have, or sell it and re-own it on the board with calls. If you can store it, you can capture the carry by hedging vs a higher-priced deferred contract as we still have a massive carry. But you have to decide if the carry will be enough to offset storage costs. If you have basis contracts, you could maybe liquidate the whole thing and grab calls instead. But it might be better to wait until after the Sep USDA report for calls given you will be fighting the carry in the market. Every situation is different, so give us a call if you have questions. Not everyone should be doing the same thing. (605)295-3100.
Daily Dec Corn

Soybeans
Soybeans higher despite all the bearish talk about this monster crop with the crop tour releasing a massive yield after the market closed on Friday.
Initially this had soybeans down -13 cents but we rallied back. Unlike corn & wheat, we actually held the recent contract lows.
From John Payne:
Why we were higher: "We have buyers interested in locking in margin. Crush margin is really good. Chinese are buyers this time of year. We don't have the carry & supply left over from last summer like corn & wheat. So beans have a relatively tighter balance sheet."
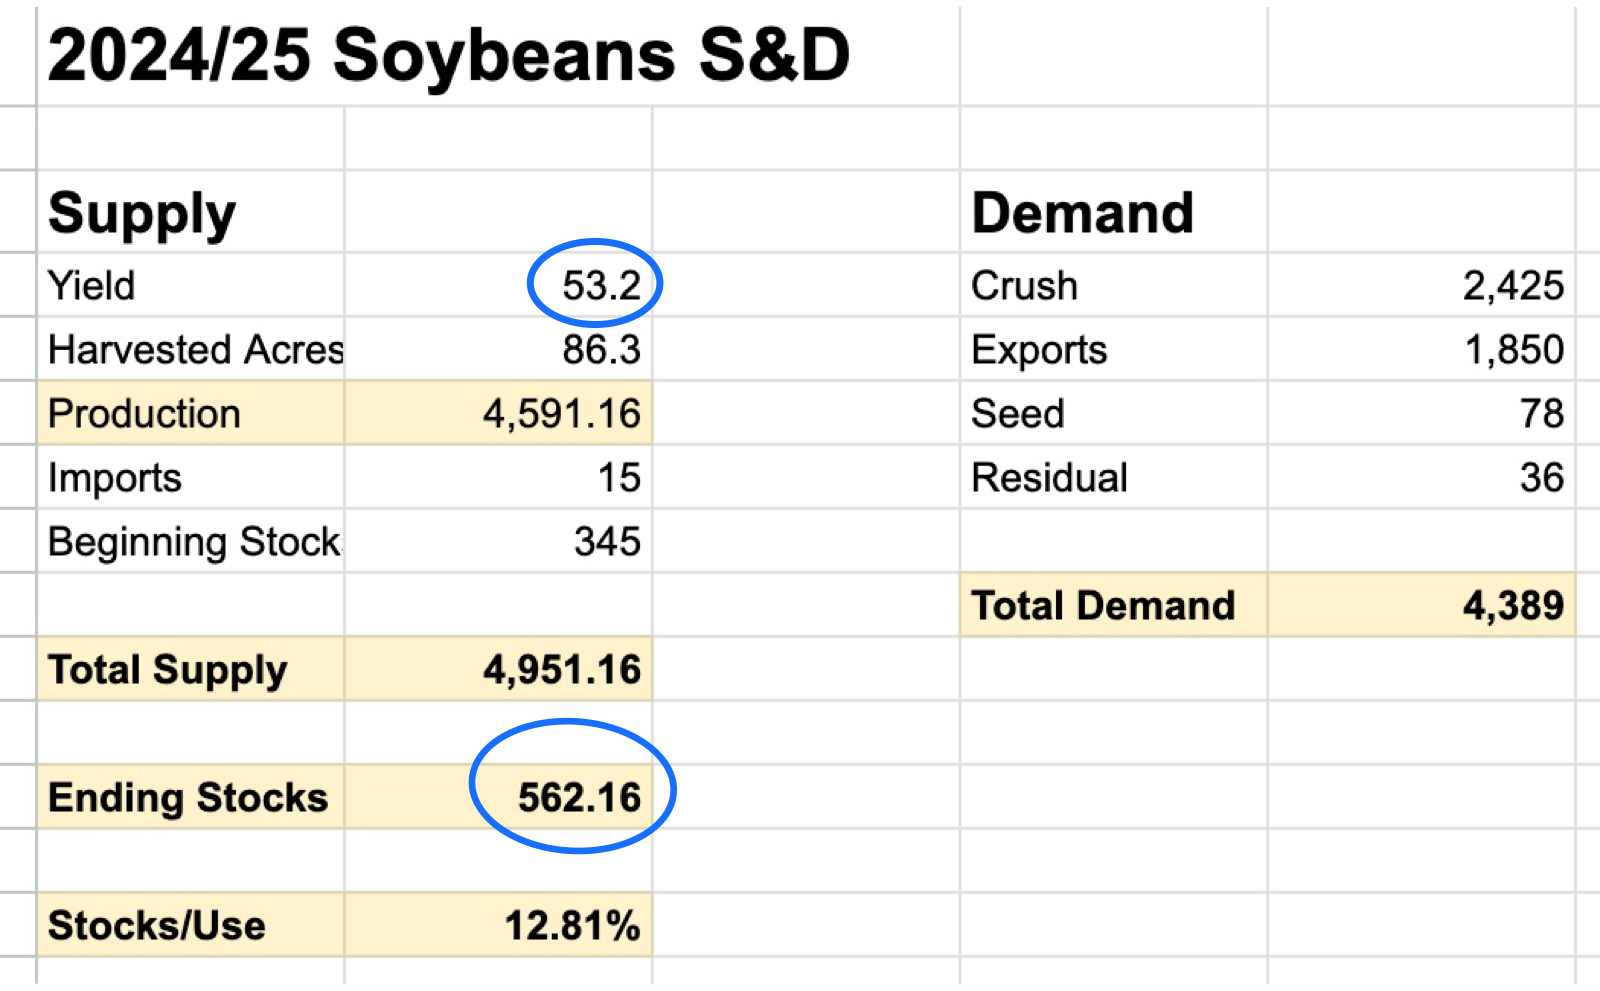
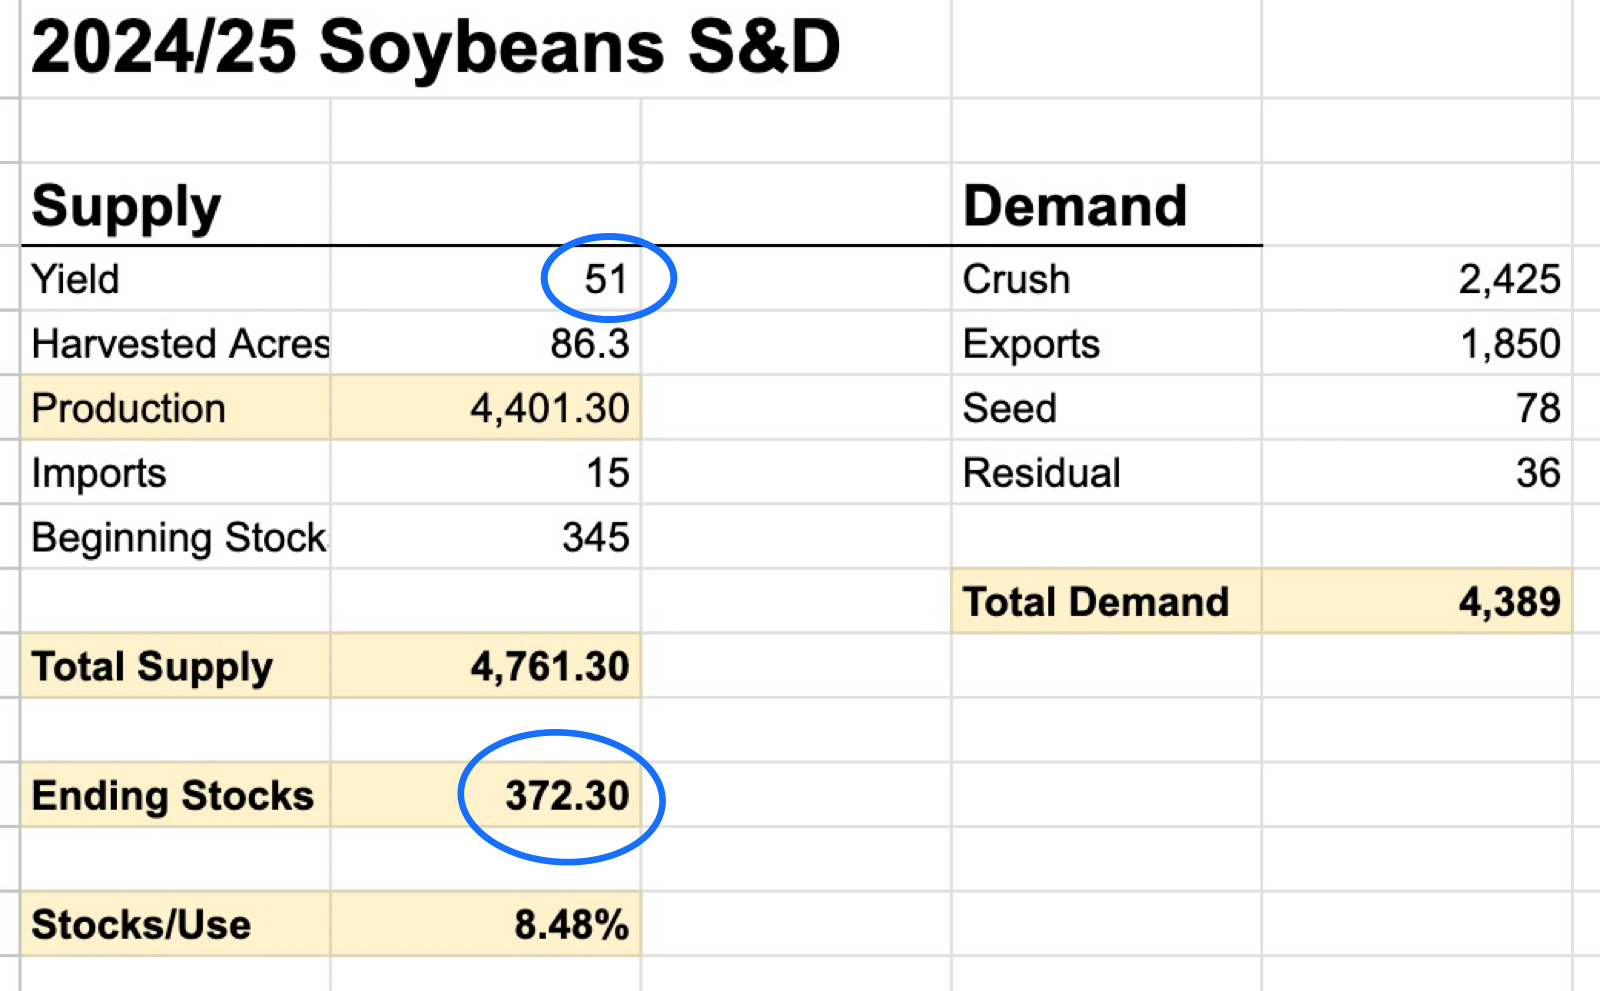
Right now, soybeans have the 3rd largest carryout all-time at 562 million bushels.
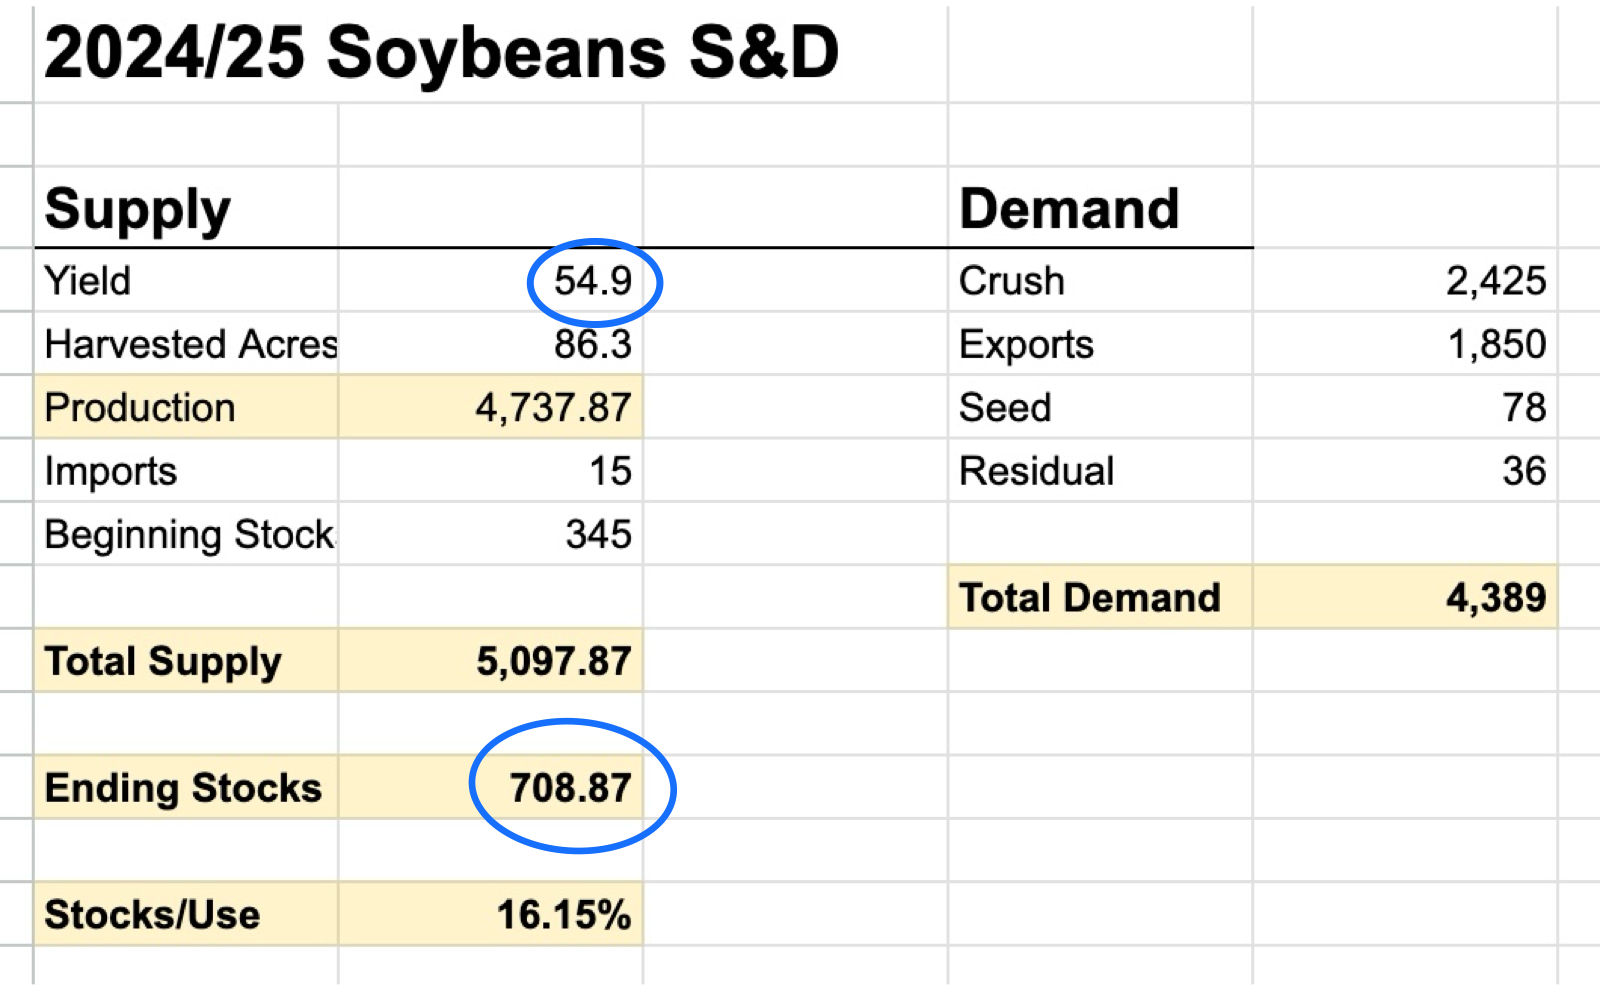
What is the risk if Pro Farmer is right & we see a near 55 bpa yield?
Take a look at the balance sheet. We already have a pretty serious problem unless we find demand. As there are many who believe this bean crop could get even bigger than the USDA currently has it at and most think demand is already overstated given that our bean sales to China are down -70% from average.
If yield were to come in at 55, our carryout would jump to a whopping 700 million.
However, if that were to happen, the USDA would likely try to balance the balance sheet and offset that with some demand. The problem is it might be hard for them to change demand as crush is already at a record and most think exports are overstated.
Consequently, if yield were to fall to 51 bpa instead, we might be looking at a carryout closer to 370 million rather than the current 560.
Either way, for soybeans to go higher they need demand.
There are two things that can save this market and bring it back to life.
Demand or a problem in South America.
Without demand, there is a good 50 cents to $1.00 of risk in this market.
Short term it will likely be tough to get a huge rally until we get through a chunk of harvest. The big move higher will likely not start until September or October.
Once we get through the Sep USDA report, that fear of this big crop will go away as the combines will give us the real numbers. Then attention will shift to demand. Demand is what is going to drive this market.
Seasonally, China starts to step in here soon. If you were China wouldn’t you take advantage of these low prices if you are severely underbought? US soybeans are also the cheapest in the world on the export market.
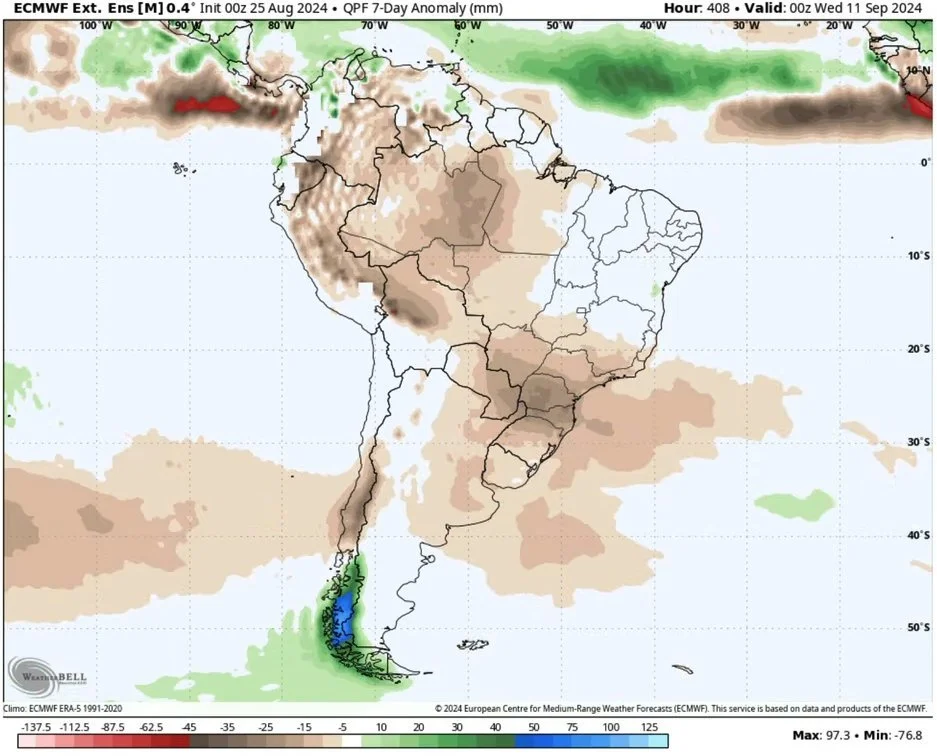
Once we get into harvest, attention will also shift to South America. They are experiencing their driest dry season on record. Now yes this can be fixed with one good monsoon rain, but if it does not, this could be a big problem for South America production and friendly to future prices.
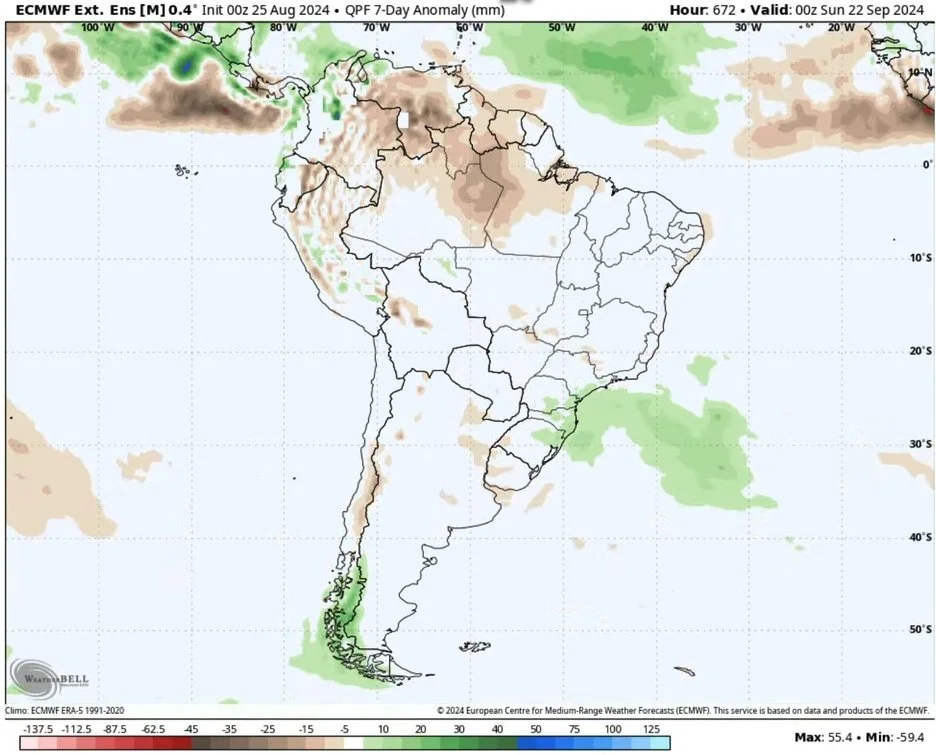
Rainy season doesn’t start until September to October. Right now the forecasts are dry for the start of September, and neutral towards the end of September. If October comes and the rain still hasn’t came, this will be something to pay attention to.
Anomaly Through September 11th
Anomaly Through September 22nd
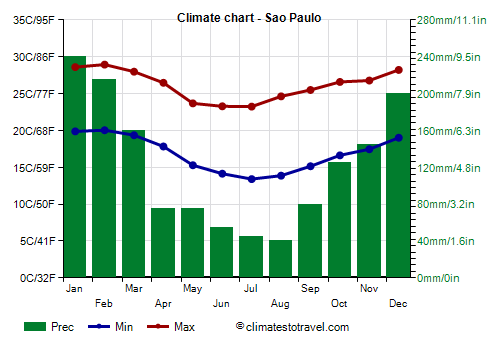
Brazil Rainy Season Calender
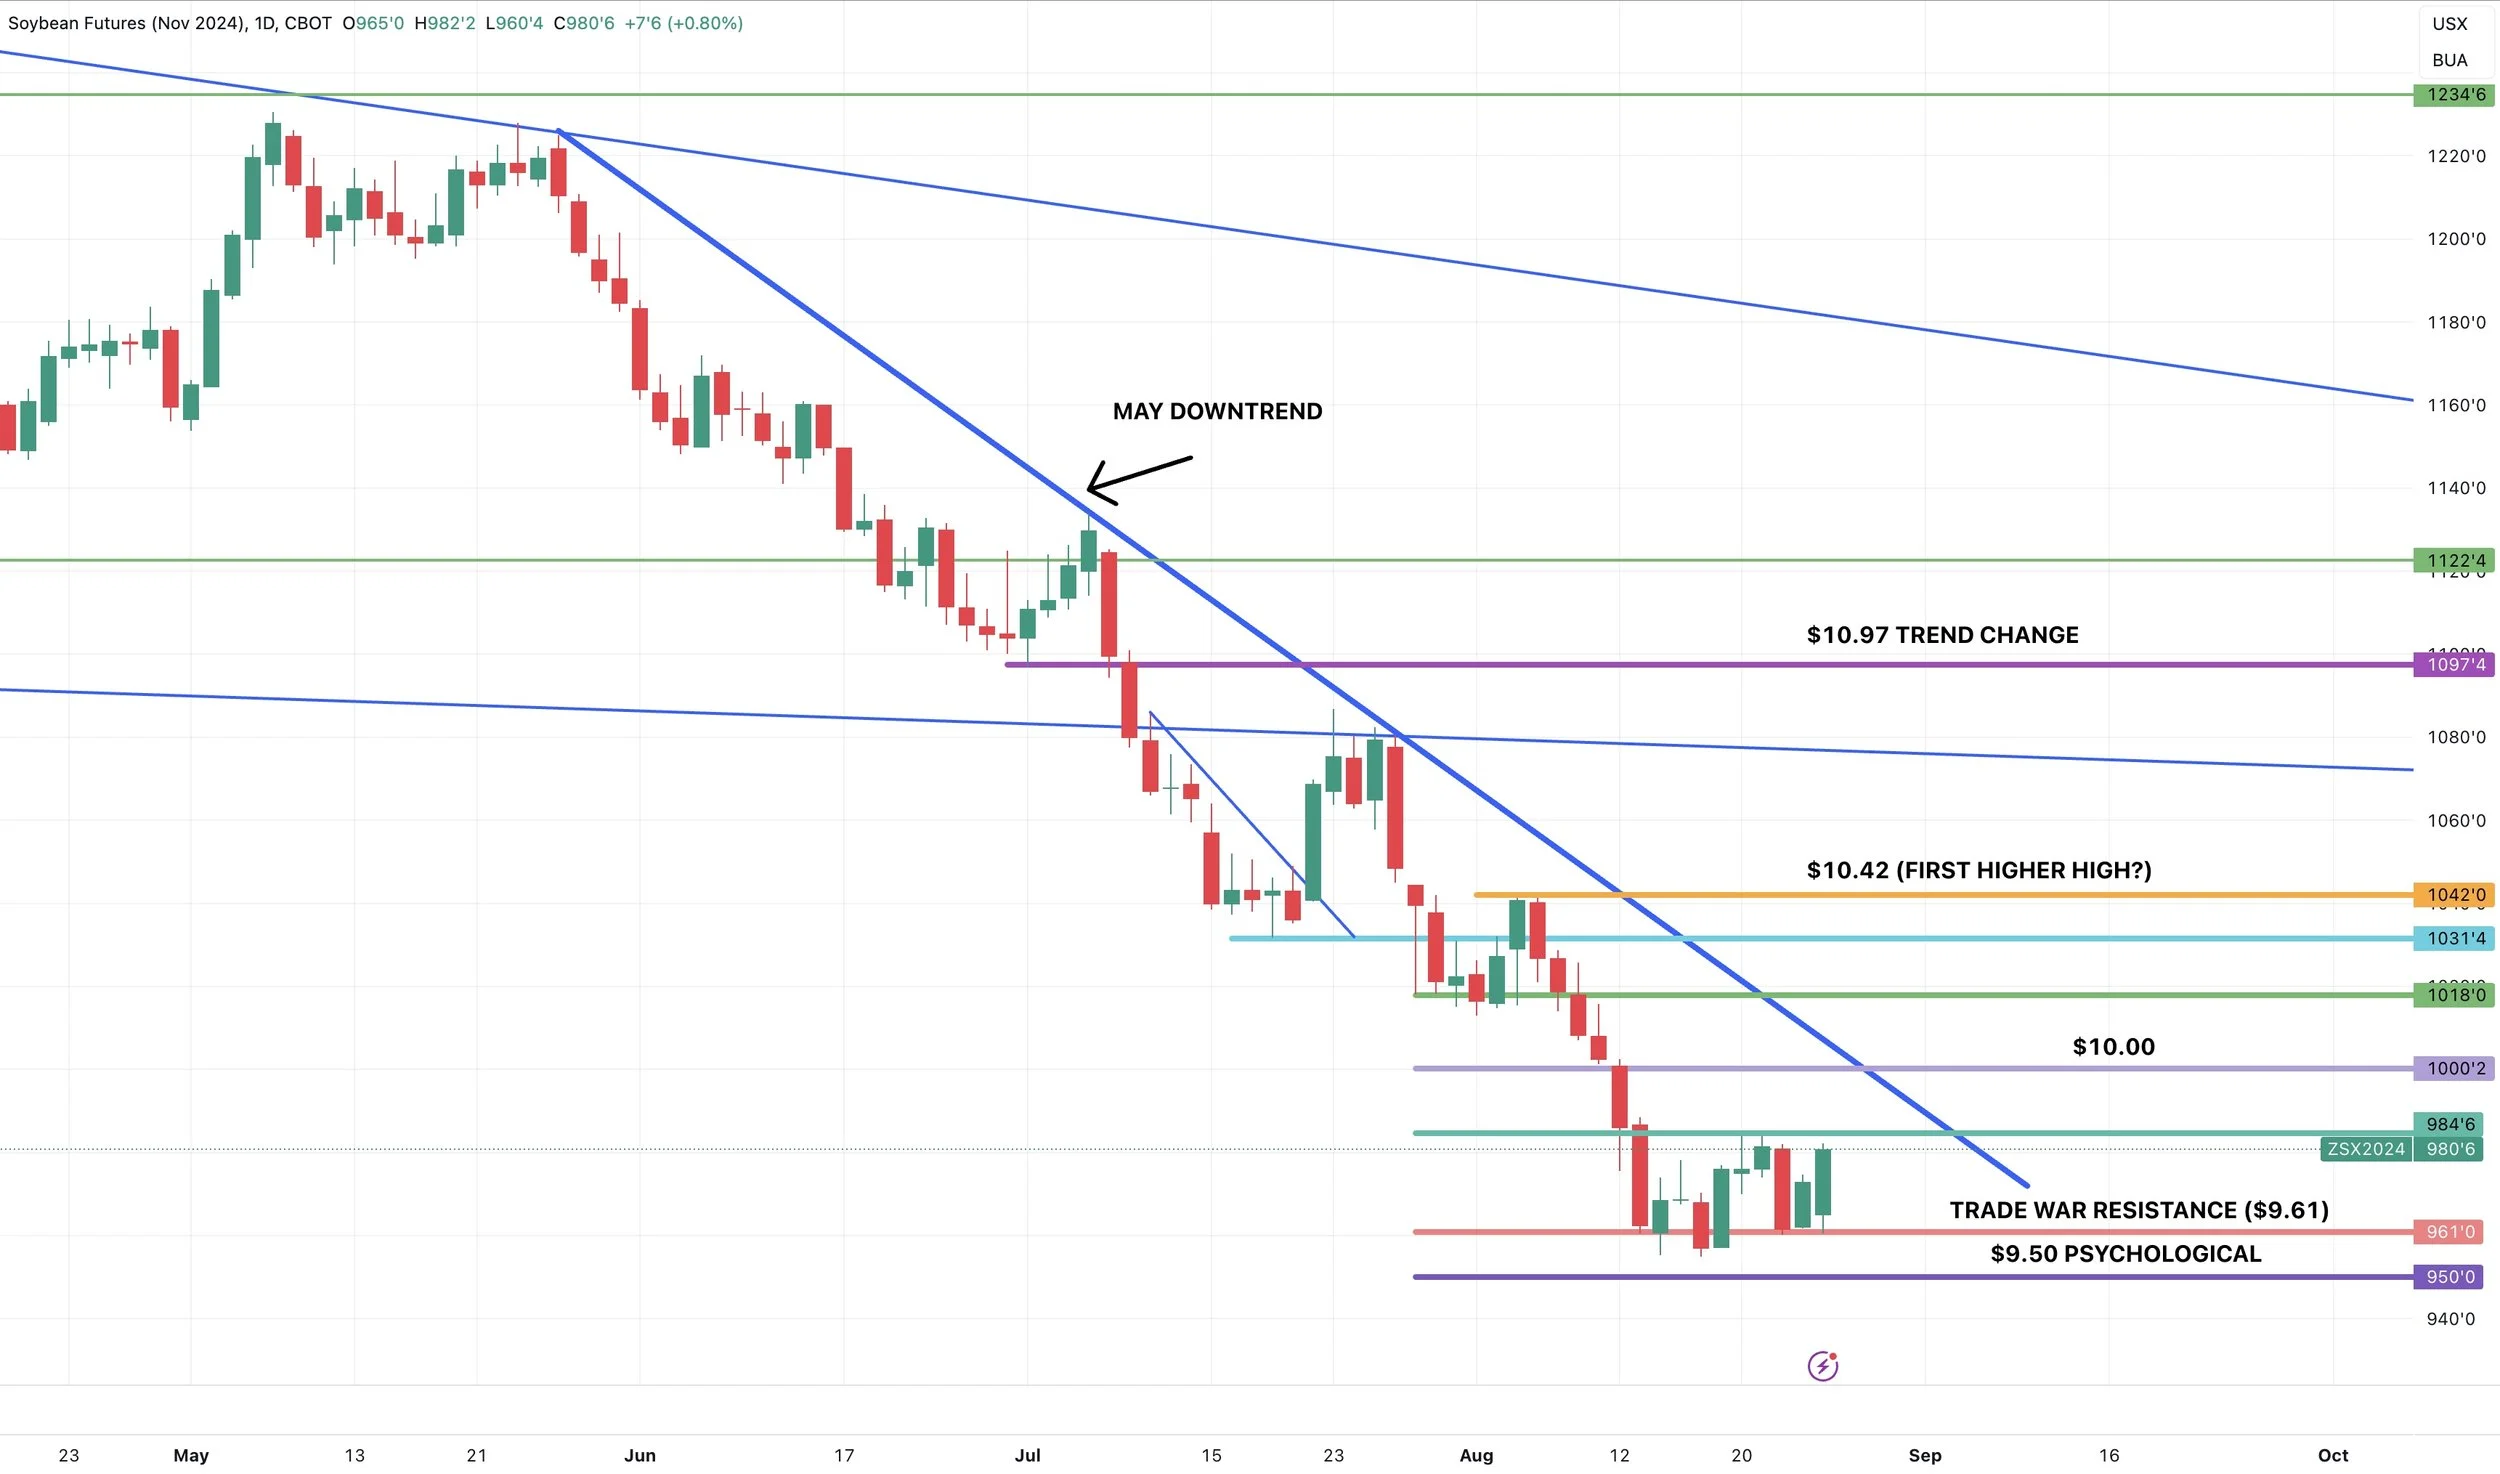
Looking at the chart, perhaps we finally found some footing. But I still see significant risk in this bean market. I hope it doesn’t happen, but I would not be surprised at all to see $9.00 if this bean crop gets bigger and demand remains poor. There are many respected individuals who have targets below $9.00.
Back above $10.00 would friendly, $10.42 would be our first higher high. Which would make me feel somewhat comfortable considering if the bottom is in.
My take for beans is the same as corn. Long term I think demand can lead us higher. Short term, I am very aware that there is plenty of more downside risk for another month or two. My biggest concern is if this bean crop gets bigger, which it very well could.
If your risk is lower, do what you can to protect it. Give us a call if you want to come with a 1 on 1 game plan. (605)295-3100.
Daily Nov Beans
Wheat
New lows in wheat as Sep wheat breaks below $5.00.
Pressure mainly came from first notice day.
Once we get first notice day out of the way, I think wheat can start to rebound.
In 2020, we actually made our bottom exactly on first notice day.
Take a look at the seasonals of wheat. Seasonals are not perfect. But they suggest we will make a bottom here within the next few weeks.
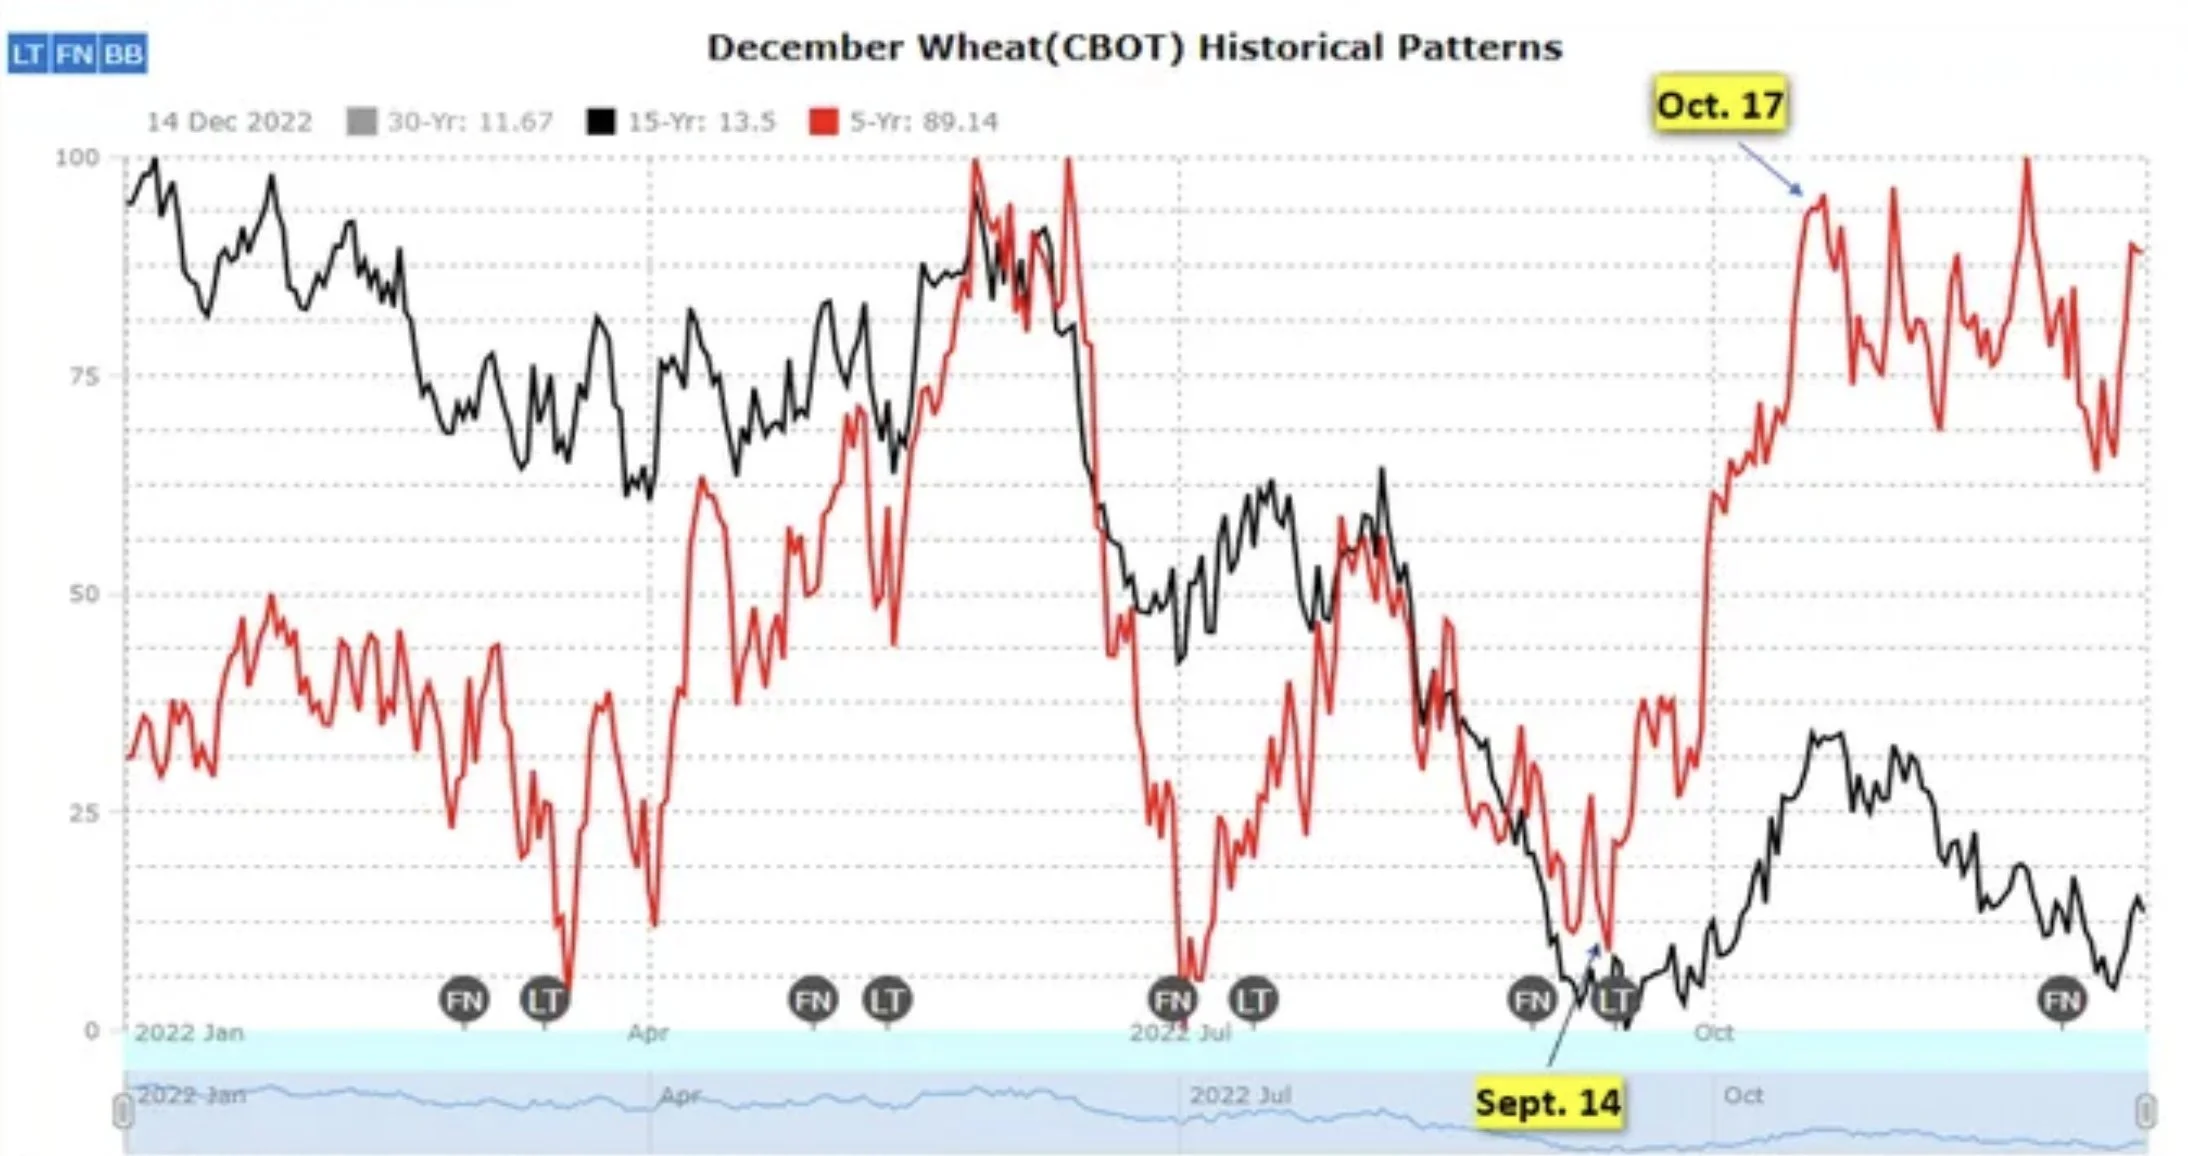
Short term, sure there is some downside risk still. But really looking long term there is more upside potential than downside potential at these levels.
We are at levels that are going to lead to less wheat acres.
We have plenty of issues globally.
We don’t have a reason to rally, but we don’t really have one to just continue falling out of the sky either.
I think we will start our move higher over the next few weeks.
Short term, still some possible downside.
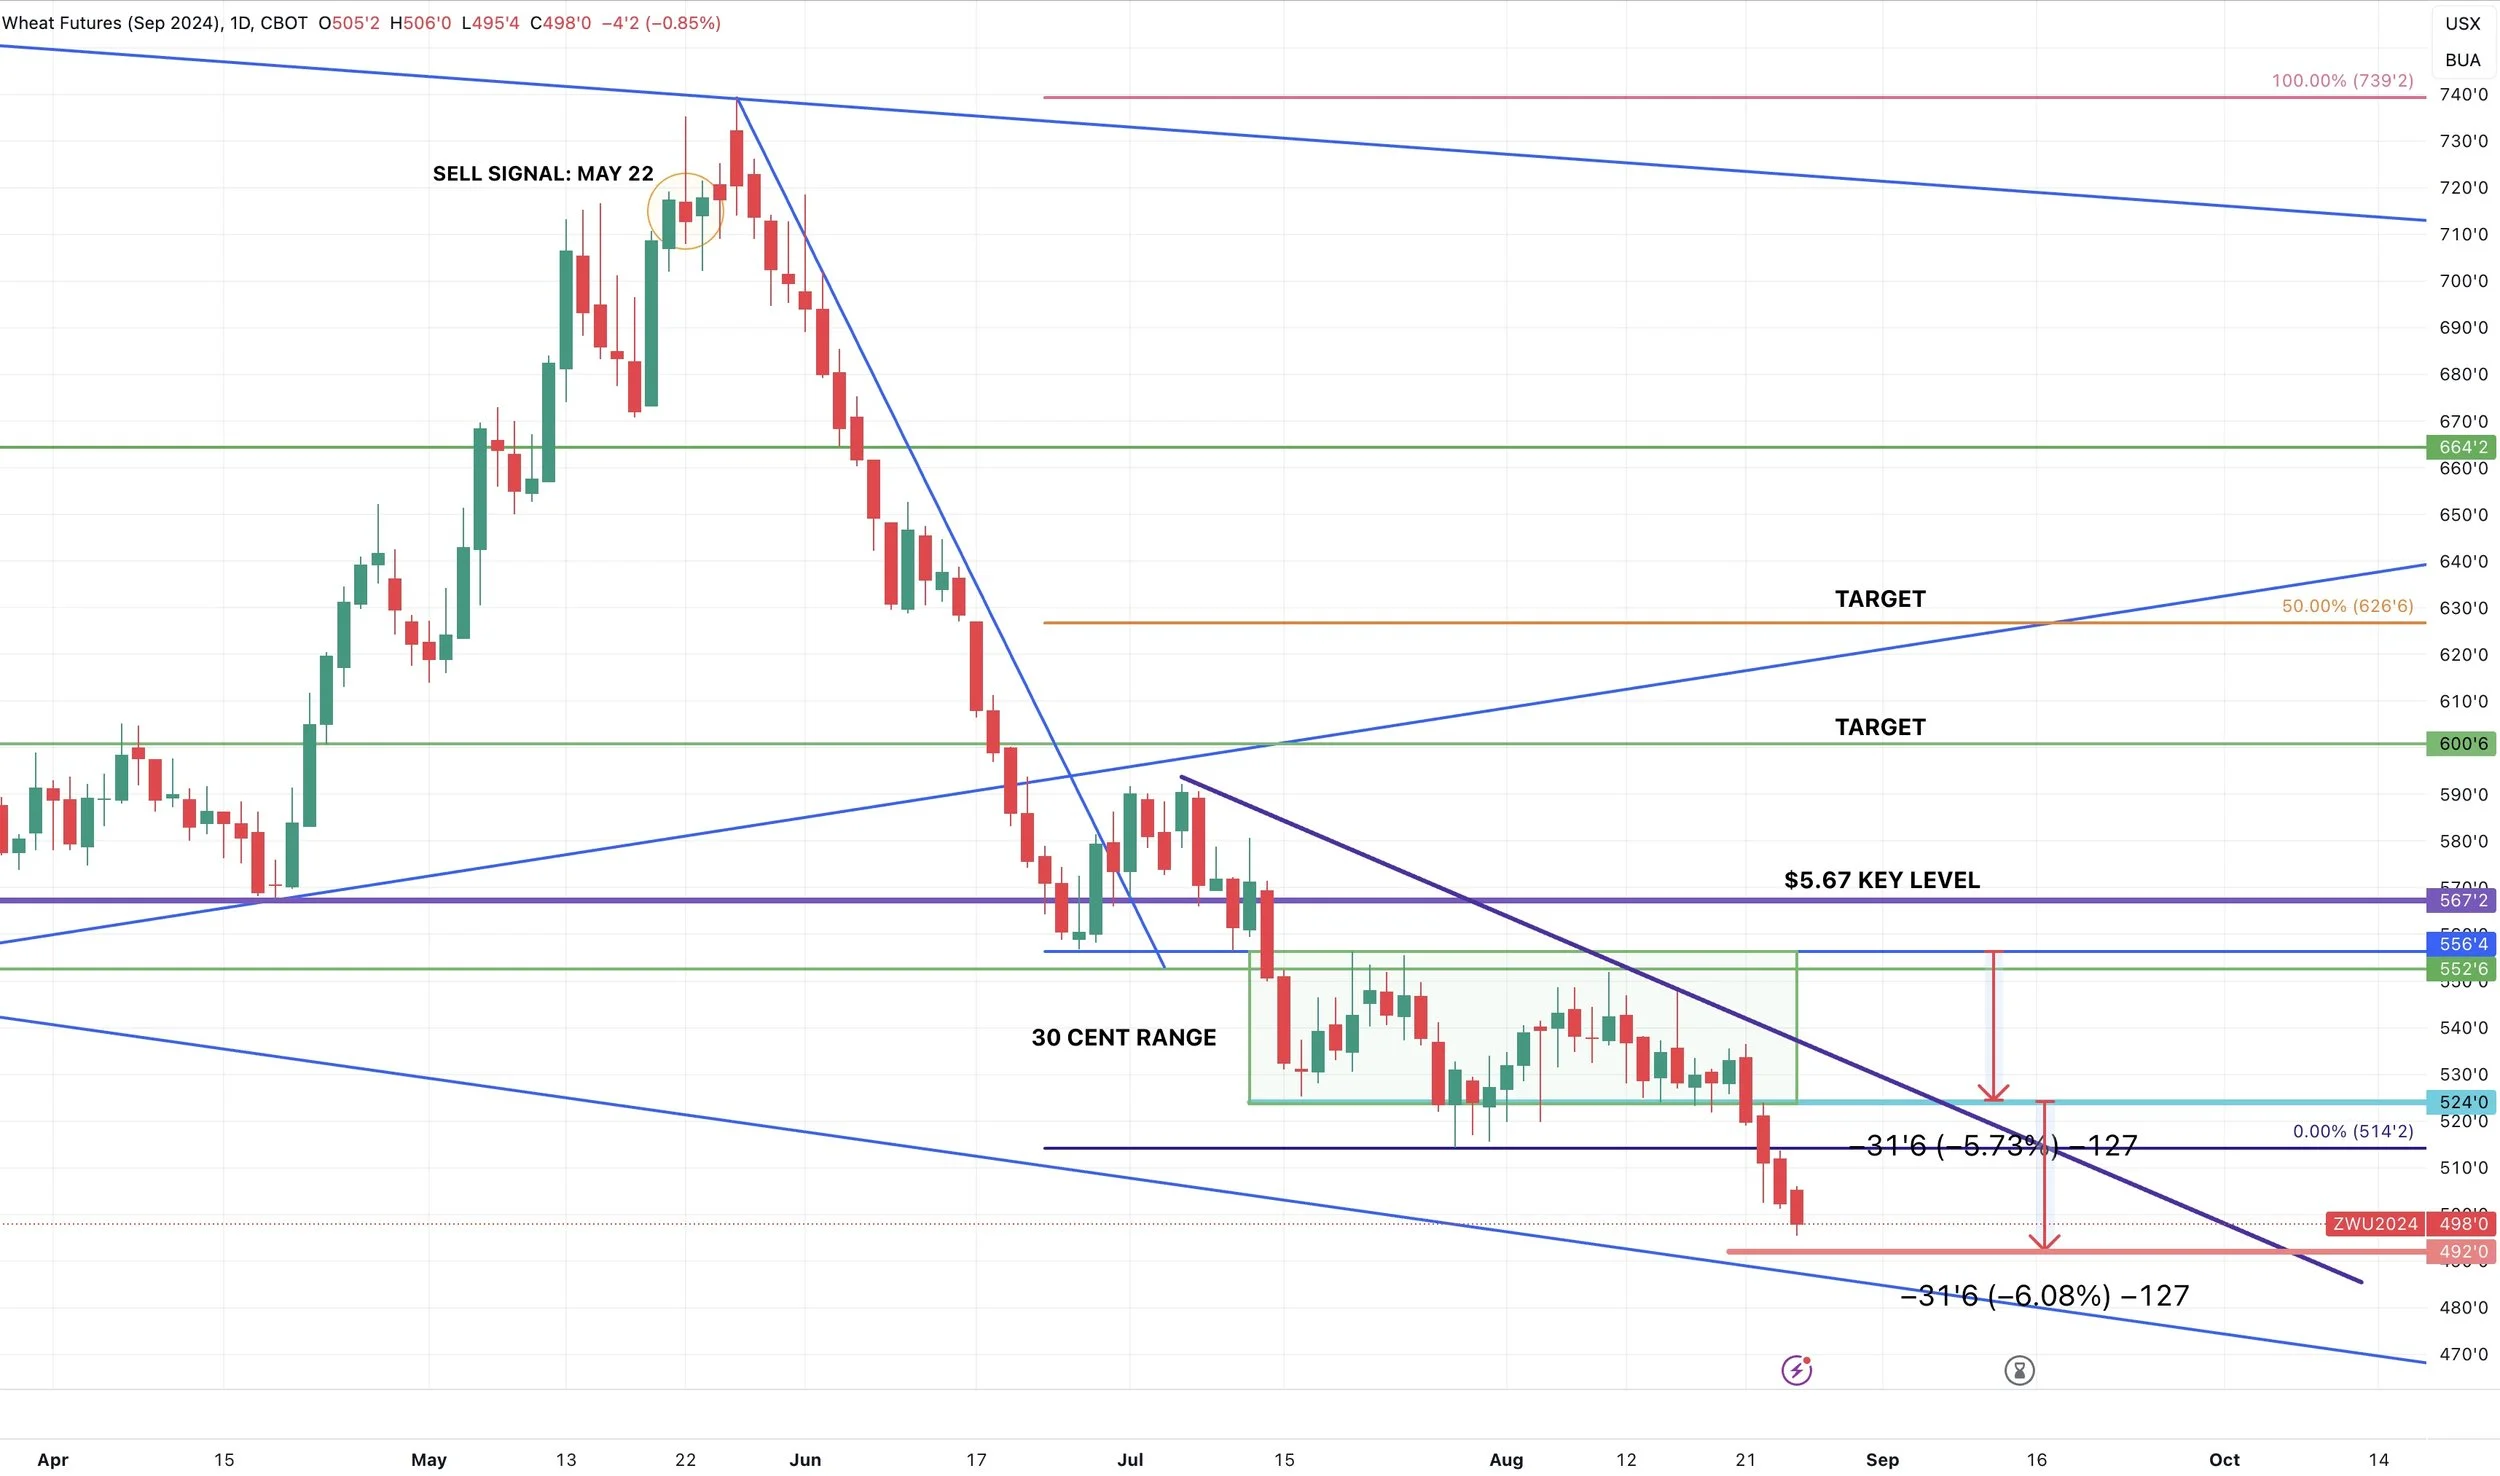
On Sep Chicago we broke out below that 30 cent range we held for months. So the implied move lower brings us to $4.92 (Closed at $4.98 today).
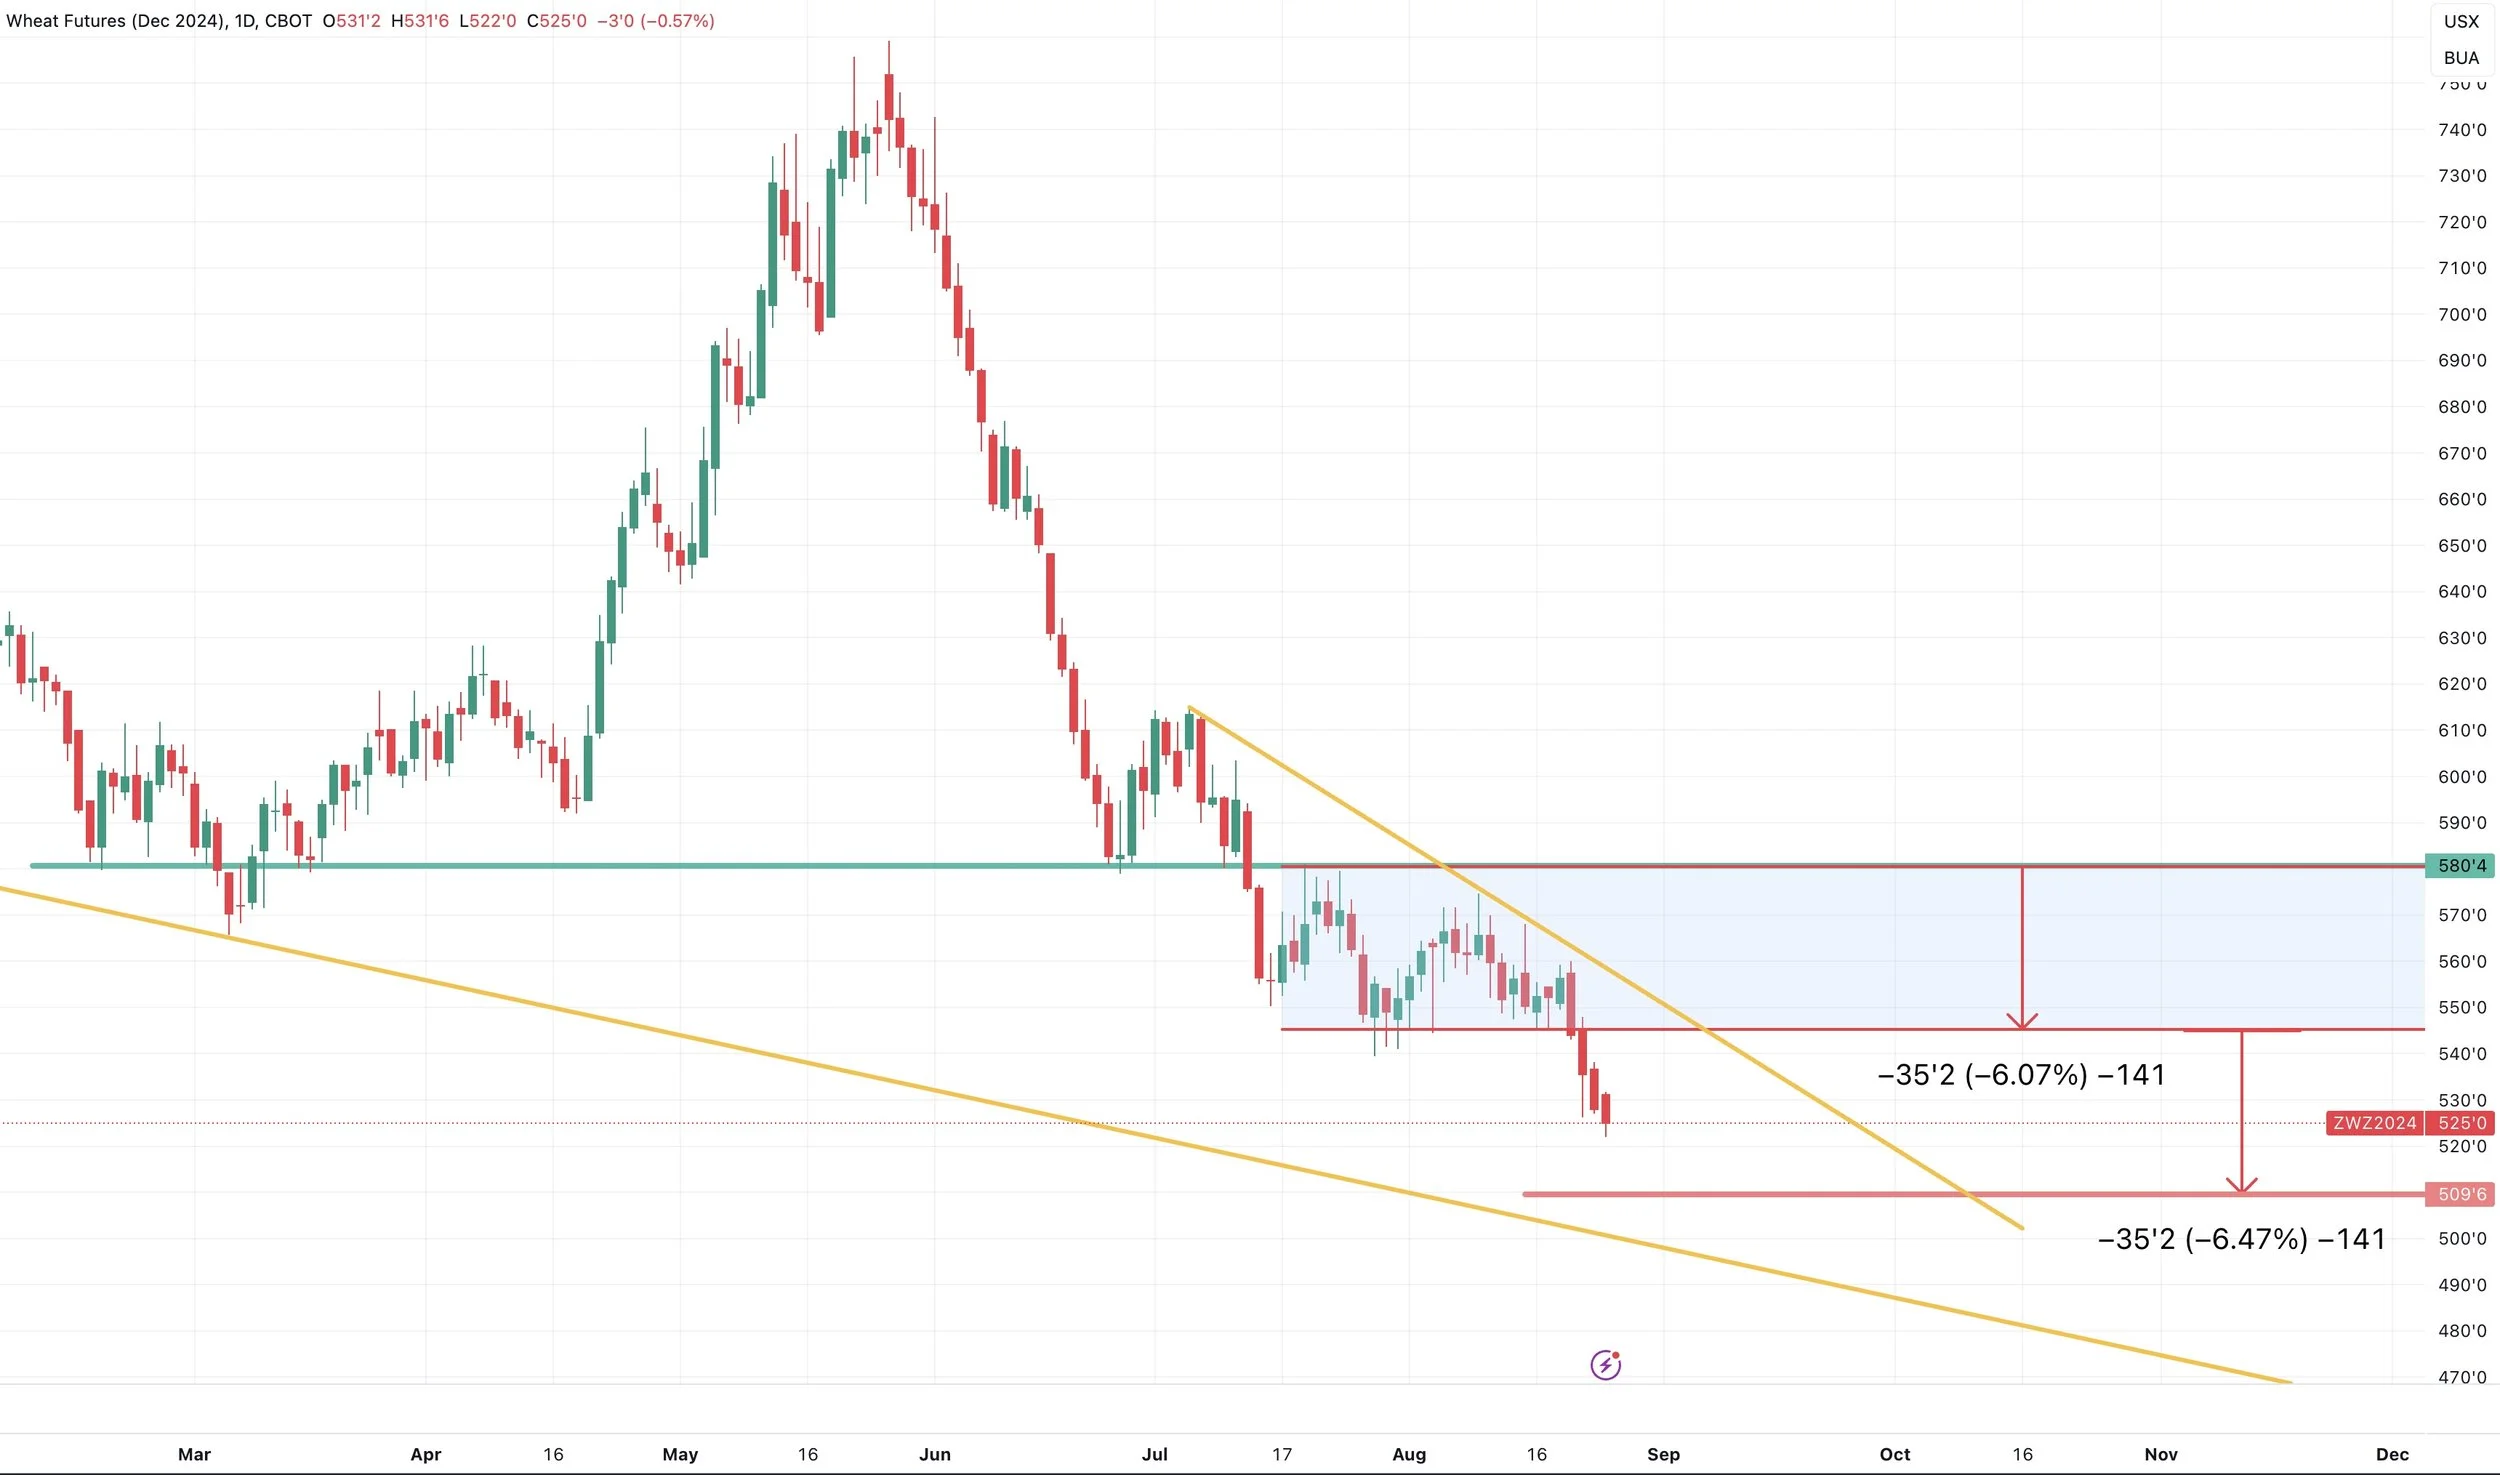
That same implied move on Dec Chicago wheat brings us to about $5.10 (Closed at $5.25 today).
Daily Sep Chicago
Daily Dec Chicago
Want to Talk?
Our phones are open 24/7 for you guys if you ever need anything or want to discuss your operation.
Hedge Account
Interested in a hedge account? Use the link below to set up an account or shoot Jeremey a call at (605)295-3100.
Check Out Past Updates
8/23/24
CROP TOUR SHOWS MASSIVE BEAN YIELD
8/22/24
UGLY DAY FOR WHEAT & BEANS, STILL RISK, CROP TOURS, CAPTURING CARRY
8/21/24
CROP TOUR DAY 3. NOT HUGE MOVEMENT
8/20/24
CROP TOUR SO FAR & COMPARISON TO USDA
8/19/24
CROP TOUR BOUNCE
8/16/24
RISK REMAINS LOWER. MANAGE YOUR RISK
8/15/24
DEMAND, BIG US CROPS & BRAZIL DROUGHT
8/14/24
DEAD CAT BOUNCE
8/13/24
POST USDA SELL OFF
8/12/24
USDA REPORT: BEARISH BEANS. SMALLER CORN CARRYOUT & RECORD YIELDS
8/9/24
USDA REPORT MONDAY
8/7/24
HUGE USDA REPORT MONDAY
8/6/24
WHEAT UNDERVALUED? CORN YIELD? WHAT TO DO WITH GRAIN OFF COMBINE
8/5/24
GRAINS STRONG WHILE WORLD PANICS
8/2/24
GRAINS RALLY, YIELD ESTIMATES, CHINA STARTS TO BUY
8/1/24