
CORN BREAKS $4.00, FAVORABLE WEATHER & CHARTS

Overview
Grains mixed as corn posts a new contract low, with Dec corn closing below $4.00. Soybeans ended the day higher but traded to their lowest levels since October of 2020 approaching those "trade war levels".
Why do we continue to fall?
A few reasons.
First, the trade was expecting some pretty hot weather. Now that heat got removed. So that was a negative. We are also getting rain, as we have the entire growing season. A weather threat is essentially completely gone for now. The outlook for August looks crop friendly as well.
The trade is expecting record crops. Monday we saw corn ratings improve. Seasonally they start to go lower here. People are throwing out corn yields anywhere from 180 to as high as 188. I'm hearing talk of 52 to 55 yield beans. We likely have some damage from the wet start, excessive rain etc in some areas. But we won’t know how big of an impact it actually had until we get into the crops. A weather rally from here is unlikely.
US export inspections were strong this week, but we still have a lack of demand.
US corn is competitive on the export market, yet we haven’t seen much business. We did however get a flash sale of corn today that ended the dry spell of sales, but the market didn’t care.
The funds are record short but will need a reason to cover. Weather probably isn’t going to be the reason.
Let's take a look at the weather..
July Weather Recap
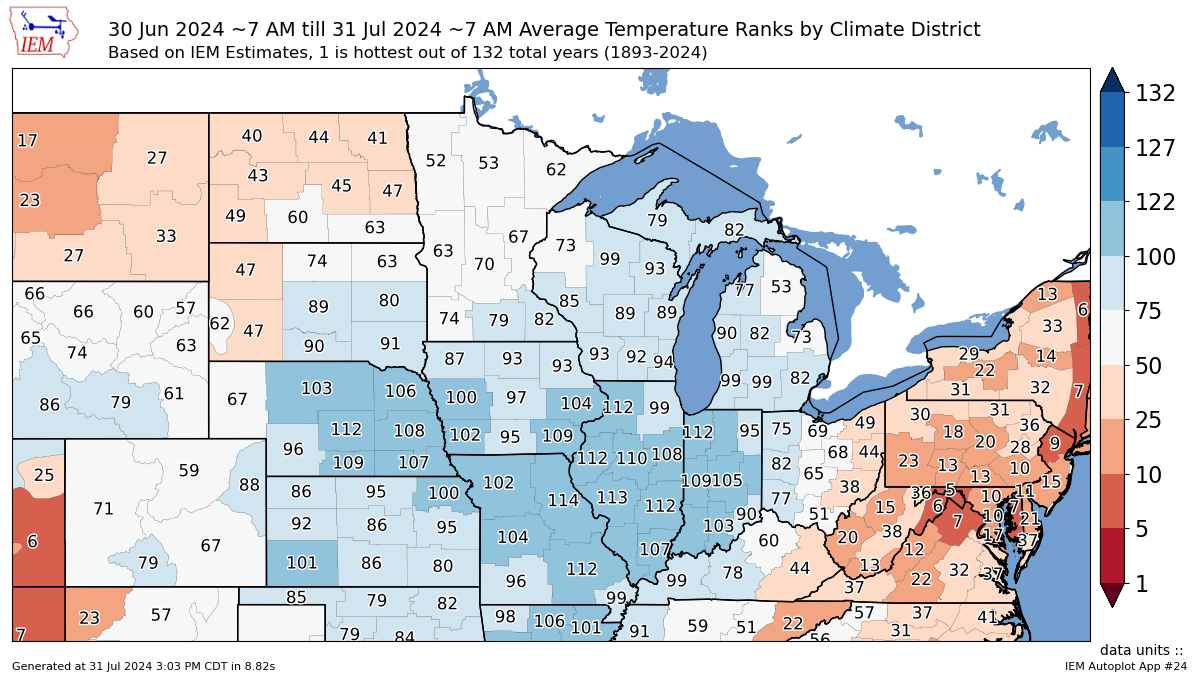
Look at just how ideal of weather July was for the corn belt.
It was one of the coolest July's on record. Coolest top 20-30% for the entire corn belt.
July Temp Ranks
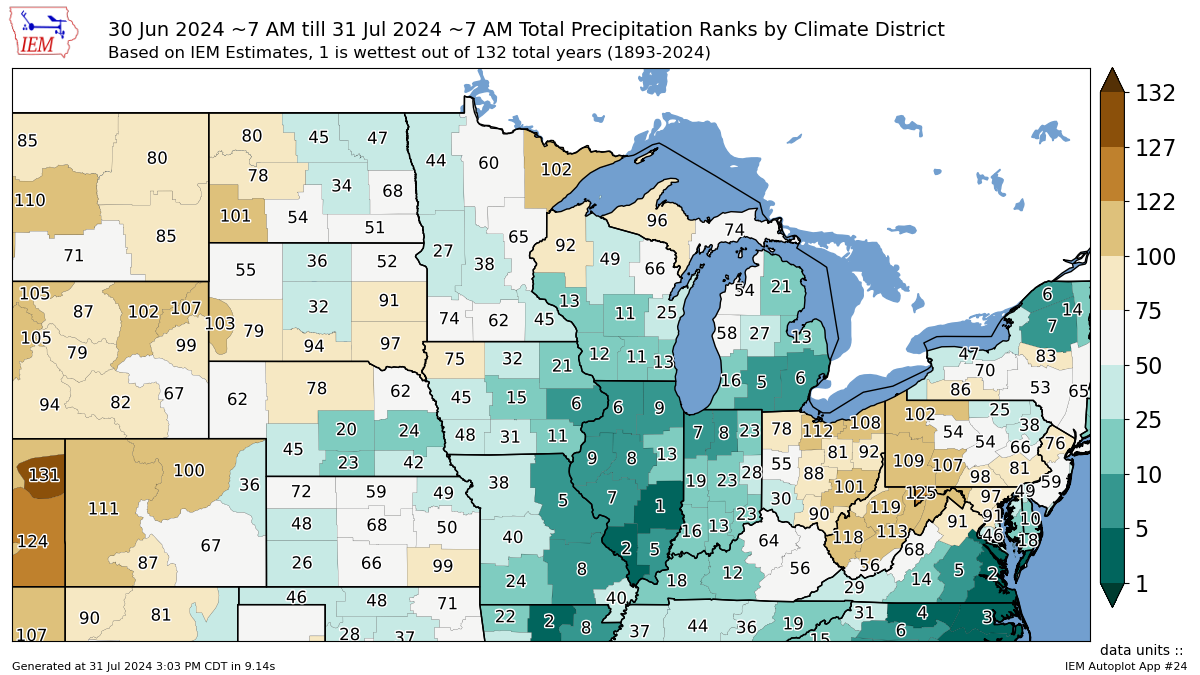
Precip has been decent for the majority of the corn belt as well, aside from very east areas such as Ohio. Parts of Iowa and Illinois amongst wettest on record.
July Precip Ranks
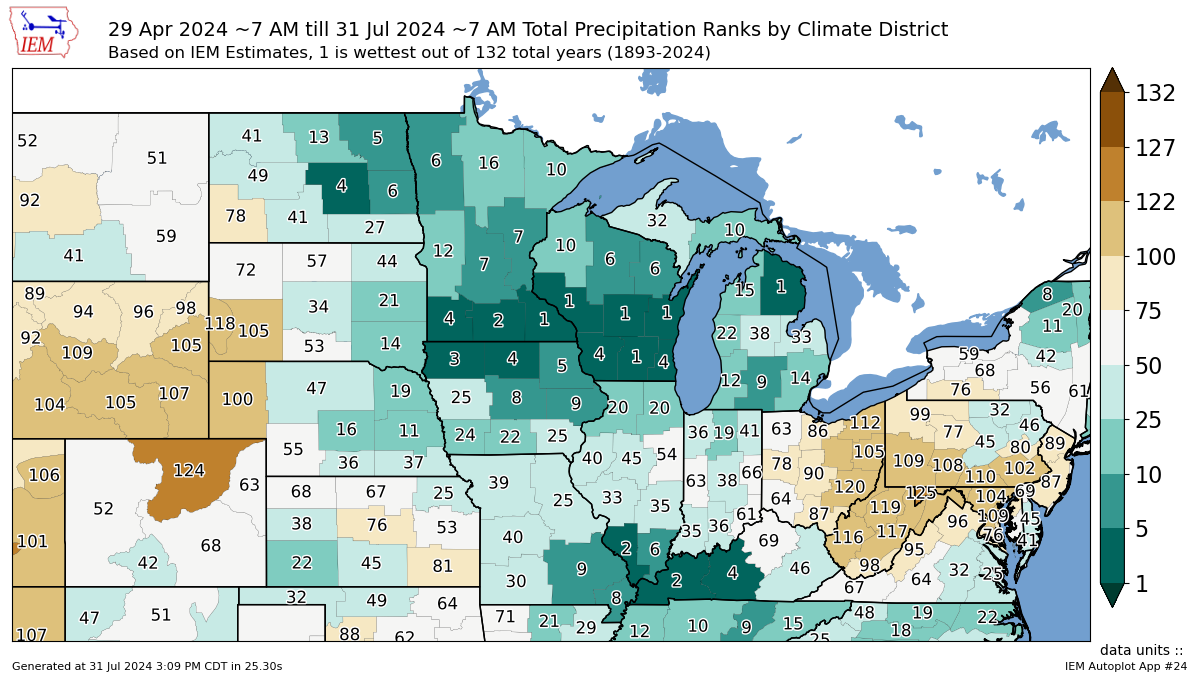
Looking at summer as a whole, those areas with a #1 are definitely going to see some negative effects to yield from being too wet. But many other areas received a perfect amount.
Very east such as Ohio has been too dry.
Overall Summer Precip Ranks
Forecasts Outlook
This is of the biggest reasons beans fell recently. The market had been anticipating some crazy heat. But the forecasts removed that heat.
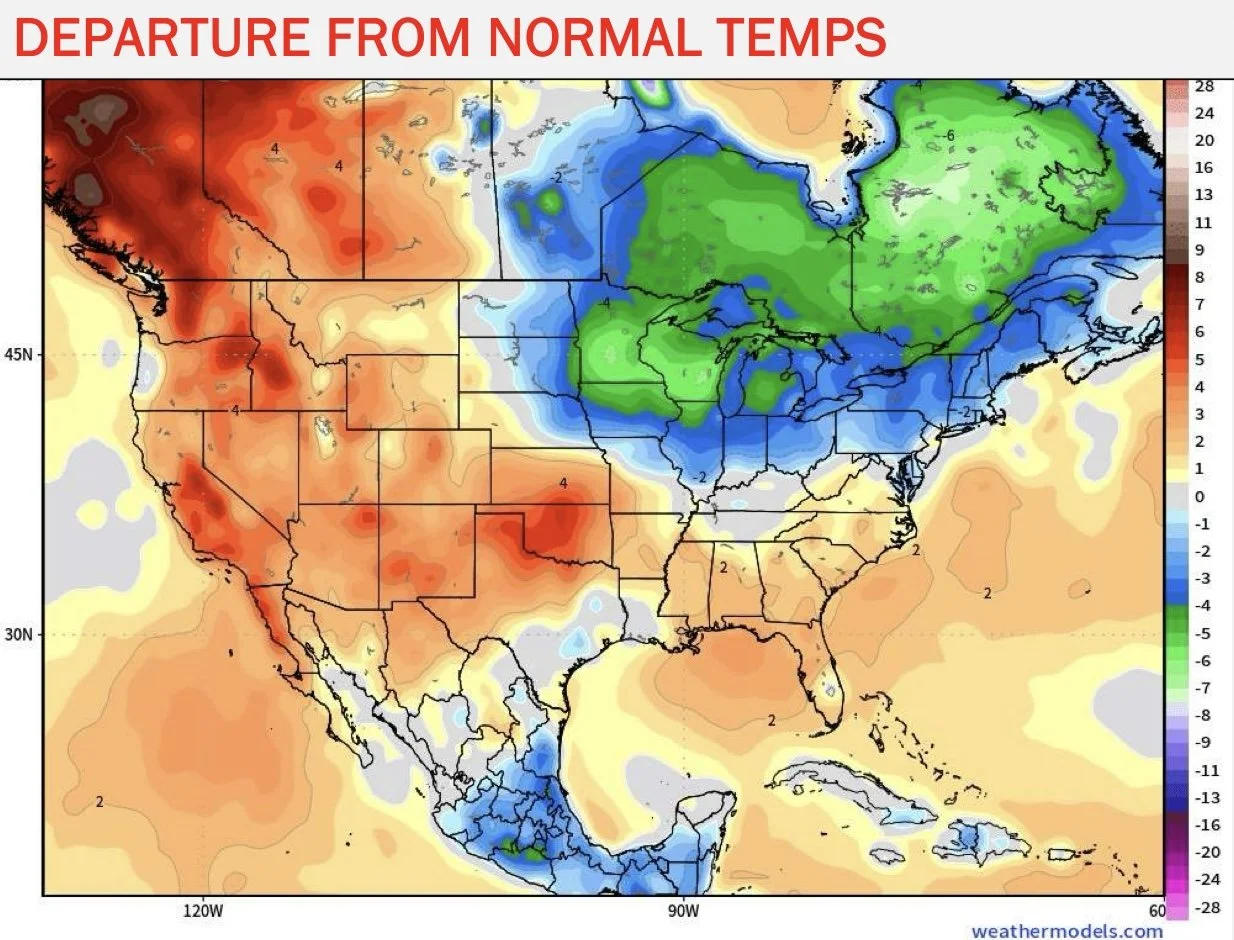
If you take a look at the next week, it is still hotter than normal but only by a few degrees now. The original forecasts had temps +10 degrees above normal. The heat also shifted more south west away from the key growing regions.
If you take a look at week 2, temps start to fall to very cool for the entire corn belt.
Next 7 Days (July 31 - Aug 6)

Week 2 (Aug 7 - 13)
The corn belt will be getting rains but will remain a little drier in the plains.
Overall, weather is mainly ideal outside of some heat the next week out west. But overall our crops have plenty of soil moisture and the outlook looks favorable as well.
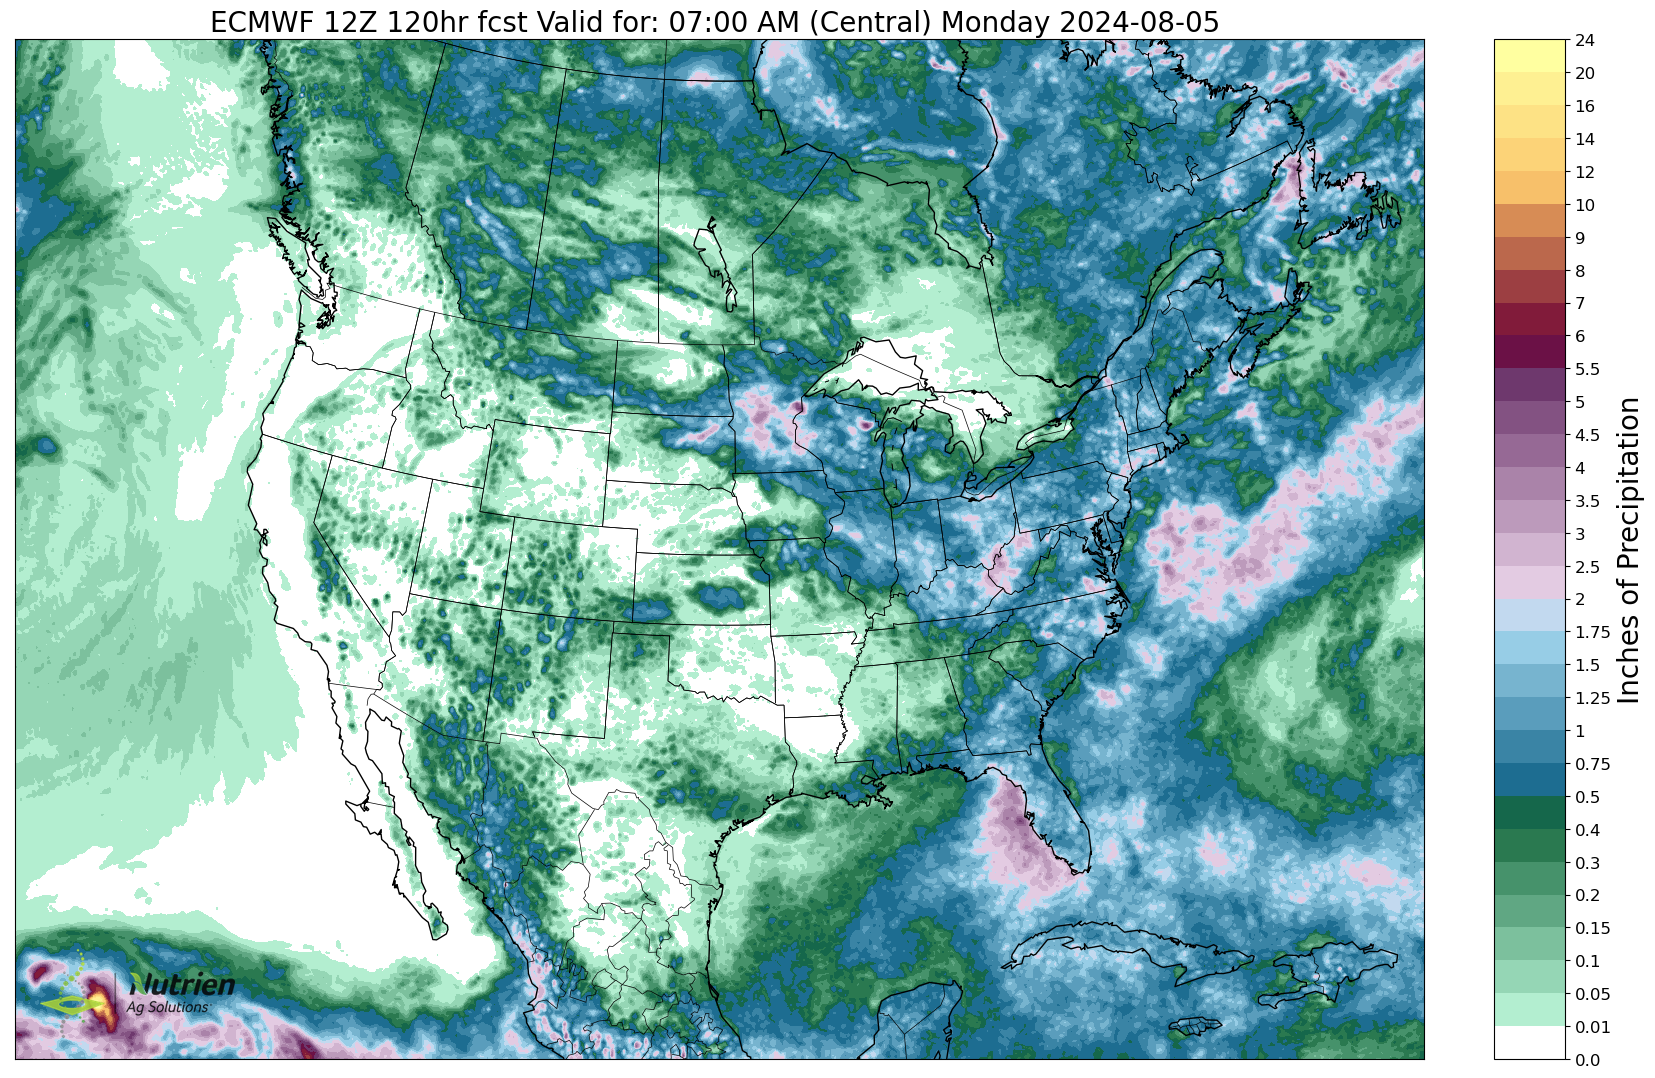
Euro 5-Day Precip
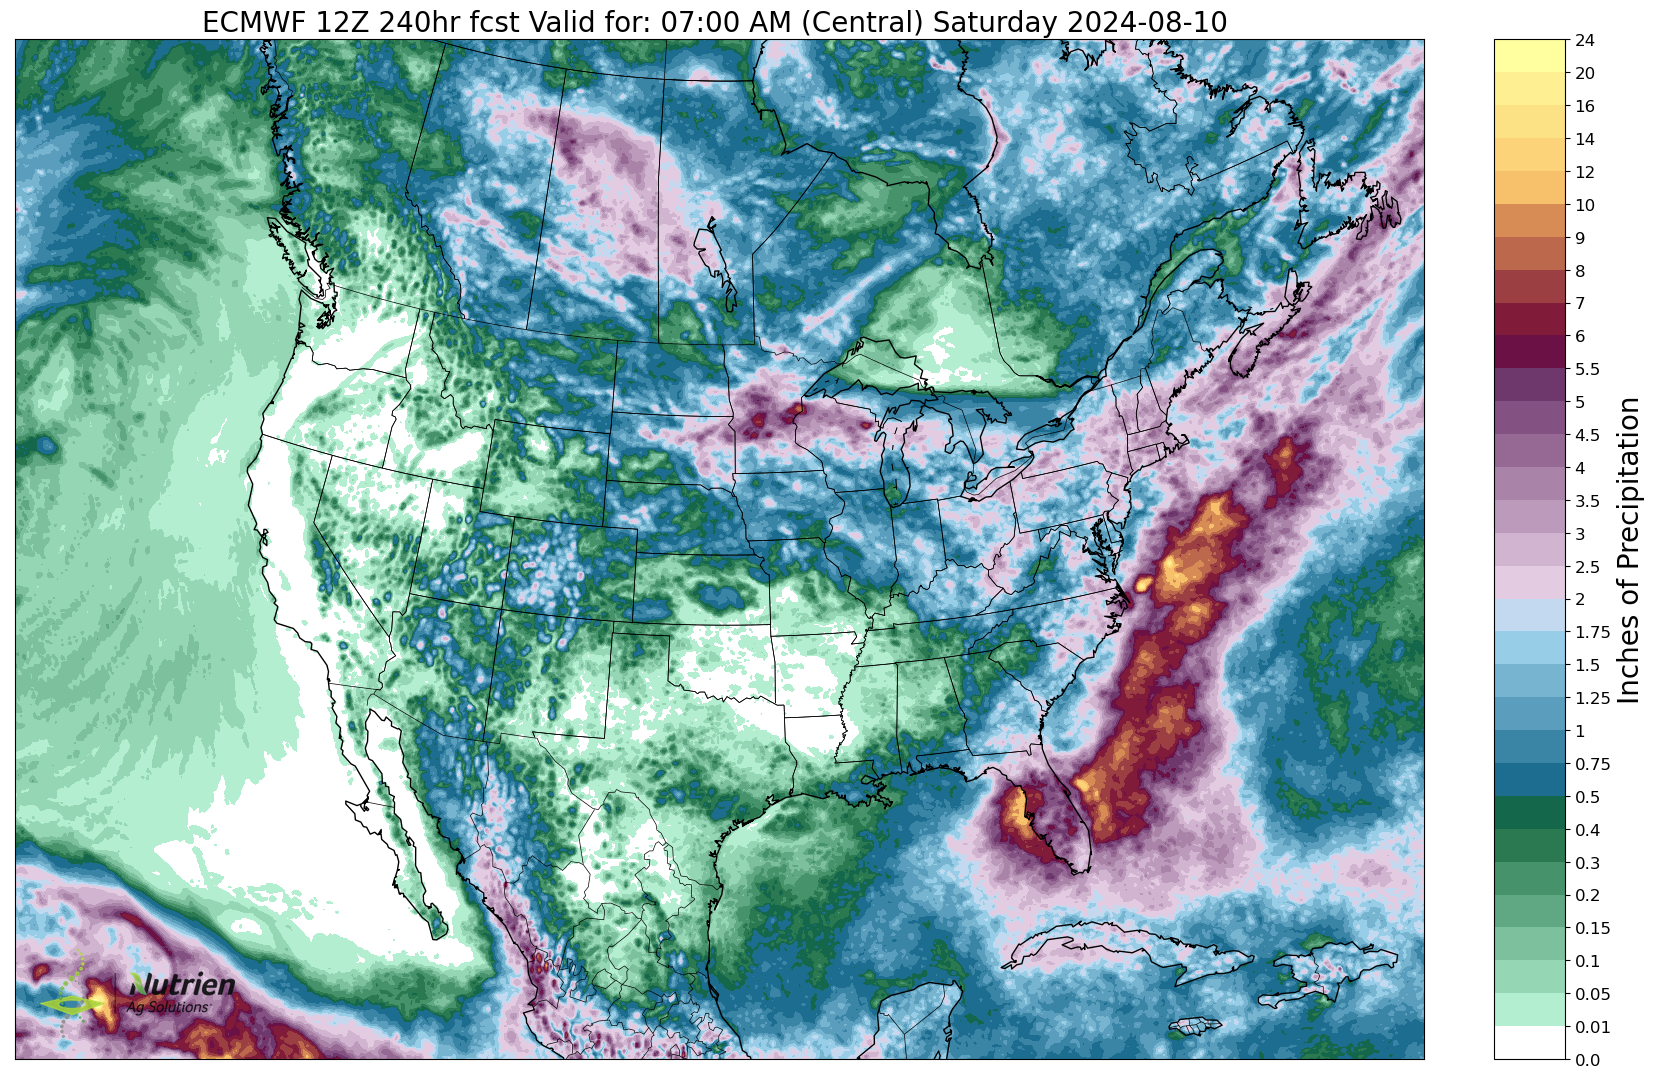
Euro 10-Day Precip
August Outlook
Orginally, the forecasts suggested we would be getting a hot and dry August..
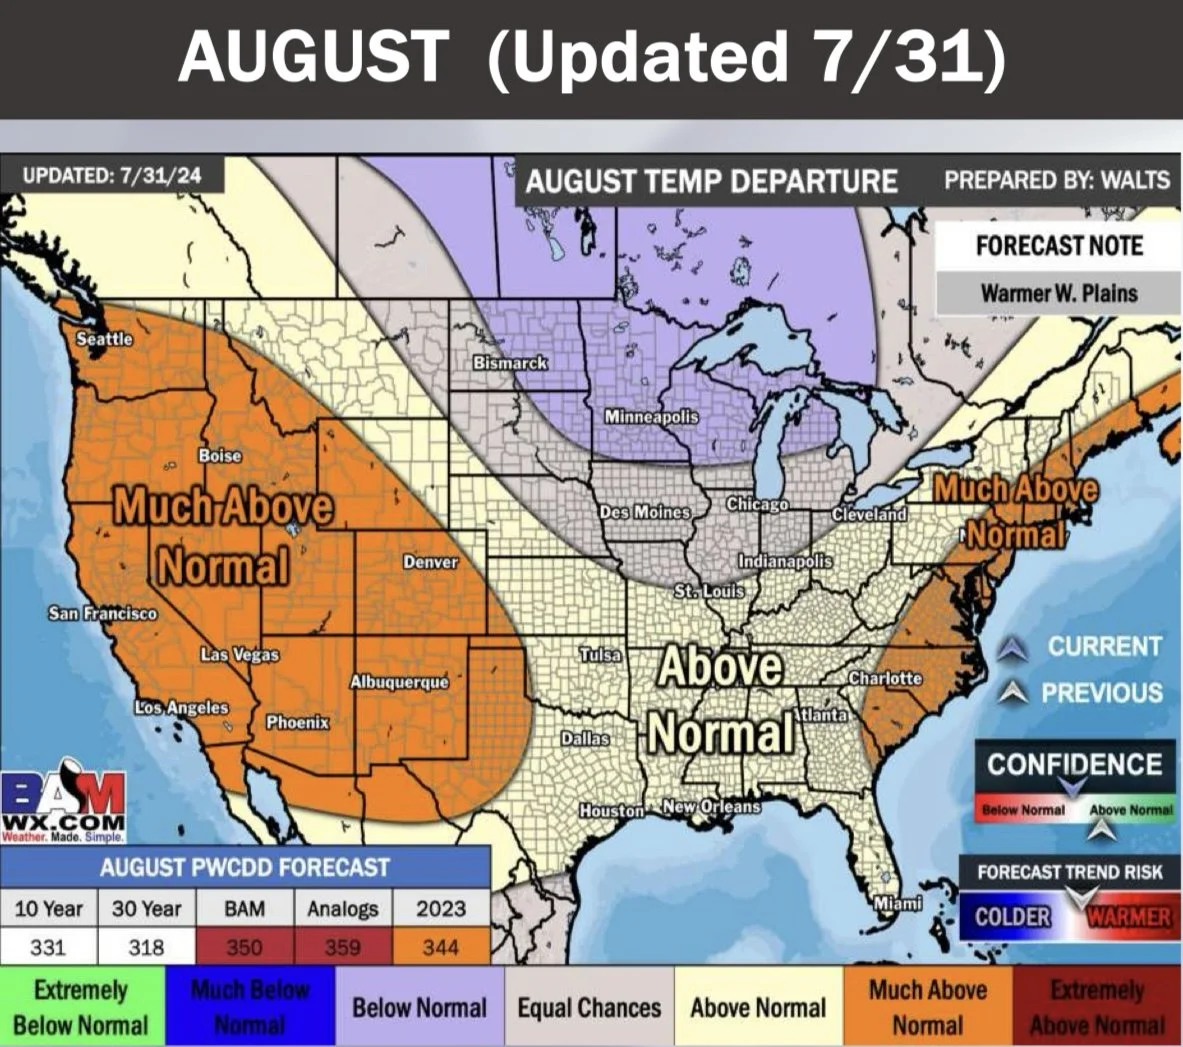
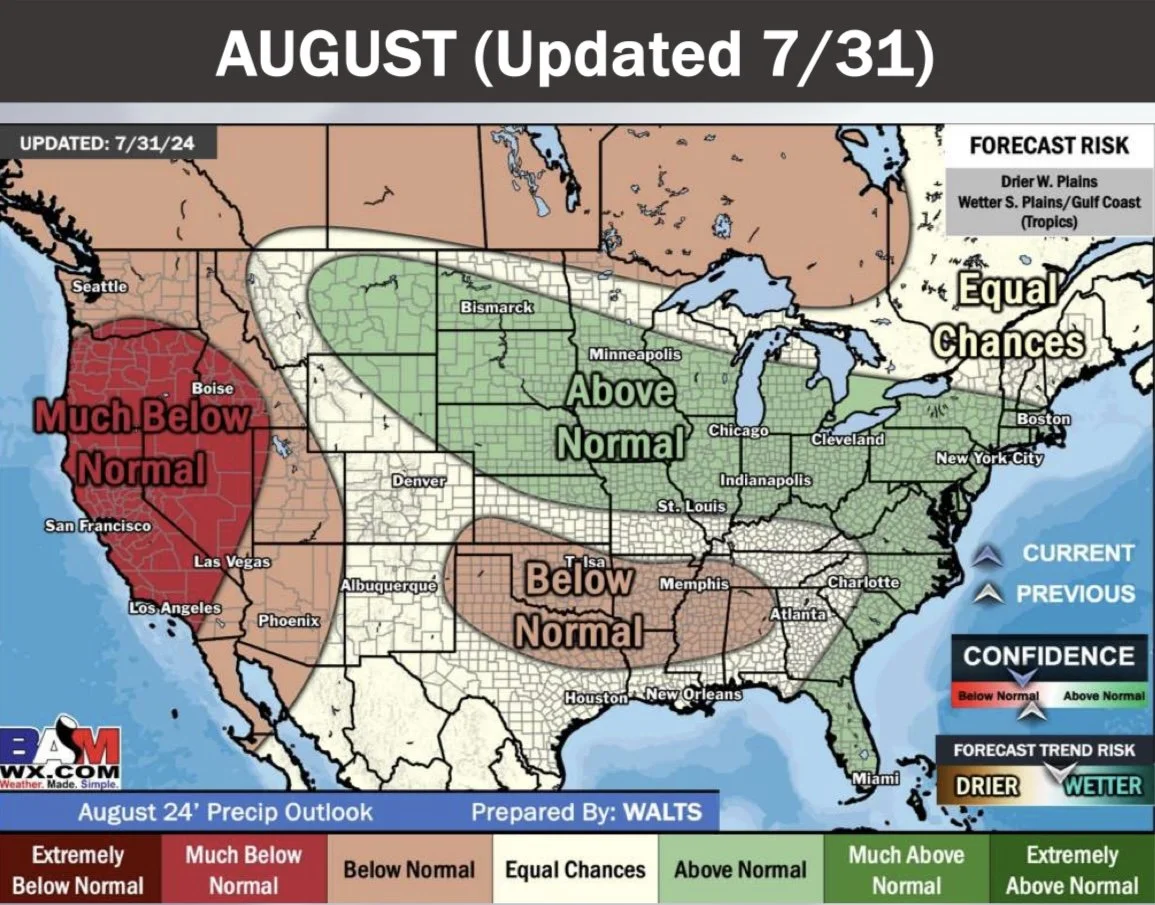
However, the forecasts have shifted due to a polar vortex in the southern hemisphere according to BAM Weather.
Here is their August outlook. It is suppose to now be wetter than normal, with temps average to even cooler than normal.
So right now the outlook looks ideal for crops.
August Temps
August Precip
I have mentioned that weather from here on out will not be all that impactful to the prices of our markets. Not like they are in June & July. Especially to corn.
Yes, beans are made in August, so the crop can grow or shrink the next few weeks. But the market doesn’t gauge weather in August like it does June & July. Yes, if this forecast is wrong and we get some crazy drought in early August soybeans could get a small weather driven rally, but overall it shouldn’t be anything major. The outlook is also not supportive of prices currently.
BAM had a great full weather breakdown this morning. If you want to watch it: Click Here
For BAM's direct weather updates: Click Here
Today's Main Takeaways
Corn
Corn breaks below $4.00, taking out that key support of $4.03 we had been talking about.
This is despite a flash sale today and weekly ethanol production hitting an all time high.
The weather won’t make a major impact on corn, with corn 70-80% pollinated.
This means demand will have to take charge if we want substantially higher prices.
Right now corn is actually very competitive on the global market, but we have yet to see much business.
Supply & demand and determine prices.
Right now the supply will likely be there.
StoneX has their yield estimate at 183.8 bpa.
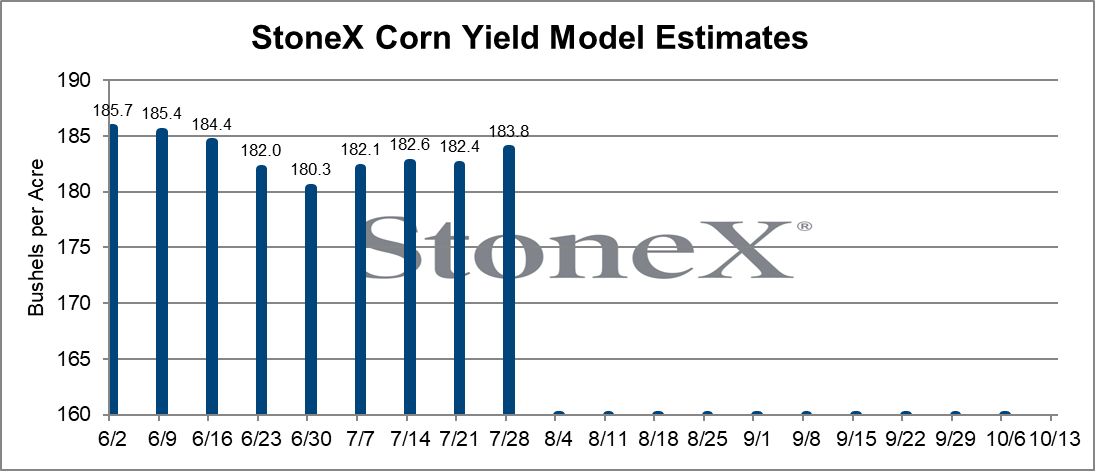
I do not think yield is 184, but it is VERY POSSIBLE. We have had a very ideal growing season for the most part.
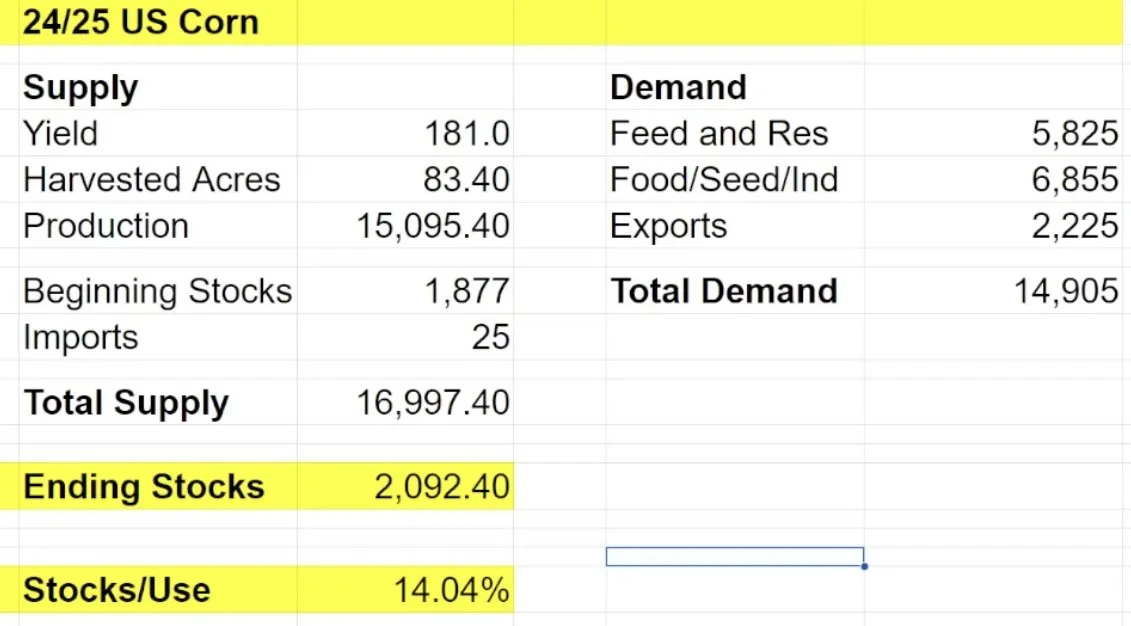
Standard Grain put out some good info the other day.
He went over what our balance sheet could look like for corn.
With our current 181 yield, we have a carryout of 2.09 billion and a stocks to use ratio of 14%.
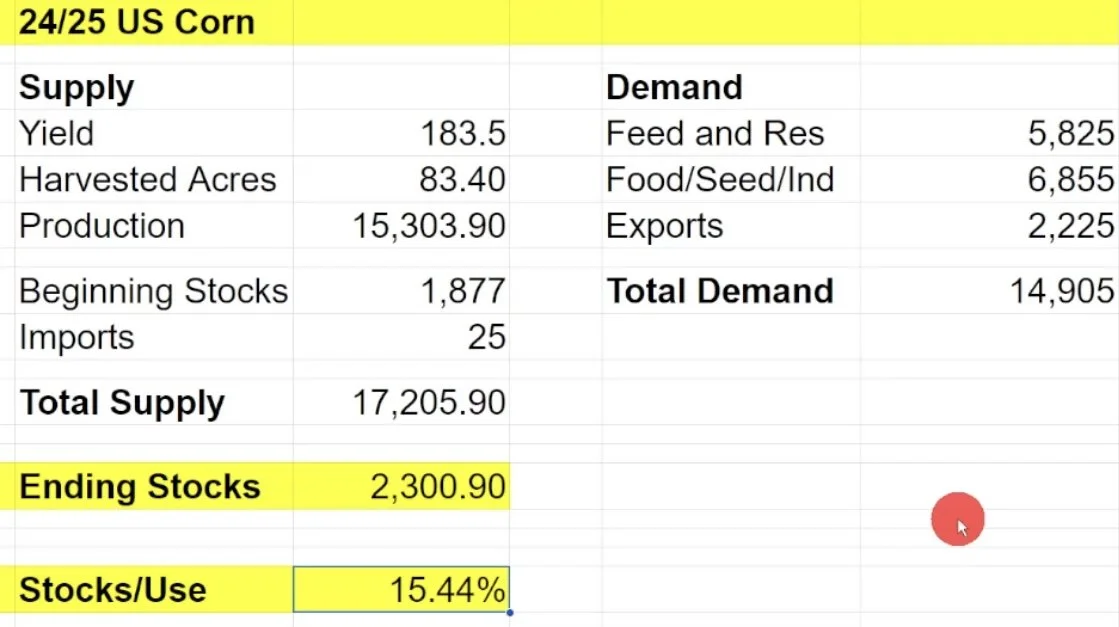
Without changing the demand side of the balance sheet, if yield were to get bumped to this StoneX number of 183.5 we would be looking at a carryout of 2.3 billion and a stocks to use ratio of 15.4%.
Spreadsheet from Standard Grain
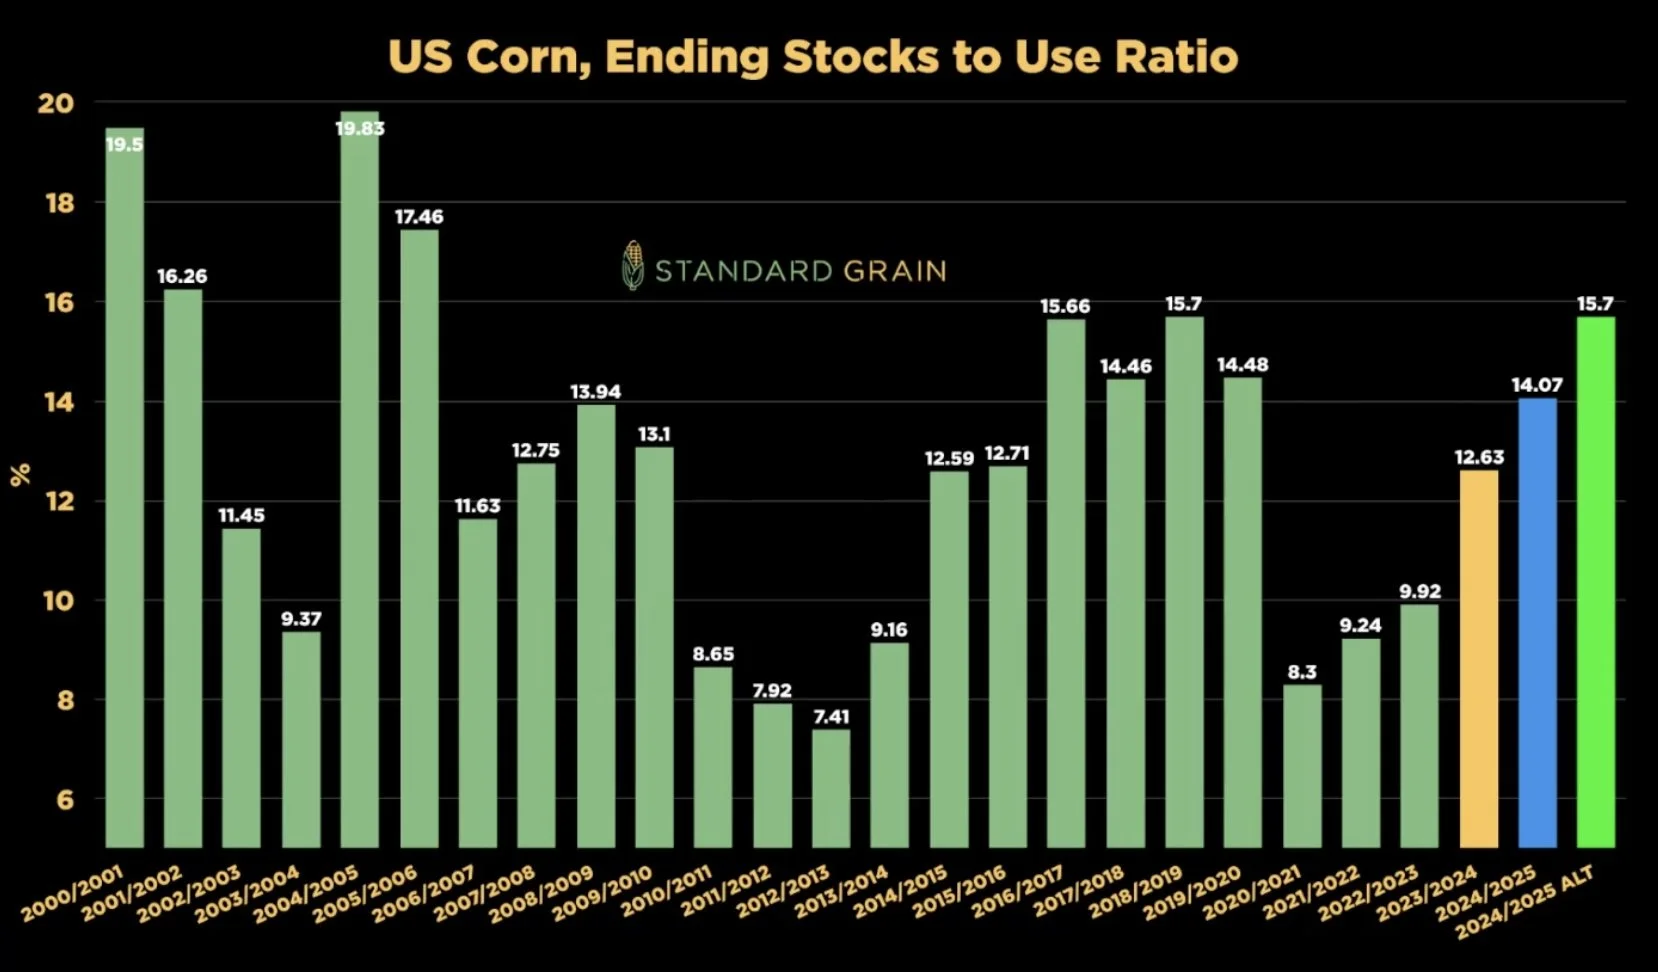
IF this were the case, our stocks to use ratio would be on par with that of 2019 and other bear market years.
Prices in 2019 were awful. It makes it even worse considering the cost of production as well as interest rates are now higher.
(Blue is 14% stocks to use, Green is 15.44%)
Chart from Standard Grain
I am only pointing this out to show you that yes corn could go lower from here. As a producer your risk is to the downside.
Right now the market thinks we have a 183 yield. How many of you think you have a record crop? I haven’t spoke to many who think they have a record crop. So it is a little hard for me to fathom we are 183 when our record is 177. The market would be extremely caught off guard if we are closer to 175 than 185. To go along with that, if demand increases our carryout will decrease all that more. The funds need a reason to cover, that could very well be one.
Personally, I think we are at levels that will create demand. Thus pushing prices higher. I think we could actually rally into harvest.
But until the charts confirm we are done going down, our risk is lower and the path of least resistance is also lower.
Take a look at this continuous corn chart.
We are currently in "bear market" territory.
In 2014 we didn’t bottom until $3.18. I do not think that happens this year. However $3.50 or so corn is possible if demand does not pick up and we wind up with this monster crop.
The continuous chart and that purple trendline suggests we might not find a bottom until the $3.40 area.(Yellow circle).
We found support at $3.40-$3.50 in several years during bear markets. (Dark purple line).
The only years we went lower than that were 2014, 2016, and 2020. Which means I think $3.40 is about the lowest we could possibly go. That is not my prediction, I just think that is worst case possible. We could bottom before, impossible to say until the charts confirm a bottom.

Taking a look at the daily chart.
We broke below $4.03 our key support.
Now this could either be a bear trap and we reverse right here (several weeks ago I said we could get a $3.99 print only to reverse), or we are going to go down to $3.80. Which is our implied downside target.
If we go all the way down to $3.80, we will probably bounce back up and test $4.00 again as that will be our new resistance.
Until the charts confirm a bottom, the risk is lower.
For me to believe we found a bottom, nothing has changed the past few weeks. I still need above $4.26 to say we are going higher.
So if you have unpriced grain, I still like protecting the downside until that $4.26 level is broken. I especially like protecting with puts if you have to move something off the combine.
I think we will get a demand led rally later this year or into next, but the hardest part is guessing where the bottom is first. So protect that risk.
Give us a call if you want to talk about what makes the most sense for your operation. (605)295-3100

Dec Corn
Soybeans
Soybeans find some support falling the recent blood bath.
Nov beans are now -60 cents off their highs.
The chance for a weather scare in beans are getting smaller and smaller. It is still possible, but unless the forecasts change it does not look likely. Yes, the forecasts can change, as longer term forecasts change all the time. But right now, the outlook for August favors cooler and wetter conditions.
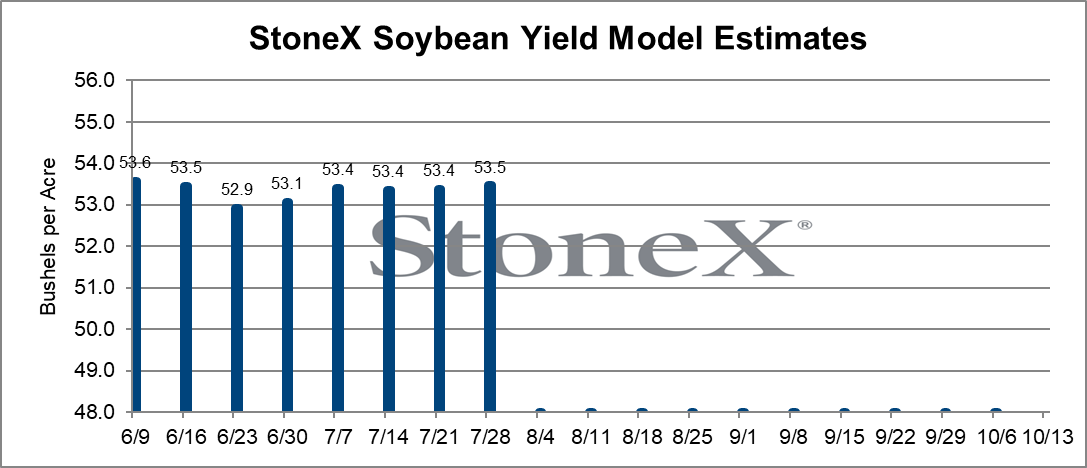
Along with corn, the trade expects record yield for beans. StoneX has 53.5 bpa.
However, the more concerning factor is demand.
We still have the worst new crop book of sales in 20 years. Now yes seasonally this is where we start to see an uptick in exports into August and September. Which should help support prices.
China either has bought more than they have announced from Brazil, or they are going to have to consume 250 million less bushels.
I think China will start to come in here, especially at these low levels. But what if they don’t? That is the biggest risk.
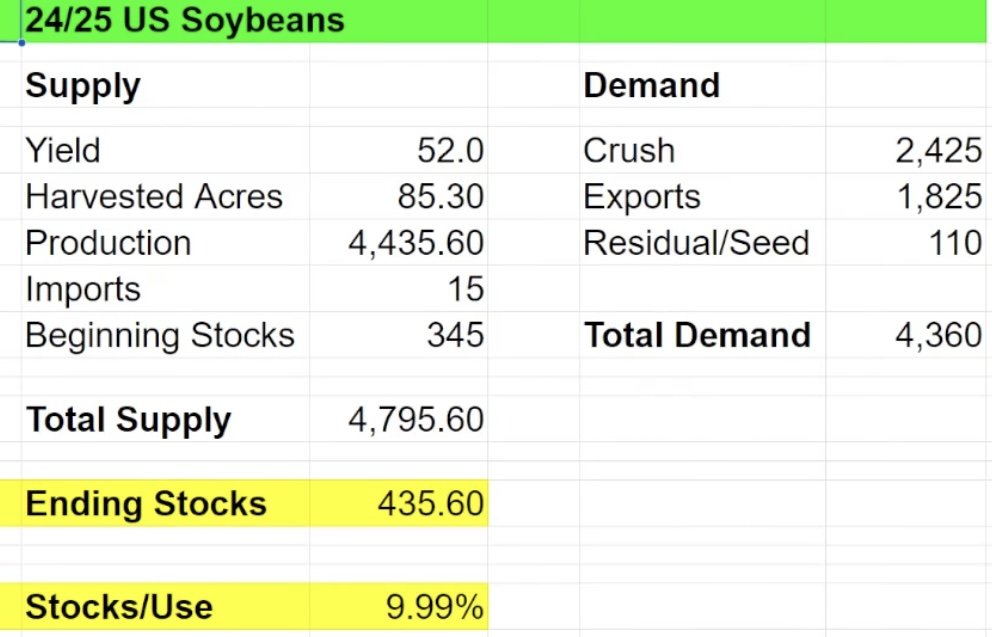
I wanted to again show you the same thing in beans as I did corn, what carryout & stocks to use could look like from Standard Grain.
Right now with a 52 bpa yield, we have a carryout of 435 million and a stocks to use ratio of 10%. Those numbers are not bullish, but also do not scream bear market.
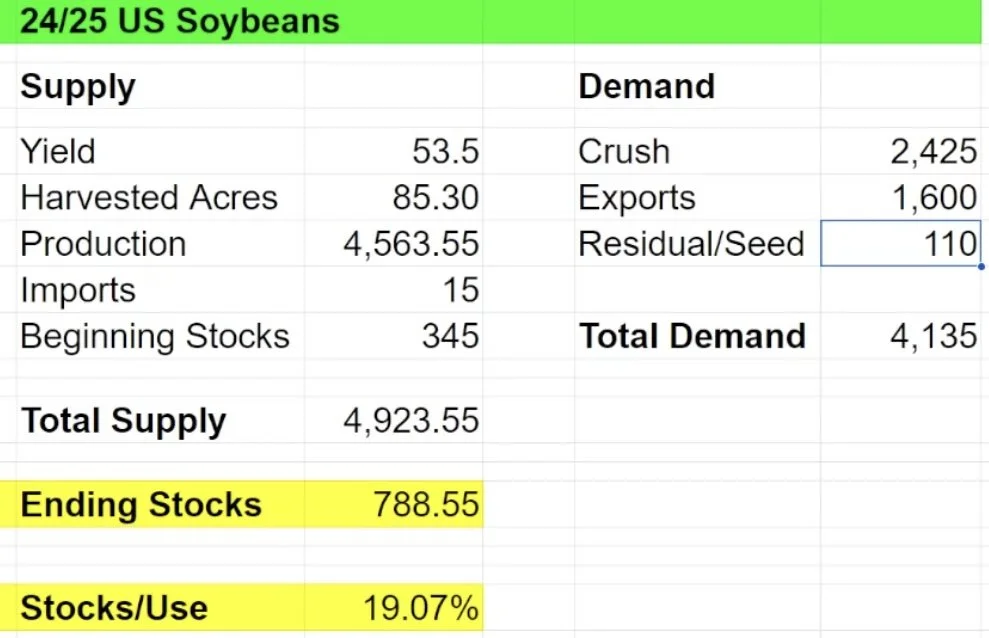
However, let's say China does not start to buy. Many people think the USDA is overstating demand for beans because we have such a bad book of sales.
So in the 2nd chart, Standard Grain raised yield to 53.5 and decreased export demand from 1.825 to 1.600. If that happened, we could see a carryout of nearly 800 million and a stocks to use ratio of 19% which would be the 2nd largest ever only behind 2019's trade war.
I do NOT think this happens. But it would be naive to say it is impossible.
Spreadsheet & Chart from Standard Grain

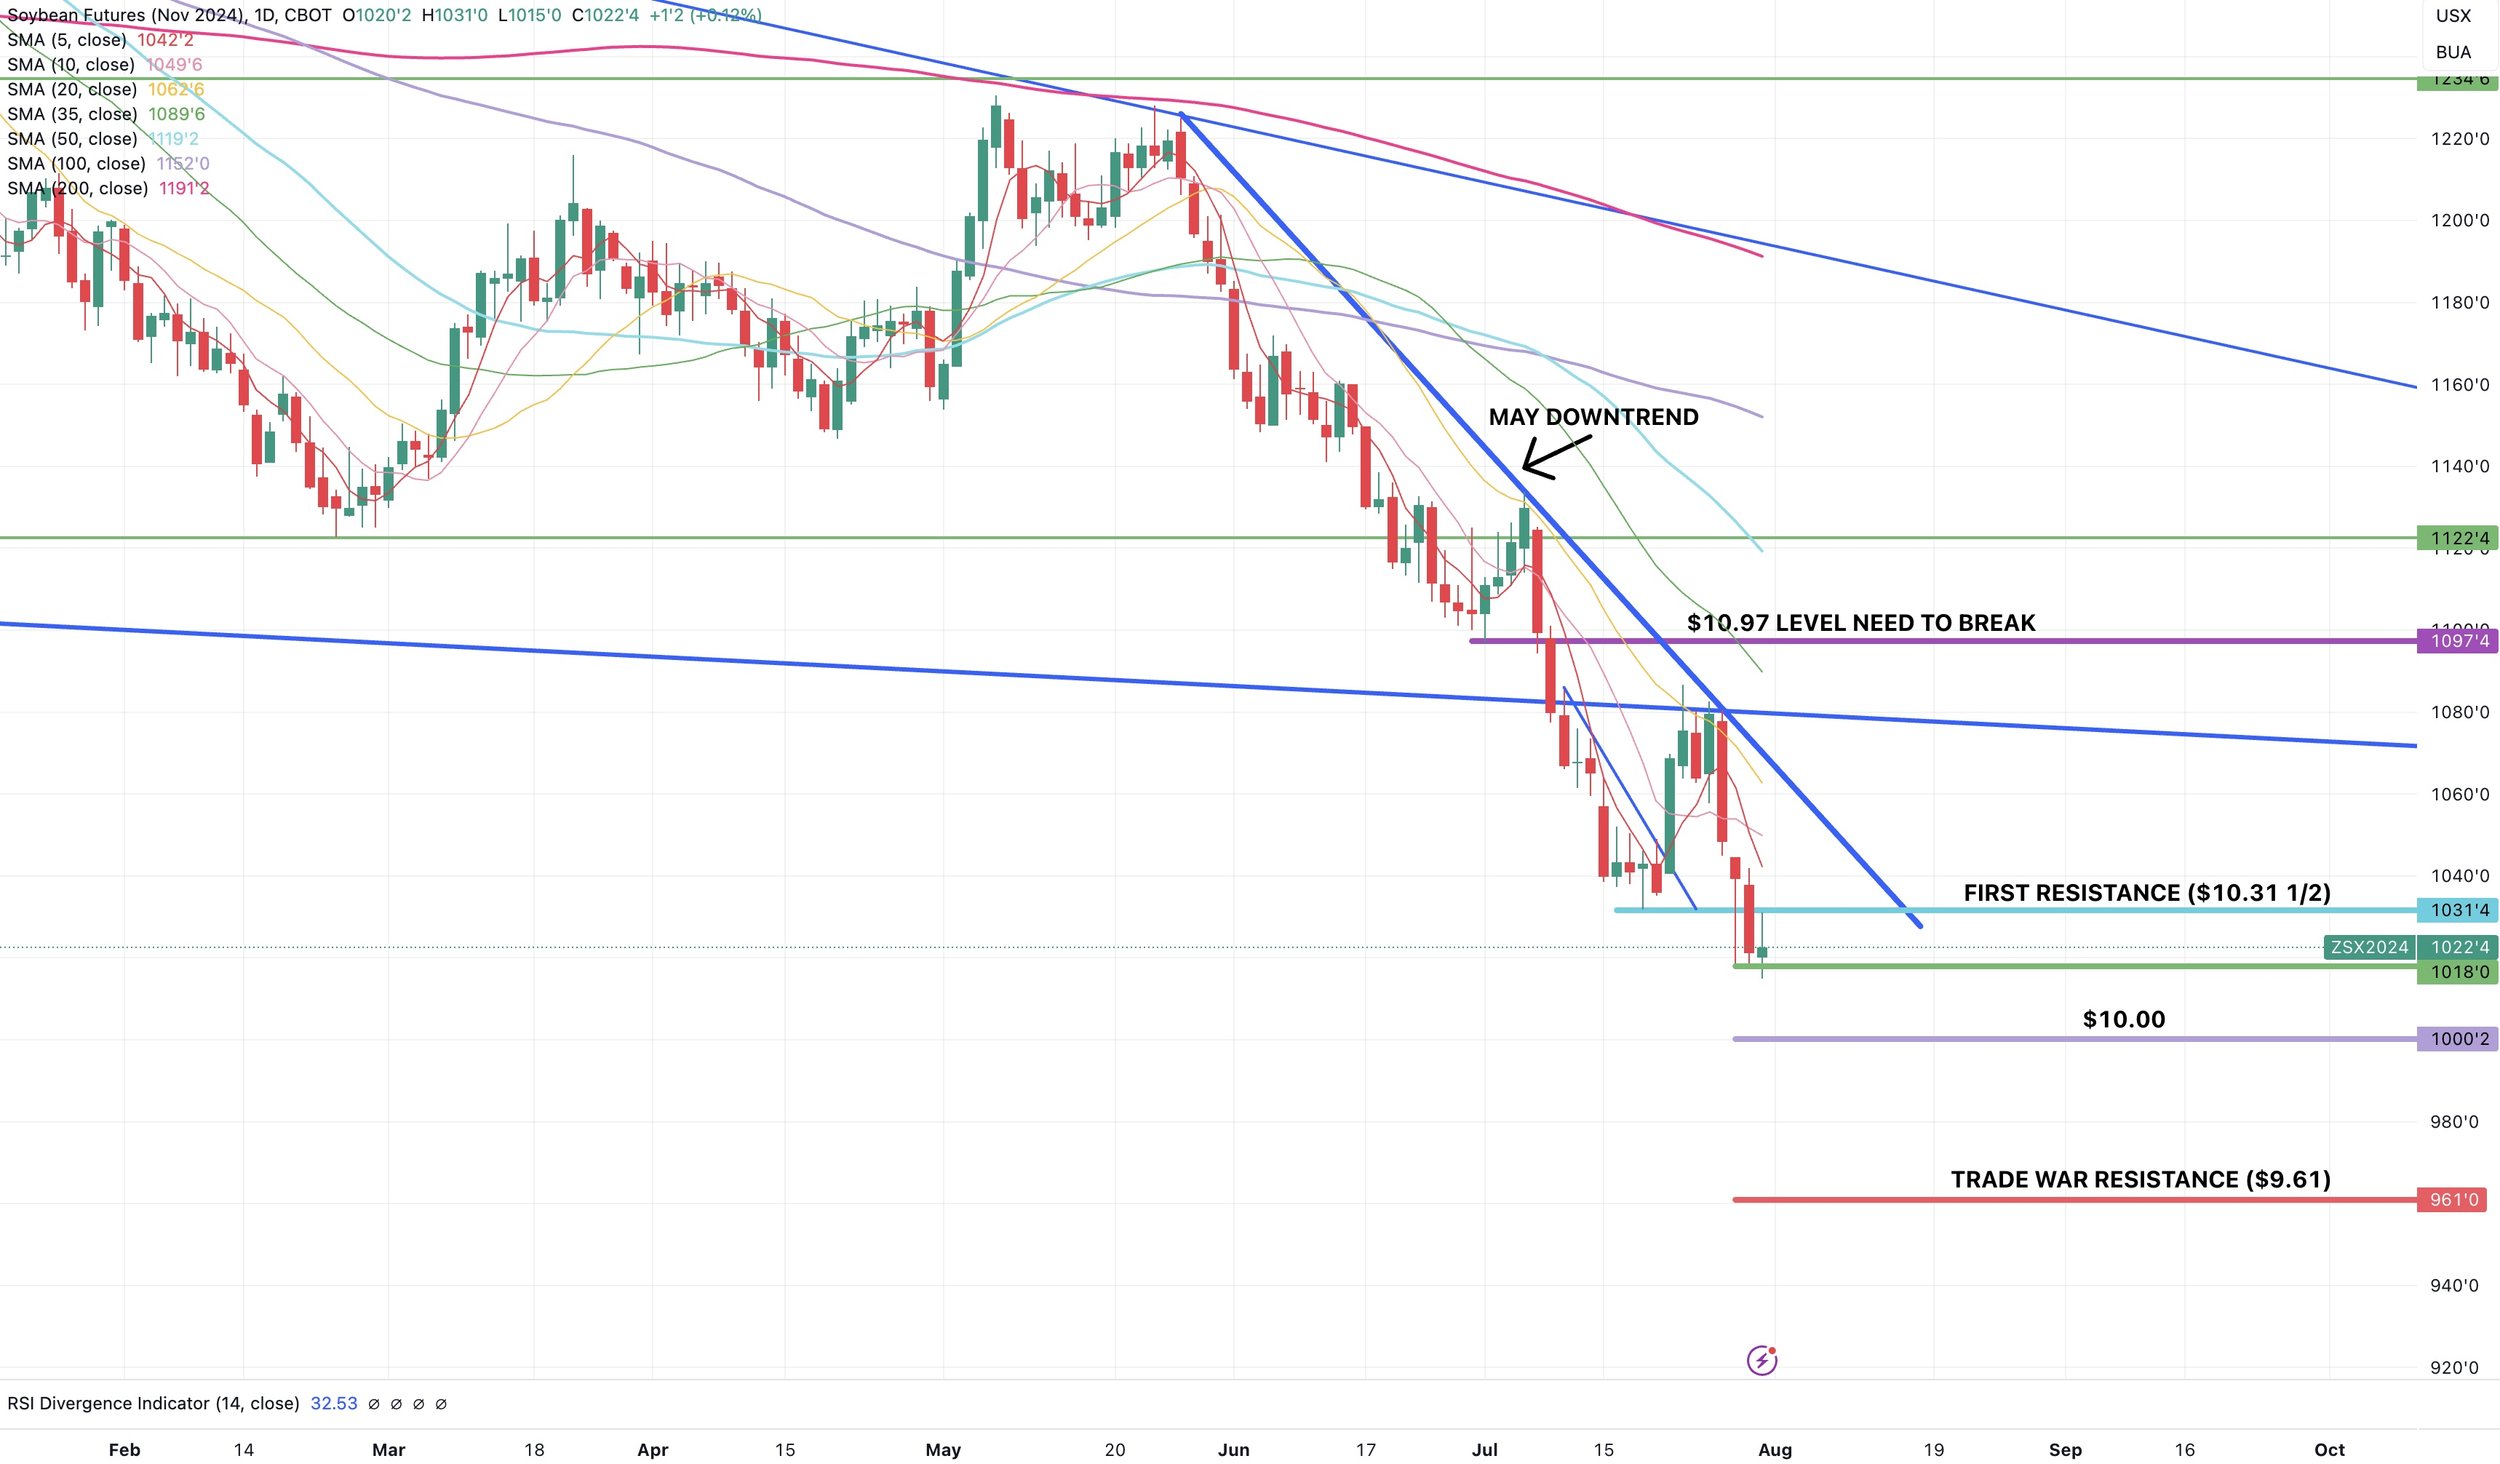
How low could beans go?
If we take a look at the continuous chart, we could still go a lot lower if China decides to not step in here.
During the trade war, our resistance was $9.60. Often times we see old resistance turn into new support. (Purple line).
I would be lying if I said that wasn’t possible and we couldn’t see another -60 cents of downside.
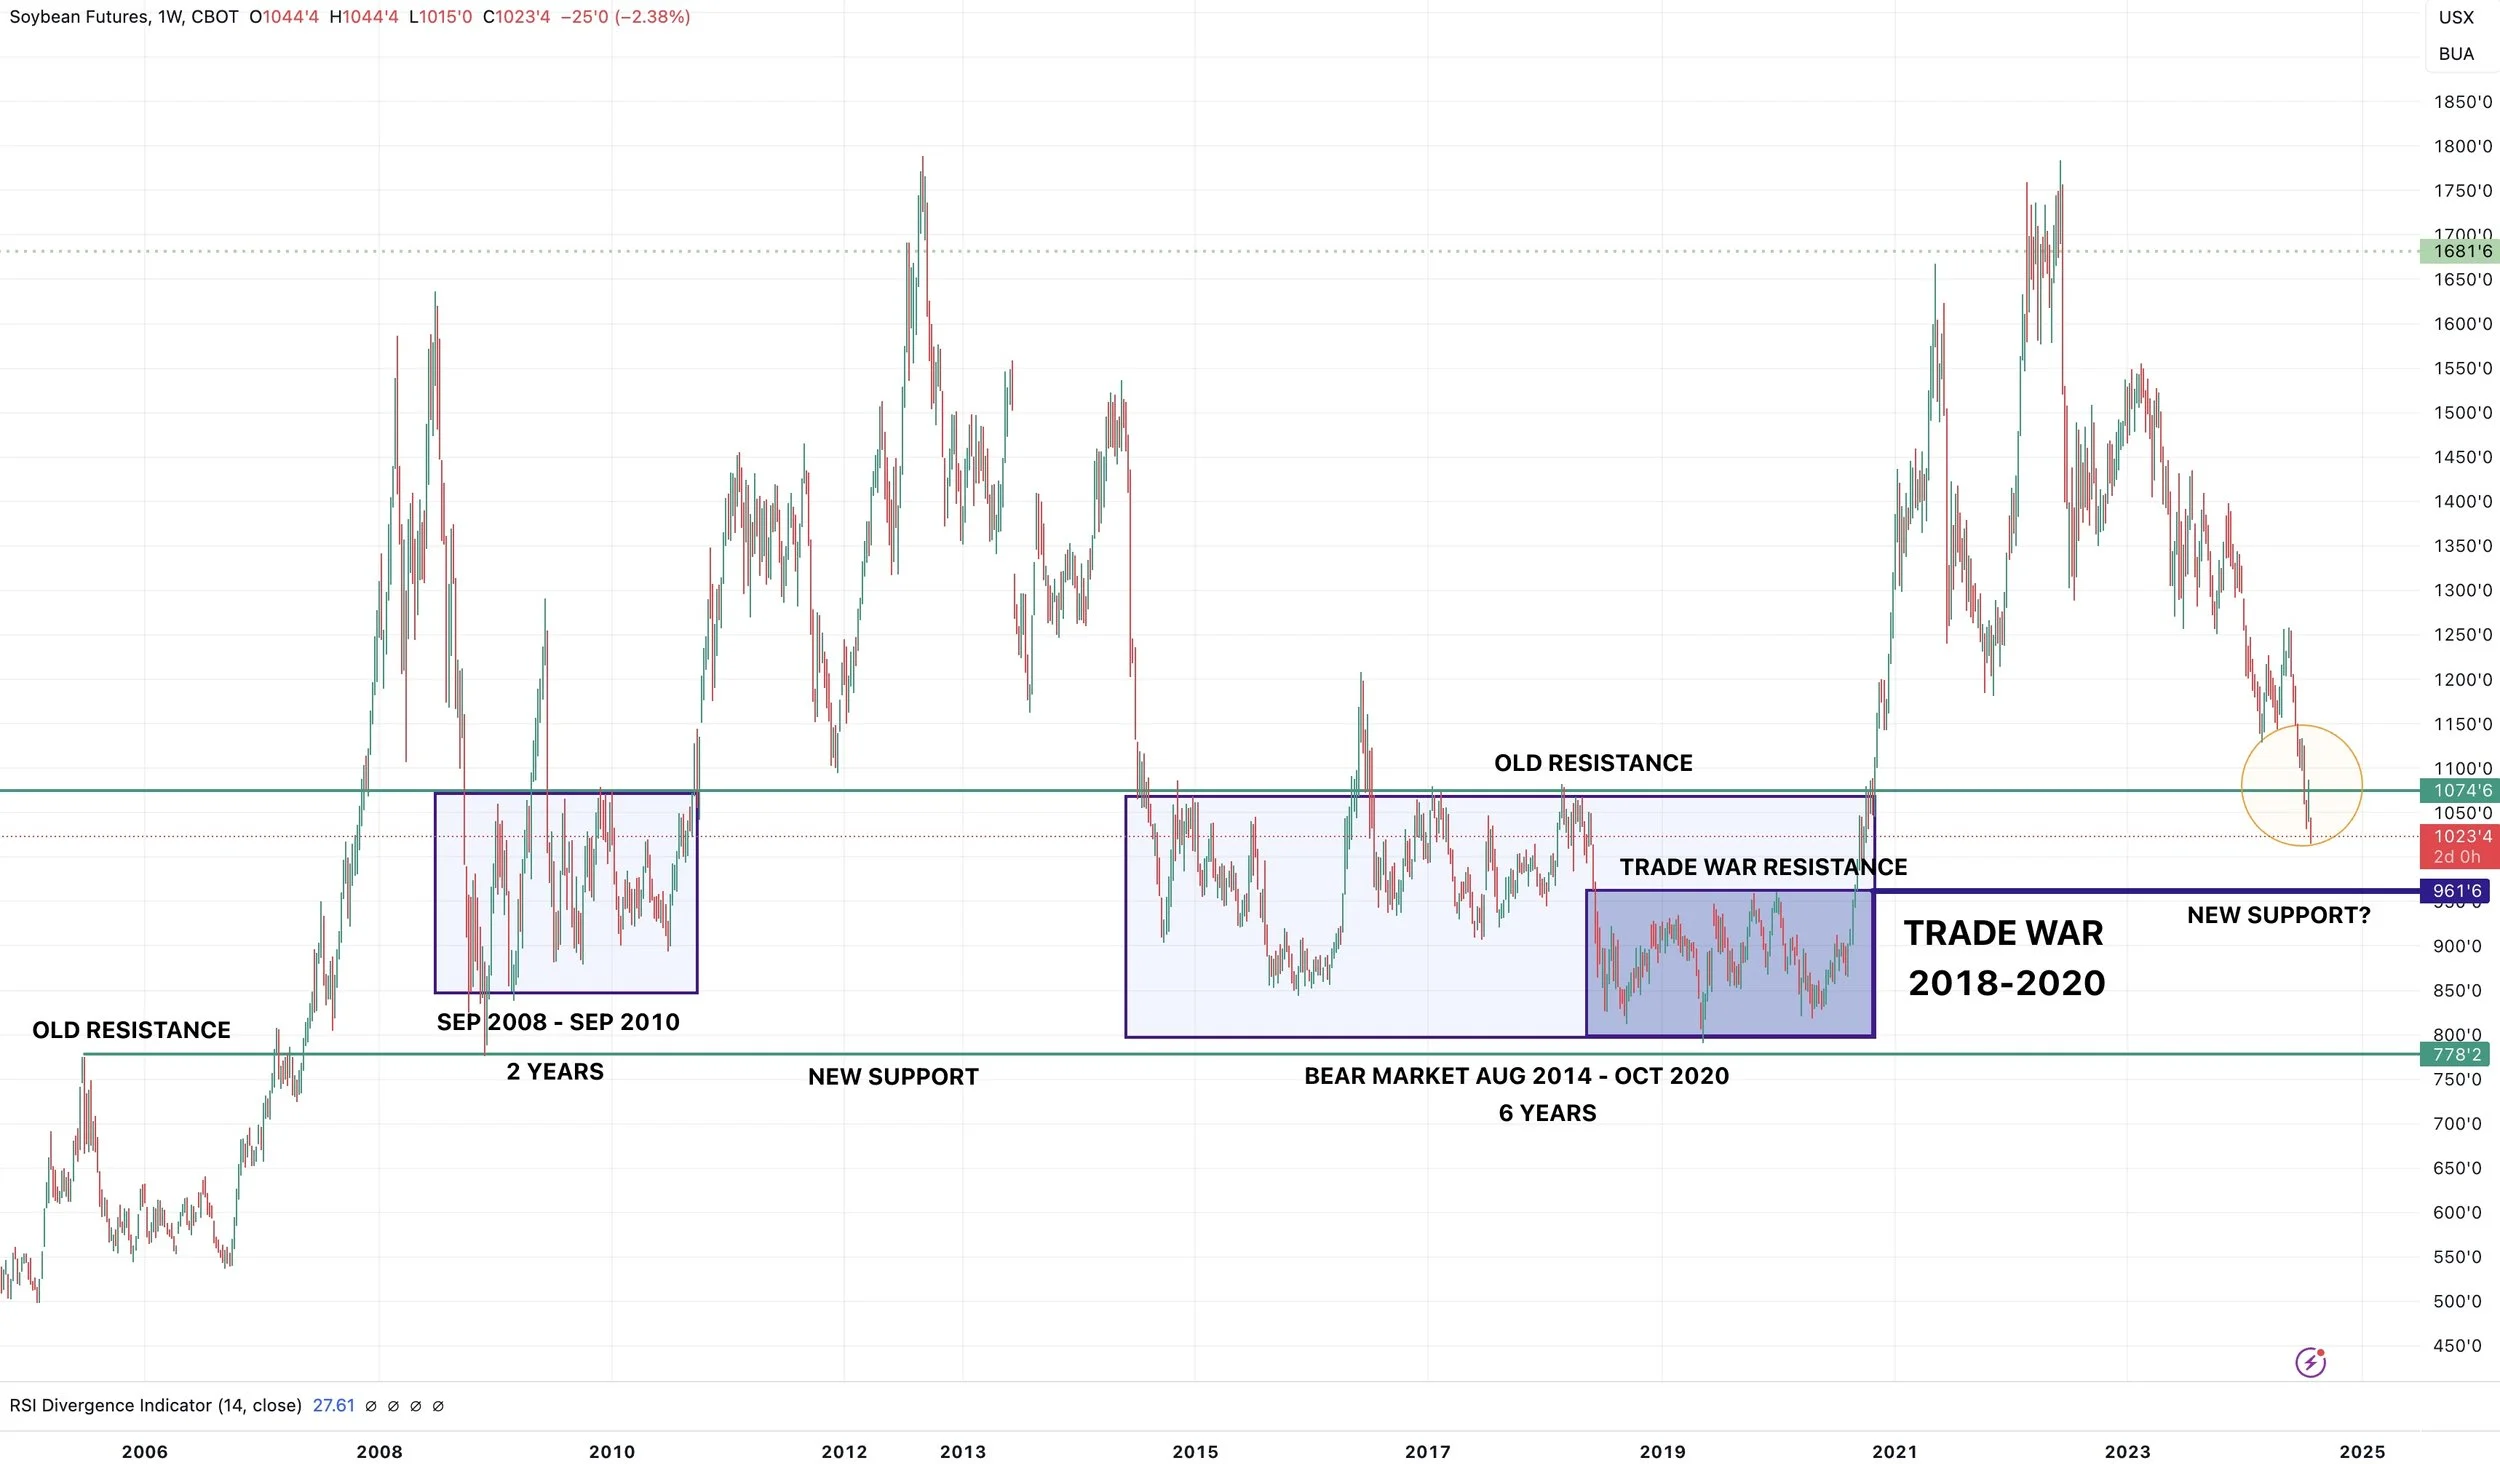
Soybeans could bounce tomorrow or continue lower until October like we did in 2014. Some well respected chart guys say we could go into the low $9's. I do not think that happens, but anything is possible. Nobody thought we'd see $10.00 a few months ago.
The biggest thing soybeans need is demand. Personally I think these lower prices will create more demand. Thus higher prices long term. If China starts to come in here and buy, this market could get excited fast with the funds record short. The risk is if they do not.
I do not know where the bottom is, all I can do is wait for the charts to confirm we put in a bottom. For me, I still need $10.97 like I've been saying, which is now a long ways away after the recent meltdown.
I have been preaching puts for those with unpriced bushels, especially after that recent rally because it made it cheaper to do so.
If you have unpriced grain, your risk is still to the downside. So you should still keep puts on. ESPECIALLY if you have to make sales off the combine. You can either add a floor here, or make a sale and grab a call. Depends on your situation. Ideally, keep a floor until you make a sale. If you did add puts at the top of the recent rally, not a bad idea to cash those in for profit.
Nov Beans
Wheat
Wheat market mixed. We posted new lows Monday and have continued to chop at the bottom of that range ever since.
Spring wheat ratings took a hit Monday, coming in -3% worse than expectations at 74% G/E. However that is still a very good ratings. We also had the recent wheat crop tours that suggests we have a great crop.
So the trade sees a great SW crop. Demand is on the weak side. We have seen other countries buying a ton of wheat, however the US is seen as a back up supplier to the world. So we haven’t got any business. However, that shows that global values of wheat are at a level that is creating demand.
The Black Sea is hot and dry, but the market doesn’t care. We are past prime growing season there as well
Argentina is facing freezing temps. Argentina is also dealing with a drought, having their driest month in 60 years. So analysts dropped Argentina wheat acres by -3%.
However, this is a non-factor as Argentina only makes up for 2% of global wheat production. They could lose half their crop and it wouldn’t matter a ton to wheat.
Outside of that, not a ton else for the wheat market.
I can’t think about calling a bottom until we at least take out $5.56, but ideally for me to be confident the bottom is in I wan to see $5.67.
If you made sales on our sell signal back in May or anywhere near the highs, not a bad spot to play it long. But I'd personally wait until we know the bottom is in.
If you didn’t make sales or are behind, the best thing you can do is grab puts to protect your downside. If we get a nice bounce then you can look to reward it with a cash sale. But until then, keep puts in case we continue to fall. Because we certainly can.
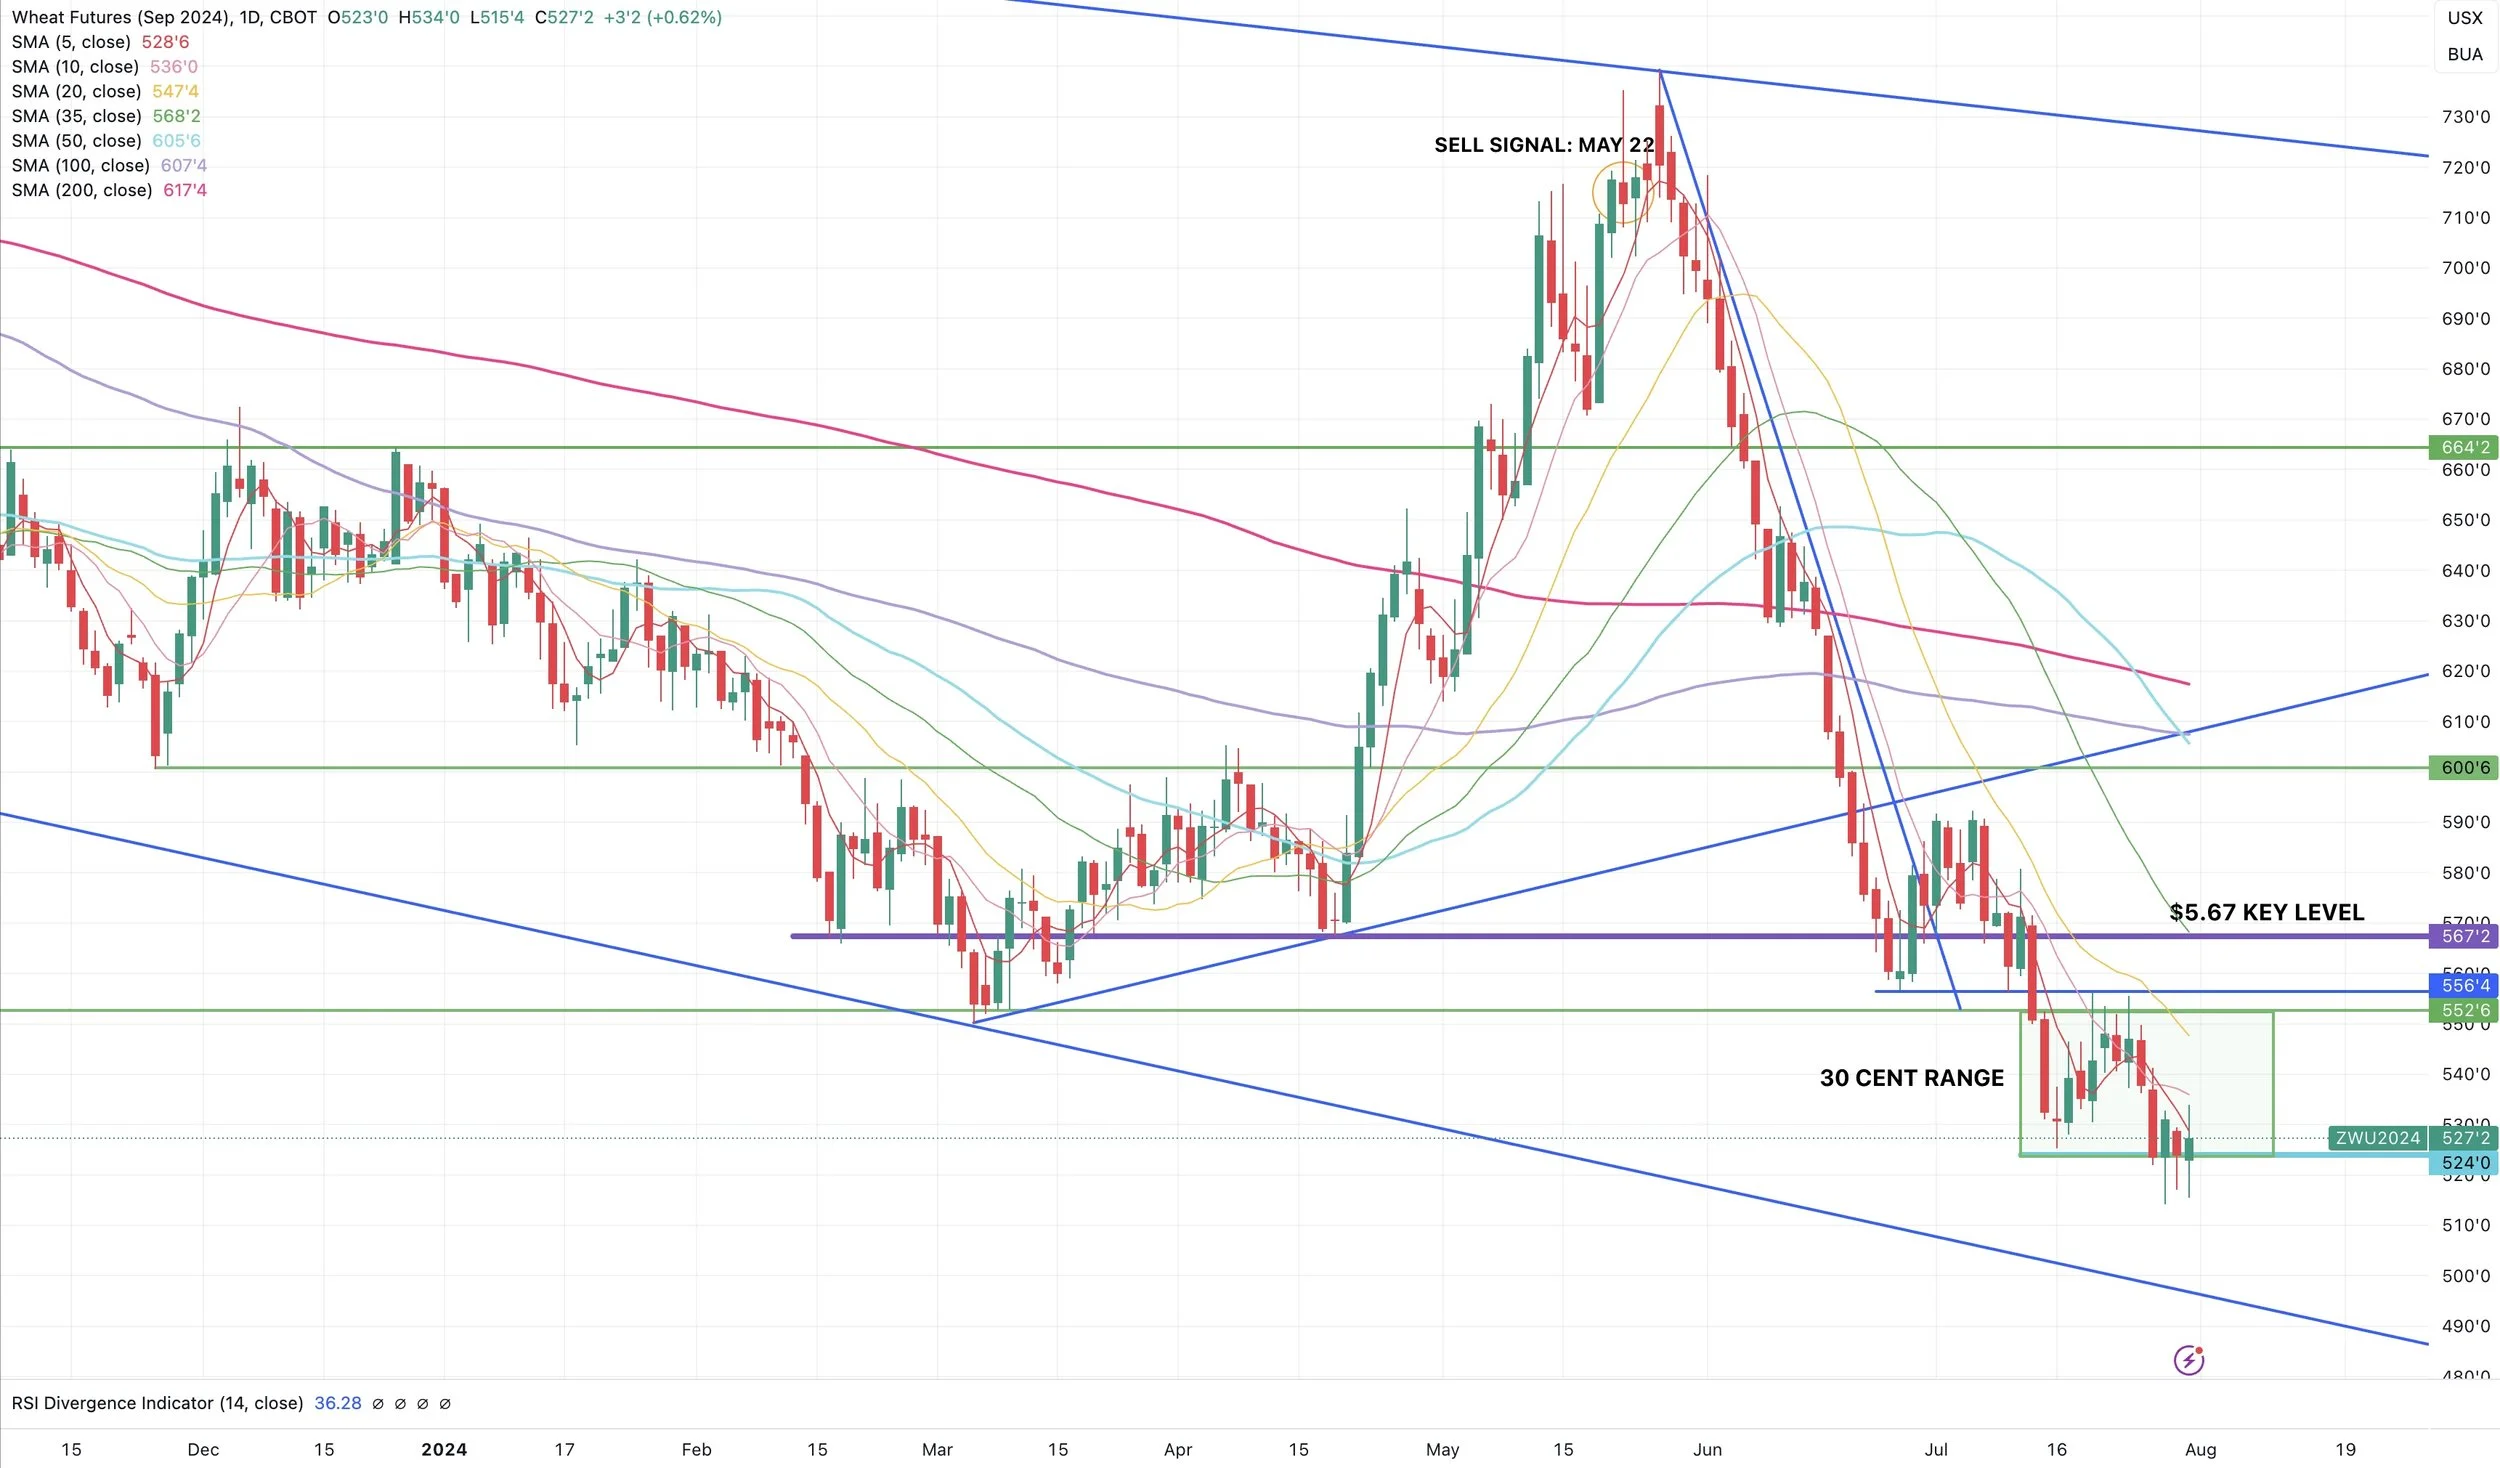
Sep Chicago
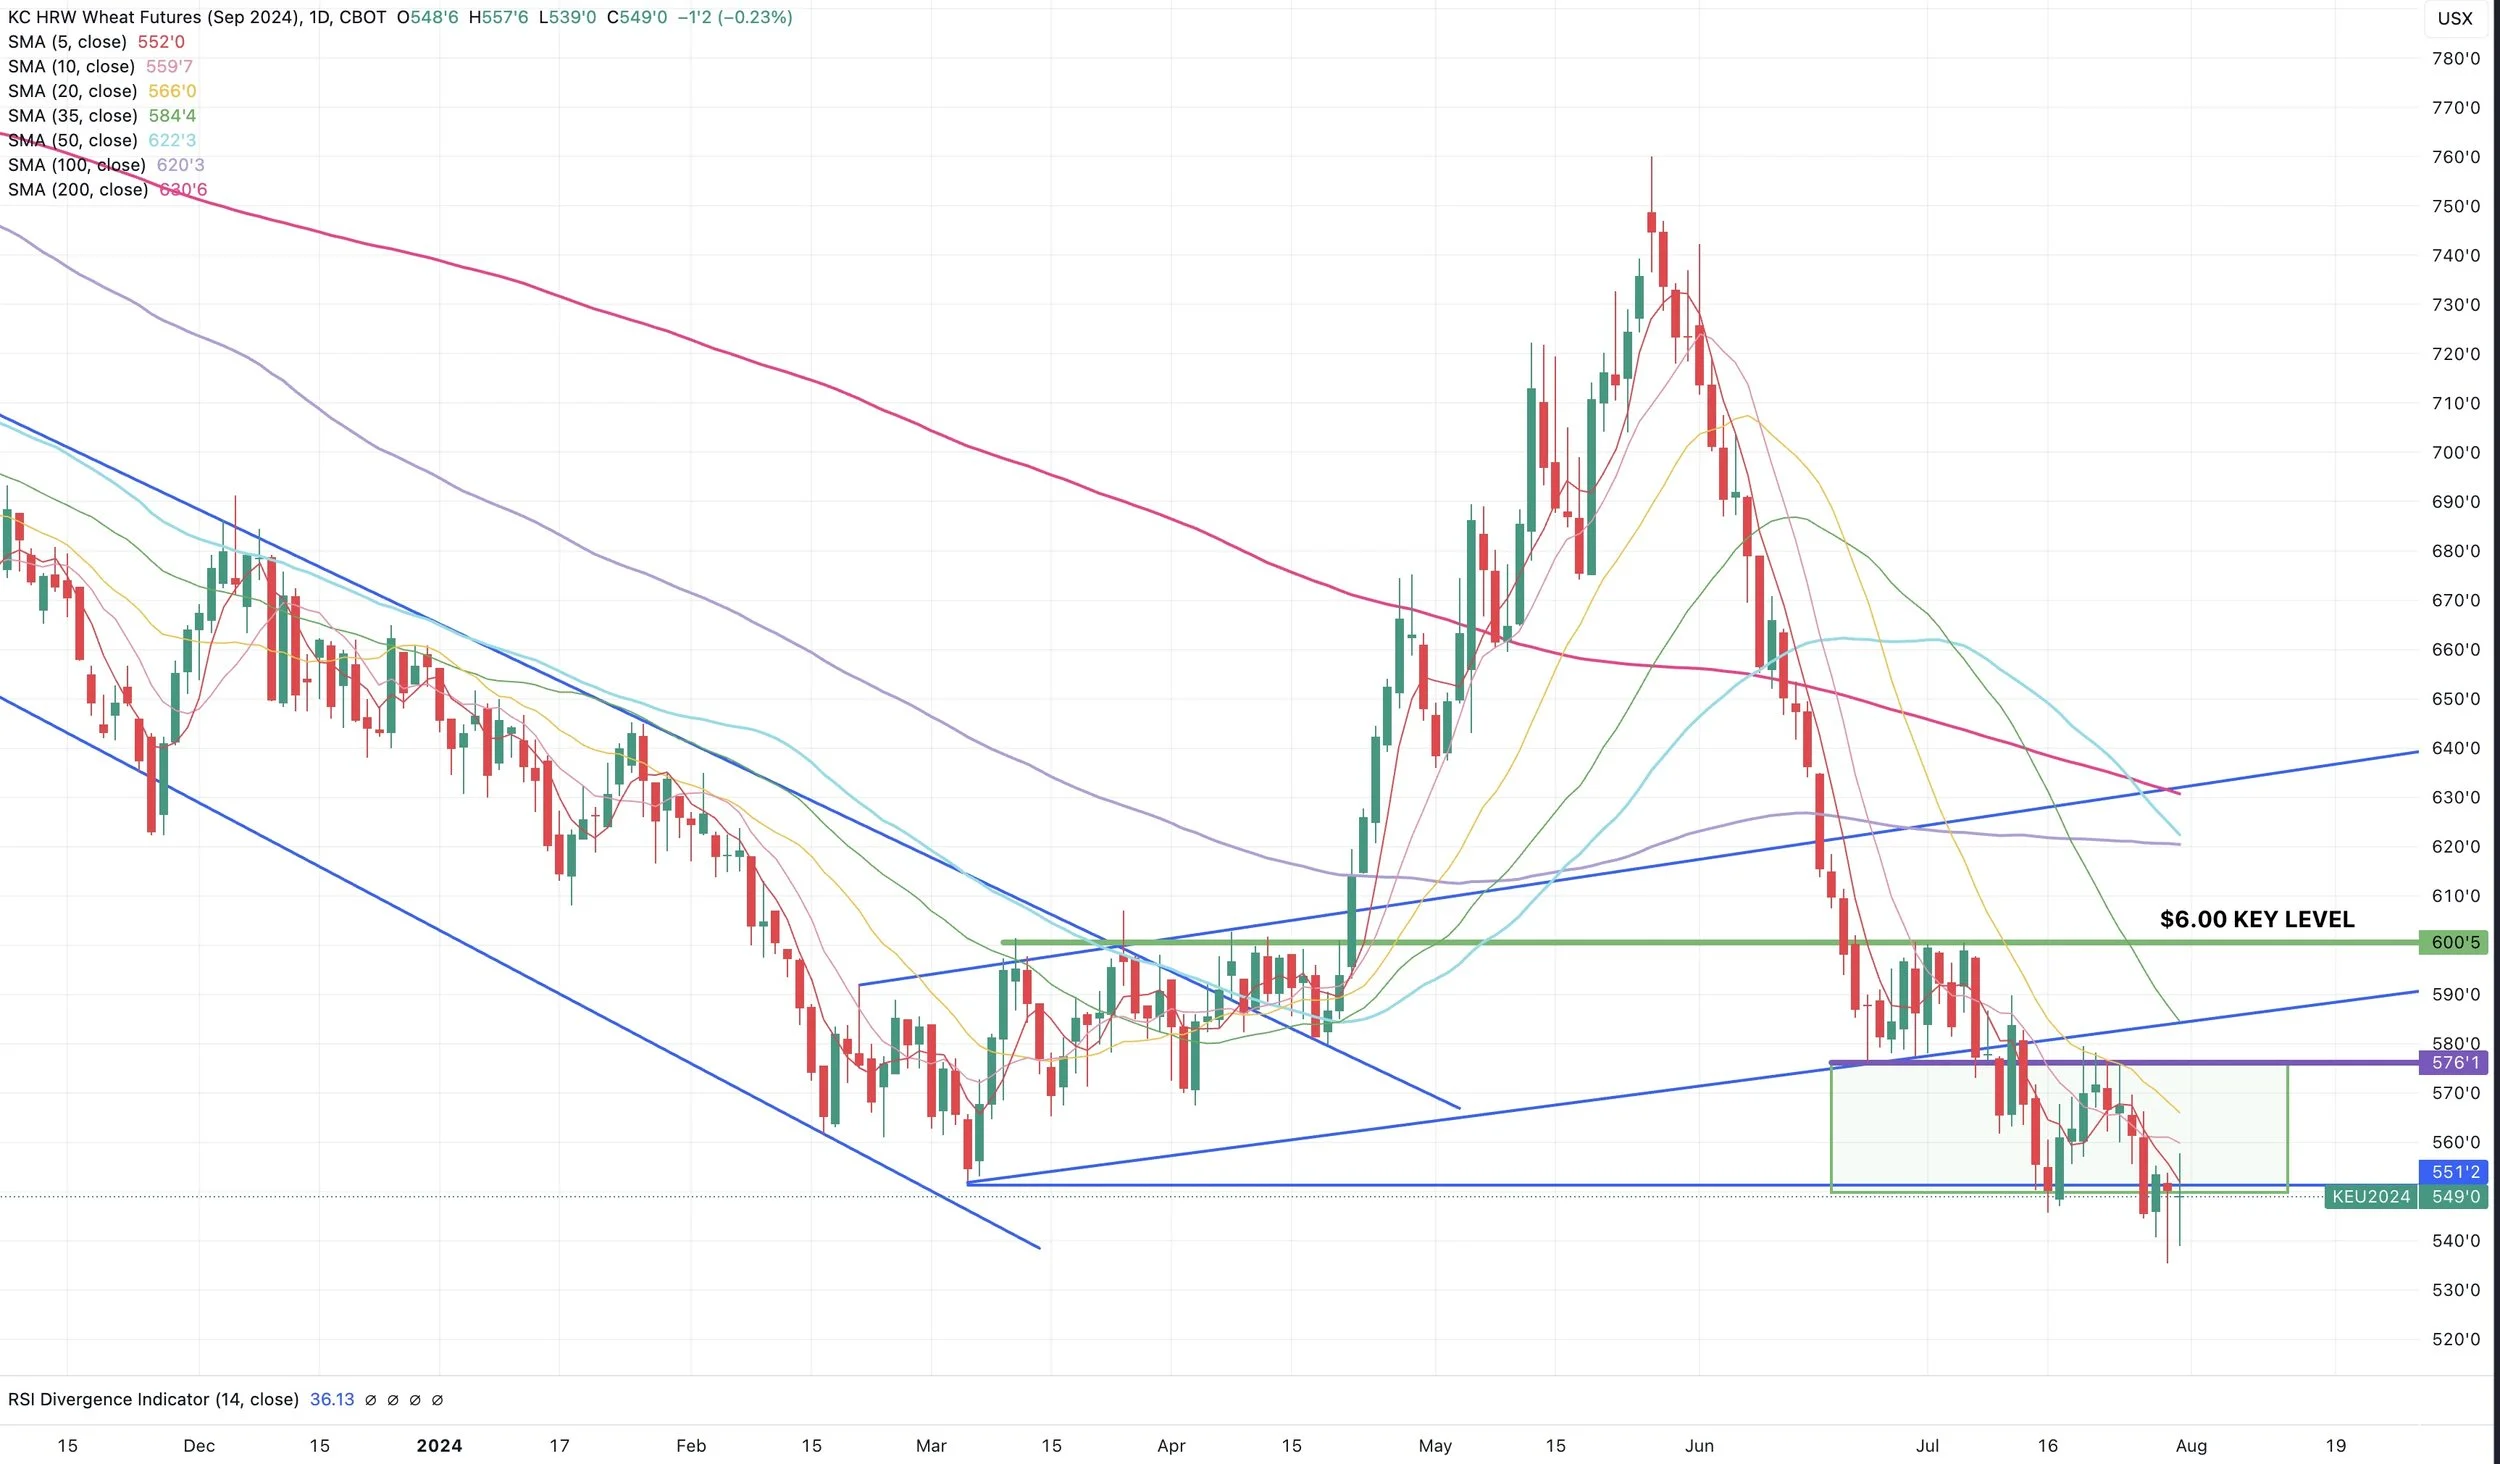
Sep KC
Want to Talk?
Our phones are open 24/7 for you guys if you ever need anything or want to discuss your operation.
Hedge Account
Interested in a hedge account? Use the link below to set up an account or shoot Jeremey a call at (605)295-3100 or Wade at (605)870-0091
Check Out Past Updates
7/30/24
GRAINS FAIL REVERSAL BACK NEAR LOWS
7/29/24
GRAINS SHOW SIGNS OF REVERSALS
7/26/24
BLOOD BATH IN GRAINS: EPA REVERSAL & WEATHER
7/25/24
CHINA, DROUGHT, FUNDS & RISK
7/24/24
BEANS LOWER DESPITE DROUGHT TALK
7/23/24
BACK TO BACK GREEN DAYS FOR CORN & BEANS: MARKETING DECISIONS
7/22/24
BEST DAY FOR GRAINS IN A LONG TIME
7/19/24
DULL MARKETS: STRATEGIES TO USE IN GRAIN MARKETING
7/18/24
DEMAND, CHINA, POLITICAL PRESSURE, & TECHNICALS
7/17/24
DIFFERENT GRAIN MARKETING SCENARIOS YOU MIGHT BE IN
7/16/24
RELIEF BOUNCE FOR GRAINS
7/15/24
GRAINS HAMMERED. TRADE WAR FEAR
7/12/24
USDA REPORT: LOW PRICES CREATING DEMAND
7/11/24
USDA TOMORROW
7/10/24
GRAINS CONTINUE TO GET HAMMERED
7/9/24
RAINS, RECORD FUND SELLING & 2014 COMPS
7/8/24
PUKE SELLING, RAIN MAKES GRAIN & FUNDS RECORD SHORT
7/3/24
THIN HOLIDAY TRADE FOR GRAINS
7/2/24
BEARISH WEATHER, RECORD SHORTS, & CHINA
7/1/24
SUPPLY WILL BE THERE, BUT CAN DEMAND LEAD US HIGHER?
6/28/24
GARBAGE USDA REPORT
6/27/24
BIGGEST USDA REPORT OF YEAR TOMORROW
6/26/24
USDA PREVIEW & COUNTER SEASONAL RALLIES?
6/25/24
POSSIBLE RISKS & OUTCOMES THIS USDA REPORT COULD HAVE
6/24/24
VERY STRONG PRICE ACTION: RAINS & USDA KEY
6/21/24
DON’T PUKE SELL. ARE YOU COMFORTABLE RIDING THIS STORM?
6/20/24
RAIN OR NO RAIN FOR EAST CORN BELT?
6/18/24
WEATHER MARKET ENTERING FULL SWING
6/17/24
SELL-OFF CONTINUES DESPITE FRIENDLY FORECASTS
6/15/24
EXACT GRAIN MARKETING SITUATION BREAKDOWNS & WHAT YOU SHOULD BE DOING
6/12/24
USDA SNOOZE: WHAT’S NEXT?
6/11/24
USDA TOMORROW
6/10/24
IS USDA OVERSTATING CROP CONDITIONS? DOES IT MATTER?
6/7/24
WEATHER & USDA NEXT WEEK
6/6/24
ARE GRAIN SPREADS TELLING US SOMETHING?
6/5/24
GRAINS NEARING BOTTOM? 7 DAYS OF RED
Read More
6/4/24
HIGH CORN RATINGS, SCORCHING SUMMER, & RUSSIA CONCERNS
Read More
6/3/24
5TH DAY OF THE SELL OFF. ARE YOU COMFORTABLE?
5/31/24
4 STRAIGHT DAYS OF LOSSES IN GRAINS
5/30/24
I DON’T THINK SEASONAL RALLY IS OVER. WHAT IS THE PLAN IF I’M WRONG?
5/29/24
PLANTING DELAY STORY VANISHES. BUT IS REAL STORY OVER?
5/28/24