WILL WE GET REPEAT OF 2012 OR 2013?
WEEKLY GRAIN NEWSLETTER
Here are some not so fearless comments for www.dailymarketminute.com
2012 vs 2013 vs 2023
Which history will be repeating itself or will we be writing a new history? When it comes to corn price action?
That’s the billion dollar question. A question that will be debated with every forecast change, ever missed rain event, and every unexpected moisture event. What complicates this question is we are dealing with a futures market that in theory has priced in everything that is presently known and a large amount of what is unknown or assumed to be in the future.
Below is a chart showing 2013, 2023, 2022, and 2021. Many times in the past several weeks have we shown the 2012, 2013, and 2023 comparison. 2012 traded put in a low in the middle of May followed by about a month of choppy trade before exploding higher in the middle of June, while making it’s high on the August USDA report.
Presently the corn market appears to have priced in what the USDA printed or assumes to be trend line yield. One thing that the USDA has failed to do when assuming trend line yield is having an adjustment for acres. The higher the corn acres the more fringe acres thus in this advisor’s opinion the lower the yield should be. The fewer the acres the higher the yield should be, because it would be the better yielding acres still getting planted. It is simple logic that the USDA has always failed to acknowledge at least at the start of a growing season.
Presently we don’t even have a corn crop condition rating. So it is very early to assume any size of a crop.
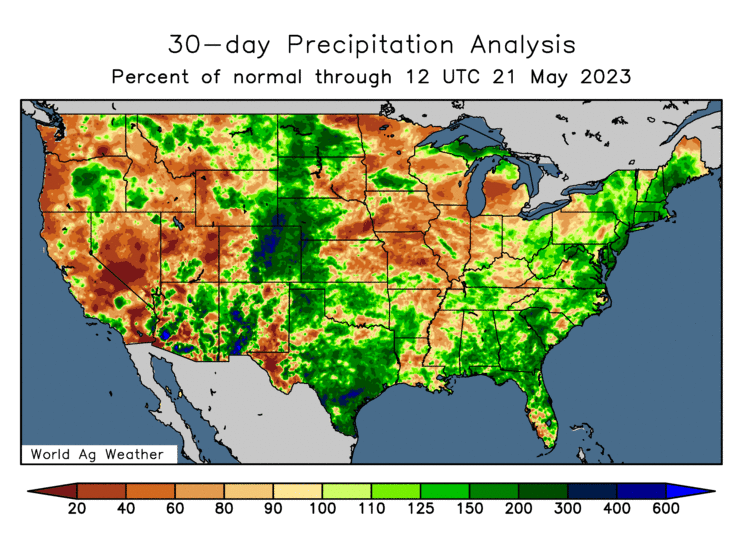
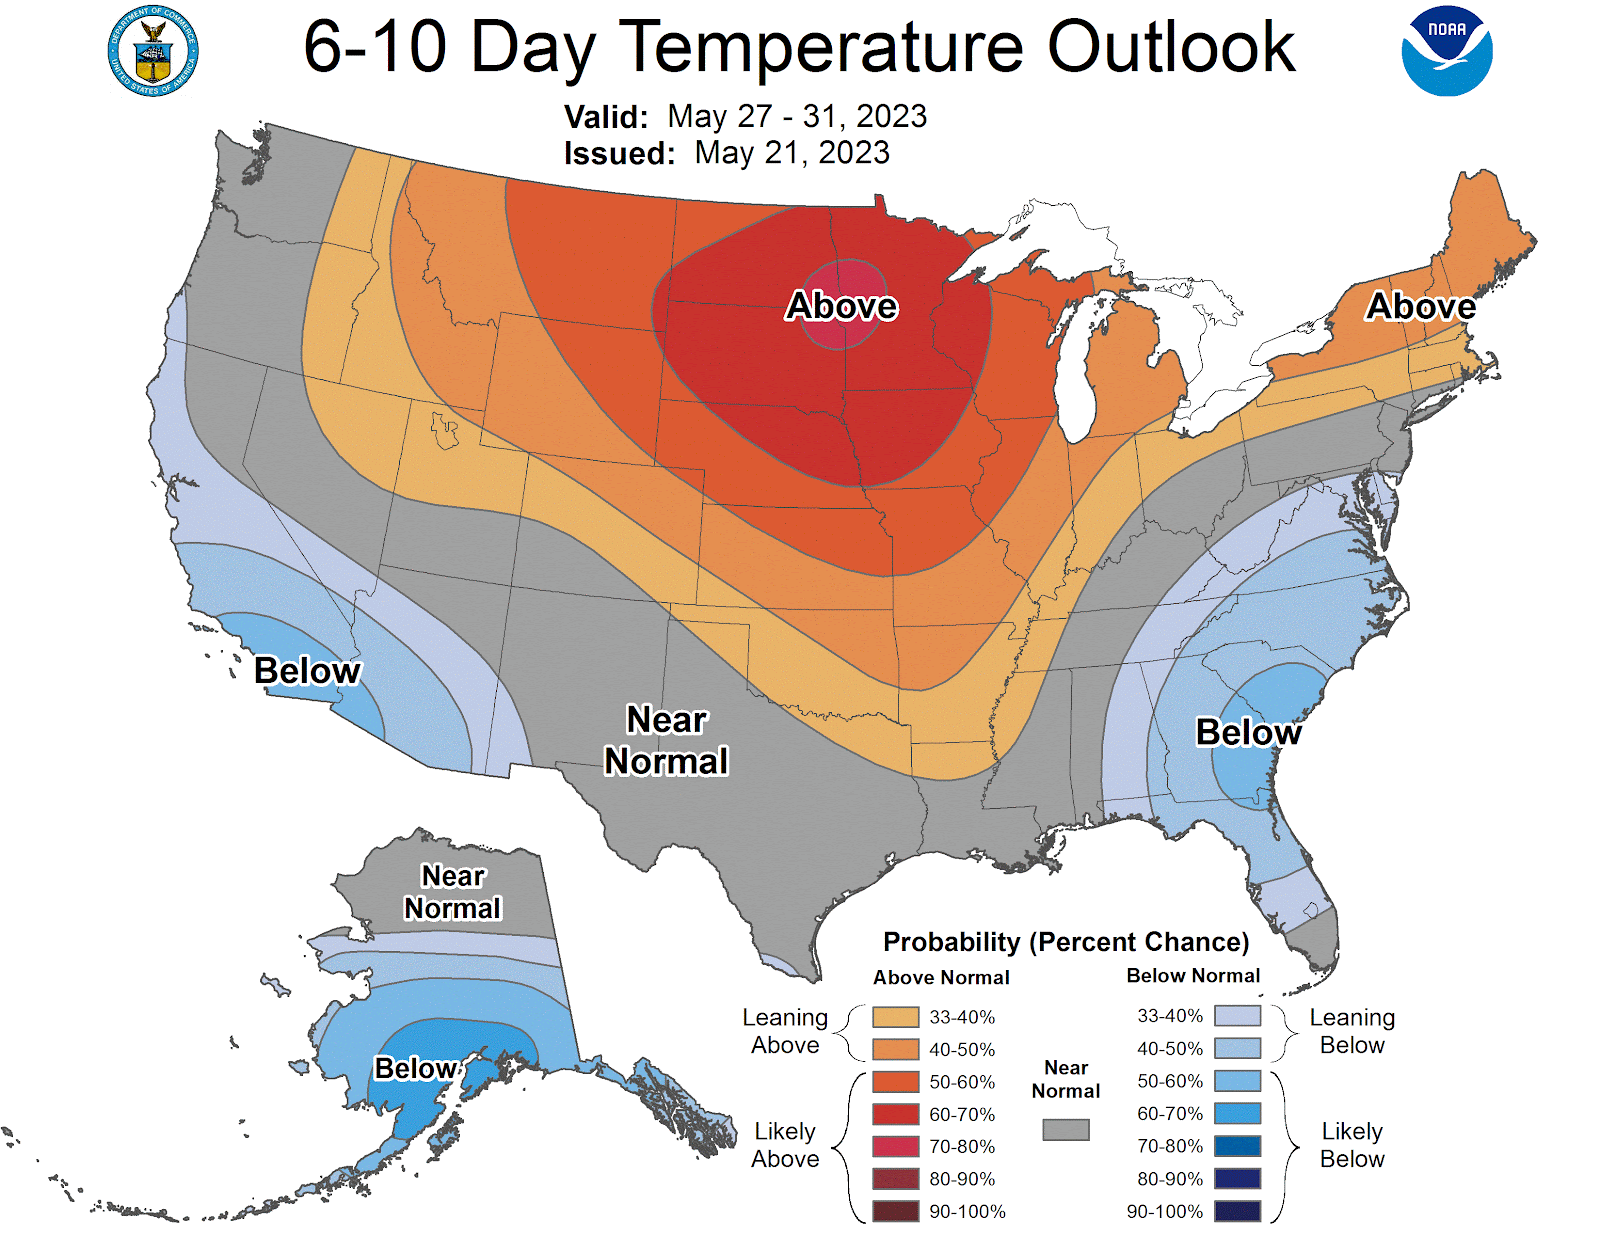
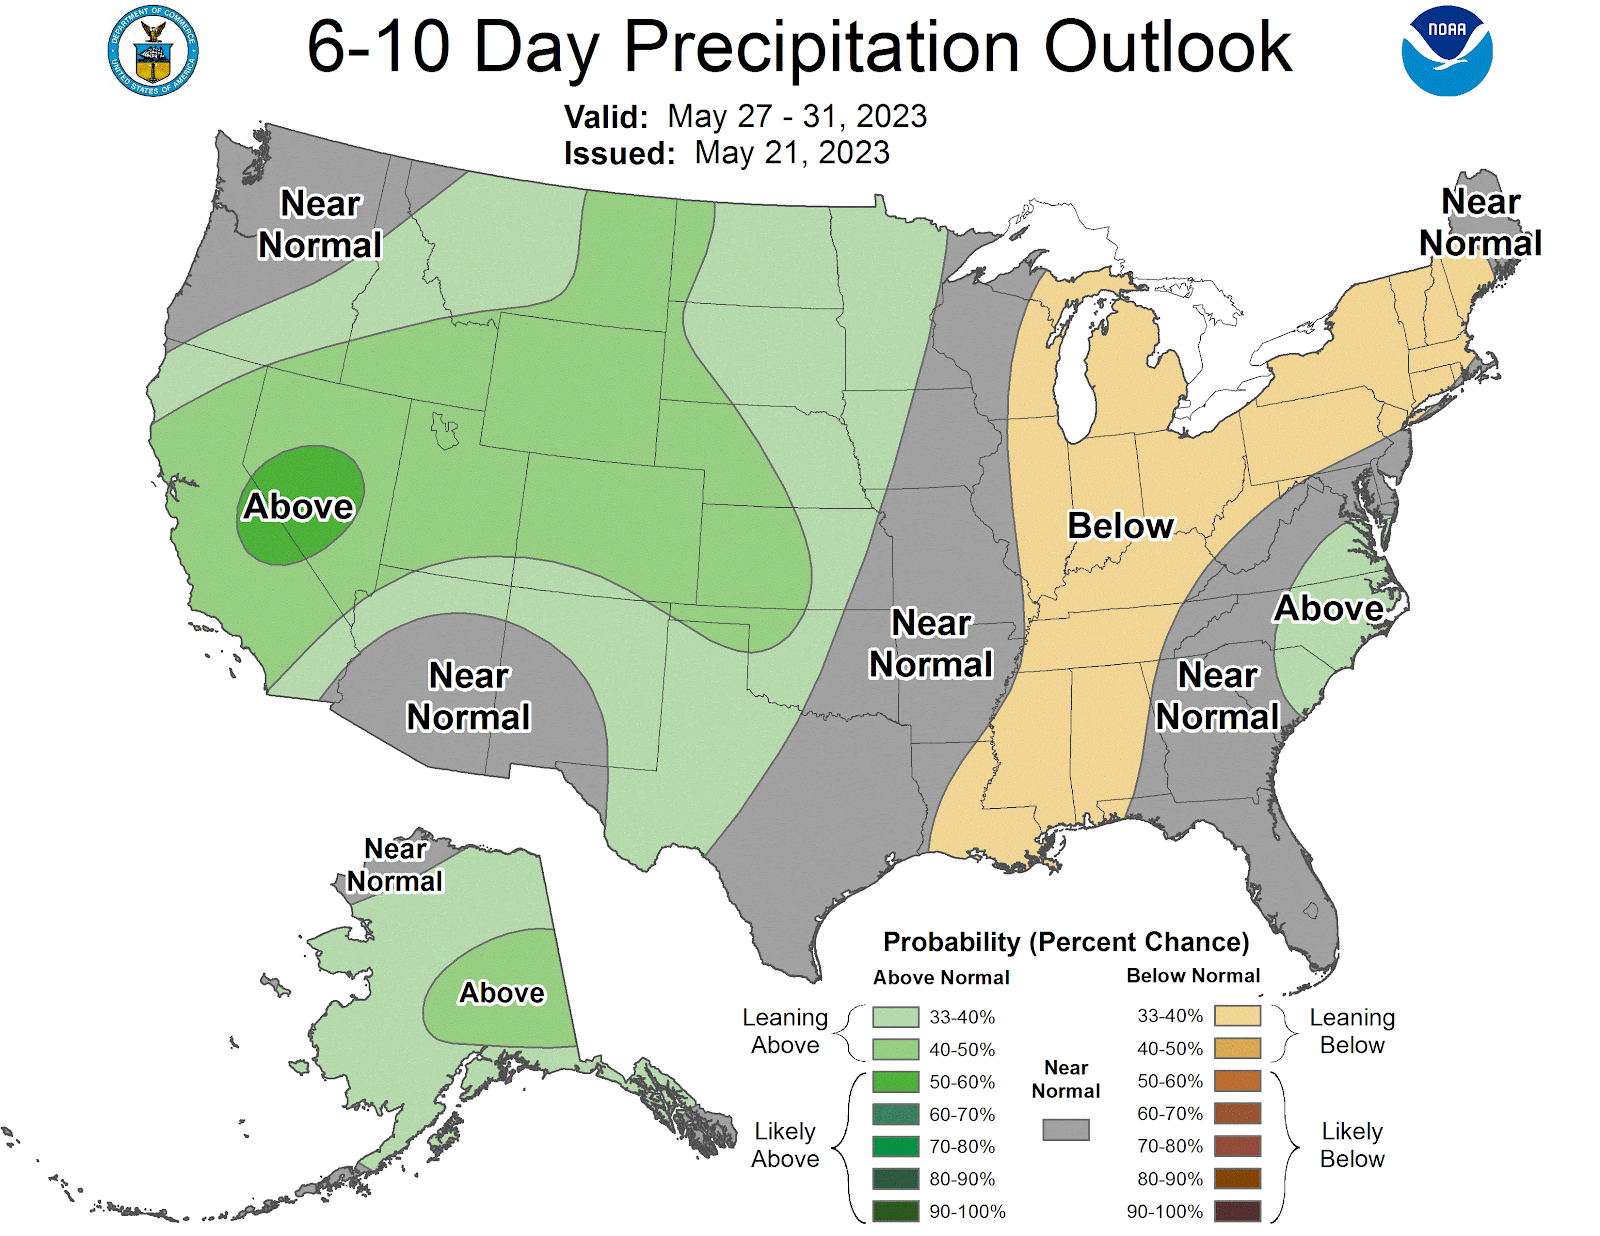
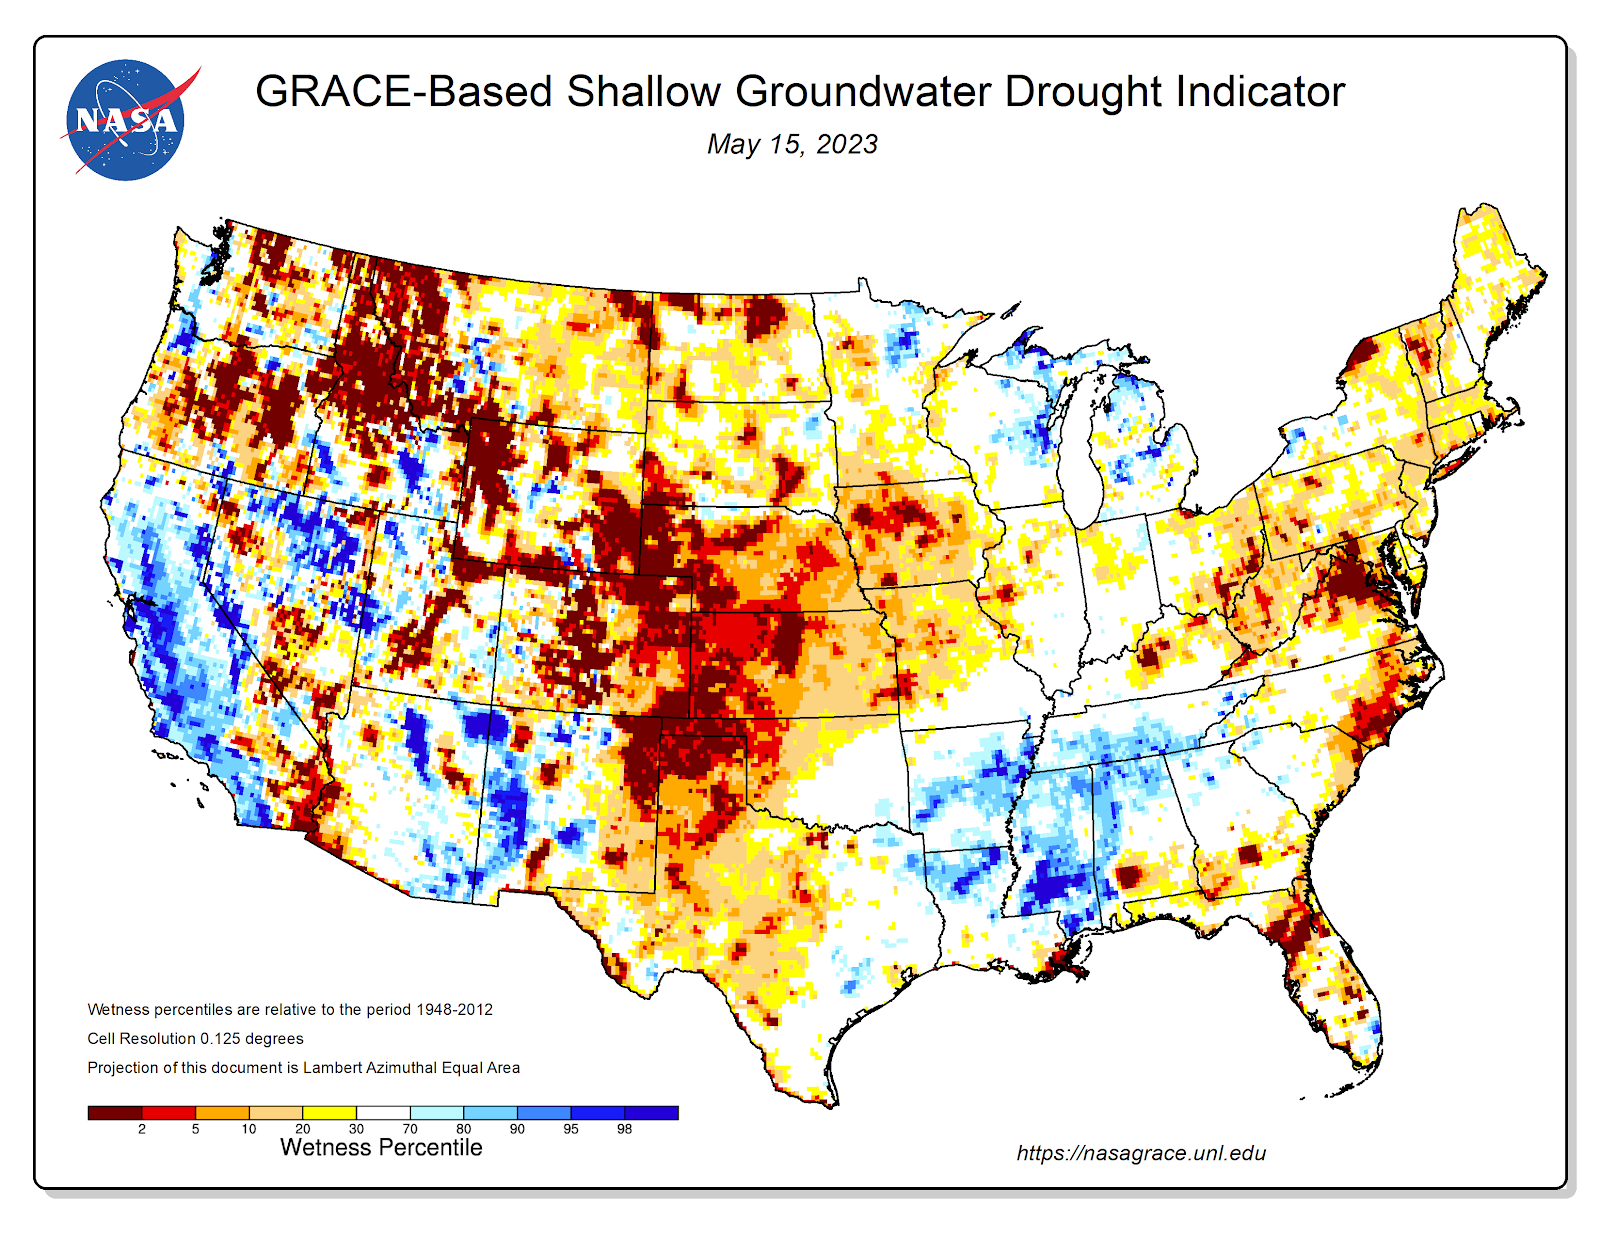
Below are two of the maps that I like to look at when I am trying to decide if I think the crop is getting enough moisture or not.
The first one is what moisture we got in the past 30 days. This helps explain why we have had a fast pace to planting.
Here is a 15 day forecast. Looking at this and the map above make one wonder if we have moved the 2022 drought to the north and east.
Last week’s Kansas Wheat tour showed that the moisture in the wheat growing area was too late. But looking at these two maps one has to wonder if the areas that have been hit with the drought the past couple of years are seeing an improvement. While the heart of the corn belt might be starting to see one develop.
These next two maps go along with the above thinking.
Dry in the I states.
One more map to show the dryness that is developing in some areas of the corn belt. This is 7 the day versus normal, notice Iowa, Illinois, Indiana, and Missouri. 1-2 inches short of normal last week.
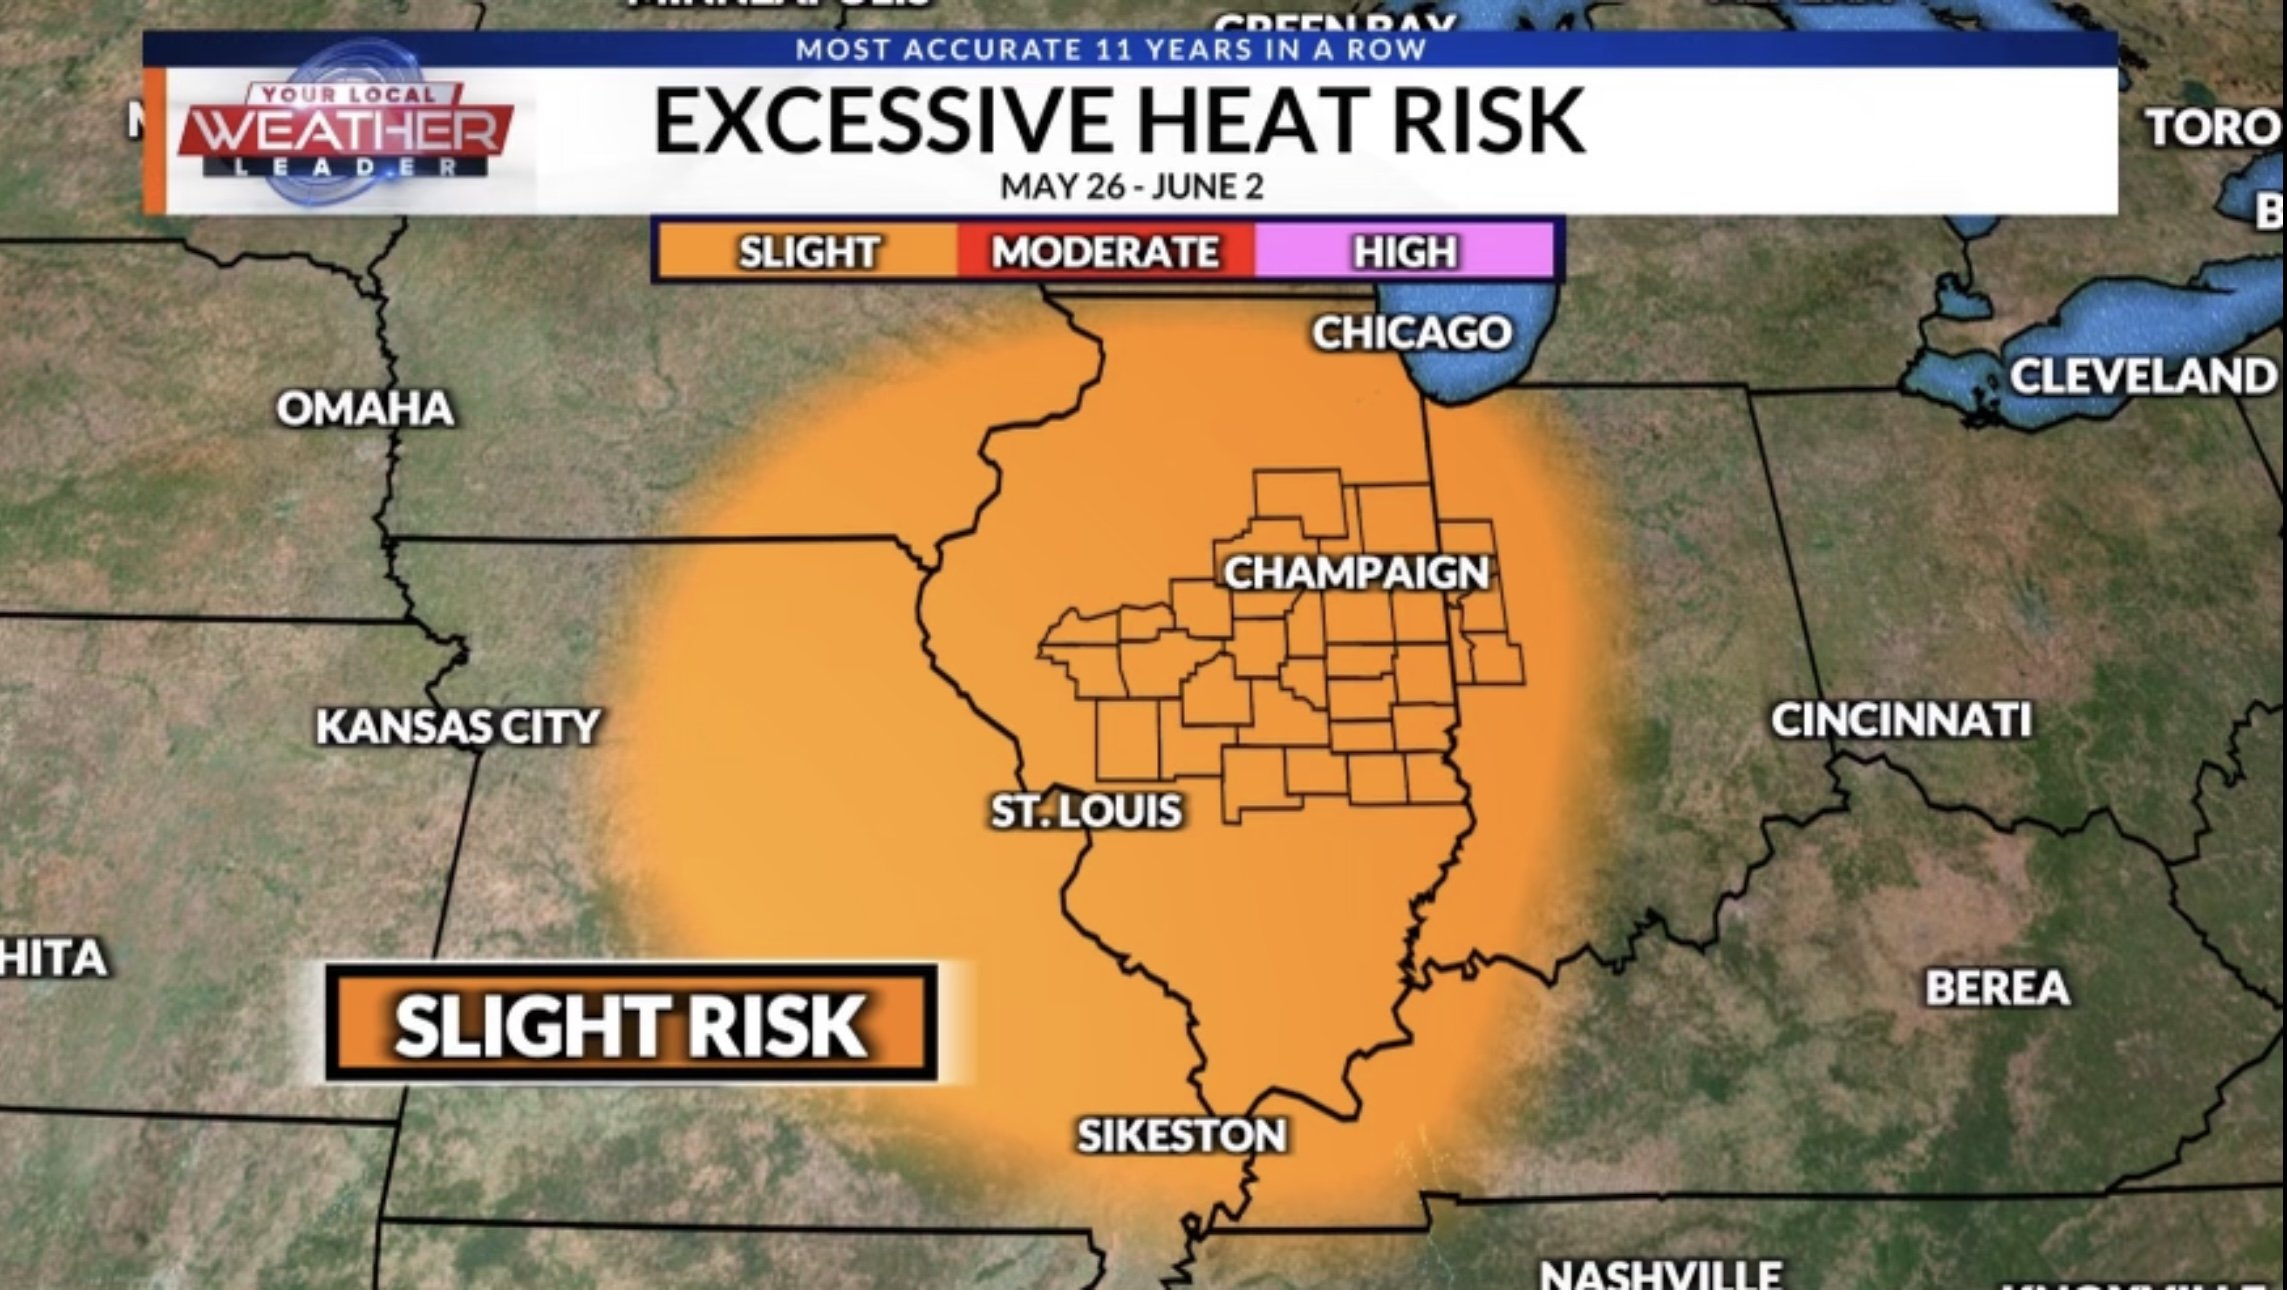
As I was writing this and pulling up various maps, I found a very good article. Talking about a flash drought in central Illinois. Check it out here.
This is something that might get some of the boys' attention in Chicago.
Take a look at some of the below maps and flash drought warning.
More pictures and images than normal, but it is the busy season. So less reading hopefully is a benefit to everyone.
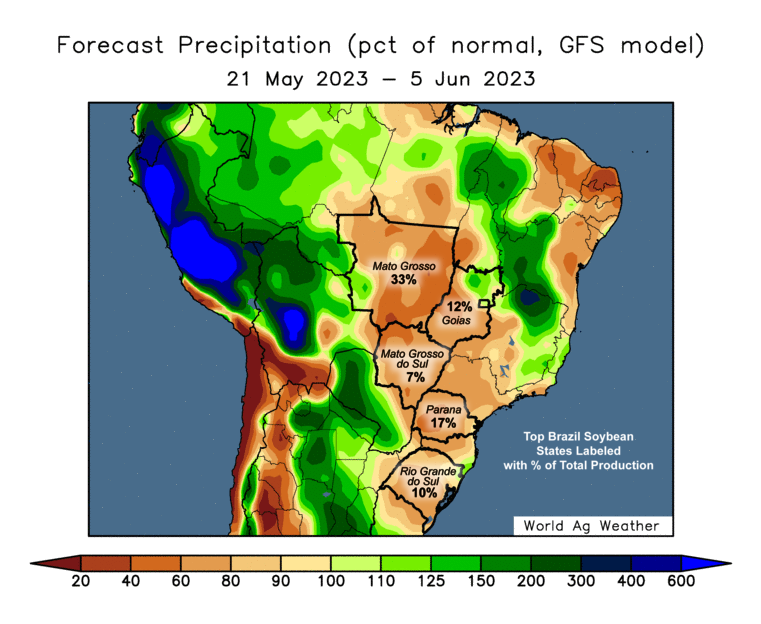
These next two maps are for Brazil, which like the USA is expecting a record corn crop. In fact the USDA increased it about 9 days ago.
I will let you look at the two maps below and make your own assumptions. It can’t be any worse then the garbage assumptions that the USDA makes.
Having written everything I have above and having been bullish for a long time. I realize that I can and will be wrong at times. The timing of when a market decides to move can be very tough. Trying to figure out all of the factors that are priced in versus what isn’t priced in is not easily done.
I have always widely promoted being comfortable. When I look at a market such as December corn, I realize that we probably have 50 cents to a dollar downside. While we probably have 3.00 or so upside. Now an extreme such as 185-190 national yield will probably take us below 4.00 December futures, while a yield of 150 or lower will probably take us above 9.00 futures.
I know that neither of them are very likely, but both are possible. So if you know they are possible, are you comfortable with how much grain you have in the bins? How much have you pre-sold? Do you have too little sold or too much sold?
You have to be comfortable. Whatever it takes, be comfortable.
I have farmers that I work with that can hold grain for years, because they have the staying power and the storage to do so. While I have others that have zero on farm storage and very little staying power. It goes without saying that both of them should have very different marketing plans as both have far different risk/reward profiles and needs.
For those of you that are nervous that we will be repeating 2013 you have a few choices. Such as making more grain sales.
But before you go and presell all the rest of your expected production you really need to ask yourself a few questions. Such as:
Will you be more upset if corn goes to 3.50 and you don’t have any sold? Or if corn goes to 8.50 and you sold it all at 5.00?
If you pre sell corn at 5.00 and you get hit by “Mother Nature” as does the corn belt and we go up to 8.50 and you are short production. What will you do?
Will you use crop insurance payments to buy out of your sales?
At what point will you try to cover your sales? Will it be at the top of the market?
When I look at some of the above maps, along with my memory of how 2011-2012 happened. I would much rather see those that are not comfortable buying puts rather than make sales. Because of my bias that I think we will be repeating the 2012 price action.
The recommendation for buying puts would only be for those that are scared that we are going down and those that believe we will be raising trend line yields or better.
Those that are comfortable, then being patient is still the recommendation. Those that are nervously comfortable may want to be ready to buy some puts or make some sales should we get some rally that ends up being a selling opportunity. The market should give us some clues when we rally if it will materialize to something more or being a selling opportunity.
But it might not be clear so one really will want to be ready to re-adjust and get themselves comfortable. So if you don’t have a hedge account and you want to open one here is a link to open one.
https://www.dormanaccounts.com/eApp/user/register?brokerid=332
If you have questions or need help give me a call at 605-295-3100 or give Wade a call at 605-870-0091.
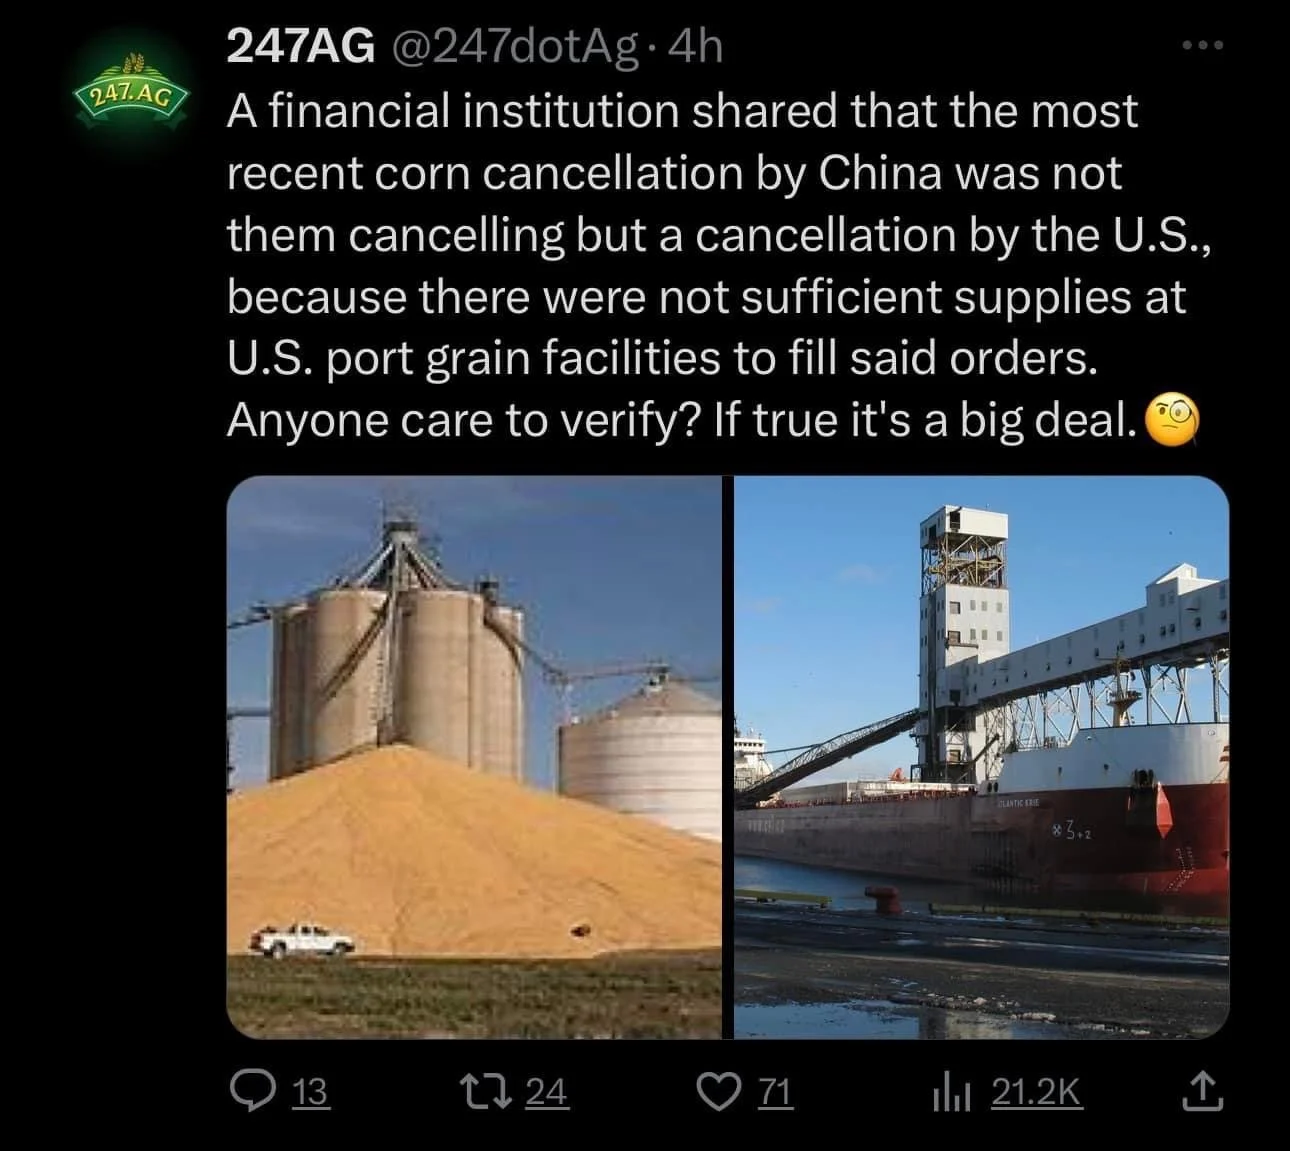
When one looks at the Brazil weather maps above and then looks at the below from twitter one does have to wonder if the old crop corn game is actually over.
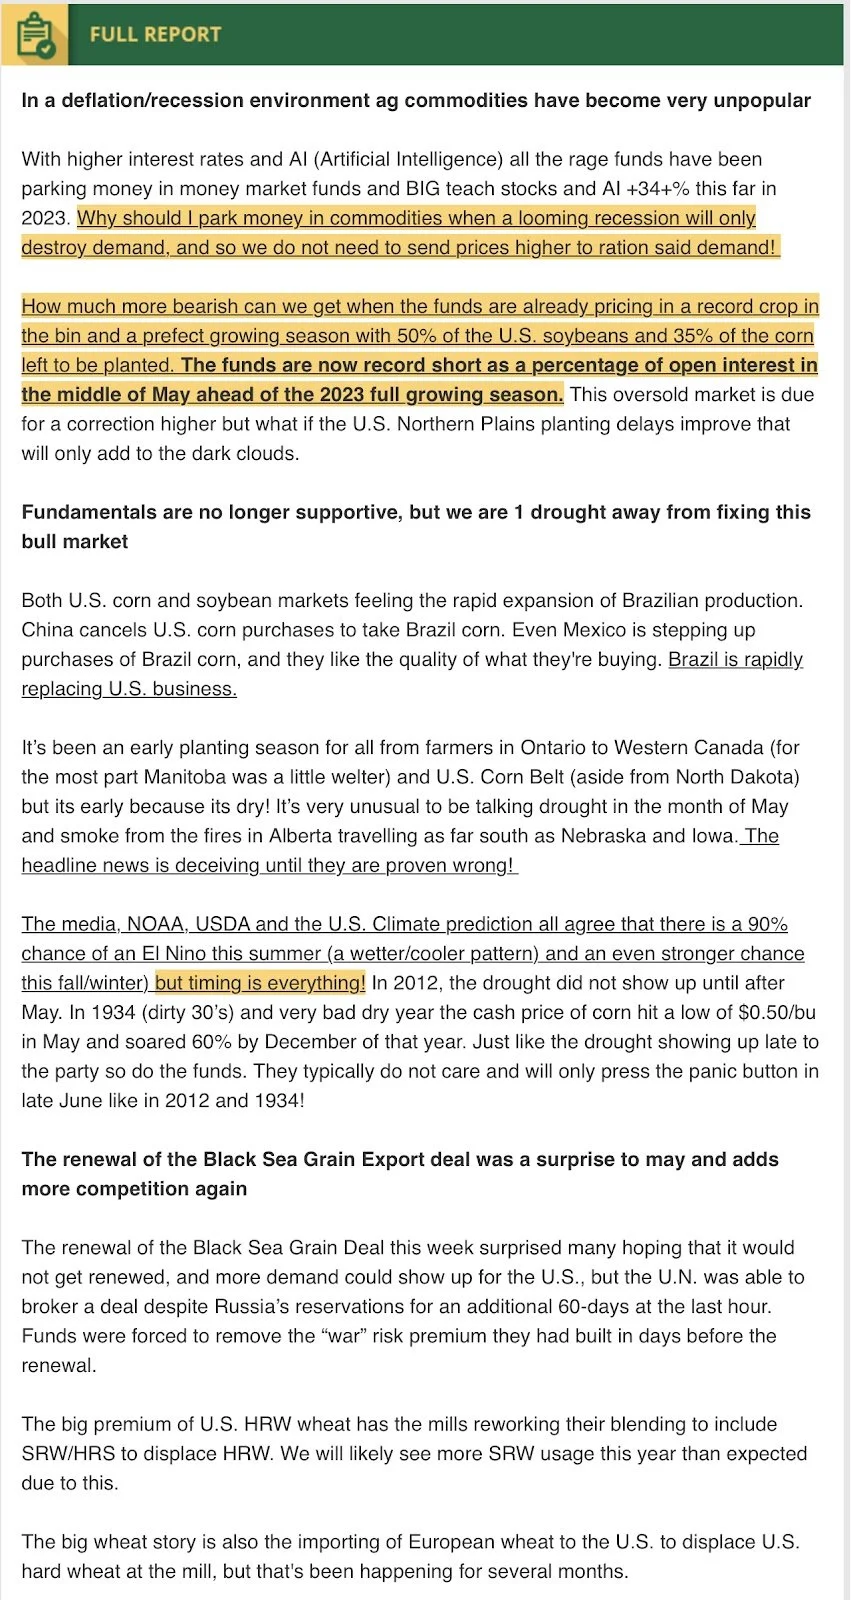
I guess time will tell, but so far I haven't seen many if any places where the basis is under pressure. It should be under pressure when China is canceling purchases. So the longer basis stays firm and in the more areas it stays firm. The higher the chance that China comes back to the US, especially if the Brazil record crop ends up getting smaller or feeling some of the stress that Mother Nature has dealt out lately.
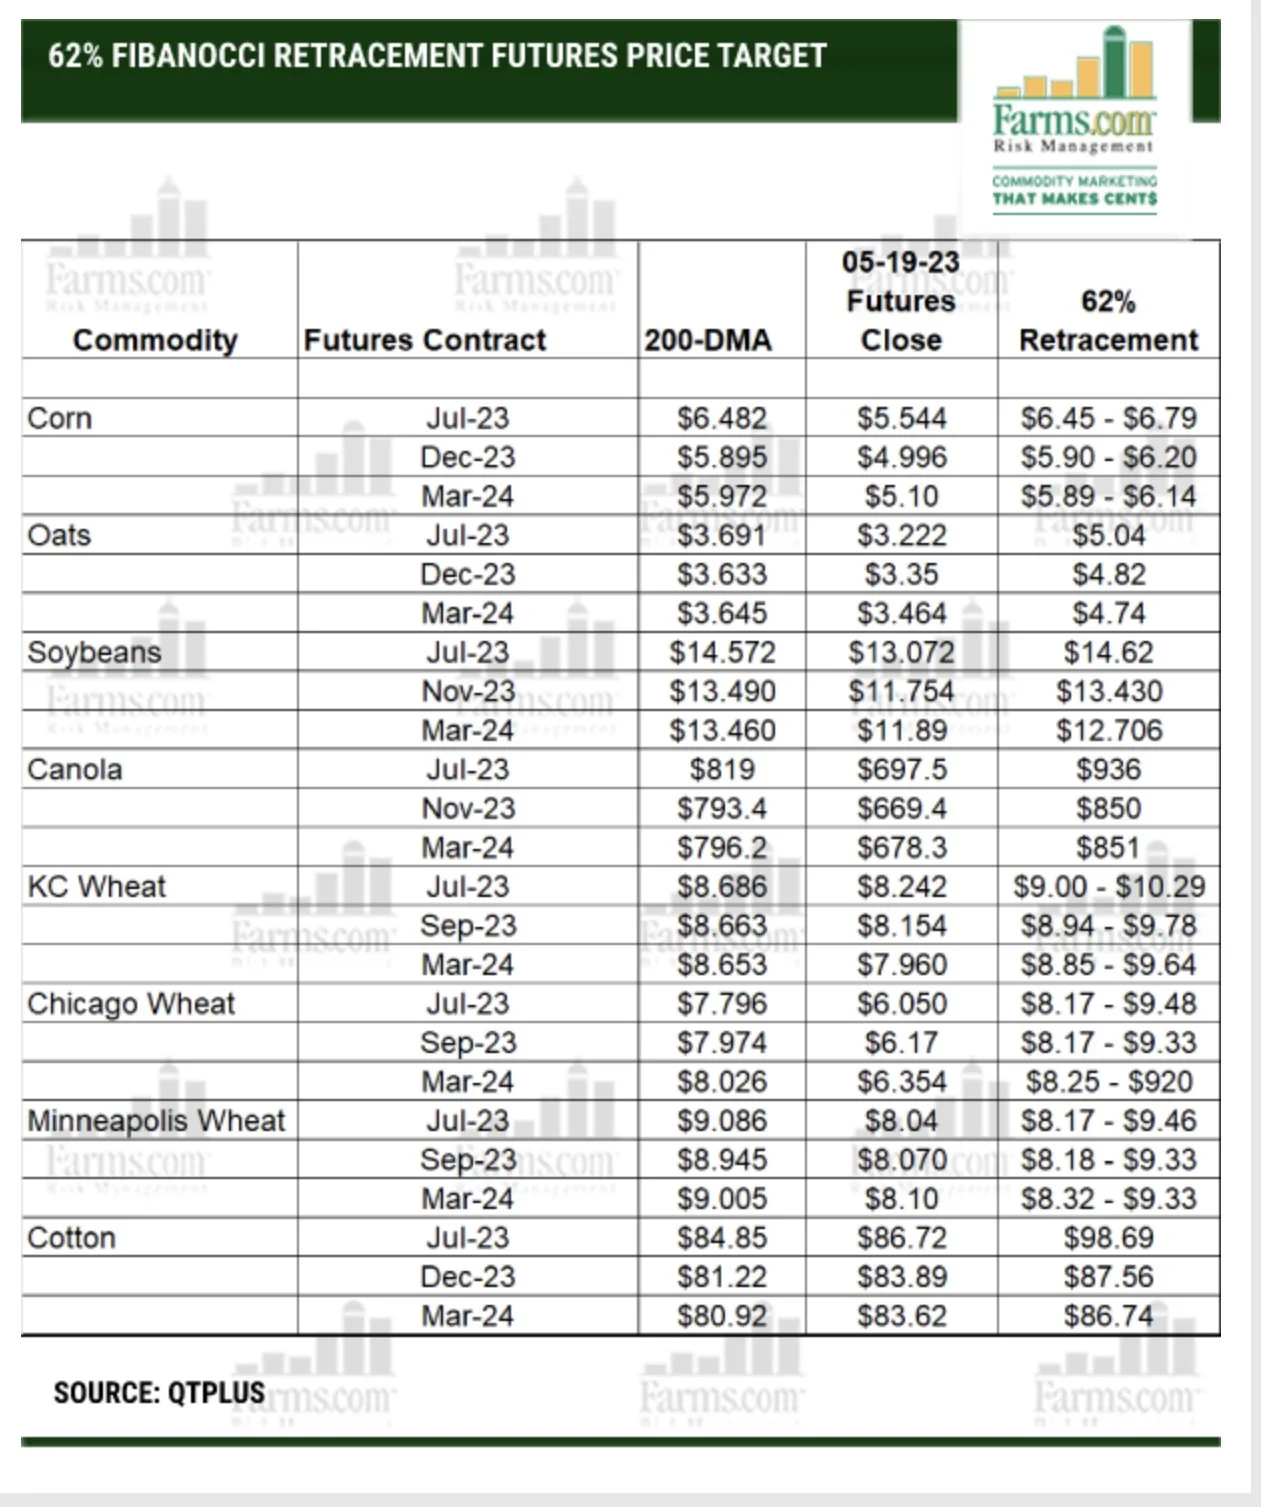
Below are several screenshots from Farms.com Risk Management. They have some great information and give some good targets should we get one of those mini bounces.
Bottom line is one needs to be comfortable. If you need help with your risk management or have questions specific to you and your operation give me a call at 605-295-3100 or Wade at 605-870-0091.
Also we do have buyers looking for some new crop millet acres. They are offering an Act of God clause, so give either me or Wade a call for more information on these contracts.
Past Updates
5/19/23 - Market Update
Grains Fail to Gain Momentum
5/18/23 - Market Update
KC Joines Sell Off
5/17/23 - Audio
Black Sea Pressure & Games From China
5/16/23 - Market Update
Beans Collapse
5/15/23 - Audio
If You're Short Wheat, Be Ready to Sleep On Street
5/14/23 - Weekly Grain Newsletter

